Embed Size (px)
Citation preview

CV Risk Reduction, Diabetes Prevention, and TZDs

UKPDS 34: Intensive glucose control andCV protectionn = 1704 overweight, with diabetes; n = 342 metformin group
UKPDS Group. Lancet. 1998;352:854-65.
Favors metforminor intensive
Favors usual care
All-cause mortalityMetforminIntensive
Myocardial infarctionMetforminIntensive
StrokeMetforminIntensive
0.02
0.12
0.08
Aggregate endpoints P*
0 1 2
*Metformin vs other intensive therapy (sulfonylurea or insulin)
Relative risk(95% CI)
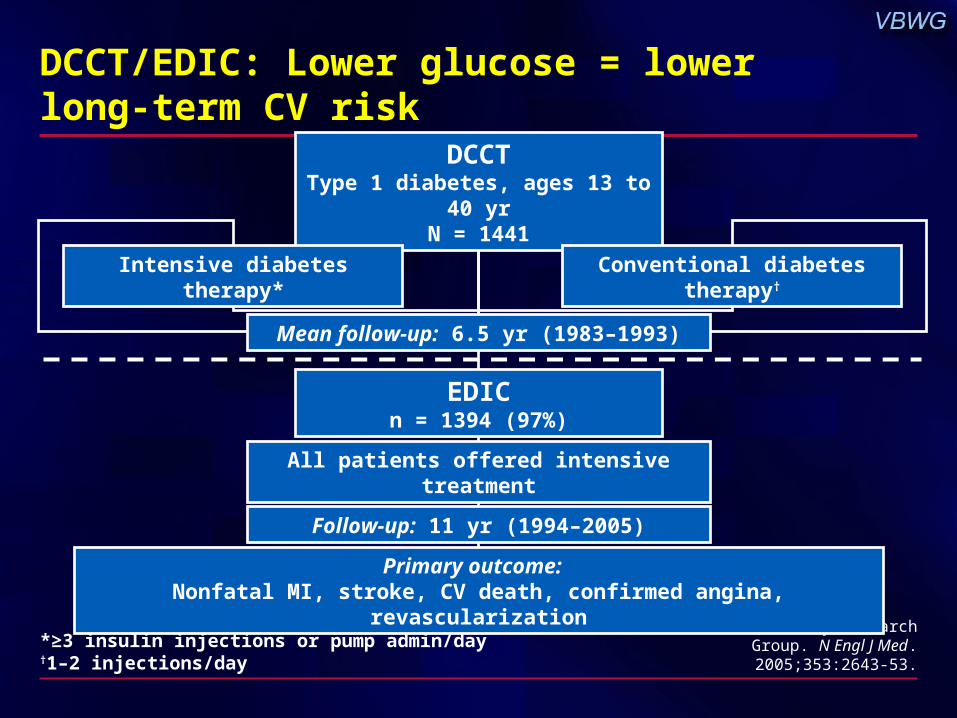
DCCT/EDIC: Lower glucose = lower long-term CV risk
DCCT/EDIC Study Research Group. N Engl J Med. 2005;353:2643-53.
Primary outcome: Nonfatal MI, stroke, CV death, confirmed angina, revascularization
Mean follow-up: 6.5 yr (1983–1993)
DCCTType 1 diabetes, ages 13 to 40 yr
N = 1441
EDICn = 1394 (97%)
Follow-up: 11 yr (1994–2005)
Intensive diabetes therapy* Conventional diabetes therapy†
All patients offered intensive treatment
*≥3 insulin injections or pump admin/day†1–2 injections/day

DCCT/EDIC Study Research Group.N Engl J Med. 2005;353:2643-53.
DCCT/EDIC: Intensive glucose control reduces long-term CV risk
42%(95% CI 9%–63%)
P = 0.02
57%(95% CI 12%–79%)
P = 0.02
Cumulative incidence
of any first CV event
CumulativeCV death,
nonfatal MI,stroke
Time (years) Time (years)
Conventional52 events
Intensive31 events
Conventional25 events
Intensive11 events
0
0.12
0.08
0.10
0.06
0.04
0.02
0 5 10 15 20
0
0.12
0.08
0.10
0.06
0.04
0.02
0 5 10 15 20
N = 1441 with type 1 diabetes

DCCT/EDIC: Intensive treatment slows renal changes
DCCT/EDIC Study Research Group.N Engl J Med. 2005;353:2643-53.
Microalbuminuria: albumin excretion rate ≥40 mg/24 hrAlbuminuria: albumin excretion rate ≥300 mg/24 hr*P < 0.01, †P < 0.05 vs intensive treatment
Intensive Conventional
9
2
0
5
10
15
20
Microalbuminuria Albuminuria
Patients (%)
Microal-buminuria
Albumin-uria
6*
17*
57
End
EDIC year 11DCCT
5
13*
Baseline
0 1
End
0
3
†
Baseline
N = 1441 with type 1 diabetes

Vascular effects of thiazolidinediones (TZDs)
Examining the clinical impact of TZDs

TZDs impact carotid IMT
Study (year) TreatmentPatients
(Duration) IMT (mm)
Minamikawa(1998)
TRO 400 mgUsual care
DM2 (6 mo)
0.08, TRO0.03, Usual careP < 0.001
Koshiyama(2001)
PIO 30 mgUsual care
DM2(6 mo)
0.08, PIO0.02, Usual careP < 0.001
Sidhu(2004)
ROSI 8 mgPlacebo
Stable CAD(48 wk)
0.01, ROSI0.03, PlaceboP = 0.03
Langenfeld(2005)
PIO 45 mgGLIM 2.7 mg (mean)
DM2(6 mo)
0.05, PIO0.01, GLIMP < 0.005
Minamikawa J et al. J Clin Endocrinol Metab 1998.Koshiyama H et al. J Clin Endocrinol Metab 2001.
Sidhu JS et al. Arterioscler Thromb Vasc Biol 2004.Langenfeld MR et al. Circulation 2005.
TRO = troglitazonePIO = pioglitazoneROSI = rosiglitazoneGLIM = glimepiride

TZD impact on restenosis in type 2 diabetes
38.240.4
17.6
23.0
0
10
20
30
40
50
Choi D et al. Diabetes Care. 2004;27:2654-60.
*8 mg before catheterization, 4 mg/d thereafter, combined with conventional antidiabetic therapy
Change at 6 months
(%)
P = 0.03 P = 0.004
Restenosis rate at ≥50% stenosis
Stent diameter reduction
ROSI* (n = 38 w/51 lesions)Control (n = 45 w/55 lesions)
N = 95 with DM2 and CAD
Neointimalarea
Neointimalarea
Neointimalarea
Restenosis
-60
-50
-40
-30
-20
-10
0
TRO* TRO PIO ROSI
Reductionover
6 mo (%)
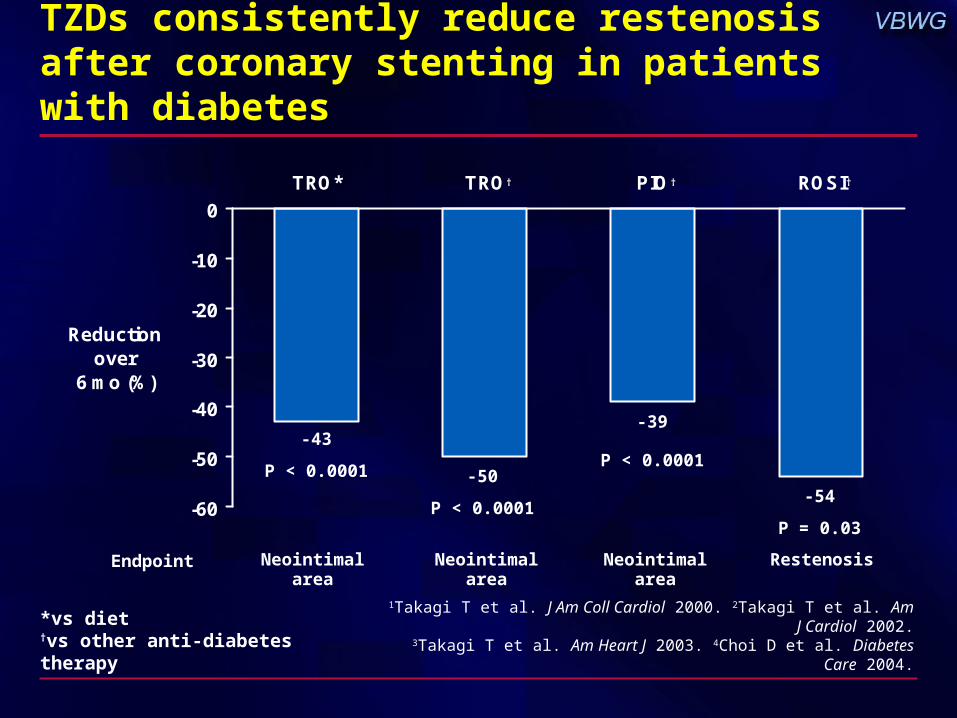
TZDs consistently reduce restenosis after coronary stenting in patients with diabetes
Endpoint
1Takagi T et al. J Am Coll Cardiol 2000. 2Takagi T et al. Am J Cardiol 2002.
3Takagi T et al. Am Heart J 2003. 4Choi D et al. Diabetes Care 2004.
*vs diet†vs other anti-diabetes therapy
†††
P < 0.0001
P < 0.0001
P < 0.0001
P = 0.03
-43
-50
-39
-54

Surrogate outcome results driving major TZD trials
TZDs are associated with reductions in atherosclerotic progression and restenosis
TZDs reduce inflammatory markers (CRP, TNF) independent of glycemic control
Reducing CV risk factors with TZDs may also reduceCV morbidity and mortality
Dormandy JA et al. Lancet. 2005;366:1279-89.

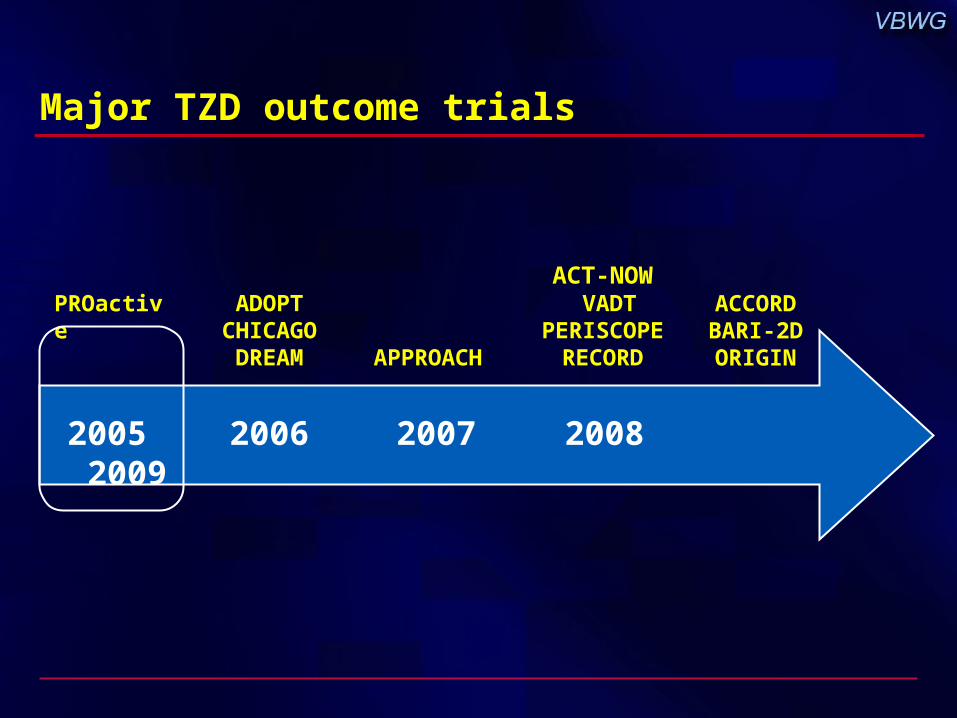
Major TZD outcome trials
2005 2006 2007 2008 2009
PROactiveADOPT
CHICAGO DREAM APPROACH
ACCORDBARI-2DORIGIN
ACT-NOW VADT
PERISCOPERECORD
Major TZD outcome trials
2005 2006 2007 2008 2009
PROactiveADOPT
CHICAGO DREAM APPROACH
ACCORDBARI-2DORIGIN
ACT-NOW VADT
PERISCOPERECORD

Dormandy JA et al. Lancet. 2005;366:1279-89.
PROactive: Study design
Pioglitazone 15 mg qdtitrated to 45 mg qd
Randomized, double-blind controlled trial N = 5238 with type 2 diabetes and macrovascular disease
Primary outcome: Composite of all-cause mortality, MI (including silent MI), ACS, stroke, revascularization, leg amputation
Secondary outcome: All-cause mortality,MI (excluding silent MI), stroke
PROspective pioglitAzone Clinical Trial In macroVascular Events
Mean follow-up: 34.5 months
Placebo

PROactive: CV history at baseline
Dormandy JA et al. Lancet. 2005;366:1279-89.
Pioglitazonen = 2605
Placebon = 2633
MI 47 46
Stroke 19 19
PCI or CABG 31 31
Acute coronary syndromes 14 14
Coronary artery disease 48 48
Peripheral arterial disease 19 20
History of hypertension 75 76
≥2 macrovascular disease criteria 47 49
%
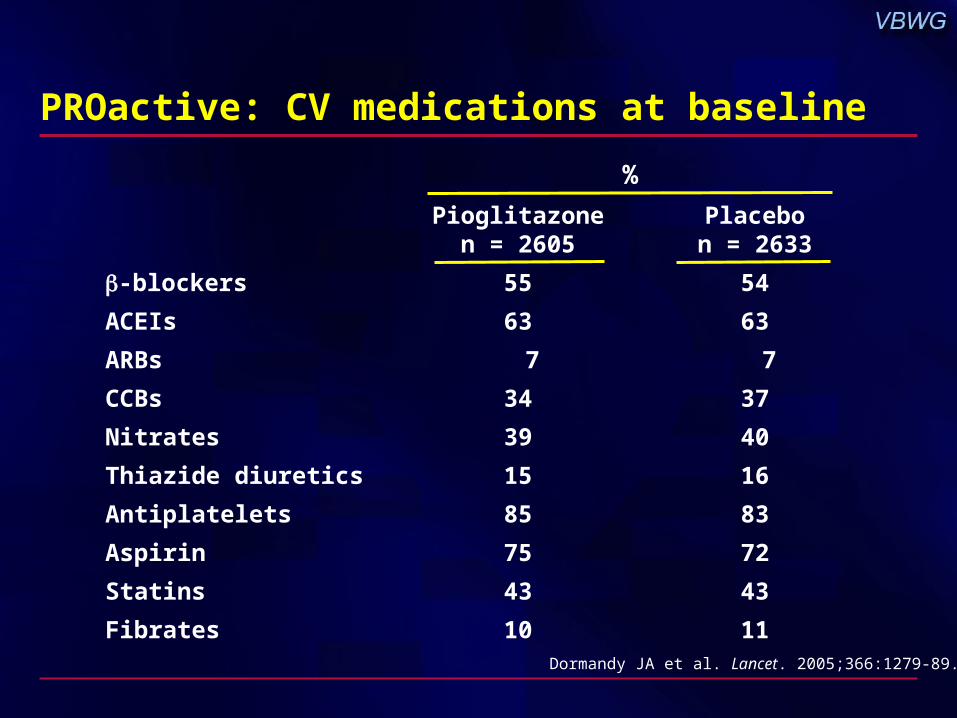
PROactive: CV medications at baseline
Dormandy JA et al. Lancet. 2005;366:1279-89.
Pioglitazonen = 2605
Placebon = 2633
-blockers 55 54
ACEIs 63 63
ARBs 7 7
CCBs 34 37
Nitrates 39 40
Thiazide diuretics 15 16
Antiplatelets 85 83
Aspirin 75 72
Statins 43 43
Fibrates 10 11
%

PROactive: Nonsignificant reduction in primary outcome
Dormandy JA et al. Lancet. 2005;366:1279-89.
Events(%)
All-cause mortality, nonfatal MI,* ACS, stroke, coronary or peripheral revascularization, leg amputation
*Including silent MI
Time from randomization (months)
5
10
15
25
06
20
0 12 18 24 30 36
Pioglitazone514 events
Placebo572 events
10% RRRHR 0.90 (0.80–1.02)
P = 0.095

PROactive: Significant reduction in secondary outcome
Dormandy JA et al. Lancet. 2005;366:1279-89.
Events(%)
*Excluding silent MI
0
60 12 18 24 30 36
Time from randomization (months)
16% RRRHR 0.84 (0.72–0.98)
P = 0.027
5
10
15
25
20
Pioglitazone301 events
Placebo358 events
All-cause mortality, nonfatal MI*, stroke

PROactive: Subgroup analysis–Previous MI
• Pioglitazone reduced risk of CV events, including: Fatal/nonfatal MI* by 28% (P = 0.045)ACS by 37% (P = 0.035)
• Over 3 years, pioglitazone added to medication in 1000 patients could prevent:
22 recurrent MIs23 ACS events
• Future studies are needed to further elucidate the underlying mechanism(s) of these clinical results
Adapted from Erdmann E. AHA 2005. www.PROactive-results.com.*Excluding silent MI
n = 2445 with previous MI (≥6 mo)

PROactive: HF hospitalization and mortality
Pioglitazonen (%)
Placebon (%) P
HF leading to hospital admission*
Fatal HF
149 (5.7)
25 (0.96)
108 (4.1)
22 (0.84)
0.007
NS
Dormandy JA et al. Lancet. 2005;366:1279-89.*Non-adjudicated
N = 5238

25
20
15
10
5
0
0 1 2 3 4 5
0 1 2 3 4 50
10
20
30
40
PROactive vs landmark clinical trials: Comparative benefit in patients with diabetes
*Nonfatal
CHD death,
MI*, revasc
(%)
Years
Pravastatin
PlaceboCARE
Circulation. 1998;98.
25% RRRP = 0.05
www.proactive-results.com.Lancet. 2000;355.
Lancet. 2003;361.
MI, stroke, CV death
(%)
Vascular events
(%)
Cardiac death,
MI*,coronary revasc,
ACS(%)
Years0 1 2 3
Years
0 1 2 3 4 5 6Years
Ramipril
Placebo
0
30
20
10 Simvastatin
Placebo
0
5
10
20
Pioglitazone
Placebo
HPS
MICRO-HOPE PROactive
22% RRR P < 0.0001
19% RRRP = 0.034
25% RRRP = 0.0004 15
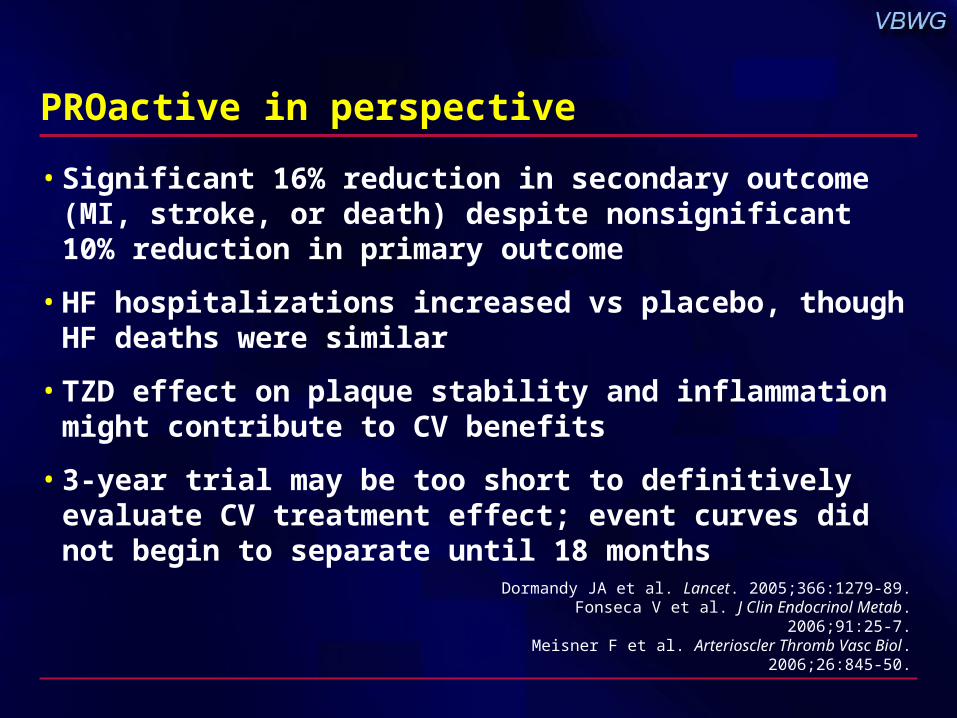
PROactive in perspective
• Significant 16% reduction in secondary outcome(MI, stroke, or death) despite nonsignificant 10% reduction in primary outcome
• HF hospitalizations increased vs placebo, though HF deaths were similar
• TZD effect on plaque stability and inflammation might contribute to CV benefits
• 3-year trial may be too short to definitively evaluate CV treatment effect; event curves did not begin to separate until 18 months
Dormandy JA et al. Lancet. 2005;366:1279-89.Fonseca V et al. J Clin Endocrinol Metab. 2006;91:25-7.
Meisner F et al. Arterioscler Thromb Vasc Biol. 2006;26:845-50.
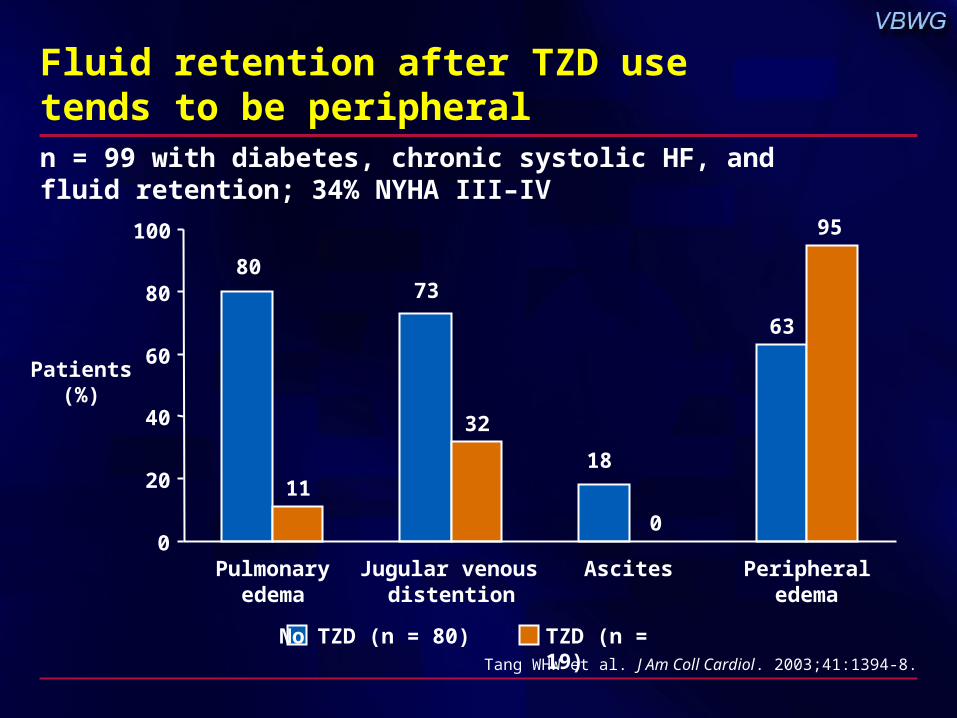
Fluid retention after TZD use tends to be peripheraln = 99 with diabetes, chronic systolic HF, and fluid retention; 34% NYHA III–IV
Tang WHW et al. J Am Coll Cardiol. 2003;41:1394-8.
Patients(%)
No TZD (n = 80) TZD (n = 19)
63
11
32
0
18
7380
95
0
20
40
60
80
100
Pulmonaryedema
Jugular venousdistention
Ascites Peripheraledema

Managing TZD-related fluid retentionn = 260 with type 2 diabetes
-0.89
-0.70
-0.02
0.24
-0.12
Karalliedde J et al. Diabetes. 2005;54(suppl 1):A20-1.
ROSI ROSI +furosemide
40 mg/d
ROSI + HCTZ
25 mg/d
ROSI +spironolactone
50 mg/d
Placebo(ROSI
discontinued)
Hct = hematocritROSI = rosiglitazone 4 mg bid
0.50
0.25
0
-0.25
-0.50
-0.75
-1.00
Change in Hct
(%)

Collecting duct (CD) PPAR: Potential mechanism for volume expansion
0
20
40
60
80
100
Control CD PPAR KO
32.2%
15.5%
Zhang H et al. Proc Nat Acad Sci. USA. 2005;102:9406-11.
CD-specific PPAR knockout (KO) mouse model vs control
P < 0.001
P = NS
Vehicle Rosiglitazone 320 mg/kg diet
Plasma volume (µL/g body wt)
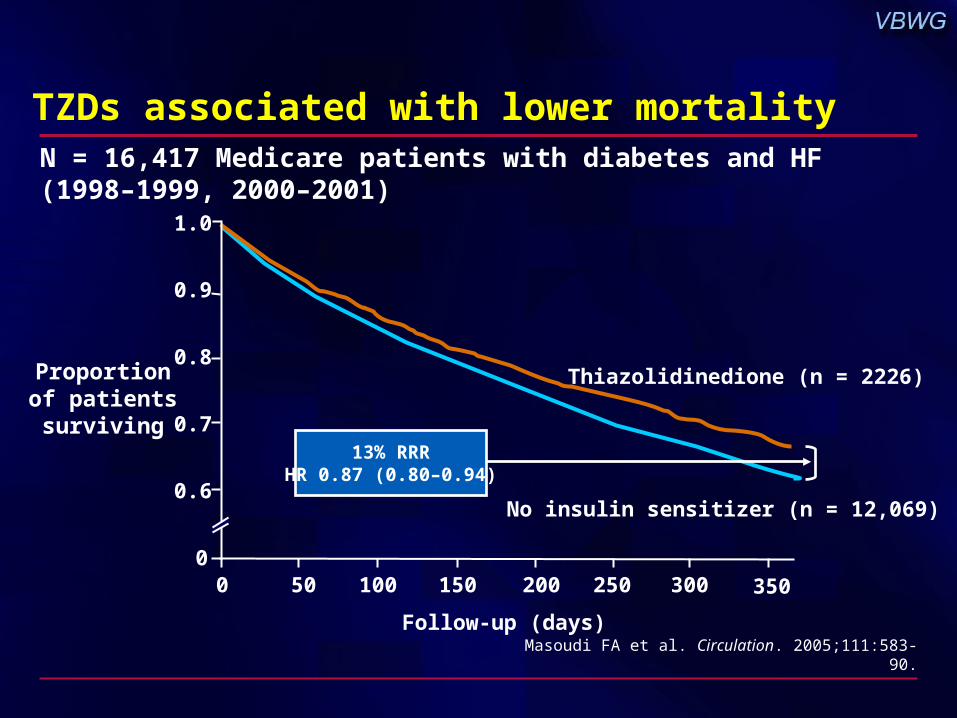
TZDs associated with lower mortality
Masoudi FA et al. Circulation. 2005;111:583-90.
Follow-up (days)
Proportionof patientssurviving
N = 16,417 Medicare patients with diabetes and HF (1998–1999, 2000–2001)
0.6
0.7
0.8
1.0
050 100 300150 200 250
0.9
0 350
13% RRRHR 0.87 (0.80–0.94)
No insulin sensitizer (n = 12,069)
Thiazolidinedione (n = 2226)

TZDs in type 2 diabetes and HF
Class I–II
• Use cautiously
• Initiate treatment at lowest dose
• Escalate dose gradually
• Allow more time than usual to achieve A1C target
Class III–IV
• TZDs should not be used at this time
Nesto RW et al. Circulation. 2003;108:2941-8.
AHA/ADA consensus statement, NYHA HF classification

Major TZD outcome trials
2005 2006 2007 2008 2009
PROactiveADOPT
CHICAGO DREAM APPROACH
ACCORDBARI-2DORIGIN
ACT-NOW VADT
PERISCOPERECORD

DREAM: Background and study objective
• Previous studies have shown evidence for new-onset diabetes with RAAS and PPAR agonists
• Does treatment with ramipril and/or rosiglitazone prevent or delay the development of diabetes in persons with IGT or IFG and no diabetes?
DREAM Trial Investigators. Diabetologia. 2004;47:1519-27.
Diabetes REduction Assessment with ramipril and rosiglitazone Medication

Reduction in new diabetes
(%)
Adapted from Pepine CJ, Cooper-Dehoff RM. J Am Coll Cardiol 2004.Julius S et al. Lancet 2004.
PEACE Trial Investigators. N Engl J Med 2004.
RAAS modulation reduces new-onset diabetesTreatment with ACE inhibitors or ARBs
SCOPE
CHARM
ANBP2
LIFE
HOPE
ALLHAT
CAPPP
STOP-2
VALUE
PEACE
-40
-30
-20
-10
0

TRIPOD: Treating insulin resistance reduces incidence of type 2 diabetesTRoglitazone In Prevention Of Diabetesn = 236 Hispanic women with gestational diabetes
60
40
20
0
New-onset diabetes
(%)
Follow-up (months)
0 12 24 36 48 60
Buchanan TA et al. Diabetes. 2002;51:2796-803.
Placebo
Troglitazone 400 mg
12.1%
5.4%
Annual incidence
55% RRRHR 0.45 (0.25–0.83)*
P = 0.009
*Unadjusted

0
TZDs blunt diabetes progression
DPP Research Group.Diabetes. 2005;54:1150-6.*Withdrawn from study after 1.5 yr
Diabetes Prevention Program
10
15
5
1.5
Cumulativeincidence
of diabetes(%)
Years
1.00.50
Placebo
Metformin850 mg bid
Lifestyle
Troglitazone400 mg/d*
23773915682343n =
75% vs placeboP < 0.001

Primary outcome:Diabetes or death from any cause
DREAM Trial Investigators. Diabetologia. 2004;47:1519-27.
DREAM: Study design
Secondary outcomes I: CV eventsCombined MI, stroke, CV death, revascularization, HF, angina,
ventricular arrhythmia
Secondary outcomes II: Renal eventsCombined microalbuminuria,
macroalbuminuria, or 30% in CrCl
Ramipril 15 mg/d + Rosiglitazone 8 mg/d
Ramipril 15 mg/d+ Placebo
Placebo+ Placebo
Rosiglitazone 8 mg/d+ Placebo
Randomized, double-blind 2 × 2 factorial designN = 5269 with IFG and/or IGT
Follow-up: 3–5 years

DREAM: 2 x 2 factorial design
DREAM Trial Investigators. Diabetologia. 2004;47:1519-27.
Rosiglitazone Placebo
RamiprilRamipril +
RosiglitazoneRamipril +Placebo
PlaceboRosiglitazone +
PlaceboPlacebo +Placebo
N = 5269 with IFG and/or IGT

DREAM: Inclusion criteria
• Age ≥30 years
• IFG and/or IGT – Fasting plasma glucose 100–125 mg/dL– 2-hour 75 g OGTT 140–199 mg/dL
DREAM Trial Investigators. Diabetologia. 2004;47:1519-27.
N = 5269

DREAM: Key exclusion criteria
• ACEI/TZD use or contraindication
• LVEF <40% or other CVD with ACEI indication
• Diabetes
• Renal disease, including renal artery stenosis
• Diseases/medications that affect glucose tolerance
• Use of steroids/niacin
• Pregnancy
DREAM Trial Investigators. Diabetologia. 2004;47:1519-27.

DREAM: Baseline characteristics
Age (years) 54.7
Women (%) 58.5
Women with prior gestational diabetes (%) 9.3
Hypertension (%) 43.5
Hyperlipidemia (%) 35.5
BP (mm Hg) 136/83
BMI (kg/m2) 30.5
Waist-hip ratio, men 0.96
Waist-hip ratio, women 0.87
Waist circumference, men (in) 34.3
Waist circumference, women (in) 32.6
DREAM Trial Investigators. Diabetologia. 2004;47:1519-27.

DREAM: Baseline glucose status
• Isolated IGT 1835 (35%)
• Isolated IFG* 739 (14%)
• IGT and IFG* 2692 (51%)
• FPG (mean) 104
• 2-hr plasma glucose (mean) 157
DREAM Trial Investigators. Diabetologia. 2004;47:1519-27. *Based on 100 mg/dL threshold
n
mg/dL

DREAM: Beyond diabetes prevention
IFG and IGT are strong risk factors for CV disease
• Does treatment with rosiglitazone and/or ramipril improve IFG, IGT, and glucose control?
• Positive result for either or both drugs will:
– Affirm that links between RAAS, glucose homeostasis, andCV disease are clinically important
– Highlight relevance of elevated glucose levels as modifiablerisk factors for CV disease
DREAM Trial Investigators. Diabetologia. 2004;47:1519-27.

DREAM: Substudies
STARR (STudy of Atherosclerosis with Ramipril and Rosiglitazone)(N = 1427)• Carotid atherosclerosis progression
DREAM Trial Investigators. Diabetologia. 2004;47:1519-27.
EpiDREAM: Epidemiologic follow-up of individuals screened butnot randomized for DREAM (N ≈ 20,000)• Environmental/genetic determinants of diabetes, obesity, and
CV disease
Effects of rampiril and rosiglitazone• Conversion of IGT to normal glucose tolerance• Insulin resistance and -cell function• FPG, 2-hr plasma glucose, A1C

ADOPT: Study objective
• What is the long-term efficacy of monotherapy with rosiglitazone vs metformin or glyburide on glucose control in patients with type 2 diabetes (diagnosed≤3 years)?
A Diabetes Outcome Progression Trial
Viberti G et al. Diabetes Care. 2002;25:1737-43.

ADOPT: Study design
Follow-up: 4 years
Viberti G et al. Diabetes Care. 2002;25:1737-43.
Glyburide 15 mg/day* Metformin 2 g/day*
Secondary outcomes: Changes in A1C, FPG, -cell function, insulin sensitivity, lipids, BP, albumin excretion, PAI-1, fibrinogen, CRP
Primary outcome:Time to monotherapy failure
Rosiglitazone 8 mg/day*
*Titrated to maximum tolerated dose
Randomized, double-blind, parallel group designN ≈ 3600, drug naïve with type 2 diabetes <3 years
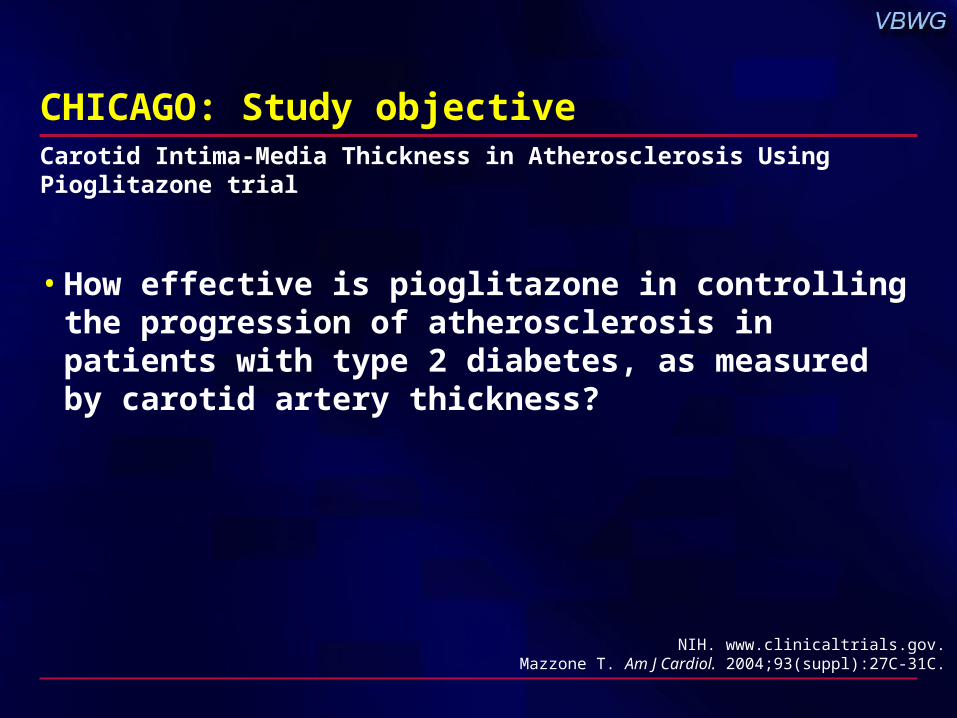
CHICAGO: Study objective
• How effective is pioglitazone in controlling the progression of atherosclerosis in patients with type 2 diabetes, as measured by carotid artery thickness?
NIH. www.clinicaltrials.gov.Mazzone T. Am J Cardiol. 2004;93(suppl):27C-31C.
Carotid Intima-Media Thickness in Atherosclerosis Using Pioglitazone trial

CHICAGO: Study design
*Titrated to reach glycemic controlNIH. www.clinicaltrials.gov.
Mazzone T. Am J Cardiol. 2004;93(suppl):27C-31C.
Double-blind, randomized, active control, parallel-efficacy study Type 2 diabetes, asymptomatic for CAD
N ≈ 462
Pioglitazone 15, 30, or 45 mg* Glimepiride 1, 2, or 4 mg*
Primary outcome: Change in carotid intima-media thickness at 18 months
Secondary outcome: Carotid artery calcium score