Embed Size (px)
Citation preview

Is it Possible to Demonstrate a Reduction in Cardiovascular Risk with Drugs for Type 2 Diabetes?17 September 2013

• ICON plc is a global provider of outsourced development services to the pharmaceutical, biotechnology and medical device industries.
• The company specializes in the strategic development, management and analysis of programs that support clinical development - from compound selection to Phase I-IV clinical studies.
• ICON currently operates from 79 locations in 37 countries and has approximately 10,045 employees.
• Further information is available at www.iconplc.com
About ICON

• ICON Signature Series is our thought leadership program that offers expert insights into value-driven strategies for clinical development.
• The program features ICON and external experts in all aspects of clinical development and post-approval product value strategies.
• For a list of featured topics and upcoming events go to: http://www.iconplc.com/icon-views/
ICON Signature Series

Introductions
Brendan Buckley MD DPhil FRCPIChief Medical OfficerICON plc
Brendan Buckley is a co-founder of Firecrest Clinical, now an ICON plc company, and Chief Medical Officer. He is also an Honorary Clinical Professor in the School of Medicine at University College Cork in Ireland. A medical graduate of the National University of Ireland and a doctoral graduate in Biochemistry of Oxford University, he has over 30 years experience in clinical pharmacology research.
Prof. Buckley is a Fellow of the Royal College of Physicians of Ireland, of the College’s Faculty of Pathology and a Fellow of the Faculty of Sports and Exercise Medicine.
Introductions
Didier Saur, MDSenior Director, Clinical Sciences, PCBU at PfizerParis Area, France Pharmaceuticals
Dr Saur is a medical physician and has more than 20 years of experience in clinical drug development, with specific emphasis on cardiovascular and metabolic disorders drug development. He has worked in pharmaceutical companies, including SmithKline Beecham, for 7 years in atherosclerosis, lipids and cardiovascular at both local and corporate levels.
Didier joined ICON Clinical Research in 2007 as Vice President, Cardio-Metabolic Research and MDS Pharma Services in 1993 as Clinical Research Director for cardiology and metabolic disorders, later becoming Senior Director, Clinical Drug Development. He served as Medical Director for Europe before leading the MDS Metabolic Disorders Initiative globally.
Didier has been responsible for several programs in cardiology, diabetes and hypercholesterolemia, including cardiovascular outcome studies, and is a member of the EASD and ADA.

Introductions
Hertzel C. Gerstein, MD MSc FRCPCProfessor, Dept of MedicineDirector, Division of Endocrinology and MetabolismMcMaster University, Hamilton, ON, Canada
Dr. Hertzel C. Gerstein is an Endocrinologist and Professor at McMaster University and Hamilton Health Sciences, where he holds the Population Health Institute Chair in Diabetes Research. He is also Director of the Division of Endocrinology & Metabolism, Director of the Diabetes Care and Research Program and Deputy Director of the Population Health Research Institute.
Dr. Gerstein has led the application of large simple outcome trials to people with diabetes globally, and developed the concept of dysglycemia as an important risk factor for many of the serious health outcomes that afflict people with an elevated glucose level regardless of diabetes status. He currently leads clinical trials and epidemiologic studies related to: a) the prevention and therapy of diabetes and its many consequences, and b) the role of dysglycemia and relative insulin insufficiency on the development of diabetes, cardiovascular disease, cognitive impairment and other chronic conditions.
Dr. Gerstein has published more than 200 papers, chapters, editorials and commentaries, mainly on diabetes-related issues. He has been the recipient of several honours including the Canadian Diabetes Association’s Young Scientist Award (1999), Frederick G. Banting award (1999), and Charles H. Best award (2007). .

Agenda
• Background
• CV Reduction with:
– Glucose Lowering Intensity
– Glucose Lowering Approaches

Background
• Study results presented at the 2013 ESC Meeting:– SAVOR-TIMI 53 : saxagliptin– EXAMINE: alogliptin
• First 2 studies completed under the December 2008 FDA guidance document
• Expectations to see a reduction in CV risk with DPP-4 inhibitors

Some Thoughts from the Study Results
• Two additional studies with diabetic patients not demonstrating a
reduction of CV risk!
• HbA1c is probably a biomarker for microvascular risk, not for
macrovascular risk
• Is it possible to demonstrate a reduction of CV risk with
antidiabetics?
• On top of CV medications, and concomitant anti-diabetic drugs

Some Thoughts from the Study Results
• Are there methodological issues for:
– Patient population definition?
– Duration of diabetes prior to randomization?
– Duration of follow-up
– Percentage of drug discontinuation
– Confounding factors?

Some Thoughts from the Study Results
• One more case of discrepancy between outcome trials and meta-analysis– Need for RCTs– Discrepant pre- and post-MKT data for saxagliptin
• Consistent results between SAVOR & EXAMINE: could results be extrapolated to other DPP-4 inhibitors?

Is it possible to demonstrate cardiovascular risk
reduction with drugs for type 2 diabetes?
Brendan M BuckleyMD DPhil FRCPIChief Medical OfficerICON plc
Is it possible to demonstrate cardiovascular risk
reduction with drugs for type 2 diabetes?
Answer:“It hasn’t really been, up to now.”
“It gets more difficult with time.”
“Drugs mainly affecting glucose levels are least likely to succeed in this”

Type 2 Diabetes and CV disease
• CV disease is the main cause of death in Type 2 diabetes.
• Type 2 diabetes more than doubles the risk of CV disease.
The Hypothesis:
– Lowering elevated blood glucose towards normal levels
should decrease CV risk.

To establish the safety of a new antidiabetic therapy to treat type 2 diabetes, sponsors should demonstrate that the therapy will not result in an
unacceptable increase in cardiovascular risk.
• By metanalysis of adjudicated CV events in Phase 2 and 3 studies
And if necessary:
• By fully powered CV safety assessment, e.g. based on a dedicated CV outcome study,
Guidance for Industry: Diabetes Mellitus — Evaluating Cardiovascular Risk in New Antidiabetic Therapies to Treat Type 2 Diabetes. FDA: CDER 2008.
Guideline on clinical investigation of medicinal products in the treatment or prevention of diabetes mellitus. EMA: CHMP 2012
Diabetes Drugs: Regulatory Issues

Type 2 Diabetes and CV disease
• Improved glycemic control has been shown to reduce
microvascular diabetic complications.
• But it is uncertain whether any glucose-lowering strategy, or
specific therapeutic agent can lower CV risk.
• With the possible exception of metformin and insulin, most CV
outcomes trials of specific drugs or glucose-lowering
strategies have shown no significant CV benefit.
Is it possible to identify anti-hyperglycemic agents that can potentially reduce cardiovascular complications?

Metanalysis of Pre-approval Studies
• Does not always give the right answer, due to
– Heterogeneity of component studies’ designs
– Heterogeneity of study cohorts
• e.g. CV risk profiles, times since diagnosis
• Short duration
• Lack of formal CV event independent adjudication

Metanalysis is a Poor Predictor of Outcomes
Scirica BM et al N Engl J Med. 2013 Sep 2. PMID: 23992601
MetanalysisScirica BM et al. Am Heart J
2011;162:818‐825.e6.
Outcomes Trial
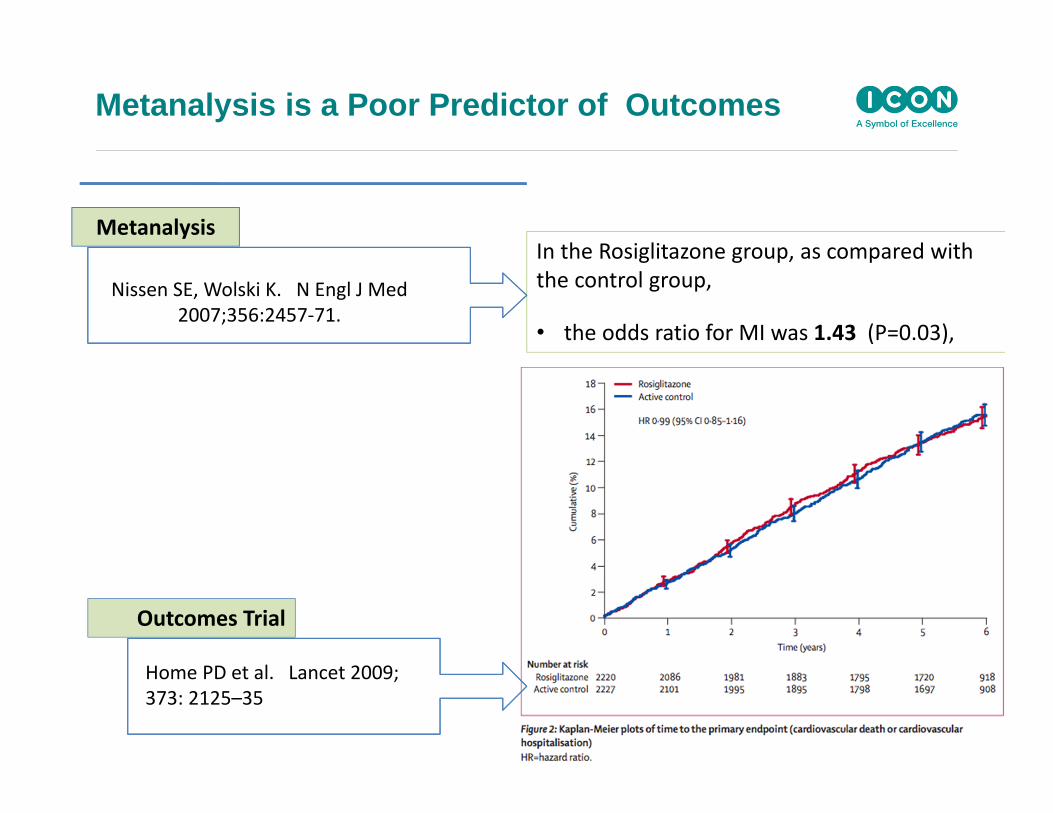
Metanalysis is a Poor Predictor of Outcomes
Home PD et al. Lancet 2009; 373: 2125–35
Metanalysis
Nissen SE, Wolski K. N Engl J Med 2007;356:2457‐71.
Outcomes Trial
In the Rosiglitazone group, as compared with the control group,
• the odds ratio for MI was 1.43 (P=0.03),
Designing a New Study in Type 2 Diabetes
Caveats:
• Diabetes is a disease affecting more than glycemia
• Some diabetes drugs affect more than glycemia
• Clinical trials fundamentally address the question – “is Treatment A better than Treatment B?”
• If there is a treatment difference, any mechanistic interpretation
is usually inferred, not demonstrated

The Type 2 Diabetes Iceberg
HYPERGLYCEMIA
HDL
fibrinogen
Endothelial dysfunction
Abnormal adipocyte function
NEFA
ETC.
sd LDL
Trigs
PAI-1
vWF
protein S
Abnormal Counter-regulation
Abnormal beta-cell function
Insulin resistance

Designing a New Study in Type 2 Diabetes
Basic Questions:
• Designed for non-inferiority (for safety) or superiority (for efficacy claim) ?
• Absence of safety signals in earlier phase studies?• Level of confidence in extent of surrogate efficacy?• Level of confidence in control/placebo event rate given basic
concomitant care standards?• Will efficacy be swamped by concomitant medications?• Can conmeds stay balanced between trial’s arms during trial?• Is there an unmet need / niche?• Can hoped for effects satisfy reimbursement criteria?

Diminishing Risk, Diminishing Return
Number of Individual Treatment Modalities Added0 1 2 3 4
Rel
ativ
e R
isk
Statin
BP Control
Metformin
Aspirin ?
Unless synergistic, each treatment added acts on the prior residual risk
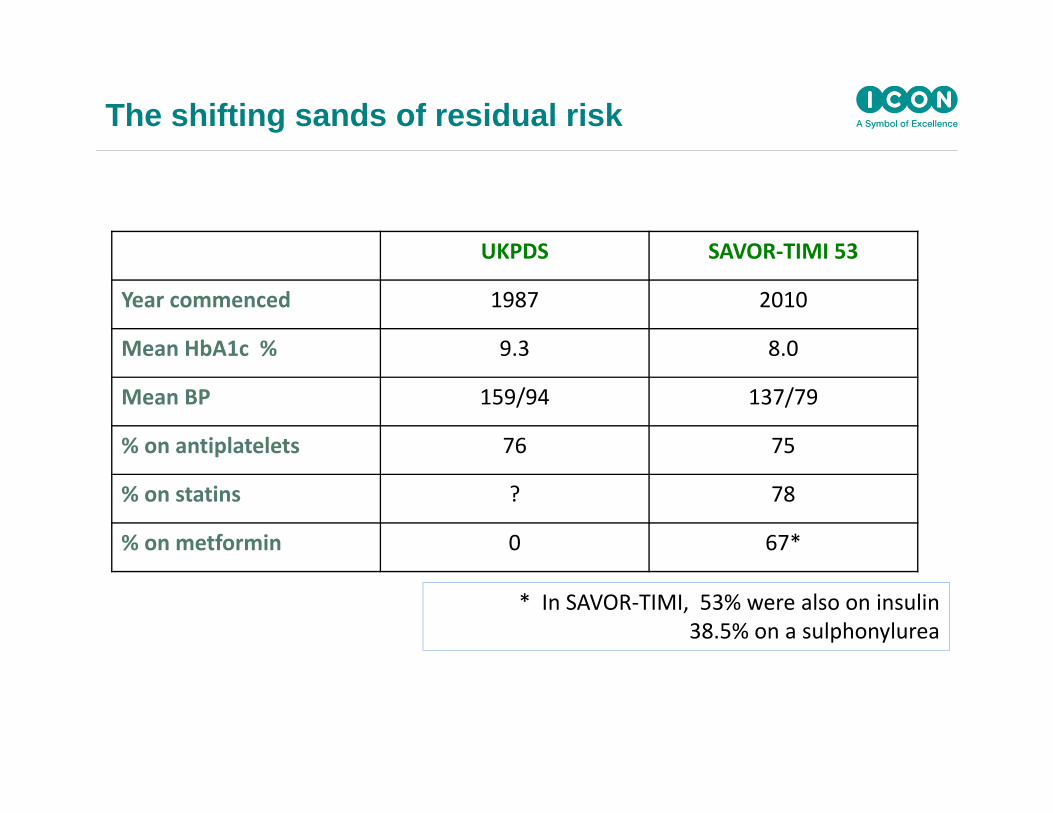
The shifting sands of residual risk
UKPDS SAVOR‐TIMI 53
Year commenced 1987 2010
Mean HbA1c % 9.3 8.0
Mean BP 159/94 137/79
% on antiplatelets 76 75
% on statins ? 78
% on metformin 0 67*
* In SAVOR‐TIMI, 53% were also on insulin 38.5% on a sulphonylurea

STENO-2 study
Gaede P .et al. N Engl J Med 2008;358:580‐91.
Design
• Intensified multifactorial intervention:– tight glucose regulation – renin–angiotensin system blockers, – aspirin– lipid‐lowering agents
• 160 patients randomized. Follow‐up 7.6 years

STENO-2 study
copied from: Gaede P et al. : N Engl J Med 2008;358:580‐91.

STENO-2 study
Copied from: Gaede P, Pedersen O. Diabetes 53 (Suppl. 3):S39–S47, 2004
UKPDS Risk Engine:Average risk factor profiles for patients in the intensive therapy group at baseline and at the end of the STENO‐2 study are calculated, giving an opportunity to differentiate the cardiovascular risk reduction into each of the entered variables

Designing a New Study in Type 2 Diabetes
How Encouraging are Previous (Modern) Studies ?
Not very….
• 1 of 8 shows some CV outcomes benefit in a 2o endpoint but 1o outcome measure was not improved
• (16% relative risk reduction; at expense of 6% increase in heart failure hospitalizations)
Even this has been controversial

CV Outcomes in Type 2 diabetes
Drug Class CV benefit• Insulin & Analogs ✔ / ✖• Suphonylureas and meglitinides ✖
• Metformin ✔
• TZDs (‘glitazones’) ✔ / ✖• DPP4 inhibitors (‘gliptins ) ✖
• GLP1 agonists await• SGLT2 inhibitors await• alpha-glucosidase inhibitors await• GPR40 inhibitors await• Glucokinase activators ?
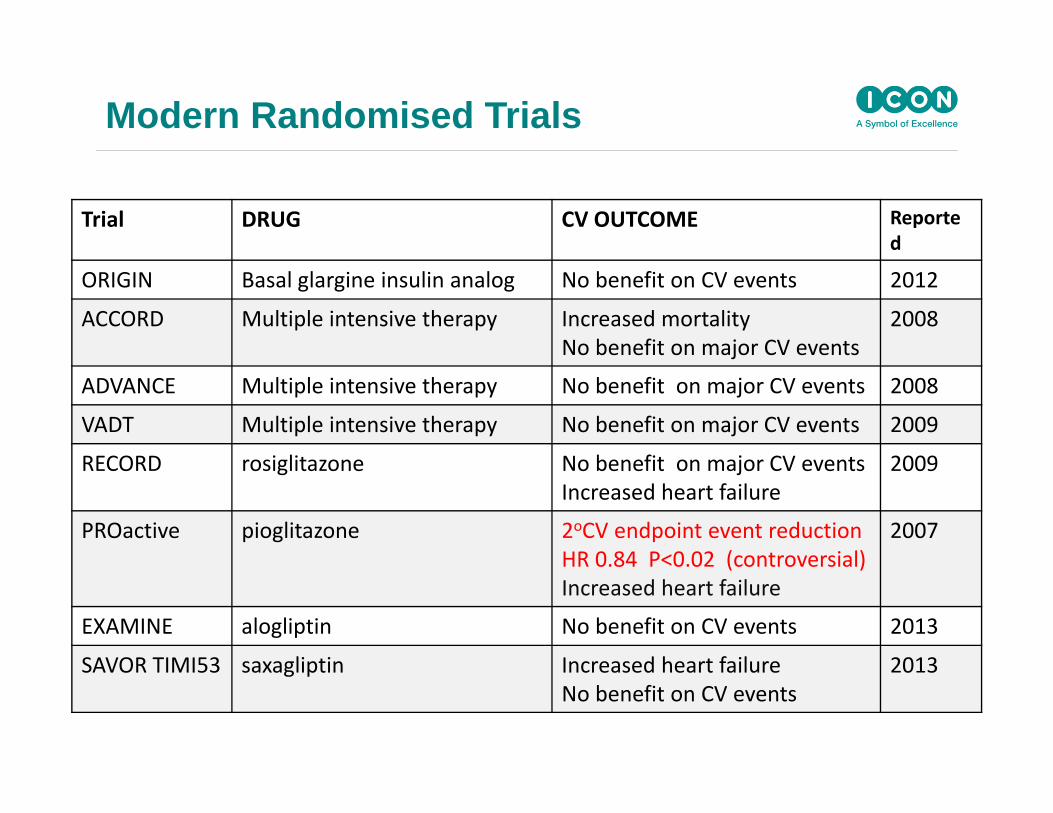
Modern Randomised Trials
Trial DRUG CV OUTCOME Reported
ORIGIN Basal glargine insulin analog No benefit on CV events 2012
ACCORD Multiple intensive therapy Increased mortalityNo benefit on major CV events
2008
ADVANCE Multiple intensive therapy No benefit on major CV events 2008
VADT Multiple intensive therapy No benefit on major CV events 2009
RECORD rosiglitazone No benefit on major CV eventsIncreased heart failure
2009
PROactive pioglitazone 2oCV endpoint event reductionHR 0.84 P<0.02 (controversial)Increased heart failure
2007
EXAMINE alogliptin No benefit on CV events 2013
SAVOR TIMI53 saxagliptin Increased heart failureNo benefit on CV events
2013

DPP4 inhibitor studies
Drug Trial Name CV Outcome
Saxagliptin –v- placebo (SAVOR-TIMI) 53 Increased hospitalization for heart failure
Alogliptin –v- placebo (EXAMINE) Non‐inferior to placebo
Sitgliptin –v- placebo TECOS awaited
Linagliptin Versus Glimepiride
CAROLINA awaited
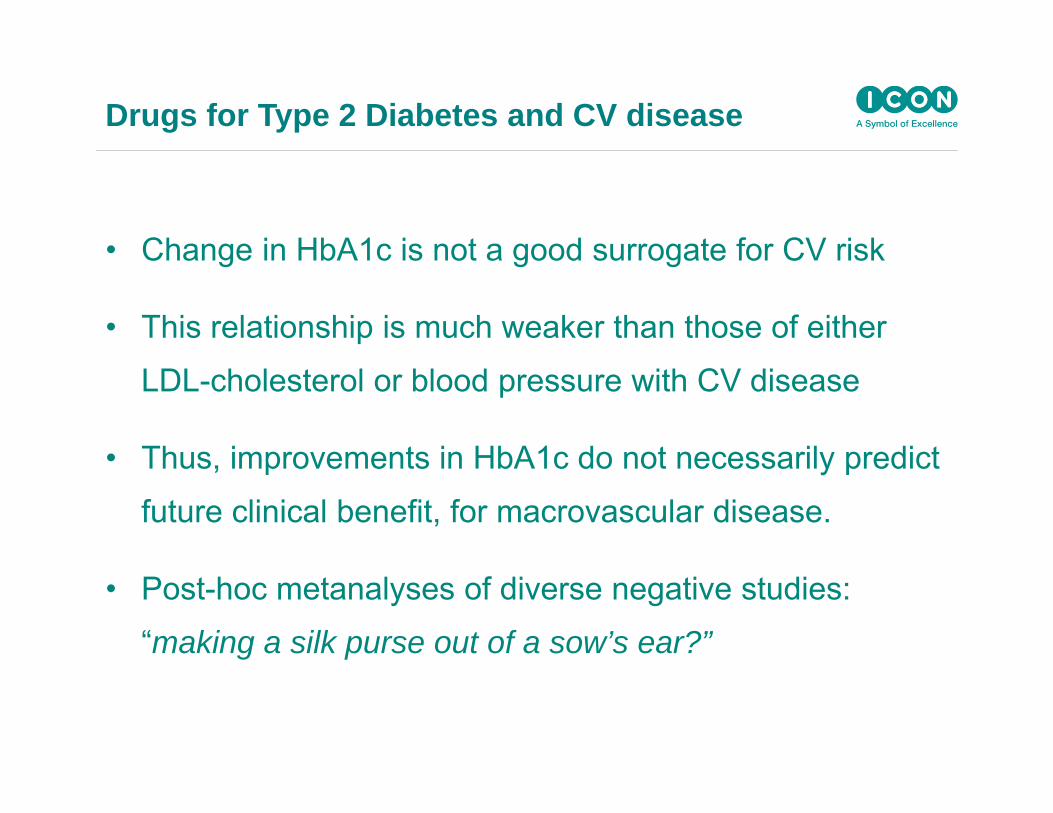
Drugs for Type 2 Diabetes and CV disease
• Change in HbA1c is not a good surrogate for CV risk
• This relationship is much weaker than those of either
LDL-cholesterol or blood pressure with CV disease
• Thus, improvements in HbA1c do not necessarily predict
future clinical benefit, for macrovascular disease.
• Post-hoc metanalyses of diverse negative studies:
“making a silk purse out of a sow’s ear?”

Type 2 Diabetes and CV disease
• Clinical practice concentrates on multiple risk reduction, which
can be highly effective (e.g. STENO-2).
• Trials of drugs that affect glycemia alone unlikely to show
superiority for CV events when their predecessors haven’t.
• Payers may be reluctant to reimburse even if predicted
benefits of glucose lowering are achieved.
• Drugs with multiple and profound effects on “insulin sensitivity’
might show CV benefit, but at a risk.

Type 2 Diabetes and CV disease
Considerations:
• Superiority designs are optional, more risky, more expensive, and
have a bad track record. They may not lead to better reimbursement
prospects; in fact they may show that the drug is a poor
pharmacoeconomic buy.
• Non-inferiority designs are necessary and may be minimalist, less
expensive and more likely to work out.

Hertzel C. Gerstein MD MSc FRCPCProfessor and Population Health Institute Chair in Diabetes Research
McMaster University and Hamilton Health SciencesHamilton, Ontario, Canada
Is it Possible to Reduce CV Event Rates with Anti-diabetic Agents in
People with Type 2 Diabetes?
Yes

© HCG 2013
DM & the Risk of CV Outcomes
Lancet 2010; 2215 (102 prospective studies, 700K people, 8.5M p-years f/u)
HR adj. for age, smoking, BMI, SBP

© HCG 2013
A1c & CV Outcomes: General Pop’nNo History of DM or CVD
HR per 1% higher A1c = 1.55 (1.28-1.88)
HR per 1% higher A1c = 1.50 (1.33-1.68)
Selvin et al. NEJM 2010; 362:800

© HCG 2013
Outline
• CV Reduction with: – Glucose Lowering Intensity– Glucose Lowering Approaches
• Summary

© HCG 2013
Study Duration (yrs)
N GlycemiaTarget Achieved
UKPDS 10 3867 FPG < 6 (110) A1C = 7.0% vs. 7.9%
ACCORD 3.5 10251 A1C < 6.0% A1C = 6.4% vs. 7.5%
ADVANCE 5 11140 A1C < 6.5% A1C = 6.5% vs. 7.3%
VADT 6.3 1791 A1C < 6.0% A1C = 6.9% vs. 8.4%
Type 2 DM: G Lowering Trials ACTIVE Rx PHASE

© HCG 20130.5
Trials Hazard ratio (95% CI)
Hazard ratio (95% CI)
2.0
Favorsmore
intensive
Favorsless
intensive
ACCORD
ADVANCE
UKPDS
VADT
Stroke
Overall
1.00 (0.72 - 1.39)
0.97 (0.81 - 1.16)
0.85 (0.48 - 1.52)
0.87 (0.54 - 1.39)
0.96 (0.83 – 1.10)(Q=0.40, p =0.94, I2=0.0%)
73 (0.43) 70 ( 0.42) -1.01
238(0.91) 246 ( 0.94) -0.72
35 (0.26) 17 ( 0.31) -0.66
32 (0.71) 37 ( 0.82) -1.16
378 370 -0.88
VADT
ACCORD
ADVANCE
UKPDS
Myocardial infarction
Overall
0.83 (0.61 - 1.13)
0.77 (0.64 - 0.93)
0.92 (0.79 - 1.07)
0.81 (0.62 - 1.07)
0.85 (0.76 – 0.94)(Q=2.25, p =0.52, I2=0.0%)
198(1.18) 245 ( 1.51) -1.01
310(1.18) 337 ( 1.28) -0.72
150(1.20) 76 ( 1.40) -0.66
72 (1.65) 87 ( 1.99) -1.16
730 745 -0.88
ACCORD
ADVANCE
UKPDS
VADT
Major cardiovascular events
Overall
0.90 (0.78 - 1.04)
0.94 (0.84 - 1.06)
0.80 (0.62 - 1.04)
0.90 (0.70 - 1.16)
0.91 (0.84 – 0.99)(Q=1.32, p =0.72, I2=0.0%)
352(2.11) 371 ( 2.29) -1.01
557(2.15) 590 ( 2.28) -0.72
169(1.30) 87 ( 1.60) -0.66
116(2.68) 128 ( 2.98) -1.16
1194 1176 -0.88
moreintensive
lessintensive
Number of events (annual event rate, %) ∆HbA1c
(%)
ACCORD
ADVANCE
UKPDS
VADT
Hospitalized/fatal heart failure
Overall
1.18 (0.93 - 1.49)
0.95 (0.79 - 1.14)
0.55 (0.19 - 1.60)
0.92 (0.68 - 1.25)
1.00 (0.86 – 1.16)(Q=3.59, p =0.31, I2=16.4%)
152(0.90) 124 ( 0.75) -1.01
220(0.83) 231 ( 0.88) -0.72
8 (0.06) 6 ( 0.11) -0.66
79 (1.80) 85 ( 1.94) -1.16
459 446 -0.88
1.0CONTROL Group Diabetologia 2009

© HCG 2013
Trials
Hazard ratio (95% CI)
0.5 2.0
VADT
ACCORD
ADVANCE
UKPDS
All-cause mortality
Overall
1.07 (0.81 - 1.42)
1.22 (1.01 – 1.46)
0.93 (0.83 - 1.06)
0.96 (0.70 - 1.33)
1.04 (0.90 – 1.20)(Q=5.71, p =0.13, I2=47.5%)
-1.01
-0.72
-0.66
-1.16
-0.88
1.0
ACCORD
ADVANCE
UKPDS
VADT
Non-cardiovascular death
Overall
1.14 (0.87 - 1.49)
1.00 (0.84 - 1.20)
0.90 (0.55 - 1.46)
0.97 (0.69 - 1.36)
1.02 (0.89 – 1.18)(Q=0.99, p =0.80, I2=0.0%)
-1.01
-0.72
-0.66
-1.16
-0.88
ACCORD
ADVANCE
UKPDS
VADT
Cardiovascular death
Overall
1.35 (1.04 - 1.76)
0.88 (0.74 - 1.04)
1.02 (0.66 - 1.57)
1.32 (0.81 – 2.14)
1.10 (0.84 – 1.42)(Q=8.61, p =0.04, I2=65.1%)
-1.01
-0.72
-0.66
-1.16
-0.88
135 (0.79) 94 (0.56)
253 (0.95) 289 ( 1.08)
71 (0.53) 29 ( 0.52)
38 (0.83) 29 ( 0.63)
497 441
115 (0.63) 98 (0.55)
245 (0.92) 244 ( 0.91)
52 (0.39) 24 ( 0.43)
64 (1.40) 66 ( 1.43)
476 432
257 (1.41) 203 (1.14)
498 (1.86) 533 ( 1.99)
123 (0.13) 53 ( 0.25)
102 (2.22) 95 ( 2.06)
980 884
Hazard ratio (95% CI)
Favorsmore
intensive
Favorsless
intensivemoreintensive
lessintensive
Number of events (annual event rate, %) ∆HbA1c
(%)
CONTROL Group Diabetologia 2009

© HCG 2013
Insulin/SU & Outcomes: New T2DMUKPDS F/U NEJM 2008;359:1-13
Myocardial InfarctionHR 0.85 (0.74-0.97)
Total MortalityHR 0.87 (0.79-0.96)
Years Since Rand Years Since Rand

© HCG 2013
Effect of > 4 y of Glycemic Control on CV Events in Type 2 Diabetes
CVD Effect Effect Size Age (y) F/U (y) Evidence
MI Reduced 0.85 (0.76, 0.94) 53-66 3.5-5.6 Meta-analysis
MACE Reduced 0.91 (0.84, 0.99) 53-66 3.5-5.6 Meta-analysis
CHF No Effect N/A 53-66 3.5-5.6 Meta-analysis
Stroke No Effect N/A 53-66 3.5-5.6 Meta-analysis
PAD No Effect N/A 53 12 UKPDS
CV DeathNo Effect N/A 53-66 3.5-5.6 Meta-analysis
Increased 1.29 (1.04, 1.60) 62 5 ACCORD
Death
No Effect N/A 53-66 3.5-5.6 Meta-analysis
Reduced 0.87 (0.79, 0.96) 53 17 UKPDS
Increased 1.19 (1.03, 1.38) 62 5 ACCORD

© HCG 2013
Intensive Insulin & CVD: Type 1 DM DCCT/EDIC NEJM 2005;353:2643
Primary CV CompositeRRR= 42% (9-63)
© HCG 2013
Outline
• CV Reduction with: – Glucose Lowering Intensity– Glucose Lowering Approaches
• Menu of Drugs• Single Drugs
• Summary

© HCG 2013
BARI 2D Trial• Participants: N=2368 with type 2 DM (30% female; mean
age = 63; median A1C = 7.7%, mean DM duration 10.4 years)
Angiographically proven CAD with symptoms
• Stratification: best treated with PCI (1605) or CABG (763)
• Allocation: a) insulin sensitization vs. provision b) medical Rx vs. revascularization
• Mean F/U: 5.3 years
NEJM 2009; 360:2503

© HCG 2013
Combinations of Insulin Sensitizing vs. Insulin Providing Drugs: BARI 2D
NEJM 2009; 360:2503

© HCG 2013
Outline
• CV Reduction with: – Glucose Lowering Intensity– Glucose Lowering Approaches
• Menu of Drugs• Single Drugs
• Summary

© HCG 2013
Glucose Lowering Drugs & Outcomes
• Sulfonylureas
• Metformin
• Meglitinides
• TZDs
• Insulin
• Acarbose
• GLP-1 analogs
• DPP4 inhibitors
• SGLT-2 inhibitors
• PPAR
• Other drugs– Colesavalam– Bromocriptine– Pramlintide

© HCG 2013
Glucose Lowering Drugs & Outcomes
• Sulfonylureas
• Metformin
• Meglitinides
• TZDs
• Insulin
• Acarbose
• GLP-1 analogs
• DPP4 inhibitors
• SGLT-2 inhibitors
• PPAR
• Other drugs– Colesavalam– Bromocriptine– Pramlintide
© HCG 2013
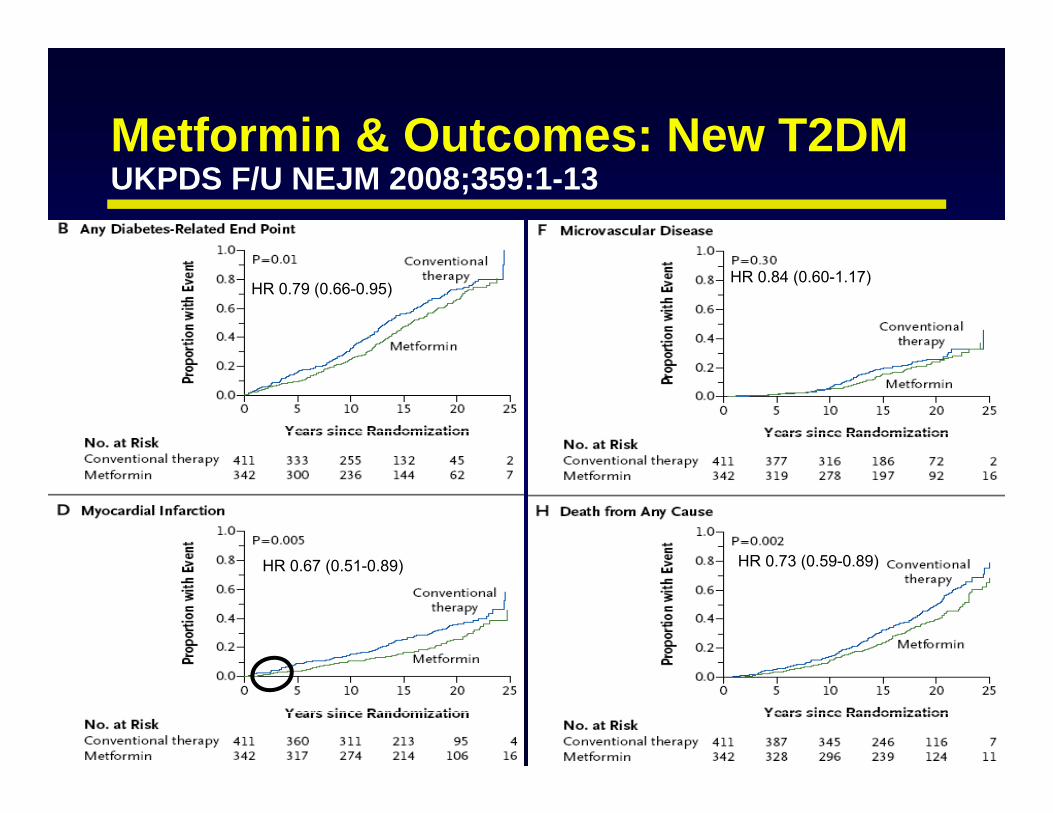
Metformin & Outcomes: New T2DMUKPDS F/U NEJM 2008;359:1-13
HR 0.67 (0.51-0.89)
HR 0.84 (0.60-1.17)HR 0.79 (0.66-0.95)
HR 0.73 (0.59-0.89)

© HCG 2013
Glucose Lowering Drugs & Outcomes
• Sulfonylureas
• Metformin
• Meglitinides
• TZDs
• Insulin
• Acarbose
• GLP-1 analogs
• DPP4 inhibitors
• SGLT-2 inhibitors
• PPAR
• Other drugs– Colesavalam– Bromocriptine– Pramlintide
© HCG 2013
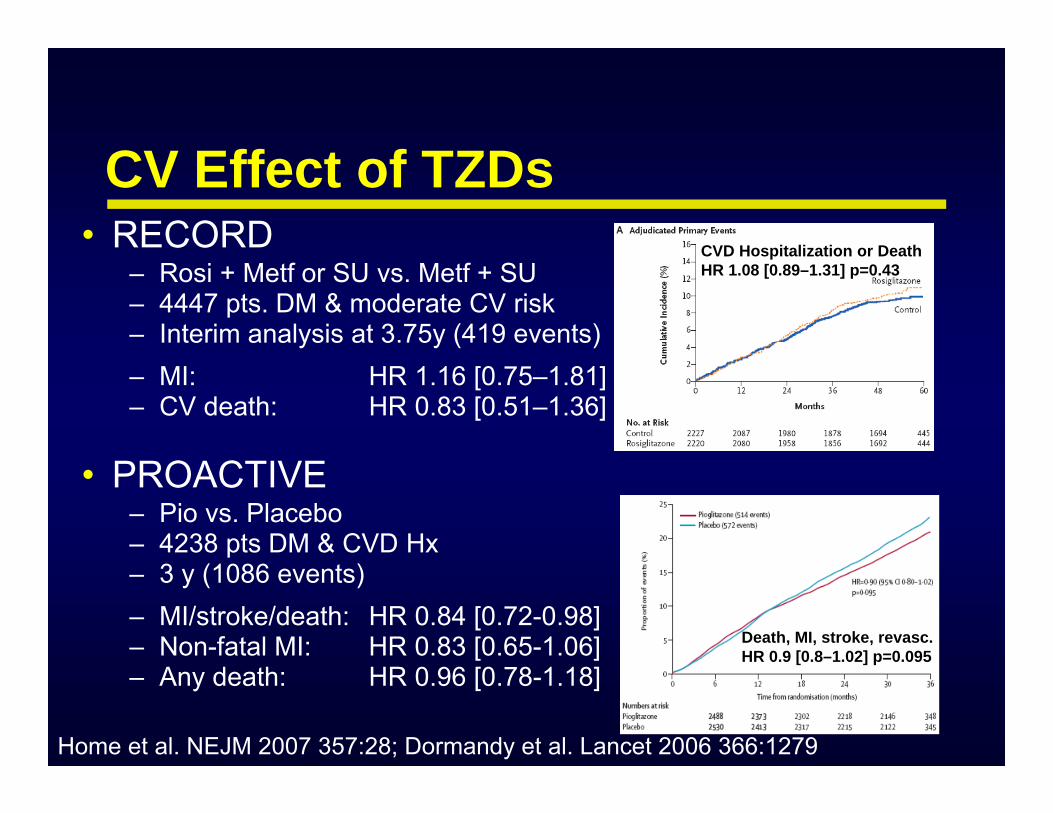
• RECORD– Rosi + Metf or SU vs. Metf + SU– 4447 pts. DM & moderate CV risk– Interim analysis at 3.75y (419 events)– MI: HR 1.16 [0.75–1.81]– CV death: HR 0.83 [0.51–1.36]
• PROACTIVE– Pio vs. Placebo– 4238 pts DM & CVD Hx– 3 y (1086 events)– MI/stroke/death: HR 0.84 [0.72-0.98]– Non-fatal MI: HR 0.83 [0.65-1.06]– Any death: HR 0.96 [0.78-1.18]
Home et al. NEJM 2007 357:28; Dormandy et al. Lancet 2006 366:1279
CVD Hospitalization or DeathHR 1.08 [0.89–1.31] p=0.43
Death, MI, stroke, revasc. HR 0.9 [0.8–1.02] p=0.095
CV Effect of TZDs

© HCG 2013Dormandy et al. Lancet 2006 366:1279
CVD Hospitalization or DeathHR 1.08 [0.89–1.31] p=0.43
Death, MI, stroke, revasc. HR 0.9 [0.8–1.02] p=0.095
CV Effect of Pioglitazone

© HCG 2013
CV Effect of Basal Insulin Glargine(ORIGIN - NEJM 2012;367:319)
HR (95% CI) P Insulin Standard/100 py /100 py
1st Coprimary 1.02 (0.94, 1.11) 0.63 2.94 2.852nd Coprimary 1.04 (0.97, 1.11) 0.27 5.52 5.28
Microvascular 0.97 (0.90, 1.05) 0.43 3.87 3.99Death 0.98 (0.90, 1.08) 0.70 2.57 2.60
MI 1.02 (0.88, 1.19) 0.75 0.93 0.90Stroke 1.03 (0.89, 1.21) 0.69 0.91 0.88CV Death 1.00 (0.89, 1.13) 0.98 1.57 1.55CHF Hospital 0.90 (0.77, 1.05) 0.16 0.85 0.95Revascularized 1.06 (0.96, 1.16) 0.24 2.69 2.52
0.5 1 2 Favors StandardFavors Insulin
HR

© HCG 2013
Glucose Lowering Drugs & Outcomes
• Sulfonylureas
• Metformin
• Meglitinides
• TZDs
• Insulin
• Acarbose
• GLP-1 analogs
• DPP4 inhibitors
• SGLT-2 inhibitors
• PPAR
• Other drugs– Colesavalam– Bromocriptine– Pramlintide

© HCG 2013SAVOR TIMI NEJM 2013 September
CV Effect of Saxagliptin

© HCG 2013White et al. EXAMINE Trial. NEJM 2013 September
CV Effect of Alogliptin

© HCG 2013
Glucose Lowering Drugs & Outcomes
• Sulfonylureas
• Metformin
• Meglitinides
• TZDs
• Insulin
• Acarbose
• GLP-1 analogs
• DPP4 inhibitors
• SGLT-2 inhibitors
• PPAR
• Other drugs– Colesavalam– Bromocriptine– Pramlintide

© HCG 2013
Completed Large CV Outcomes Trials of Anti-diabetic Agents
Class Participants Drugs NBasal Insulin Diabetes, IGT, IFG Glargine 12537
Meglitinide IGT Nateglinide 9306
Prandial Insulin Diabetes Lispro 1115
TZD Diabetes Pioglitazone 5238
TZD Diabetes Rosiglitazone 4447
2 Strategies Diabetes Insulin Sensitizing & Supplying Drugs 2368
Biguanide Diabetes Metformin 1704
DPP4i Diabetes Saxagliptin 16492
DPP4i DIabetes Alogliptin 5380
Gerstein HC, Circulation 2013; 128(8):777-9

© HCG 2013
Class Participants Drugs Est. N
DPP4i Diabetes sitagliptin, linagliptin, omarigliptin 30,000
GLP1a Diabeteslixisenatide, liraglutide, exenatide (extended)
dulaglutide, semaglutide40,000
SGLT2i Diabetes canagliflozin, empagliflozin, dapagliflozin 25,000
AGI IGT acarbose 7,500
TZD Insulin Resistant pioglitazone 4,000
GPR40 Diabetes fasiglifam 5,000
Ongoing Large CV Outcomes Trials of Anti-diabetic Agents
Gerstein HC, Circulation 2013; 128(8):777-9

© HCG 2013
Outline
• The Best Evidence re: – Glucose Lowering Intensity– Glucose Lowering Approaches
• Menu of Drugs• Single Drugs
• Summary

© HCG 2013
Summary• Intensive glucose lowering in new type 2 DM
reduces long-term risk of CVD & mortality• Intensive glucose lowering in advanced type 2 DM
has modest CVD benefits but ACCORD noted a mortality risk after 3.5 yrs
• 2 commonly used strategies to lower glucose (insulin sensitization vs. provision) have similar effects on CVD

© HCG 2013
Summary• Metformin may have a mortality benefit • TZDs may reduce CV events (moot point)• If antidiabetic drugs reduce CV events the effect is
likely to take > 2 years to become apparent• Several ongoing trials are testing novel strategies• Before statins it was not clear whether lipid drugs
reduce CVD • The glycemic “statin” is yet to be discovered

To Submit Questions
•Type questions into the Questions box
•Note: A recording of this presentation will be made available within 48 hours
•For more information: Contact [email protected]