Embed Size (px)
Citation preview
Daniel Field
Business and Management Dissertation
CUSTOMER PERCEPTION IMPACT ON BRAND LOYALTY, WITH RESPECT TO CSR. A CASE STUDY OF TESCO.
2
Abstract Corporate Social Responsibility (CSR) is a concept that is changing the way businesses are perceived. This dissertation discusses the impact of consumer perceptions of CSR on brand loyalty, examining the direction of this relationship, as well as sub-domain factors of CSR that have the greatest effect on the levels of brand loyalty. In order to investigate the relationship, a quantitative approach to primary research was undertaken. Given the two main variables in this study, it was decided that this dissertation would involve the use of a case study, with TESCO being the selected company. An online questionnaire was distributed through social media and email to a sample of 104 respondents. SPSS, a statistical software, was then used to anlayse the data and explore relationships between the variables in the study. The results from the data analysis show a strong positive correlation between perceived CSR and brand loyalty. This shows that respondents who perceived TESCO to be socially responsible showed higher levels of brand loyalty, as appose to those who perceived TESCO to be less socially responsible. Furthermore, it was found that actions and practices regarding customers had the biggest effect on the levels of brand loyalty. When comparing the findings of this study to previous research, there are similarities as well as differences. Several studies have investigated the relationship between consumer perceptions of CSR and brand loyalty. However, the cultural context in which the research takes place may be the reason behind why contrasting results are found between studies investigating perceived CSR and brand loyalty. Future avenues to address this potential factor are discussed at the end of the paper, where the limitations of the study are also presented.
3
Table of Contents
Abstract ................................................................................................................................................ 2
Acknowledgements ......................................................................................................................... 4
1.0 Introduction ......................................................................................................................... 5 1.1 History of CSR in the Business Environment ........................................................................... 6 1.2 Introduction to TESCO ....................................................................................................................... 6 1.3 TESCO’s CSR history ........................................................................................................................... 7 1.4 Purpose of Study .................................................................................................................................. 7 1.5 Structure of Paper ................................................................................................................................ 8
2.0 Literature Review ..................................................................................................................... 8 2.1 Introduction ........................................................................................................................................... 8 2.2 CSR – An Emerging Research Area ............................................................................................... 9 2.3 Carroll’s (1979) four domains of CSR .......................................................................................... 9 2.31 Critiques of Carroll’s (1979) approach to CSR ................................................................... 10 2.4 CSR Theories ....................................................................................................................................... 10 2.41 Stakeholder Theory ....................................................................................................................... 11 2.42 Social Contracts Theory ............................................................................................................... 12 2.43 Legitimacy Theory ......................................................................................................................... 13 2.5 Consumer Perceptions on CSR .................................................................................................... 15 2.6 Perceived CSR and Brand Loyalty .............................................................................................. 16 2.7 Conclusions .......................................................................................................................................... 19
3.0 Methodology ............................................................................................................................ 20 3.1 Research Philosophy ....................................................................................................................... 20 3.2 Research Design ................................................................................................................................ 21 3.3 Measures and Scales ........................................................................................................................ 21 3.4 Data Collection ................................................................................................................................... 23 3.5 The Sample .......................................................................................................................................... 23 3.6 Ethical Considerations .................................................................................................................... 24
4.0 Results ........................................................................................................................................ 25 4.1 Descriptive Statistics ....................................................................................................................... 25 4.2 Reliability Analysis ........................................................................................................................... 28 4.3 Robustness Analysis ........................................................................................................................ 28 4.31 Normality Tests ............................................................................................................................... 28 4.32 Outliers ............................................................................................................................................... 29 4.4 Correlation Analysis......................................................................................................................... 31 4.43 Perceived CSR and Brand Loyalty ........................................................................................... 31 4.5 Multiple Linear Regression Analysis......................................................................................... 32 4.51 Checking Assumptions of Multicollinearity......................................................................... 32 4.52 Evaluation of the Model ............................................................................................................... 33 4.53 Evaluation of the Independent Variables ............................................................................. 33 4.6 Other Unexpected Results ............................................................................................................. 36
5.0 Discussion ................................................................................................................................. 37 5.1 Perceived CSR and Brand Loyalty .............................................................................................. 37 5.2 Latent Variables ................................................................................................................................. 38 5.3 Age, Perceived CSR, and Brand Loyalty ................................................................................... 38
6.0 Conclusion ................................................................................................................................ 40 6.1 Recommendations for Managers ................................................................................................ 41 6.2 Limitations and Future Research ............................................................................................... 42
4
7.0 Appendices ............................................................................................................................... 44 7.1 Appendix 1 ........................................................................................................................................... 44 7.2 Appendix 2 ........................................................................................................................................... 48 7.21 Perceived CSR Histogram ........................................................................................................... 48 7.22 Brand Loyalty Histogram ............................................................................................................ 48 7.23 Perceived CSR Normal Q-Q Plot ............................................................................................... 49 7.24 Brand Loyalty Normal Q-Q Plot ................................................................................................ 49 7.25 Perceived CSR Boxplot ................................................................................................................. 50 7.26 Brand Loyalty Boxplot .................................................................................................................. 50 7.3 Appendix 3 ........................................................................................................................................... 51 7.4 Appendix 4 ........................................................................................................................................... 52 7.5 Appendix 5 ........................................................................................................................................... 53 7.6 Appendix 6 ........................................................................................................................................... 54
8.0 Bibliography ............................................................................................................................ 54
Author’s Bio ..................................................................................................................................... 58
Acknowledgements

5
I would like to thank my supervisor, Prof Monika Kostera for her guidance and interest in my dissertation. Her time and supervision has helped me greatly throughout my dissertation. I would also like to thank all individuals who took time to participate in this research project.
1.0 Introduction
6
Both corporate social responsibility (CSR) and brand loyalty represent important theoretical and practical issues, especially due to the fact they can produce many benefits for organizations (Moisescu, 2015). CSR is a concept with many definitions and practices, and is often understood and implemented differently within each company and country. However, whatever definition is used to define CSR, the purpose of the concept is to drive change towards sustainability.
1.1 History of CSR in the Business Environment There was once a time when the expectations of businesses were solely to make a profit, with little consideration for society in business decisions. However, this is no longer the case, with CSR now representing a significant aspect of business operations. This transformation is aptly illustrated by Lee’s (2008) example of Ford Motor Company, which states that in 1919, the Ford shareholders agreed to the decision of the Supreme Court to grant Dodge brothers their request of maximum dividends. Such a decision derided Henry Ford’s (company president) intention to reinvest profits on plant expansion, and stated that the purpose of his company was to serve society. Lee (2008) highlights how in 1999, Ford’s grandson, William Clay Ford Jr tried to conscience the company’s shareholders the importance of business as a service to society. This time, the younger Ford received considerable support from various stakeholders, including shareholders. The emerging institutional infrastructure of CSR has brought new rules of behaviour, particularly for large, multinational companies. This largely occurred in the 1990s, where Rosamaria and Robert (2011: 536) state, “the idea of CSR became almost universally sanctioned”. In accordance with Waddock (2008), large corporations are now expected to:
- Produce sustainability; - Live up to different principles and standards depending on their industry; - Be more transparent about their activities; and - Engage with stakeholders in dialogue, partnerships, and action.
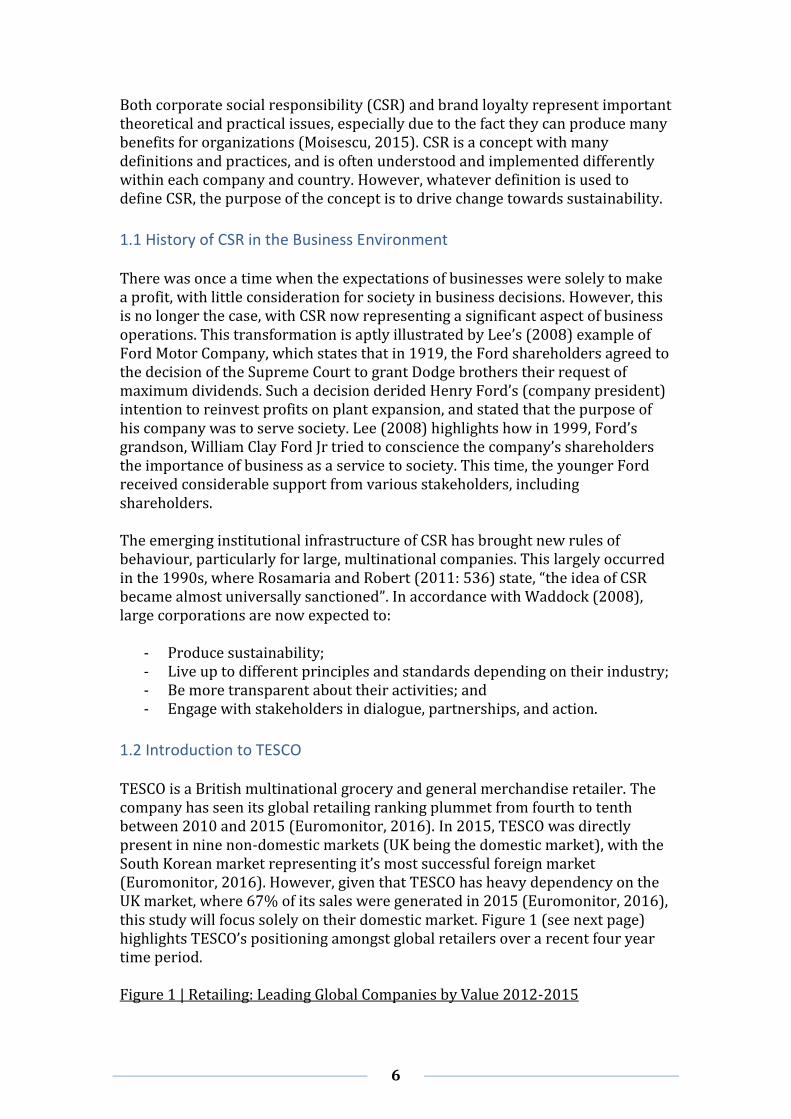
1.2 Introduction to TESCO TESCO is a British multinational grocery and general merchandise retailer. The company has seen its global retailing ranking plummet from fourth to tenth between 2010 and 2015 (Euromonitor, 2016). In 2015, TESCO was directly present in nine non-domestic markets (UK being the domestic market), with the South Korean market representing it’s most successful foreign market (Euromonitor, 2016). However, given that TESCO has heavy dependency on the UK market, where 67% of its sales were generated in 2015 (Euromonitor, 2016), this study will focus solely on their domestic market. Figure 1 (see next page) highlights TESCO’s positioning amongst global retailers over a recent four year time period. Figure 1 | Retailing: Leading Global Companies by Value 2012-2015
7
Source: Euromonitor (2016), Available at: http://www.portal.euromonitor.com.ezphost.dur.ac.uk/portal/analysis/tab#
1.3 TESCO’s CSR history TESCO has often been seen as a corporately responsible company over the years. The company’s CSR policy of delivering unbeatable value, playing their part in local communities, working with their customers to help the environment, and supporting good causes, has often been backed up by their actions and policies (Samy et al., 2010). Having said that, the company has seen their ethical stance questioned over the past few years. Issues such as the 2013 horse-meat scandal, and a recent criminal investigation due to accounting irregularities (Financial Times, 2016) have resulted in extensive public criticism towards TESCO’s ability to act responsibly in their actions and practices.
1.4 Purpose of Study This study is being carried out due to the lack of literature on the relationship between consumer perceptions of CSR and brand loyalty in the UK consumer market. The study will attempt to build off previous literature in this topic area, offering findings into a new consumer market. The study will provide a platform
8
for areas of future research in the topic area, highlighting the next direction research should be taken.
1.5 Structure of Paper The next chapter will consist of a literature review of the concept of CSR, firstly treating the concept exclusively, and then by the highlighting relevant literature on the specific relationship between perceived CSR and brand loyalty. Chapter 3 will entail the methodology behind this study, presenting how the study was conducted and how the data was obtained. The results will be presented in Chapter 4, followed by a discussion of how the findings compare to the literature in Chapter 5. The paper will be rounded off by a conclusion, in which avenues for future research are also explored.
2.0 Literature Review
2.1 Introduction
9
This chapter will conduct a review of the current literature in an attempt to provide understanding to the topic of this research paper. Firstly, extensive literature on CSR, including relevant theories, will be reviewed. Once a comprehensive review of CSR has been completed, a review of the literature on perceived CSR will be discussed. After such evaluation, the available research on the relationship between perceived CSR and brand loyalty can finally be considered, during which hypotheses for this study will be formed.
2.2 CSR – An Emerging Research Area CSR has experienced a journey unique to almost any other pantheon in management literature (Crane et al., 2008). While the scholarly literature dates back to the 1950s, the rise to prominence of CSR in the 1900s and 2000s highlights the growing literature being formed in the field of CSR. While academic journals such as the Journal of Business Ethics, and Business Ethics Quarterly have always been at the fulcrum of discussion on CSR, the rise in popularity of the topic has led to a representation in mainstream journals (Crane et al., 2008). Special issues dedicated to CSR have started to appear in journals such as the Journal of Management Studies, but also to some more critical organization theory journals (e.g. Organization Studies). Consequently, such depth of literature in the CSR field has generated a wide-range of potential research areas involving the phenomenon.
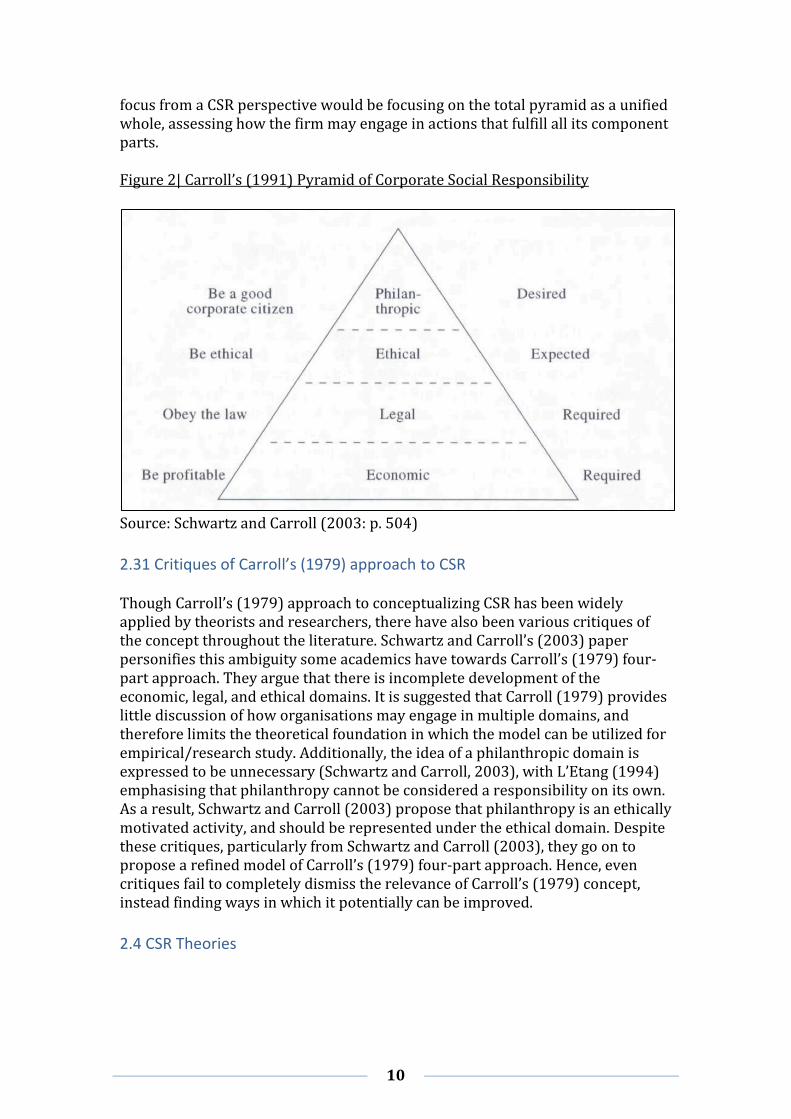
2.3 Carroll’s (1979) four domains of CSR Carroll (1979) presented one of the early approaches to systemizing the concept of CSR. In order to clarify the notion of CSR, Carroll (1979) developed a four-domain concept encompassing economic, legal, ethical, and philanthropic organisational responsibilities. Many theorists and empirical researchers utilize Carroll’s four domains of CSR when approaching the topic, with Schwartz and Carroll (2003) suggesting that the domains remain a leading paradigm of CSR in the social issues of management. In terms of the purpose of the four domains, Carroll (1979) proposes that the framework categorizes the responsibilities that society expects businesses to assume. The possibility of movement between the domains, as argued by Carroll (1979), is a fundamental function of the concept, dismissing previous scholars who advocated an economic emphasis to be separate from a social emphasis. For example, Carroll (1979) suggests that ethical expectations (businesses should develop safe products) can transform into legal expectations (requirements of Consumer Product Safety Commission). Furthermore, Carroll (1991) later developed upon the four domains of CSR, constructing a pyramid to illustrate the concept further (see Figure 2 below). The pyramid portrays the notion that CSR comprises distinct components, which together, constitute the whole. Furthermore, Carroll (1991) highlights how the pyramid visually shows managers that the different types of obligations are in a constant but dynamic tension with one another. Such a concept can bring forth one of the key debates in the CSR literature to date, the conflict between a firm’s “concern for profit” versus “concern for society”. Nevertheless, there is suggestion that this is an oversimplification, as Carroll (1991) argues that the
10
focus from a CSR perspective would be focusing on the total pyramid as a unified whole, assessing how the firm may engage in actions that fulfill all its component parts. Figure 2| Carroll’s (1991) Pyramid of Corporate Social Responsibility
Source: Schwartz and Carroll (2003: p. 504)
2.31 Critiques of Carroll’s (1979) approach to CSR Though Carroll’s (1979) approach to conceptualizing CSR has been widely applied by theorists and researchers, there have also been various critiques of the concept throughout the literature. Schwartz and Carroll’s (2003) paper personifies this ambiguity some academics have towards Carroll’s (1979) four-part approach. They argue that there is incomplete development of the economic, legal, and ethical domains. It is suggested that Carroll (1979) provides little discussion of how organisations may engage in multiple domains, and therefore limits the theoretical foundation in which the model can be utilized for empirical/research study. Additionally, the idea of a philanthropic domain is expressed to be unnecessary (Schwartz and Carroll, 2003), with L’Etang (1994) emphasising that philanthropy cannot be considered a responsibility on its own. As a result, Schwartz and Carroll (2003) propose that philanthropy is an ethically motivated activity, and should be represented under the ethical domain. Despite these critiques, particularly from Schwartz and Carroll (2003), they go on to propose a refined model of Carroll’s (1979) four-part approach. Hence, even critiques fail to completely dismiss the relevance of Carroll’s (1979) concept, instead finding ways in which it potentially can be improved.
2.4 CSR Theories
11
There are three theories that are often used to explain CSR in the literature. These theories are Stakeholder theory, Social Contracts theory, and Legitimacy theory.
2.41 Stakeholder Theory A stakeholder theory of the firm is used as a basis to analyse those groups to whom the firm should be responsible (Moir, 2001). From this perspective, Freeman (1984) suggests that the firm can be described as a series of connections of stakeholders that the managers of the organisation attempt to manage/satisfy. Freeman (1984: 46) presents a classic definition of stakeholders, stating that a stakeholder “is any group or individual who can affect or is affected by the achievement of the organization’s objectives”. While Freeman’s (1984) definition may be outdated in the modern world of business given that objectives alone may not be enough to classify the stakeholder groups of many organisations due to the global nature of business, it does provide clarity to the application of stakeholder theory. Ordinarily, stakeholders are analysed into primary and secondary stakeholders. A primary stakeholder is one without whose continuing participation the corporation cannot survive as a going concern (Clarkson, 1995). Therefore, Clarkson (1995) suggests that the corporation’s survival depends on the managerial ability to create sufficient wealth, value, or satisfaction to each primary stakeholder group, so that each group continues to be part of the organization’s stakeholder system. Failure to retain the participation of such primary stakeholder groups will result in the failure of that corporate system (Clarkson, 1995). According to Clarkson (1995), primary groups include shareholders/investors, employees, customers and suppliers, together with what is defined as the public stakeholder group. The public stakeholder group includes governments and communities that provide infrastructures and markets, whose laws/regulations must be obeyed, and to who taxes may be due. Nevertheless, such a proposition should be treated with caution. The classification of “primary stakeholders” could be one of the major flaws impacting on corporate irresponsibility in the current business environment. The House of Commons (2016) report on the irresponsible actions of Sir Phillip Green at British high street store BHS highlight how executives can take this “primary stakeholder” approach too far, over-looking morality issues for the sake of over-satisfying shareholders/investors to whom Sir Phillip Green felt he was responsible for. Secondary stakeholder groups are defined as those who “influence or affect, or are influenced/affected by the corporation, but they are not engaged in transactions with the corporation and are not essential for its survival” (Clarkson, 1995: 106). Secondary stakeholders may be opposed to the policies or programs that a corporation has adopted to fulfill its responsibilities to the primary stakeholders. The media and a wide range of special interest are considered secondary stakeholders under the definition provided by Clarkson (1995). Consequently, such groups have the capacity to mobilize public opinion in favor of, or in opposition to, a corporations performance/decisions. Reverting back to the Sir Phillip Green inquiry, maybe if such consideration had been made to these secondary stakeholder groups then BHS may have been able to survive, and avoided such irresponsible actions that were made.
12
However, as Moir (2001) points out, there is a major divide within stakeholder theory as to whether it is a coherent theory or a set of theories. More accurately, Moir (2001) offers the issue as to whether stakeholder theory is a normative theory based upon largely ethical propositions or an empirical/instrumental theory. This divide represents a contentious area within the literature. Instrumental theory is of particular interest to theorists with a social science orientation, where certain outcomes will be obtained if certain behaviors are adopted (Jones and Wicks, 1999). One form of instrumental theory, advanced by Jones (1995), is that if firms contract with their stakeholders on the basis of mutual trust and cooperation, they will have a competitive advantage over firms that do. In contrast, some stakeholder theorists take an approach that differs substantially from orthodox social science. Jones and Wicks (1999) state that rather than collecting data and using scientific methods to test hypotheses, this group focuses on normative issues. One supporter of this approach, Boatright (1994) cited in Jones and Wicks (1999), follow an approach of inquiry that focuses on what moral obligations stakeholder theory places on managers, particularly the relative importance of obligations to shareholders as appose to other stakeholder groups. As a result of this ambiguity towards stakeholder theory, Jones and Wicks (1999) proposed a convergent stakeholder theory. This approach encompasses instrumental theory, which is based on normative groundings. They suggest that this integration appears to be successful despite claims from theorists such as Donaldson (1994) that normative and empirical elements can be linked only in the most superficial manner.
2.42 Social Contracts Theory
“Society is a series of social constructs between members of society and society itself” Gray et al. (1996).
When thinking about CSR, an alternative possibility to the stakeholder theory is not that businesses might act in a responsible manner due to their commercial interest, but because it is part of how society implicitly expects businesses to operate (Moir, 2001). Given this possibility, Donaldson and Dunfee (1999) developed an integrative social contracts theory as a way for managers to make decisions in an ethical context. They argue that business is an artificial endeavor that is closely tied to its social context. Gosling and Haung (2009) suggest that this implies ethical choices made in business should not be divorced from the environment, but embedded within the situational norms and practices of the community within the business operates. The social contracts that exist in the community serve as microsocial contracts (Gosling and Haung, 2009). Therefore, as Moir (2001) states, a microsocial contract in the community would be an expectation that businesses provide some support to their local community. In this case, the specific form of involvement would be the microsocial contract. As a result, it is argued that companies who adopt this particular social contracts view would describe their involvement as part of “societal expectation”. Donaldson and Dunfee (1994) suggest that social contracts theory is superior to stakeholder theory as it reflects the context-specific complexity of business situations. Furthermore, they propose that social contracts allow normative and empirical factors to
13
harmonize; an issue stakeholder theory fails to address. Nevertheless, Moir (2001) illustrates one of the limitations with regards to social contracts theory. Regarding companies who describe their involvement as part of “societal expectation”, Moir (2001) argues that while this could explain the initial motivation, it might not explain the totality of their involvement. It is proposed that the specific motivation for businesses may link to gaining and maintaining legitimacy, as put forth by Suchman (1995). Moreover, the foundation of the social contracts theory assumes that a sort of implicit social contract between business and society exists (Garriga and Mele, 2004). But it is often seen in the current business environment that this assumption fails to represent all corporations operating today.
2.43 Legitimacy Theory “A generalized perception or assumption that the actions of an entity are desirable,
proper, or appropriate within some socially constructed system of norms, values, beliefs, and definitions”. Legitimacy as defined by Suchman (1995: 574.)
In recent years, many corporations have been involved in conflicts with civil society, and as a result, their legitimacy has been challenged (Palazzo and Scherer, 2006). Therefore, legitimacy has become a very critical issue for corporations, especially for those who operate globally (an increasing number). Suchman (1995) identifies three types of organisational legitimacy in his theory: Pragmatic; Cognitive; Moral. Pragmatic legitimacy results from the calculations of self-interested individuals who are part of the organization’s wider audience, e.g. the organization’s stakeholders (Suchman, 1995). Such individuals will prescribe legitimacy to the corporation as long as they perceive they will benefit from the corporation’s activities. Cognitive legitimacy emerges when the societal context regards an organization and its output, as inevitable and necessary (Palazzo and Scherer, 2006). As cognitive legitimacy operates mainly at the subconscious level, Oliver (1991) argues that it is difficult for the organization to directly influence and manipulate perceptions strategically. Conversely, moral legitimacy refers to conscious moral judgments on the organization’s output, procedures, structures, and leaders. Suchman (1995) suggests that giving and considering reasons to justify certain actions, practices, or institutions socially construct moral legitimacy to an organisation. Rather than manipulating and persuading audiences (involved in pragmatic and cognitive legitimacy), the corporation is challenged to convince others through reasonable arguments (Palazzo and Scherer, 2006). However, while there have been various scholars supporting the concept of legitimacy theory, there is some suggestion that the theory needs to be treated with caution in the modern business environment. Palazzo and Scherer (2006) personify this view. They propose that in the current transition from a stable
14
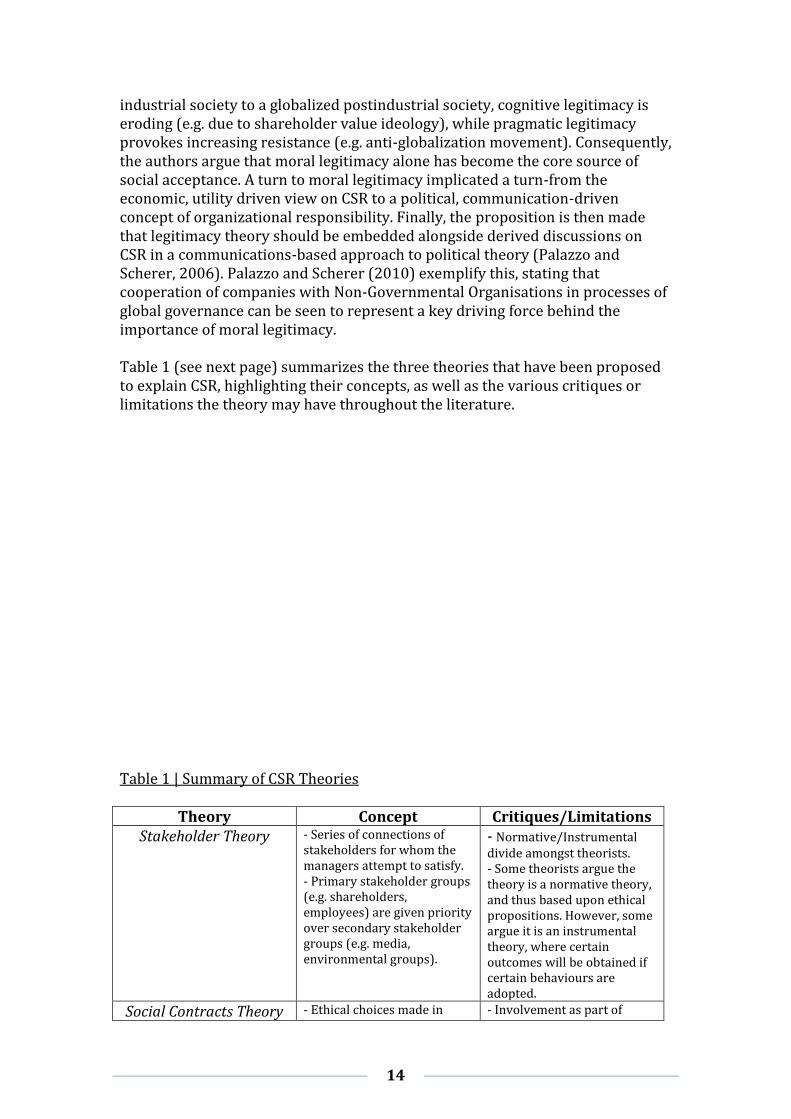
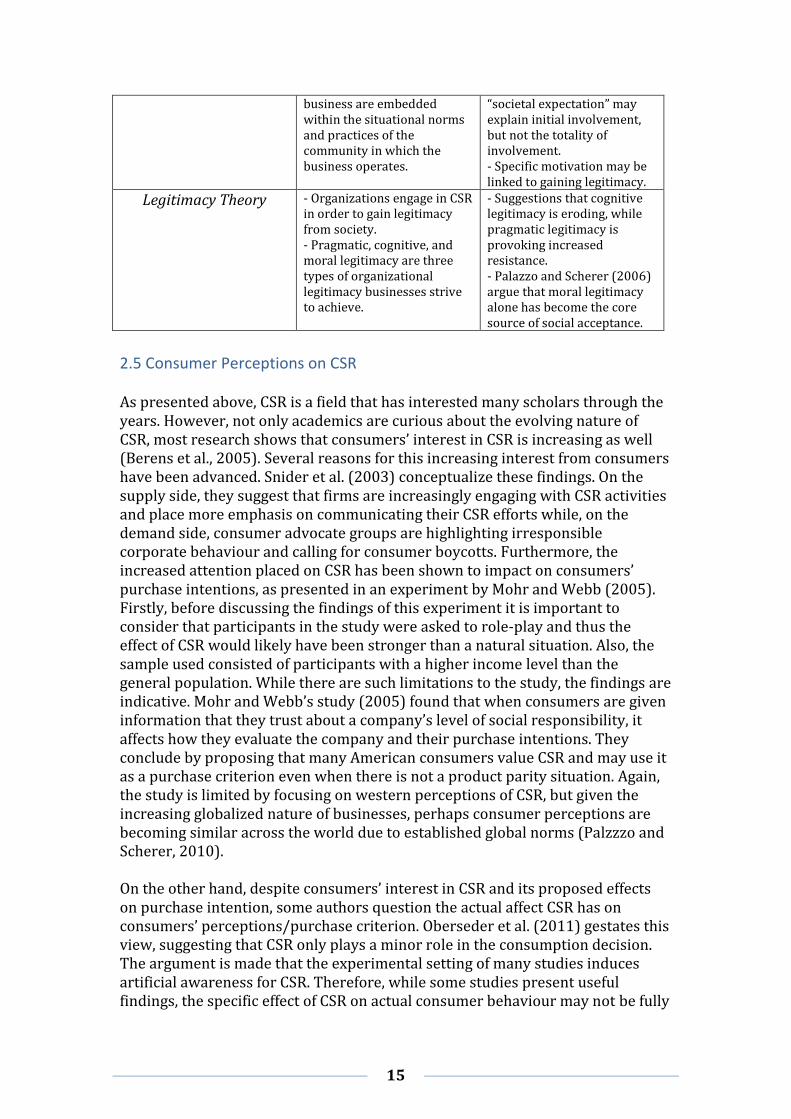
industrial society to a globalized postindustrial society, cognitive legitimacy is eroding (e.g. due to shareholder value ideology), while pragmatic legitimacy provokes increasing resistance (e.g. anti-globalization movement). Consequently, the authors argue that moral legitimacy alone has become the core source of social acceptance. A turn to moral legitimacy implicated a turn-from the economic, utility driven view on CSR to a political, communication-driven concept of organizational responsibility. Finally, the proposition is then made that legitimacy theory should be embedded alongside derived discussions on CSR in a communications-based approach to political theory (Palazzo and Scherer, 2006). Palazzo and Scherer (2010) exemplify this, stating that cooperation of companies with Non-Governmental Organisations in processes of global governance can be seen to represent a key driving force behind the importance of moral legitimacy. Table 1 (see next page) summarizes the three theories that have been proposed to explain CSR, highlighting their concepts, as well as the various critiques or limitations the theory may have throughout the literature. Table 1 | Summary of CSR Theories
Theory Concept Critiques/Limitations Stakeholder Theory - Series of connections of
stakeholders for whom the managers attempt to satisfy. - Primary stakeholder groups (e.g. shareholders, employees) are given priority over secondary stakeholder groups (e.g. media, environmental groups).
- Normative/Instrumental divide amongst theorists. - Some theorists argue the theory is a normative theory, and thus based upon ethical propositions. However, some argue it is an instrumental theory, where certain outcomes will be obtained if certain behaviours are adopted.
Social Contracts Theory - Ethical choices made in - Involvement as part of
15
business are embedded within the situational norms and practices of the community in which the business operates.
“societal expectation” may explain initial involvement, but not the totality of involvement. - Specific motivation may be linked to gaining legitimacy.
Legitimacy Theory - Organizations engage in CSR in order to gain legitimacy from society. - Pragmatic, cognitive, and moral legitimacy are three types of organizational legitimacy businesses strive to achieve.
- Suggestions that cognitive legitimacy is eroding, while pragmatic legitimacy is provoking increased resistance. - Palazzo and Scherer (2006) argue that moral legitimacy alone has become the core source of social acceptance.
2.5 Consumer Perceptions on CSR As presented above, CSR is a field that has interested many scholars through the years. However, not only academics are curious about the evolving nature of CSR, most research shows that consumers’ interest in CSR is increasing as well (Berens et al., 2005). Several reasons for this increasing interest from consumers have been advanced. Snider et al. (2003) conceptualize these findings. On the supply side, they suggest that firms are increasingly engaging with CSR activities and place more emphasis on communicating their CSR efforts while, on the demand side, consumer advocate groups are highlighting irresponsible corporate behaviour and calling for consumer boycotts. Furthermore, the increased attention placed on CSR has been shown to impact on consumers’ purchase intentions, as presented in an experiment by Mohr and Webb (2005). Firstly, before discussing the findings of this experiment it is important to consider that participants in the study were asked to role-play and thus the effect of CSR would likely have been stronger than a natural situation. Also, the sample used consisted of participants with a higher income level than the general population. While there are such limitations to the study, the findings are indicative. Mohr and Webb’s study (2005) found that when consumers are given information that they trust about a company’s level of social responsibility, it affects how they evaluate the company and their purchase intentions. They conclude by proposing that many American consumers value CSR and may use it as a purchase criterion even when there is not a product parity situation. Again, the study is limited by focusing on western perceptions of CSR, but given the increasing globalized nature of businesses, perhaps consumer perceptions are becoming similar across the world due to established global norms (Palzzzo and Scherer, 2010). On the other hand, despite consumers’ interest in CSR and its proposed effects on purchase intention, some authors question the actual affect CSR has on consumers’ perceptions/purchase criterion. Oberseder et al. (2011) gestates this view, suggesting that CSR only plays a minor role in the consumption decision. The argument is made that the experimental setting of many studies induces artificial awareness for CSR. Therefore, while some studies present useful findings, the specific effect of CSR on actual consumer behaviour may not be fully
16
captured. Secondly, Oberseder et al. (2011) say most studies tend to suffer from a social desirability bias. This means that asked, consumers declare their willingness and motivation to consider CSR, but when it comes to real consumption, only a very few take account of CSR. In fact, the finding is made that consumer evaluations of CSR initiatives is a complex and hierarchical structured process during which consumers distinguish between core, central, and peripheral factors. While Oberseder et al. (2011) present a critique of the impact of CSR on consumer perceptions; they do acknowledge the argument presented by Pomering and Dolnicar (2009). The authors emphasise that when customers are made aware of what CSR is, it does appear to lead to positive attitudes and strong behavioural intentions toward buying products from a socially responsible company. Consequently, it is suggested that communicating CSR activities is essential to enhance CSR awareness. This particular area of research provides a sense of common ground among scholars investigating the impact of CSR on consumer perceptions. Pirsch et al. (2007) provide more depth to this matter, stating that institutional programs (see definition below) particularly can have a greater impact on consumer attitudes towards the company, as appose to promotional CSR programs, which are targeted at selling products.
“A comprehensive approach to CSR, attempting to fulfill a company’s social obligations across all stakeholder groups and touching on all aspects of the
company”. Institutional CSR programs (Pirsh et al., 2007: 126).
2.6 Perceived CSR and Brand Loyalty As presented above, there has been much research on perceived CSR and it’s impacts on consumer behaviour. As well as this relationship, much attention in the literature has been given to CSR and brand loyalty. However, Moisescu (2015) highlights how further and deeper investigation of the impact of perceived CSR and brand loyalty is needed. In terms of the concept of brand loyalty, the main debate in the literature centers on its exclusive versus non-exclusive nature, and specifically its behavioural and/or attitudinal character (Moisescu, 2015). Kahn et al. (1986), cited in Bandyopadhyay and Martell (2007), represent a collection of authors approaching brand loyalty from the behavioural perspective. They believe that repeat purchasing can capture the loyalty of a customer towards a particular brand. Nevertheless, there have been strong critiques of this approach to defining brand loyalty. While some authors have completely dismissed the approach of equating behaviour patterns with preferences to infer loyalty, a recent study by Oliver (1999) presents a more balanced argument towards the limitations of the behavioural perspective. Oliver (1999) acknowledges that customer satisfaction developed by way of product usage, is a necessary step in loyalty formation. Having said that, it is highlighted that it becomes less significant as loyalty begins to evolve through other mechanisms, particularly individual fortitude and social bonding. The degree to which the consumer resists competitive pressure to switch over to another brand, and the degree to which society supports the consumer to remain loyal represent these two
17
mechanisms. Such work has prompted understanding of brand loyalty beyond behavioural measures. Altitudinal influences, as proposed by Dick and Basu (1994), are seen as a way of extending the understanding of brand loyalty. Jacoby and Kyner (1973) express this view of an attitudinal approach in their definition of brand loyalty. They define loyalty as a set of six necessary conditions. One of the six conditions is a function of psychological processes, and the authors argue that it is the evaluation of this process that makes an individual develop a commitment towards a brand. Moisescu (2015) expresses how this approach to defining brand loyalty has enjoyed wide spread support throughout the literature, giving that it recognizes brand loyalty is not exclusive, rather that it is reflected by both repeat buying behaviour and psychological processes. Several studies, albeit limited in the wider scheme of the topics, have investigated the relationship between customer’s perception of CSR and brand loyalty. While there is no current literature found relating this relationship to current supermarket chains, they provide important insights from a multi-sectorial perspective. Stanaland et al.’s (2011) study investigating US customers of companies from several industries is an example of such research in the literature. The scholars found that perceived CSR (measured as commitment to ethics principles, respect to employees, long-term success, and playing a role in society that goes beyond the generation of profits) was positively related to consumer loyalty. In this case, the higher the consumer’s perception of a particular company, the more brand loyal they would be to that company, and vice versa. Nevertheless, the authors undertake their analysis in a multi-faceted manner, and thus the direct attribution of perceived CSR on brand loyalty is limited to an extent. For instance, Stanaland et al. (2011) say that consumer trust and perceived corporate reputation are other factors that impact on brand loyalty. Garcia et al. (2005), cited in Lee et al. (2012), support these findings from Stanaland et al. (2011), suggesting that socially responsible behaviour has a direct and positive relationship on consumers’ loyalty towards the firm. Reasoning behind this positive association can be found in Brown and Dacin’s (1997) work, where they state that the perception of socially responsible behaviour can strengthen commitment toward a brand since the behaviour transmits character, a system of differentiating values, respect for customers, and a concern for serving them correctly. Hypothesis 1: Consumer perception of CSR has a positive impact on brand loyalty. Conversely, some studies in the literature have found contrasting results to the relationship between perceived CSR and brand loyalty. For example, a survey carried out by Salmones et al. (2005) amongst 689 consumers from Spain, found that there was no direct relation between the perception of social responsibility and consumers’ loyalty towards the firm. They suggest that the weight of the service valuation in loyalty is very strong, such that it becomes its maximum antecedent. Despite that, they do acknowledge that CSR does influence brand loyalty indirectly via the overall valuation the user makes of the service received. However, when reflecting on their study, Salmones et al. (2005) highlight how their results could have been different if they had taken account of a previous
18
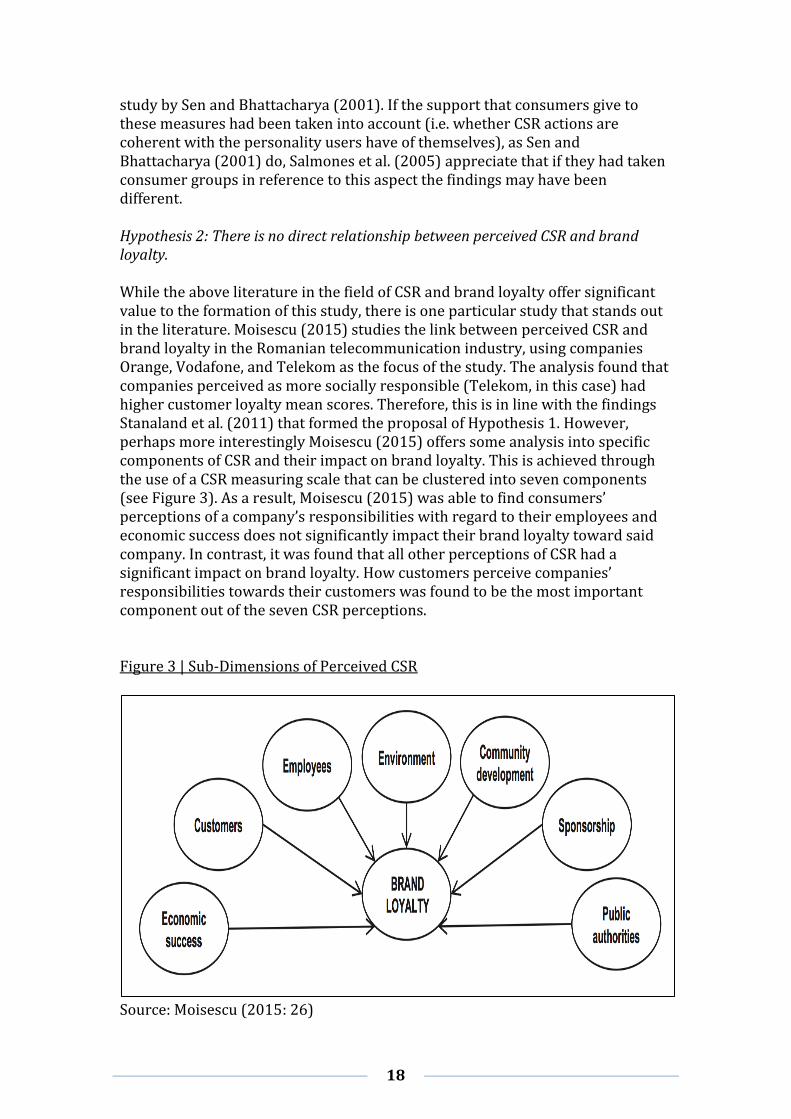
study by Sen and Bhattacharya (2001). If the support that consumers give to these measures had been taken into account (i.e. whether CSR actions are coherent with the personality users have of themselves), as Sen and Bhattacharya (2001) do, Salmones et al. (2005) appreciate that if they had taken consumer groups in reference to this aspect the findings may have been different. Hypothesis 2: There is no direct relationship between perceived CSR and brand loyalty. While the above literature in the field of CSR and brand loyalty offer significant value to the formation of this study, there is one particular study that stands out in the literature. Moisescu (2015) studies the link between perceived CSR and brand loyalty in the Romanian telecommunication industry, using companies Orange, Vodafone, and Telekom as the focus of the study. The analysis found that companies perceived as more socially responsible (Telekom, in this case) had higher customer loyalty mean scores. Therefore, this is in line with the findings Stanaland et al. (2011) that formed the proposal of Hypothesis 1. However, perhaps more interestingly Moisescu (2015) offers some analysis into specific components of CSR and their impact on brand loyalty. This is achieved through the use of a CSR measuring scale that can be clustered into seven components (see Figure 3). As a result, Moisescu (2015) was able to find consumers’ perceptions of a company’s responsibilities with regard to their employees and economic success does not significantly impact their brand loyalty toward said company. In contrast, it was found that all other perceptions of CSR had a significant impact on brand loyalty. How customers perceive companies’ responsibilities towards their customers was found to be the most important component out of the seven CSR perceptions. Figure 3 | Sub-Dimensions of Perceived CSR
Source: Moisescu (2015: 26)
19
Hypothesis 3: Perceptions of employees and economic success responsibilities do not significantly impact on brand loyalty. Hypothesis 4: Perceptions of responsibilities toward customers have a significant impact on brand loyalty.
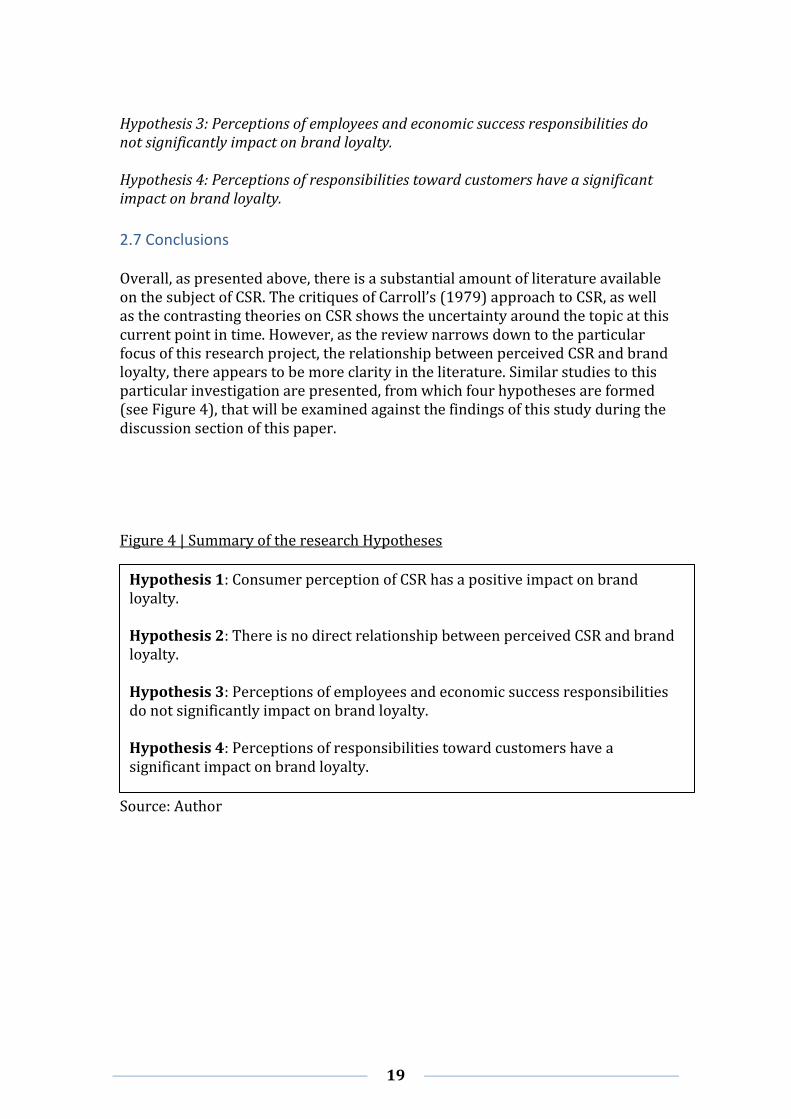
2.7 Conclusions Overall, as presented above, there is a substantial amount of literature available on the subject of CSR. The critiques of Carroll’s (1979) approach to CSR, as well as the contrasting theories on CSR shows the uncertainty around the topic at this current point in time. However, as the review narrows down to the particular focus of this research project, the relationship between perceived CSR and brand loyalty, there appears to be more clarity in the literature. Similar studies to this particular investigation are presented, from which four hypotheses are formed (see Figure 4), that will be examined against the findings of this study during the discussion section of this paper. Figure 4 | Summary of the research Hypotheses
Source: Author
Hypothesis 1: Consumer perception of CSR has a positive impact on brand loyalty. Hypothesis 2: There is no direct relationship between perceived CSR and brand loyalty. Hypothesis 3: Perceptions of employees and economic success responsibilities do not significantly impact on brand loyalty. Hypothesis 4: Perceptions of responsibilities toward customers have a significant impact on brand loyalty.
20
3.0 Methodology
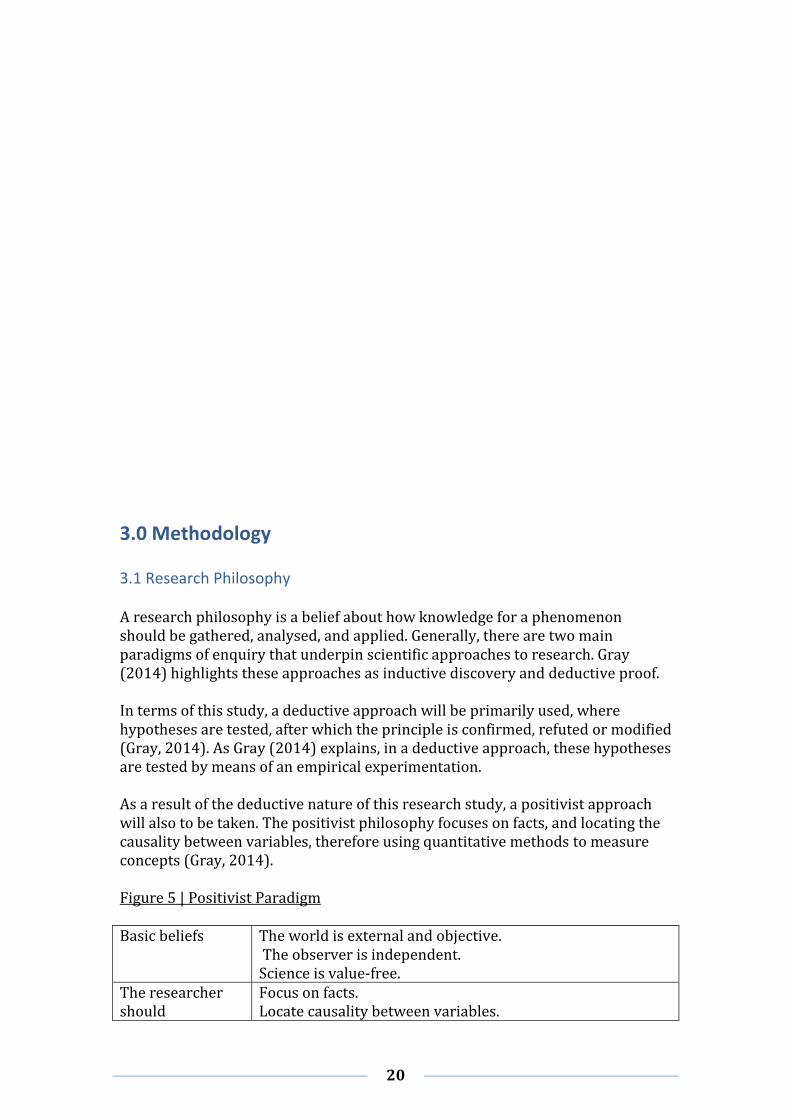
3.1 Research Philosophy A research philosophy is a belief about how knowledge for a phenomenon should be gathered, analysed, and applied. Generally, there are two main paradigms of enquiry that underpin scientific approaches to research. Gray (2014) highlights these approaches as inductive discovery and deductive proof. In terms of this study, a deductive approach will be primarily used, where hypotheses are tested, after which the principle is confirmed, refuted or modified (Gray, 2014). As Gray (2014) explains, in a deductive approach, these hypotheses are tested by means of an empirical experimentation. As a result of the deductive nature of this research study, a positivist approach will also to be taken. The positivist philosophy focuses on facts, and locating the causality between variables, therefore using quantitative methods to measure concepts (Gray, 2014). Figure 5 | Positivist Paradigm Basic beliefs The world is external and objective.
The observer is independent. Science is value-free.
The researcher should
Focus on facts. Locate causality between variables.
21
Formulate and test hypotheses (deductive approach). Methods include Operationalizing concepts so that they can be measured.
Using large samples from which to generalize to the population. Quantitative methods.
Source: Adapted from Gray (2014)
3.2 Research Design In terms of research design, it was decided that a primary research approach would be most appropriate for this particular study. Given the deductive approach to gathering research, a primary method would enable data collection specific for this research paper, which can then be discussed against the hypotheses. However, as suggested by Webster and Watson (2002), secondary research in the form of a literature review can create a firm foundation for advancing knowledge in a given research area. Therefore, the literature review enabled a comprehensive understanding of the topic; a factor Hart (2001) states is fundamental to the formation of any study. When deciding upon which primary data collection methods to use in this study, a questionnaire was chosen. Nevertheless, other methods such as interviews were also heavily considered. While it was acknowledged interviews have been widely used by scholars when investigating the topic of CSR, the study’s focus on measuring the relationships between variables meant that a questionnaire would be more suitable. Additionally, given how the aspects in this study are highly prominent in the business environment, a case study was applied to the research project. As stated by Yin (1984: 23), “case study research investigates a contemporary phenomenon within its real-life context”. Therefore, investigating perceived CSR and brand loyalty through a case study of TESCO would help connect the concepts to a current consumer market. The construction of the questionnaire presented a major issue for this research study. Neuman (2011: 313) highlights the significance of having survey questions that provide a valid and reliable measure, stating, “being valid and reliable means that the respondents should immediately grasp each question’s meaning as you intended. Answer completely and honestly, and believe that their answers are meaningful”. Because of these issues, constructing a questionnaire with completely self-designed questions was not an option. Instead using similar research studies from the literature to formulate the questionnaire was the approach chosen. The scales for the two variables were the same scales used in Moisescu’s (2015) study presented in the literature review. The perceived CSR scale is representative of Oberseder et al.’s (2014) highly validated scale in the field of measuring CSR, alongside Zeithaml et al.’s (1996) brand loyalty scale. The use of these scales to construct the questionnaire enhanced the reliability of the study in a way designing self-made questions couldn’t.
3.3 Measures and Scales
22
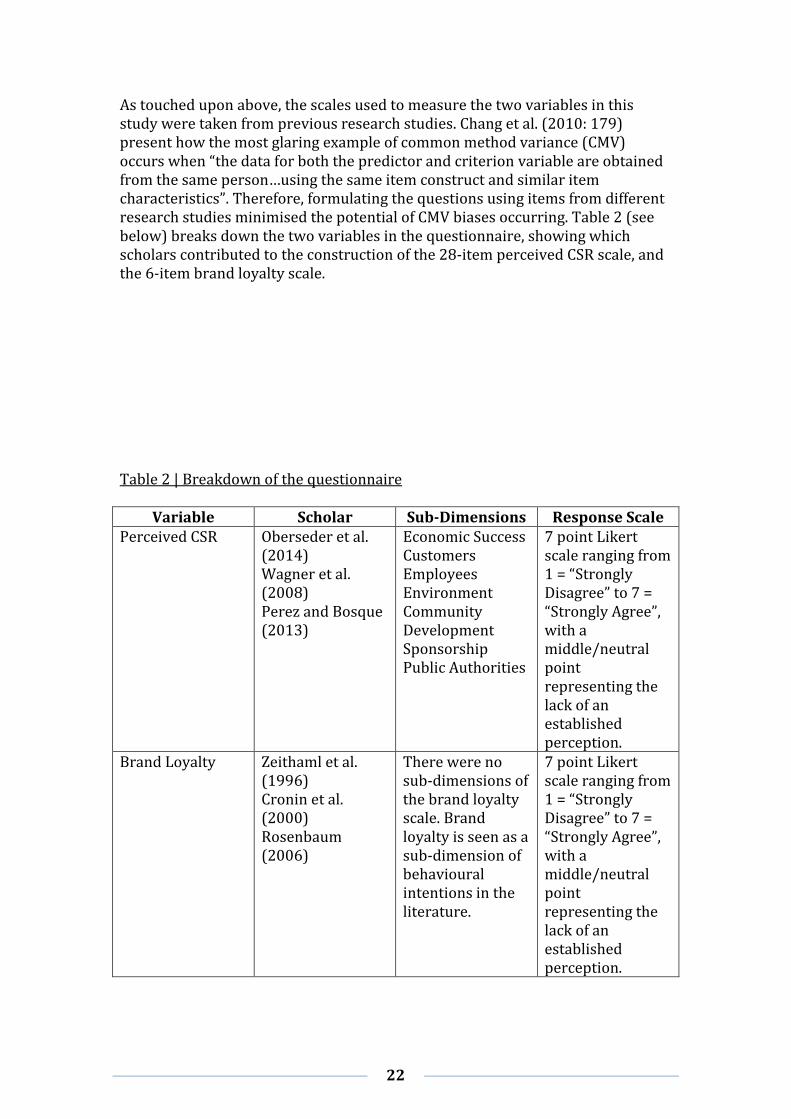
As touched upon above, the scales used to measure the two variables in this study were taken from previous research studies. Chang et al. (2010: 179) present how the most glaring example of common method variance (CMV) occurs when “the data for both the predictor and criterion variable are obtained from the same person…using the same item construct and similar item characteristics”. Therefore, formulating the questions using items from different research studies minimised the potential of CMV biases occurring. Table 2 (see below) breaks down the two variables in the questionnaire, showing which scholars contributed to the construction of the 28-item perceived CSR scale, and the 6-item brand loyalty scale. Table 2 | Breakdown of the questionnaire
Variable Scholar Sub-Dimensions Response Scale Perceived CSR Oberseder et al.
(2014) Wagner et al. (2008) Perez and Bosque (2013)
Economic Success Customers Employees Environment Community Development Sponsorship Public Authorities
7 point Likert scale ranging from 1 = “Strongly Disagree” to 7 = “Strongly Agree”, with a middle/neutral point representing the lack of an established perception.
Brand Loyalty Zeithaml et al. (1996) Cronin et al. (2000) Rosenbaum (2006)
There were no sub-dimensions of the brand loyalty scale. Brand loyalty is seen as a sub-dimension of behavioural intentions in the literature.
7 point Likert scale ranging from 1 = “Strongly Disagree” to 7 = “Strongly Agree”, with a middle/neutral point representing the lack of an established perception.
23
In the questionnaire, Oberseder et al.’s (2014) 21-item scale made up the majority of the questions in the 28-item scale measuring perceived CSR. The multigroup analyses conducted by Oberseder et al. (2014) suggested that the scale was not sensitive to a particular industry, and therefore presented particular attractiveness to this study. Furthermore, in line with Moisescu’s (2015) study, item from Wagner et al.’s (2008) and Perez and Bosque’s (2013) studies were chosen in order to diversify the CSR domains (sub-dimensions shown in Table 1) in a way Oberseder’s et al.’s (2014) scale could not provide on its own. In terms of the 6-item brand loyalty scale, four of the items from Zeithaml et al.’s (1996) 5-item scale were used, with one item being omitted due to the similarity to another of the items. One item each was also taken from Cronin et al.’s (2000) and Rosenbaum’s (2006) studies in order to reduce the CMV bias in the scale.
3.4 Data Collection In order to obtain findings for this study, the questionnaire needed to be administrated. The questionnaire was self-administered, with participants being accessed through a combination of social-media and e-mail. Neuman (2011) suggests self-administered questionnaires can cover a wide geographical area, as well as having the advantage of being conducted at a very low cost. This was particularly important given the lack of financial resources available in this study. Additionally, the use of social media in this project is in line with academic recognition that social media can play a significant role in research (Bell and Waters, 2014). A similar strategy as outlined by Minocha and Petros (2012) was formulated in order to increase the effectiveness of gathering data through social media. Firstly, a social strategy was developed, deciding with whom, and how communication would be made in order to obtain findings. Following the development of this social strategy, a digital strategy was then made, deciding which technologies to target in order to achieve the social strategy.
3.5 The Sample With relevance to the sample, data was collected through a representative sample. Non-probability sampling was used, and more explicitly non-proportional quota sampling. Neuman (2011) suggests that this approach is an acceptable alternative to probability sampling due to time or cost constraints. Relevant categories among the population were identified to capture diversity among units (e.g. male and female; age groups), and help generate a representative sample of Tesco’s UK customer base. A minimum number of sample units were assigned to each category to assure smaller groups were adequately represented in the sample.
24
The sample largely consisted of students from Durham University, England. Firstly, this allowed a large proportion of the sample to directed towards the millennial generation (19-36 yr olds), which are said to become the trend setters of tomorrow in consumer markets (James, 2015). James (2015) highlights how this generation reside in markets with a lack of brand loyalty, which businesses have yet to grasped, providing relevance to the topic of this study. Furthermore, this generation are the most technologically sophisticated, and share a large amounts of contents on social media. (James, 2015). Therefore, students provided easy accessibility given the online approach to distributing the questionnaire. Nevertheless, the questionnaire was also administrated to consumers outside of Durham University in order to provide a more representative sample of the UK retailing market, and to reduce the extent of the influence of a student-sample. After all responses had been gathered, a coding procedure was carried out. Numbers were assigned to specific variable attributes from the questionnaire, in preparation for the forthcoming statistical analysis. In this study, a statistics software named SPSS was used to analyze the raw data.
3.6 Ethical Considerations Ethical issues were treated with serious concern throughout the research study. Firstly, it was ensured that respondents had a right to privacy, which was communicated on the cover sheet (see Appendix 1) of the questionnaire. As the respondents understood that the data was confidential, they would be more likely to answer, and provide honest responses (Neauman, 2011). A second ethical issue that was addressed involved voluntary participation. In the same way as the confidentiality issue, it was made clear in the cover sheet for the questionnaire that participation was completely voluntary, and respondents could refuse to participate at any time. Furthermore, the purpose of the study was outlined in the cover sheet, allowing respondents to fully understand what their participation was going to be used for. In case there was any concerns about this a comments section was provided in order to provide comfort to the respondents.
25
4.0 Results
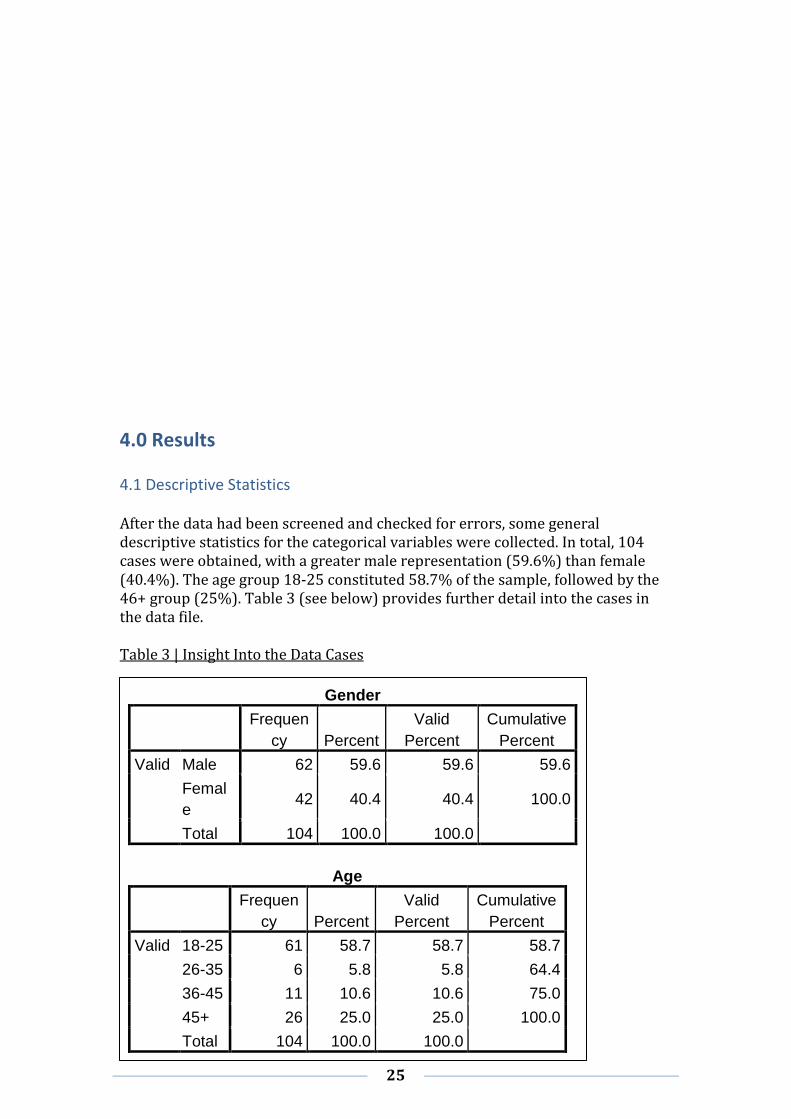
4.1 Descriptive Statistics After the data had been screened and checked for errors, some general descriptive statistics for the categorical variables were collected. In total, 104 cases were obtained, with a greater male representation (59.6%) than female (40.4%). The age group 18-25 constituted 58.7% of the sample, followed by the 46+ group (25%). Table 3 (see below) provides further detail into the cases in the data file. Table 3 | Insight Into the Data Cases
Gender
Frequen
cy Percent
Valid
Percent
Cumulative
Percent
Valid Male 62 59.6 59.6 59.6
Femal
e 42 40.4 40.4 100.0
Total 104 100.0 100.0
Age
Frequen
cy Percent
Valid
Percent
Cumulative
Percent
Valid 18-25 61 58.7 58.7 58.7
26-35 6 5.8 5.8 64.4
36-45 11 10.6 10.6 75.0
45+ 26 25.0 25.0 100.0
Total 104 100.0 100.0
26
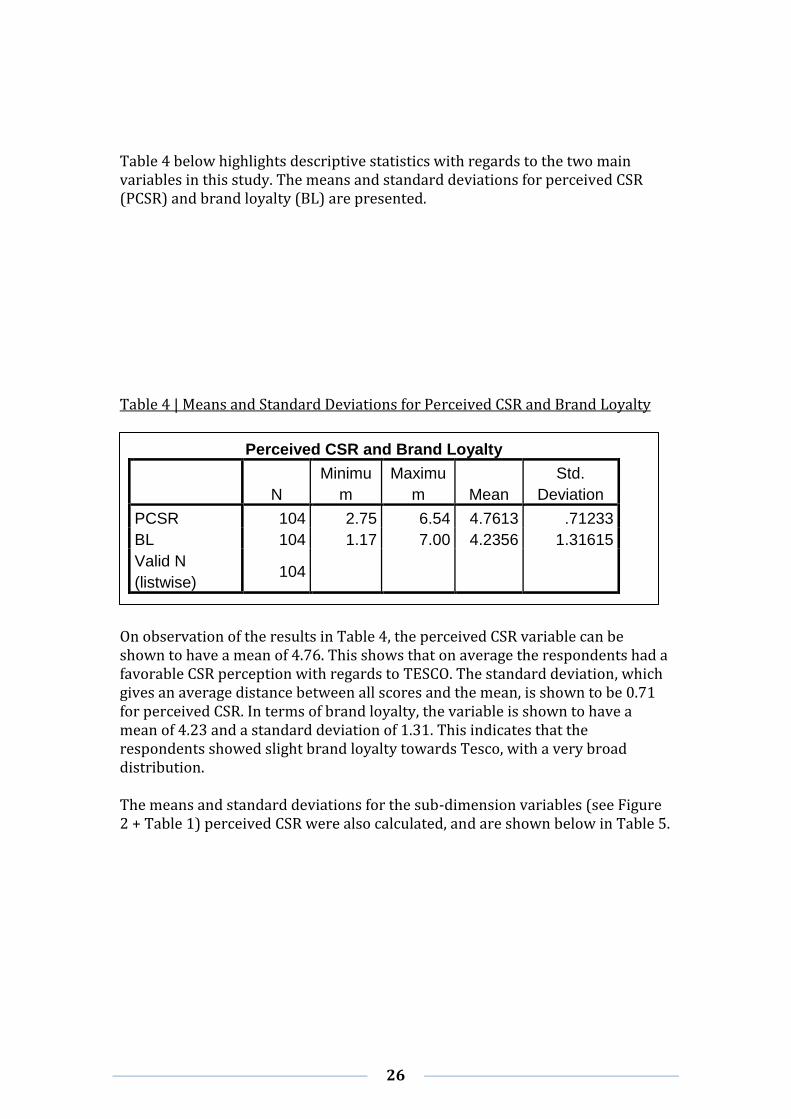
Table 4 below highlights descriptive statistics with regards to the two main variables in this study. The means and standard deviations for perceived CSR (PCSR) and brand loyalty (BL) are presented. Table 4 | Means and Standard Deviations for Perceived CSR and Brand Loyalty
On observation of the results in Table 4, the perceived CSR variable can be shown to have a mean of 4.76. This shows that on average the respondents had a favorable CSR perception with regards to TESCO. The standard deviation, which gives an average distance between all scores and the mean, is shown to be 0.71 for perceived CSR. In terms of brand loyalty, the variable is shown to have a mean of 4.23 and a standard deviation of 1.31. This indicates that the respondents showed slight brand loyalty towards Tesco, with a very broad distribution. The means and standard deviations for the sub-dimension variables (see Figure 2 + Table 1) perceived CSR were also calculated, and are shown below in Table 5.
Perceived CSR and Brand Loyalty
N
Minimu
m
Maximu
m Mean
Std.
Deviation
PCSR 104 2.75 6.54 4.7613 .71233
BL 104 1.17 7.00 4.2356 1.31615
Valid N
(listwise) 104
27
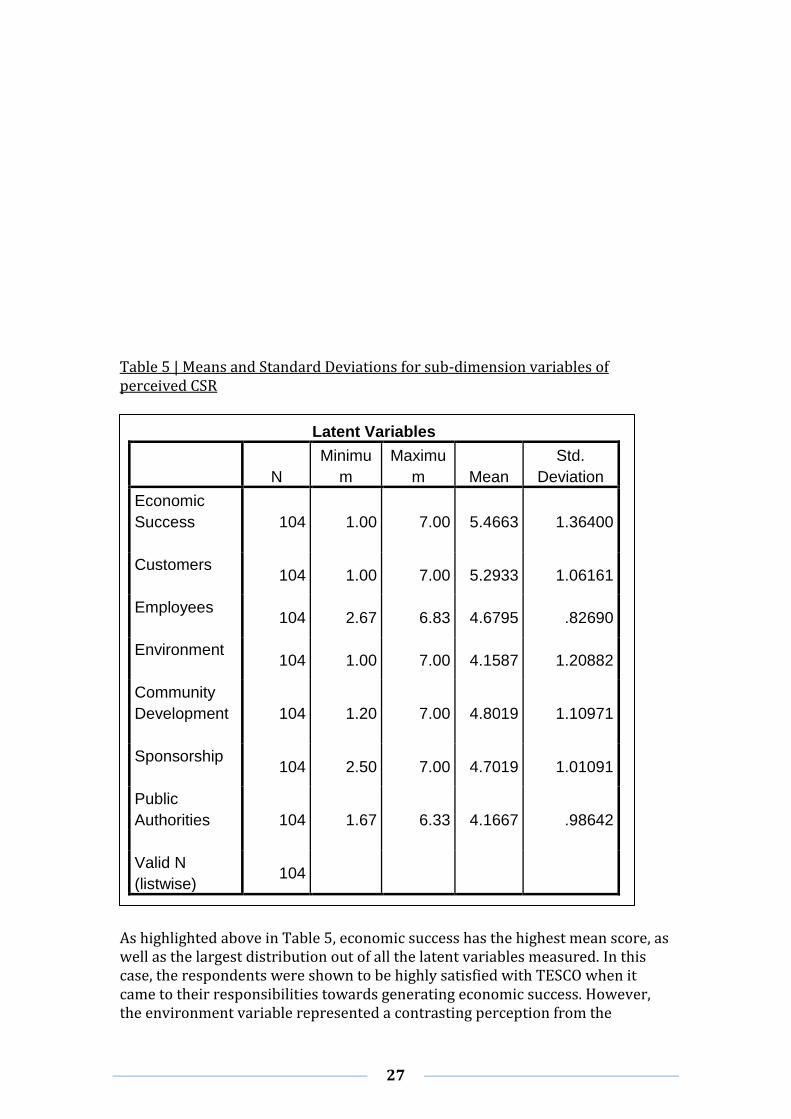
Table 5 | Means and Standard Deviations for sub-dimension variables of perceived CSR
As highlighted above in Table 5, economic success has the highest mean score, as well as the largest distribution out of all the latent variables measured. In this case, the respondents were shown to be highly satisfied with TESCO when it came to their responsibilities towards generating economic success. However, the environment variable represented a contrasting perception from the
Latent Variables
N
Minimu
m
Maximu
m Mean
Std.
Deviation
Economic
Success
104 1.00 7.00 5.4663 1.36400
Customers
104 1.00 7.00 5.2933 1.06161
Employees
104 2.67 6.83 4.6795 .82690
Environment
104 1.00 7.00 4.1587 1.20882
Community
Development
104 1.20 7.00 4.8019 1.10971
Sponsorship
104 2.50 7.00 4.7019 1.01091
Public
Authorities
104 1.67 6.33 4.1667 .98642
Valid N
(listwise) 104
28
respondents. With a mean score of 4.15, the lowest of the latent variables, respondents were shown to be doubtful over the extent to which TESCO is responsible towards the environment.
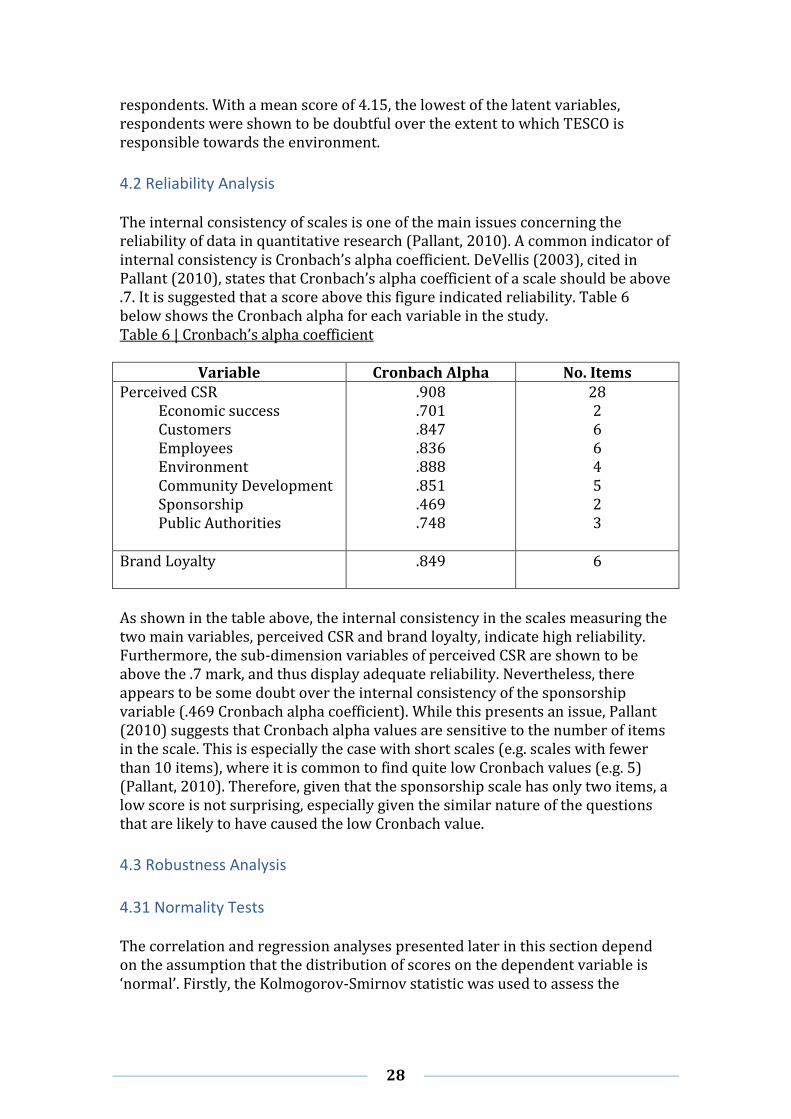
4.2 Reliability Analysis The internal consistency of scales is one of the main issues concerning the reliability of data in quantitative research (Pallant, 2010). A common indicator of internal consistency is Cronbach’s alpha coefficient. DeVellis (2003), cited in Pallant (2010), states that Cronbach’s alpha coefficient of a scale should be above .7. It is suggested that a score above this figure indicated reliability. Table 6 below shows the Cronbach alpha for each variable in the study. Table 6 | Cronbach’s alpha coefficient
Variable Cronbach Alpha No. Items Perceived CSR Economic success Customers Employees Environment Community Development Sponsorship Public Authorities
.908
.701
.847
.836
.888
.851
.469
.748
28 2 6 6 4 5 2 3
Brand Loyalty
.849 6
As shown in the table above, the internal consistency in the scales measuring the two main variables, perceived CSR and brand loyalty, indicate high reliability. Furthermore, the sub-dimension variables of perceived CSR are shown to be above the .7 mark, and thus display adequate reliability. Nevertheless, there appears to be some doubt over the internal consistency of the sponsorship variable (.469 Cronbach alpha coefficient). While this presents an issue, Pallant (2010) suggests that Cronbach alpha values are sensitive to the number of items in the scale. This is especially the case with short scales (e.g. scales with fewer than 10 items), where it is common to find quite low Cronbach values (e.g. 5) (Pallant, 2010). Therefore, given that the sponsorship scale has only two items, a low score is not surprising, especially given the similar nature of the questions that are likely to have caused the low Cronbach value.
4.3 Robustness Analysis
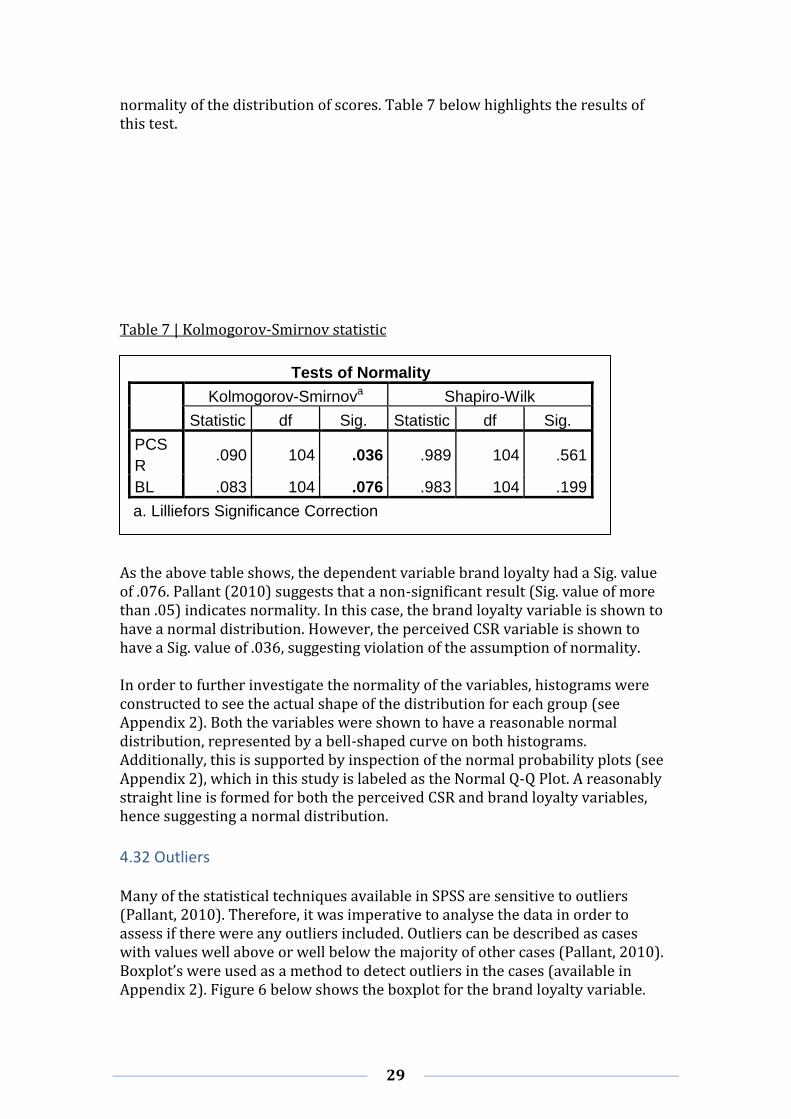
4.31 Normality Tests The correlation and regression analyses presented later in this section depend on the assumption that the distribution of scores on the dependent variable is ‘normal’. Firstly, the Kolmogorov-Smirnov statistic was used to assess the
29
normality of the distribution of scores. Table 7 below highlights the results of this test. Table 7 | Kolmogorov-Smirnov statistic
As the above table shows, the dependent variable brand loyalty had a Sig. value of .076. Pallant (2010) suggests that a non-significant result (Sig. value of more than .05) indicates normality. In this case, the brand loyalty variable is shown to have a normal distribution. However, the perceived CSR variable is shown to have a Sig. value of .036, suggesting violation of the assumption of normality. In order to further investigate the normality of the variables, histograms were constructed to see the actual shape of the distribution for each group (see Appendix 2). Both the variables were shown to have a reasonable normal distribution, represented by a bell-shaped curve on both histograms. Additionally, this is supported by inspection of the normal probability plots (see Appendix 2), which in this study is labeled as the Normal Q-Q Plot. A reasonably straight line is formed for both the perceived CSR and brand loyalty variables, hence suggesting a normal distribution.
4.32 Outliers Many of the statistical techniques available in SPSS are sensitive to outliers (Pallant, 2010). Therefore, it was imperative to analyse the data in order to assess if there were any outliers included. Outliers can be described as cases with values well above or well below the majority of other cases (Pallant, 2010). Boxplot’s were used as a method to detect outliers in the cases (available in Appendix 2). Figure 6 below shows the boxplot for the brand loyalty variable.
Tests of Normality
Kolmogorov-Smirnova Shapiro-Wilk
Statistic df Sig. Statistic df Sig.
PCS
R .090 104 .036 .989 104 .561
BL .083 104 .076 .983 104 .199
a. Lilliefors Significance Correction
30
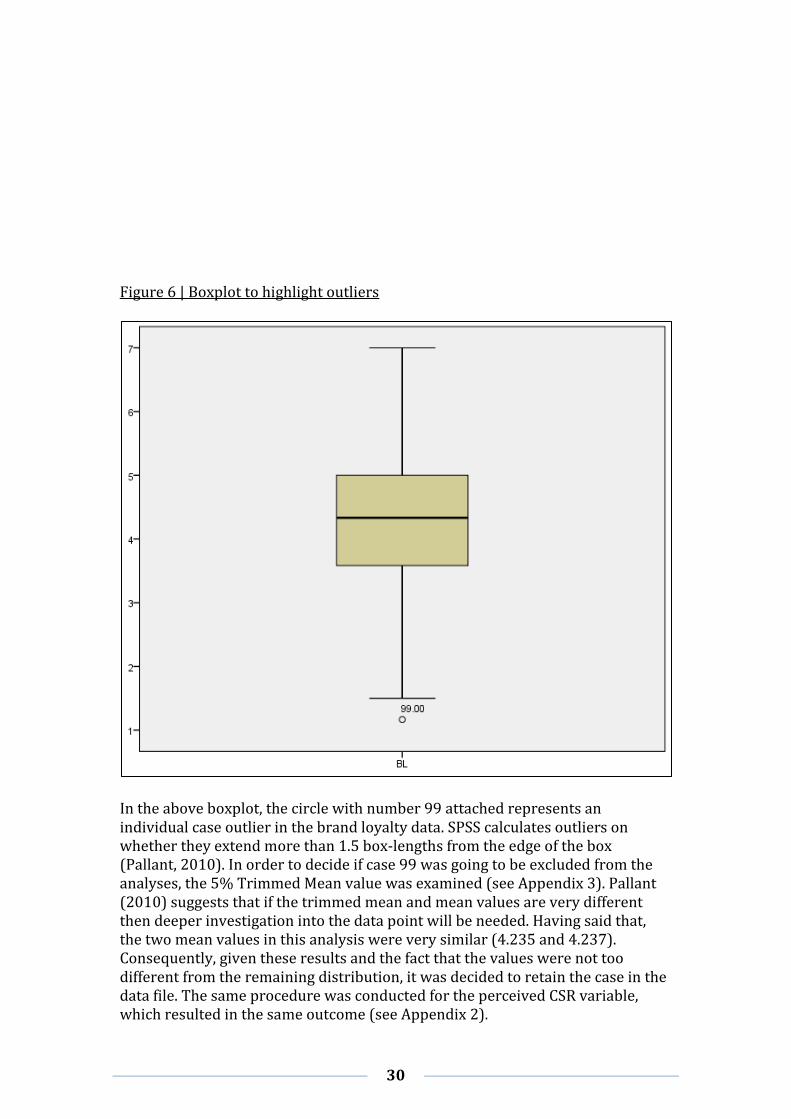
Figure 6 | Boxplot to highlight outliers
In the above boxplot, the circle with number 99 attached represents an individual case outlier in the brand loyalty data. SPSS calculates outliers on whether they extend more than 1.5 box-lengths from the edge of the box (Pallant, 2010). In order to decide if case 99 was going to be excluded from the analyses, the 5% Trimmed Mean value was examined (see Appendix 3). Pallant (2010) suggests that if the trimmed mean and mean values are very different then deeper investigation into the data point will be needed. Having said that, the two mean values in this analysis were very similar (4.235 and 4.237). Consequently, given these results and the fact that the values were not too different from the remaining distribution, it was decided to retain the case in the data file. The same procedure was conducted for the perceived CSR variable, which resulted in the same outcome (see Appendix 2).
31
4.4 Correlation Analysis Once all robustness analysis had taken place, the data was ready to be analysed in order to find a relationship between the variables. Correlation analysis was used to distinguish the strength and direction of the linear relationship between perceived CSR and brand loyalty.
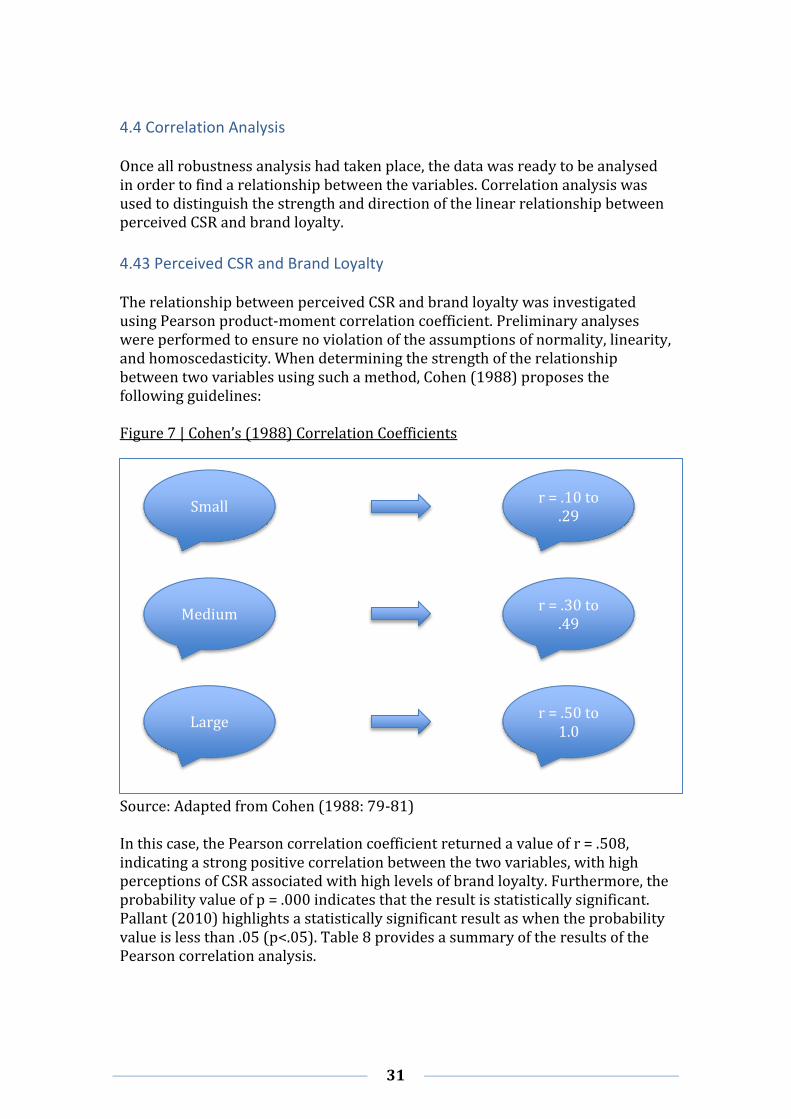
4.43 Perceived CSR and Brand Loyalty The relationship between perceived CSR and brand loyalty was investigated using Pearson product-moment correlation coefficient. Preliminary analyses were performed to ensure no violation of the assumptions of normality, linearity, and homoscedasticity. When determining the strength of the relationship between two variables using such a method, Cohen (1988) proposes the following guidelines: Figure 7 | Cohen’s (1988) Correlation Coefficients
Source: Adapted from Cohen (1988: 79-81) In this case, the Pearson correlation coefficient returned a value of r = .508, indicating a strong positive correlation between the two variables, with high perceptions of CSR associated with high levels of brand loyalty. Furthermore, the probability value of p = .000 indicates that the result is statistically significant. Pallant (2010) highlights a statistically significant result as when the probability value is less than .05 (p<.05). Table 8 provides a summary of the results of the Pearson correlation analysis.
r = .10 to .29
Small
Medium r = .30 to
.49
Large r = .50 to
1.0
32
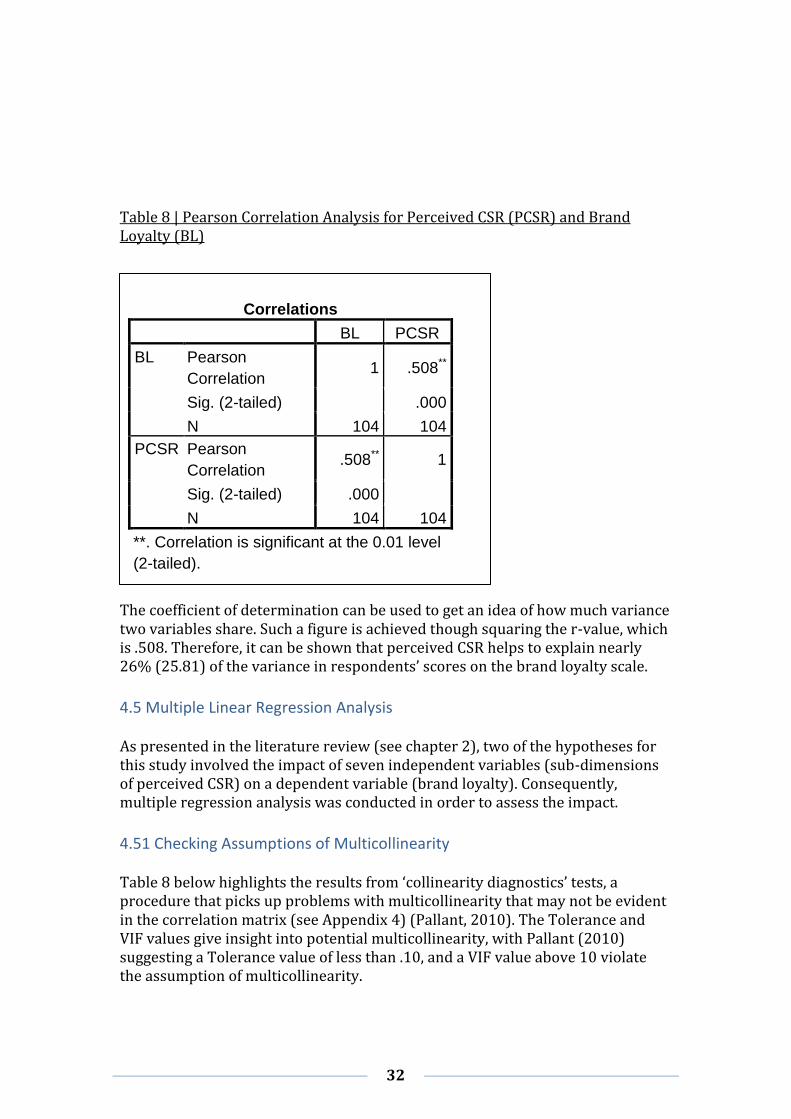
Table 8 | Pearson Correlation Analysis for Perceived CSR (PCSR) and Brand Loyalty (BL)
The coefficient of determination can be used to get an idea of how much variance two variables share. Such a figure is achieved though squaring the r-value, which is .508. Therefore, it can be shown that perceived CSR helps to explain nearly 26% (25.81) of the variance in respondents’ scores on the brand loyalty scale.
4.5 Multiple Linear Regression Analysis As presented in the literature review (see chapter 2), two of the hypotheses for this study involved the impact of seven independent variables (sub-dimensions of perceived CSR) on a dependent variable (brand loyalty). Consequently, multiple regression analysis was conducted in order to assess the impact.
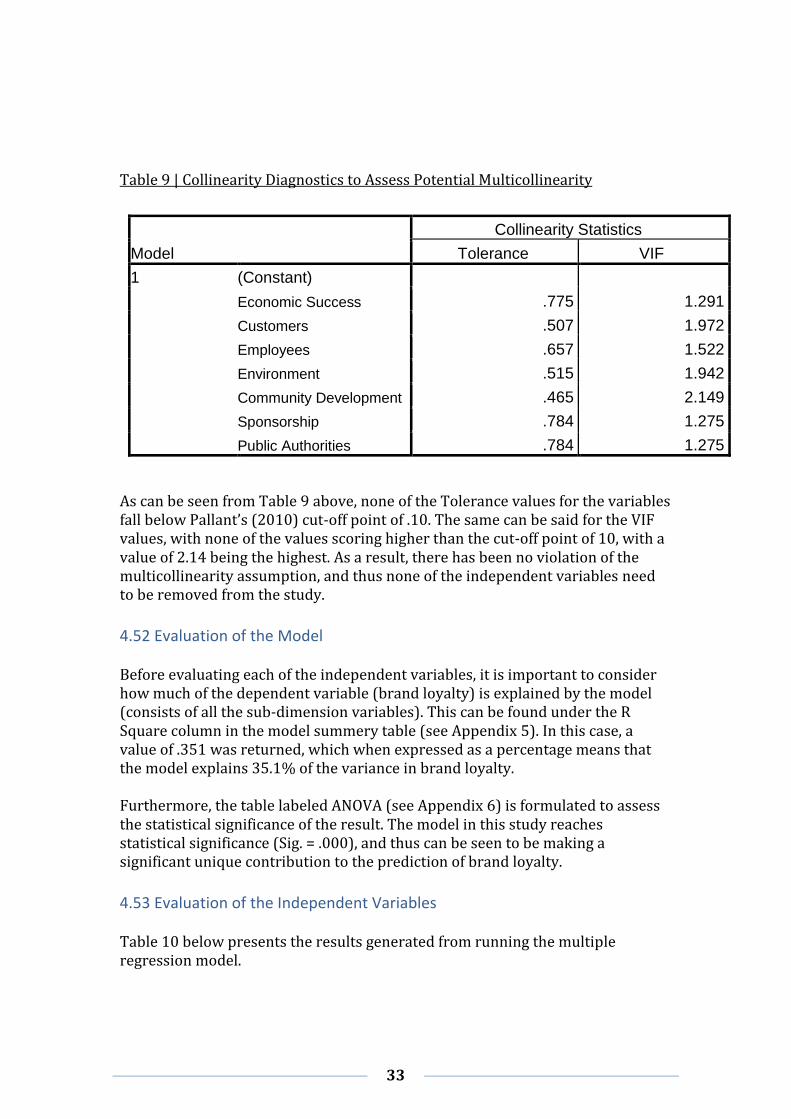
4.51 Checking Assumptions of Multicollinearity Table 8 below highlights the results from ‘collinearity diagnostics’ tests, a procedure that picks up problems with multicollinearity that may not be evident in the correlation matrix (see Appendix 4) (Pallant, 2010). The Tolerance and VIF values give insight into potential multicollinearity, with Pallant (2010) suggesting a Tolerance value of less than .10, and a VIF value above 10 violate the assumption of multicollinearity.
Correlations
BL PCSR
BL Pearson
Correlation 1 .508**
Sig. (2-tailed) .000
N 104 104
PCSR Pearson
Correlation .508** 1
Sig. (2-tailed) .000
N 104 104
**. Correlation is significant at the 0.01 level
(2-tailed).
33
Table 9 | Collinearity Diagnostics to Assess Potential Multicollinearity
As can be seen from Table 9 above, none of the Tolerance values for the variables fall below Pallant’s (2010) cut-off point of .10. The same can be said for the VIF values, with none of the values scoring higher than the cut-off point of 10, with a value of 2.14 being the highest. As a result, there has been no violation of the multicollinearity assumption, and thus none of the independent variables need to be removed from the study.
4.52 Evaluation of the Model Before evaluating each of the independent variables, it is important to consider how much of the dependent variable (brand loyalty) is explained by the model (consists of all the sub-dimension variables). This can be found under the R Square column in the model summery table (see Appendix 5). In this case, a value of .351 was returned, which when expressed as a percentage means that the model explains 35.1% of the variance in brand loyalty. Furthermore, the table labeled ANOVA (see Appendix 6) is formulated to assess the statistical significance of the result. The model in this study reaches statistical significance (Sig. = .000), and thus can be seen to be making a significant unique contribution to the prediction of brand loyalty.
4.53 Evaluation of the Independent Variables Table 10 below presents the results generated from running the multiple regression model.
Model
Collinearity Statistics
Tolerance VIF
1 (Constant)
Economic Success .775 1.291
Customers .507 1.972
Employees .657 1.522
Environment .515 1.942
Community Development .465 2.149
Sponsorship .784 1.275
Public Authorities .784 1.275
34
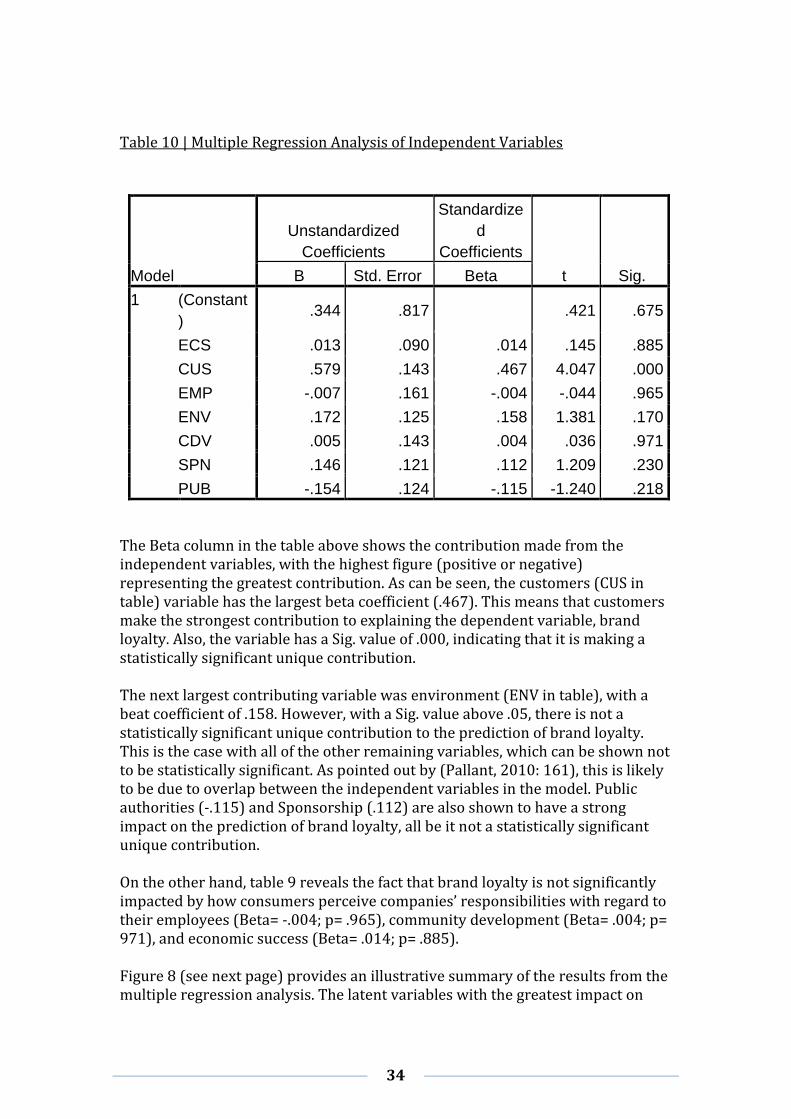
Table 10 | Multiple Regression Analysis of Independent Variables
The Beta column in the table above shows the contribution made from the independent variables, with the highest figure (positive or negative) representing the greatest contribution. As can be seen, the customers (CUS in table) variable has the largest beta coefficient (.467). This means that customers make the strongest contribution to explaining the dependent variable, brand loyalty. Also, the variable has a Sig. value of .000, indicating that it is making a statistically significant unique contribution. The next largest contributing variable was environment (ENV in table), with a beat coefficient of .158. However, with a Sig. value above .05, there is not a statistically significant unique contribution to the prediction of brand loyalty. This is the case with all of the other remaining variables, which can be shown not to be statistically significant. As pointed out by (Pallant, 2010: 161), this is likely to be due to overlap between the independent variables in the model. Public authorities (-.115) and Sponsorship (.112) are also shown to have a strong impact on the prediction of brand loyalty, all be it not a statistically significant unique contribution. On the other hand, table 9 reveals the fact that brand loyalty is not significantly impacted by how consumers perceive companies’ responsibilities with regard to their employees (Beta= -.004; p= .965), community development (Beta= .004; p= 971), and economic success (Beta= .014; p= .885). Figure 8 (see next page) provides an illustrative summary of the results from the multiple regression analysis. The latent variables with the greatest impact on
Model
Unstandardized
Coefficients
Standardize
d
Coefficients
t Sig. B Std. Error Beta
1 (Constant
) .344 .817 .421 .675
ECS .013 .090 .014 .145 .885
CUS .579 .143 .467 4.047 .000
EMP -.007 .161 -.004 -.044 .965
ENV .172 .125 .158 1.381 .170
CDV .005 .143 .004 .036 .971
SPN .146 .121 .112 1.209 .230
PUB -.154 .124 -.115 -1.240 .218
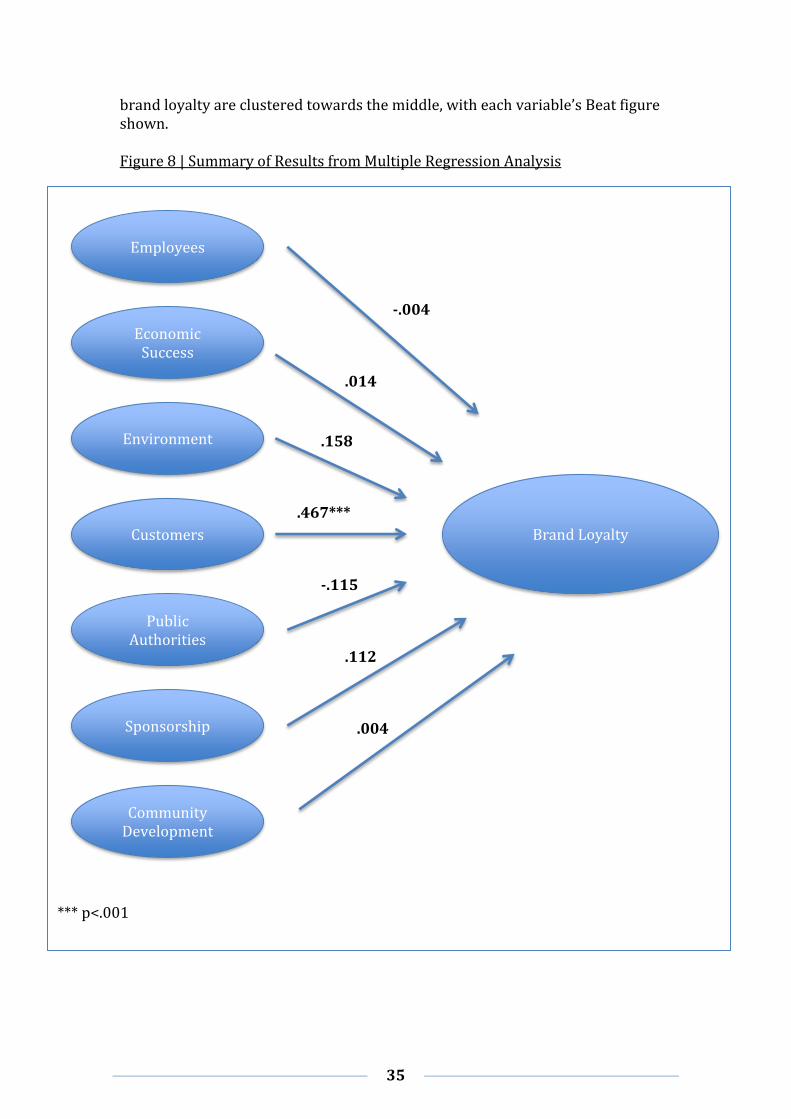
35
brand loyalty are clustered towards the middle, with each variable’s Beat figure shown. Figure 8 | Summary of Results from Multiple Regression Analysis
*** p<.001
Customers
Economic Success
Environment
Employees
Public Authorities
Sponsorship
Community Development
Brand Loyalty
-.004
.014
.158
.467***
-.115
.112
.004
36
4.6 Other Unexpected Results In terms of any unexpected findings, an interesting observation found was the impact age had on CSR perceptions and brand loyalty. Age was shown to have a small positive correlation with perceived CSR (r= .205, p= .037). However, the correlation between age and brand loyalty was much smaller (r= .111, p= .261), showing that although older consumers perceived TESCO to be more socially responsible than younger respondents, this did not result in an increase in brand loyalty to the extent one would have expected. When perceived CSR was broken down into the sub-dimension variables, age played a particularly important role concerning the respondents’ perceptions on TESCO’s responsibilities concerning sponsorship. There was shown to be a medium strength positive correlation between age and sponsorship (r= .328, p= .001). Therefore, older respondents perceived TESCO to be acting responsibly when it came to sponsorship, as appose to younger respondents. As there were no hypotheses for such results, a more in depth discussion will take place in the following chapter to see if there is literature supporting this finding.
37
5.0 Discussion
5.1 Perceived CSR and Brand Loyalty As shown in the previous chapter, the results from this study found that there was a strong positive relationship between perceived CSR and brand loyalty. Therefore, consumers who perceived TESCO to be more corporately responsible, appeared to show more loyalty towards the company. In terms of how this relates to the hypotheses formed (see chapter 2), the following can be said: Hypothesis 1: Supported Hypothesis 2: Rejected When comparing the results with the literature, the findings can be shown to support Stanaland et al.’s (2011) work, which also found a positive relationship between perceived CSR and brand loyalty. The fact that similar results are found in this study also, is in line with Stanaland et al.’s (2011) view that the same positive relationship will be found in almost any industry due to the emphasis placed on social responsibility in the modern business environment. Furthermore, the results generated make sense when acknowledging the work of Brown and Dacin (1997). Their expression that perceptions of socially responsible behaviour can strengthen commitment toward a brand since the behaviour transmits character, and a system of differentiating values, is provided more validity due to the findings of this study. Additionally, the results found are supported by Moisescu (2015) and Garcia (2005), who also find a direct positive association between perceived CSR and brand loyalty. Nevertheless, there are some areas within the literature where the results don’t show similarity. Salmones et al. (2005) found no direct relationship between perceived CSR and brand loyalty when analyzing their survey results from consumers in Spain. This could potentially be down to cultural differences between the emphasis placed on CSR in the Spanish and UK consumer markets. While the findings correlate with Stanaland et al.’s (2011) expression that perceived CSR will most always be positively associated with brand loyalty across most industries, perhaps the geographical location in which the study takes place has the greatest impact on the relationship. The fact that Stanaland’s et al.’s (2011) study was in the US market, which shares similarities in beliefs/values with the UK consumer market, may have been why a positive correlation was found. Podoshen et al. (2011) support this when suggesting that consumer behaviour is presumed to vary across nations, and that communication about responsibility is difficult to articulate across cultures. Therefore, while the findings of this study don’t support Salmones et al.’s (2005) results, it must be acknowledged that if this study had taken place in a consumer market with different beliefs to the UK consumer market a different result may have been obtained.
38
5.2 Latent Variables Two of the hypotheses devised from a review of the literature look at the impact the sub-dimensions (see figure 2) of CSR have on brand loyalty. The results from the multiple regression analysis showed that the consumers’ perceptions of TESCO’s corporate responsibility with regards to their customers had a significant effect on the levels of brand loyalty. It was also found that perceptions with regards to employees and economic success had little effect on brand loyalty. Consequently, the following can be said: Hypothesis 3: Supported Hypothesis 4: Supported The findings that customers had the greatest effect on brand loyalty out of the seven sub-dimension variables of perceived CSR is understandable when considering Brown and Dacin’s (1997) work again. In the previous section, it was highlighted how the authors said that perceived CSR transmits character. However, they also suggest that it transmits respect for the customer, and concern for serving them correctly. Such respect for the customer may involve setting fair prices, providing honest information to customers, and offering reasonable quality products/services. All these aspects were items in the research when assessing perception with regards to consumers, and thus when taking account of Brown and Dacin’s (1997) findings, it is not surprising customers had the most effect on brand loyalty. Moreover, the fact that customers had the most effect on brand loyalty out of the latent variables is in line with Moisescu’s (2015) work. Moisescu (2015) also found customers to have the greatest impact on brand loyalty when investigating the same latent variables used in this study. In fact, Moisescu (2015) generated a beta figure of .443 (p= .000) which is very similar to the beta figure found in this study (.467). The same similarity is true with regards to economic success and employees. Moisescu (2015) found these two variables to have no significant impact on brand loyalty, with the beta figures of .010 (p= .663) for economic success and -.002 (p= .955) for employees sharing close resemblance to the figures from this study (see figure 7).
5.3 Age, Perceived CSR, and Brand Loyalty As highlighted in the previous chapter, a small strength relationship was found between age and consumers’ perceptions of TESCO’s corporate responsibility. In terms of relevant literature, Tian et al. (2011) provide interesting findings into the impact of age on consumer CSR perceptions. They find that older consumers (born in 1950s-1960s) are more likely to respond positively towards CSR, as appose to younger consumers (born in 1980s-1990s). The proposal is made that this younger generation is more materialistic and affected by the global consumer culture, a concept presented by Hung et al. (2007). They point out to the work of Mohr et al. (2001), who illustrate that this younger generation view a company’s responsibilities as limited to whether they make a quality product,
39
make a profit, and maybe treat employees well. Consequently, Mohr et al. (2007) suggest that this generation don’t base purchase decisions on ethical or philanthropic CSR (see figure 1). However, there are perspectives in the literature that this younger generation have a well-developed social conscience and are “concerned with issues like climate change and ethical practices” (Ellis, 2010: 70). Carrasco (2007: 455) supports this view of the younger generation, suggesting that the “new human values area is associated with solidarity, quality of life, and consideration for the environment. Therefore, the literature appears to be divided on how younger consumers value CSR, with Schmeltz (2012) concisely summarizing that “young consumers are not as one-dimensional as first indicated”. In terms of the results of this study, there was a small positive correlation found between age and the perceptions of TESCO’s corporate responsibility. Having said that, this did not result in a similar strength correlation with brand loyalty. All be it there was a small positive correlation between age and both perceived CRS and brand loyalty, hence supporting Tian et al.’s (2011) perspective to a certain extent, the fact that brand loyalty correlated at a much lower strength with age than perceived CRS proposes ambiguity. The findings actually suggest that although older consumers were more favorable towards TESCO’s corporate responsibility, they were not as brand loyal to the same extent that they were favorable towards the CSR image of the company. As a result, this can actually provide more light to Mohr et al.’s (2001) findings, where it may not be just younger consumers who limit the view of a company’s responsibilities to whether they make a quality product, or make a profit. These findings may show that older consumers also have the same behaviors, and thus maybe older consumers are not as one-dimensional as these findings first indicated.
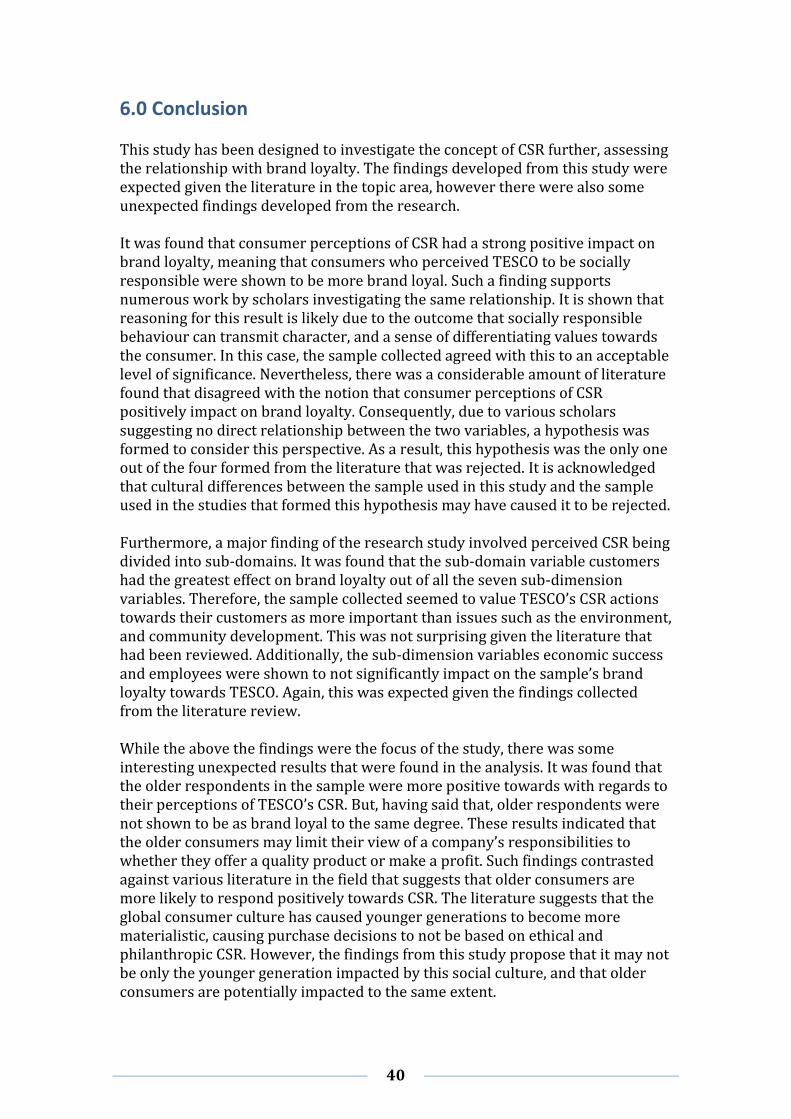
40
6.0 Conclusion This study has been designed to investigate the concept of CSR further, assessing the relationship with brand loyalty. The findings developed from this study were expected given the literature in the topic area, however there were also some unexpected findings developed from the research. It was found that consumer perceptions of CSR had a strong positive impact on brand loyalty, meaning that consumers who perceived TESCO to be socially responsible were shown to be more brand loyal. Such a finding supports numerous work by scholars investigating the same relationship. It is shown that reasoning for this result is likely due to the outcome that socially responsible behaviour can transmit character, and a sense of differentiating values towards the consumer. In this case, the sample collected agreed with this to an acceptable level of significance. Nevertheless, there was a considerable amount of literature found that disagreed with the notion that consumer perceptions of CSR positively impact on brand loyalty. Consequently, due to various scholars suggesting no direct relationship between the two variables, a hypothesis was formed to consider this perspective. As a result, this hypothesis was the only one out of the four formed from the literature that was rejected. It is acknowledged that cultural differences between the sample used in this study and the sample used in the studies that formed this hypothesis may have caused it to be rejected. Furthermore, a major finding of the research study involved perceived CSR being divided into sub-domains. It was found that the sub-domain variable customers had the greatest effect on brand loyalty out of all the seven sub-dimension variables. Therefore, the sample collected seemed to value TESCO’s CSR actions towards their customers as more important than issues such as the environment, and community development. This was not surprising given the literature that had been reviewed. Additionally, the sub-dimension variables economic success and employees were shown to not significantly impact on the sample’s brand loyalty towards TESCO. Again, this was expected given the findings collected from the literature review. While the above the findings were the focus of the study, there was some interesting unexpected results that were found in the analysis. It was found that the older respondents in the sample were more positive towards with regards to their perceptions of TESCO’s CSR. But, having said that, older respondents were not shown to be as brand loyal to the same degree. These results indicated that the older consumers may limit their view of a company’s responsibilities to whether they offer a quality product or make a profit. Such findings contrasted against various literature in the field that suggests that older consumers are more likely to respond positively towards CSR. The literature suggests that the global consumer culture has caused younger generations to become more materialistic, causing purchase decisions to not be based on ethical and philanthropic CSR. However, the findings from this study propose that it may not be only the younger generation impacted by this social culture, and that older consumers are potentially impacted to the same extent.
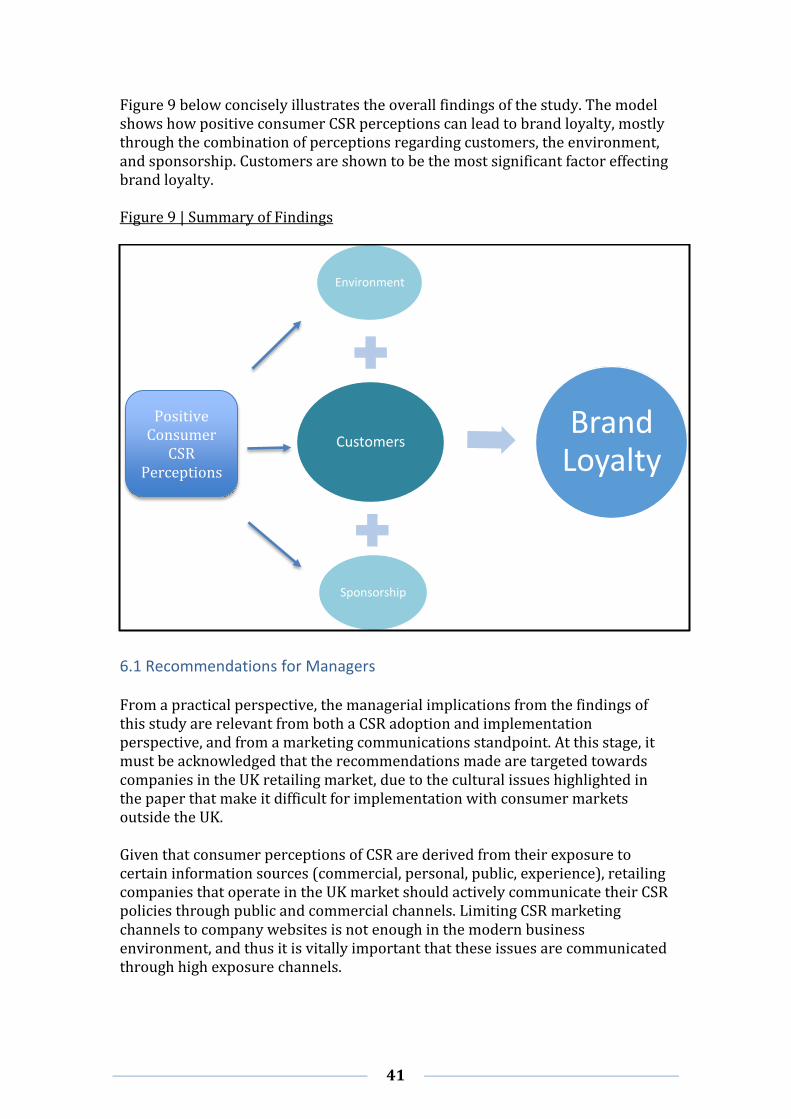
41
Figure 9 below concisely illustrates the overall findings of the study. The model shows how positive consumer CSR perceptions can lead to brand loyalty, mostly through the combination of perceptions regarding customers, the environment, and sponsorship. Customers are shown to be the most significant factor effecting brand loyalty. Figure 9 | Summary of Findings
6.1 Recommendations for Managers From a practical perspective, the managerial implications from the findings of this study are relevant from both a CSR adoption and implementation perspective, and from a marketing communications standpoint. At this stage, it must be acknowledged that the recommendations made are targeted towards companies in the UK retailing market, due to the cultural issues highlighted in the paper that make it difficult for implementation with consumer markets outside the UK. Given that consumer perceptions of CSR are derived from their exposure to certain information sources (commercial, personal, public, experience), retailing companies that operate in the UK market should actively communicate their CSR policies through public and commercial channels. Limiting CSR marketing channels to company websites is not enough in the modern business environment, and thus it is vitally important that these issues are communicated through high exposure channels.
Environment
Customers
Sponsorship
Brand Loyalty
Positive Consumer
CSR Perceptions
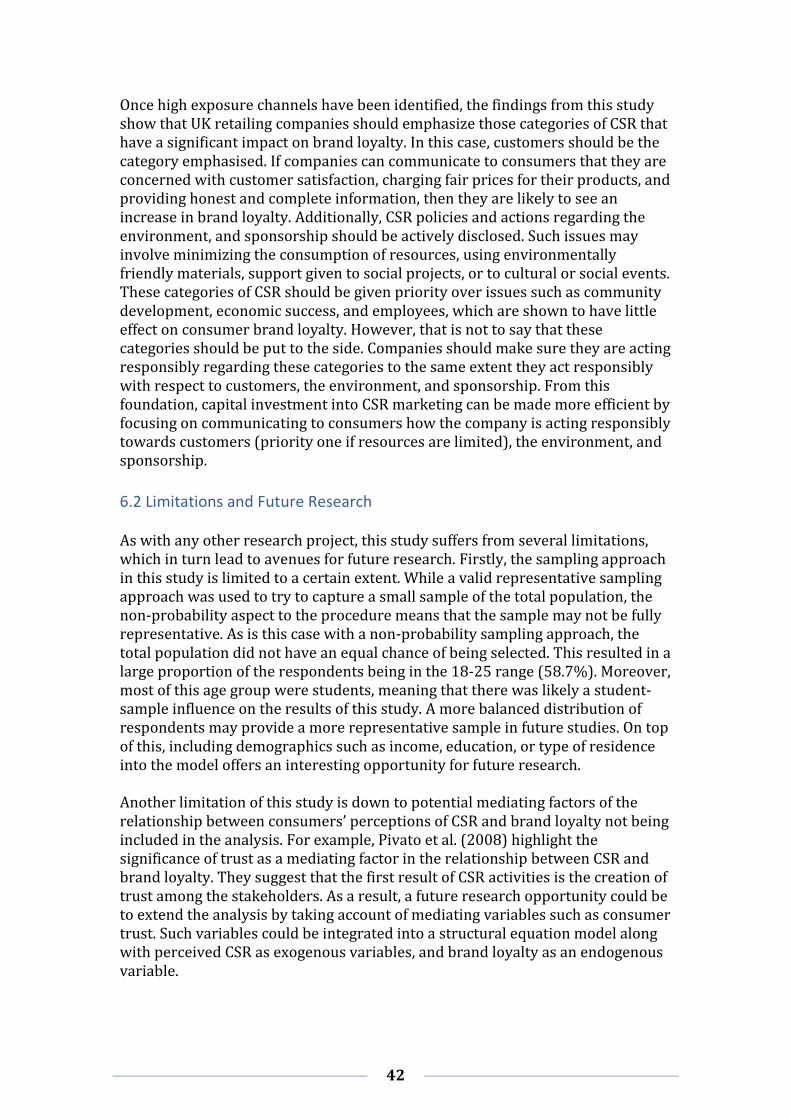
42
Once high exposure channels have been identified, the findings from this study show that UK retailing companies should emphasize those categories of CSR that have a significant impact on brand loyalty. In this case, customers should be the category emphasised. If companies can communicate to consumers that they are concerned with customer satisfaction, charging fair prices for their products, and providing honest and complete information, then they are likely to see an increase in brand loyalty. Additionally, CSR policies and actions regarding the environment, and sponsorship should be actively disclosed. Such issues may involve minimizing the consumption of resources, using environmentally friendly materials, support given to social projects, or to cultural or social events. These categories of CSR should be given priority over issues such as community development, economic success, and employees, which are shown to have little effect on consumer brand loyalty. However, that is not to say that these categories should be put to the side. Companies should make sure they are acting responsibly regarding these categories to the same extent they act responsibly with respect to customers, the environment, and sponsorship. From this foundation, capital investment into CSR marketing can be made more efficient by focusing on communicating to consumers how the company is acting responsibly towards customers (priority one if resources are limited), the environment, and sponsorship.
6.2 Limitations and Future Research As with any other research project, this study suffers from several limitations, which in turn lead to avenues for future research. Firstly, the sampling approach in this study is limited to a certain extent. While a valid representative sampling approach was used to try to capture a small sample of the total population, the non-probability aspect to the procedure means that the sample may not be fully representative. As is this case with a non-probability sampling approach, the total population did not have an equal chance of being selected. This resulted in a large proportion of the respondents being in the 18-25 range (58.7%). Moreover, most of this age group were students, meaning that there was likely a student-sample influence on the results of this study. A more balanced distribution of respondents may provide a more representative sample in future studies. On top of this, including demographics such as income, education, or type of residence into the model offers an interesting opportunity for future research. Another limitation of this study is down to potential mediating factors of the relationship between consumers’ perceptions of CSR and brand loyalty not being included in the analysis. For example, Pivato et al. (2008) highlight the significance of trust as a mediating factor in the relationship between CSR and brand loyalty. They suggest that the first result of CSR activities is the creation of trust among the stakeholders. As a result, a future research opportunity could be to extend the analysis by taking account of mediating variables such as consumer trust. Such variables could be integrated into a structural equation model along with perceived CSR as exogenous variables, and brand loyalty as an endogenous variable.
43
The use of a case study provides a significant limitation to the findings of this study. Weick (1969), cited in Dubois and Gadde (2002), express that case studies are too situational-specific and, therefore, are not appropriate for generalization. Using TESCO as a case study for this research project limits the scope of the findings. Not only is one industry represented, but there is also a country-specific sample, which means that one needs to be cautious in generalizing the results. However, this also proposes another logical step for future research. Firstly, multiple companies in the UK retailing industry could be investigated in a comparative analysis. This would help to reduce the impact of the companies on the study. Secondly, expanding the research context through a cross-cultural study could help to specify the cultural differences in perceptions of CSR. While findings from studies in different cultures can be compared, as is the case in this study, a research study solely aimed at examining cross-cultural differences in the relationship between perceived CSR and brand loyalty should be the ultimate aim for future research in this area. Lastly, one final limitation of this study involves the low number of items in the scales for some of the sub-domain variables of perceived CSR. The sponsorship and economic success scales only had two items in their scale, which can cause reliability and validity problems. This is highlighted by the .469 Cronbach alpha value for the sponsorship scale. Subsequently, in future research studies, these particular scales with a low number of items should be given more depth in order to provide greater reliability.
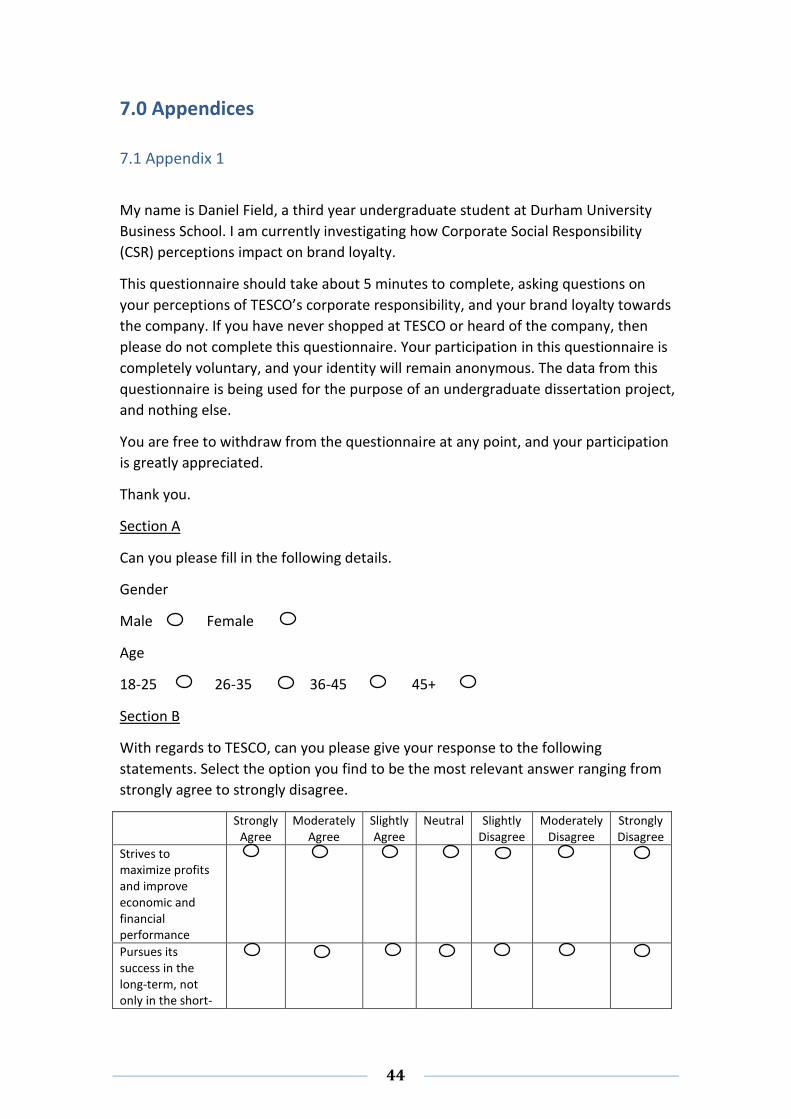
44
7.0 Appendices
7.1 Appendix 1
My name is Daniel Field, a third year undergraduate student at Durham University
Business School. I am currently investigating how Corporate Social Responsibility
(CSR) perceptions impact on brand loyalty.
This questionnaire should take about 5 minutes to complete, asking questions on
your perceptions of TESCO’s corporate responsibility, and your brand loyalty towards
the company. If you have never shopped at TESCO or heard of the company, then
please do not complete this questionnaire. Your participation in this questionnaire is
completely voluntary, and your identity will remain anonymous. The data from this
questionnaire is being used for the purpose of an undergraduate dissertation project,
and nothing else.
You are free to withdraw from the questionnaire at any point, and your participation
is greatly appreciated.
Thank you.
Section A
Can you please fill in the following details.
Gender
Male Female
Age
18-25 26-35 36-45 45+
Section B
With regards to TESCO, can you please give your response to the following
statements. Select the option you find to be the most relevant answer ranging from
strongly agree to strongly disagree.
Strongly Agree
Moderately Agree
Slightly Agree
Neutral Slightly Disagree
Moderately Disagree
Strongly Disagree
Strives to maximize profits and improve economic and financial performance
Pursues its success in the long-term, not only in the short-
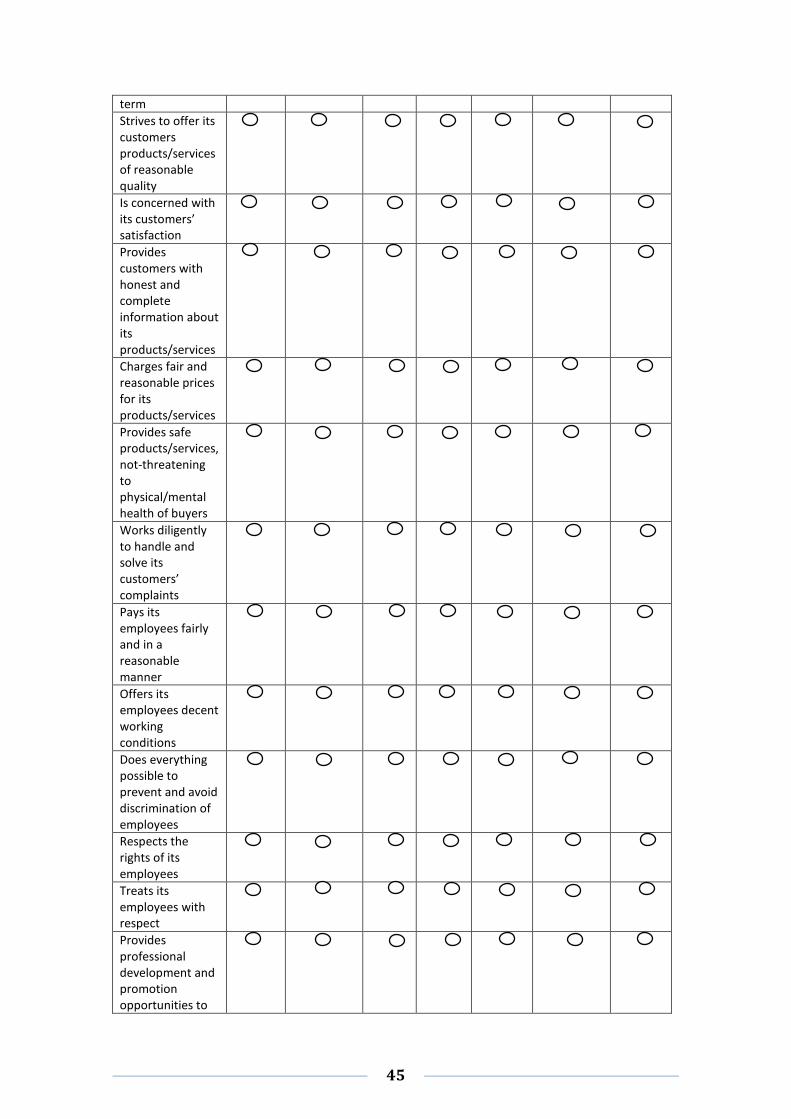
45
term
Strives to offer its customers products/services of reasonable quality
Is concerned with its customers’ satisfaction
Provides customers with honest and complete information about its products/services
Charges fair and reasonable prices for its products/services
Provides safe products/services, not-threatening to physical/mental health of buyers
Works diligently to handle and solve its customers’ complaints
Pays its employees fairly and in a reasonable manner
Offers its employees decent working conditions
Does everything possible to prevent and avoid discrimination of employees
Respects the rights of its employees
Treats its employees with respect
Provides professional development and promotion opportunities to
46
its employees
Does everything possible to reduce its negative effects on the natural environment
Strives to minimize the consumption of resources that affect the natural environment
Works diligently to use environmentally friendly materials
Is concerned with the proper management of waste and recycling activities
Contributes to the economic growth and development of the region
Contributes to the long-term welfare and life quality of people in the region
Creates and sustains jobs in the region
Contributes to the development of other companies in the region
Respects the values, customs, and culture of the region
Supports charitable and social projects addressed to the disadvantaged
Supports cultural and social events (music, sports, etc.)
Fully complies with the legislation in conducting its activities
47
Always pays state taxes in a fairly and honestly manner
Does everything possible to prevent and avoid corruption in its relation with the state
Section C
With regards to TESCO, can you please give your response to the following
statements. Select the option you find to be the most relevant answer ranging from
strongly agree to strongly disagree.
Strongly Agree
Moderately Agree
Slightly Agree
Neutral Slightly Disagree
Moderately Disagree
Strongly Disagree
I consider myself a loyal customer of this company
This company is my first choice, compared to others in the sector
I will continue to be a customer of this company
In the future I plan to purchase more from this company
I would recommend this company to my friends and acquaintances
I wouldn’t give up being a customer even if a competitor came up with a better offer
If you have any further questions or queries about this questionnaire or research
project, please do not hesitate to fill in the comments section below.
Thank you.
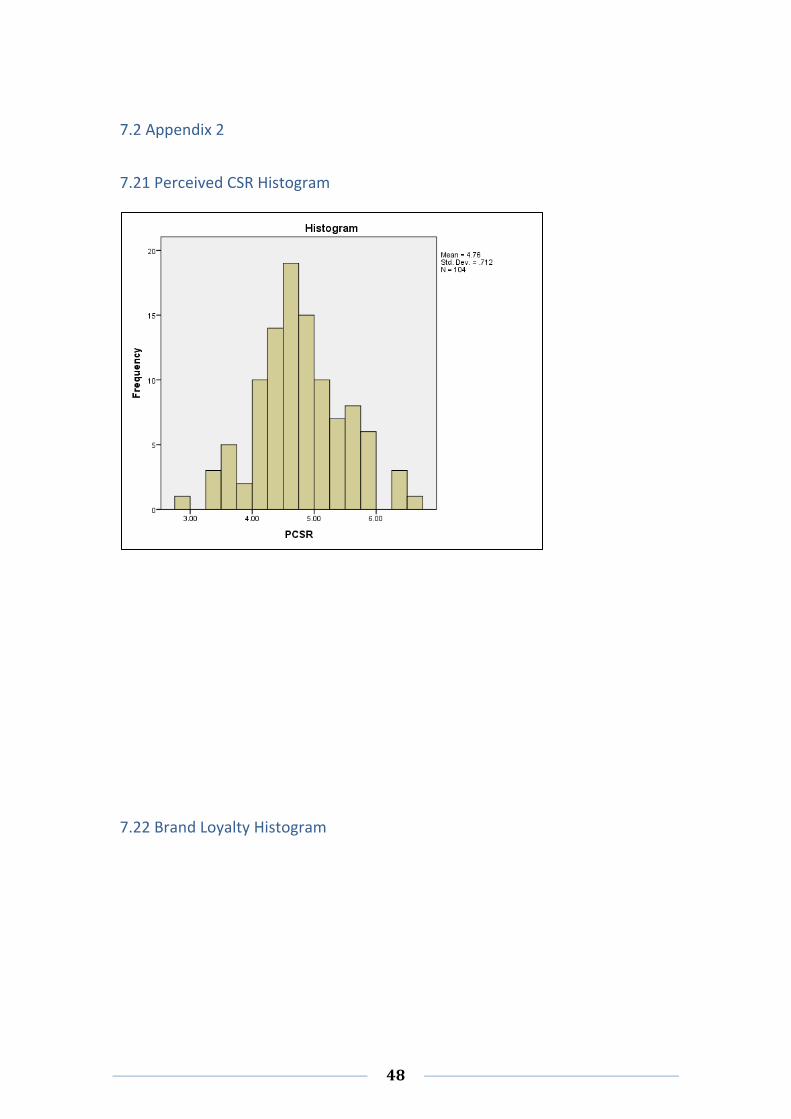
48
7.2 Appendix 2
7.21 Perceived CSR Histogram
7.22 Brand Loyalty Histogram
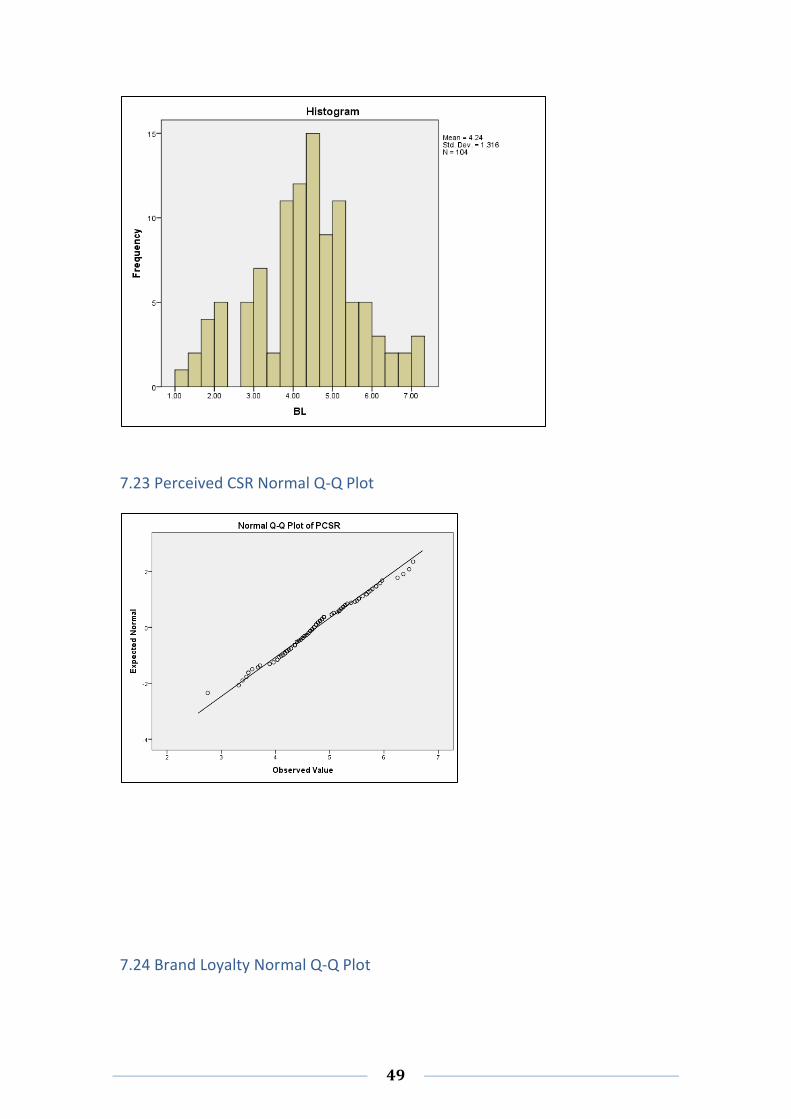
49
7.23 Perceived CSR Normal Q-Q Plot
7.24 Brand Loyalty Normal Q-Q Plot
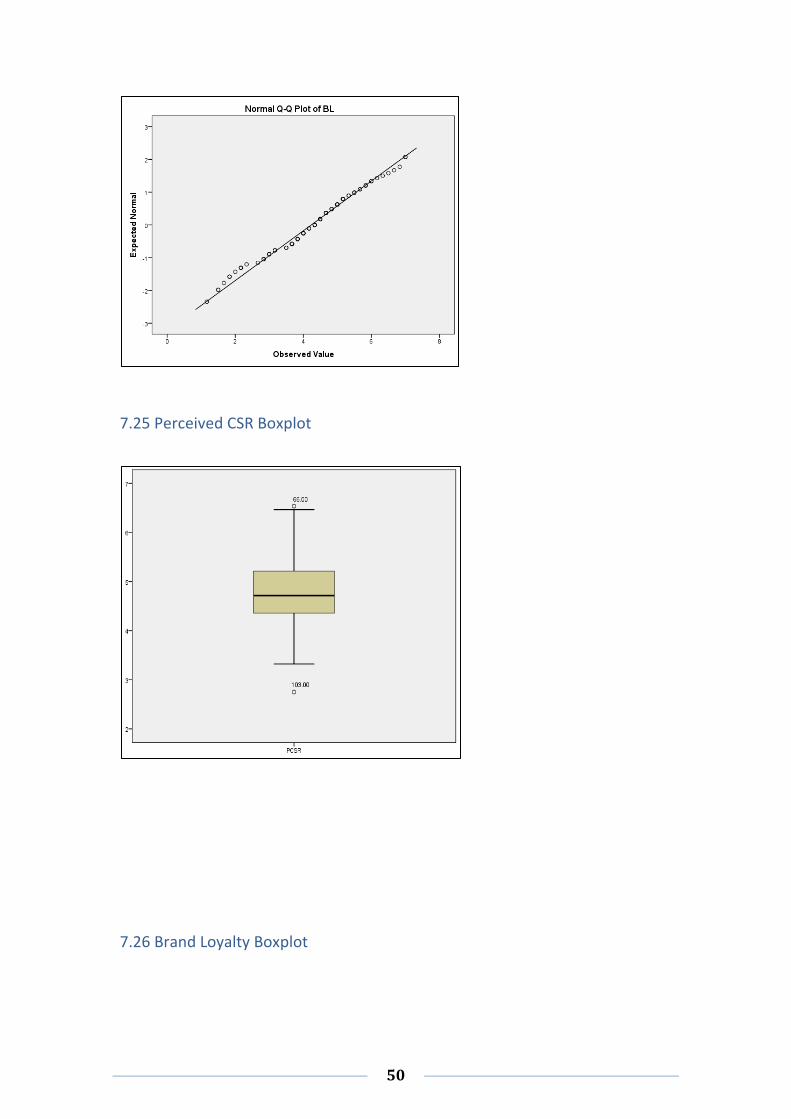
50
7.25 Perceived CSR Boxplot
7.26 Brand Loyalty Boxplot
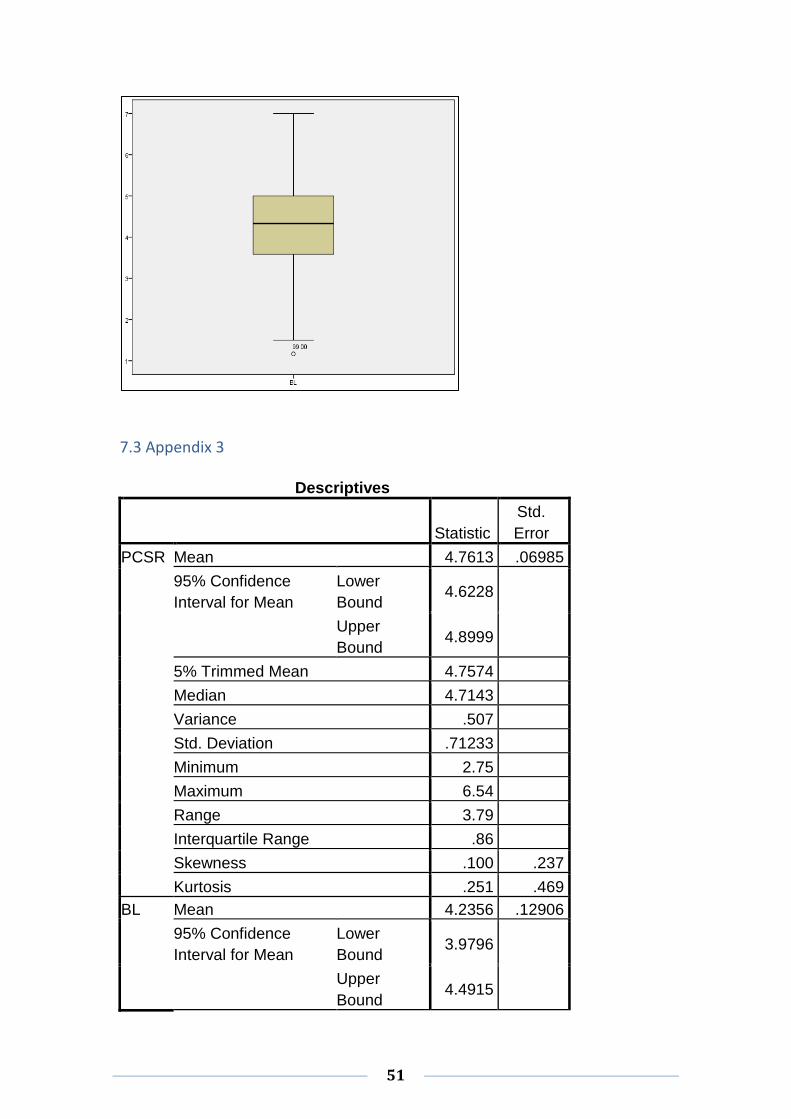
51
7.3 Appendix 3
Descriptives
Statistic
Std.
Error
PCSR Mean 4.7613 .06985
95% Confidence
Interval for Mean
Lower
Bound 4.6228
Upper
Bound 4.8999
5% Trimmed Mean 4.7574
Median 4.7143
Variance .507
Std. Deviation .71233
Minimum 2.75
Maximum 6.54
Range 3.79
Interquartile Range .86
Skewness .100 .237
Kurtosis .251 .469
BL Mean 4.2356 .12906
95% Confidence
Interval for Mean
Lower
Bound 3.9796
Upper
Bound 4.4915
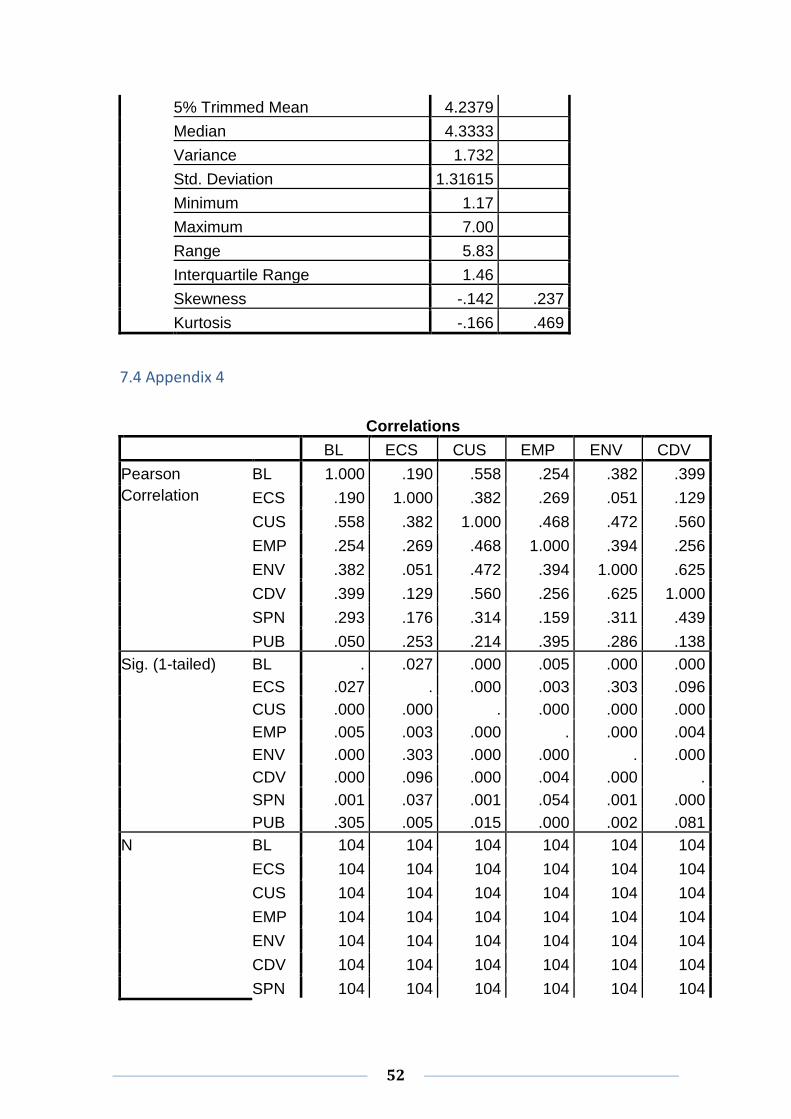
52
5% Trimmed Mean 4.2379
Median 4.3333
Variance 1.732
Std. Deviation 1.31615
Minimum 1.17
Maximum 7.00
Range 5.83
Interquartile Range 1.46
Skewness -.142 .237
Kurtosis -.166 .469
7.4 Appendix 4
Correlations
BL ECS CUS EMP ENV CDV
Pearson
Correlation
BL 1.000 .190 .558 .254 .382 .399
ECS .190 1.000 .382 .269 .051 .129
CUS .558 .382 1.000 .468 .472 .560
EMP .254 .269 .468 1.000 .394 .256
ENV .382 .051 .472 .394 1.000 .625
CDV .399 .129 .560 .256 .625 1.000
SPN .293 .176 .314 .159 .311 .439
PUB .050 .253 .214 .395 .286 .138
Sig. (1-tailed) BL . .027 .000 .005 .000 .000
ECS .027 . .000 .003 .303 .096
CUS .000 .000 . .000 .000 .000
EMP .005 .003 .000 . .000 .004
ENV .000 .303 .000 .000 . .000
CDV .000 .096 .000 .004 .000 .
SPN .001 .037 .001 .054 .001 .000
PUB .305 .005 .015 .000 .002 .081
N BL 104 104 104 104 104 104
ECS 104 104 104 104 104 104
CUS 104 104 104 104 104 104
EMP 104 104 104 104 104 104
ENV 104 104 104 104 104 104
CDV 104 104 104 104 104 104
SPN 104 104 104 104 104 104
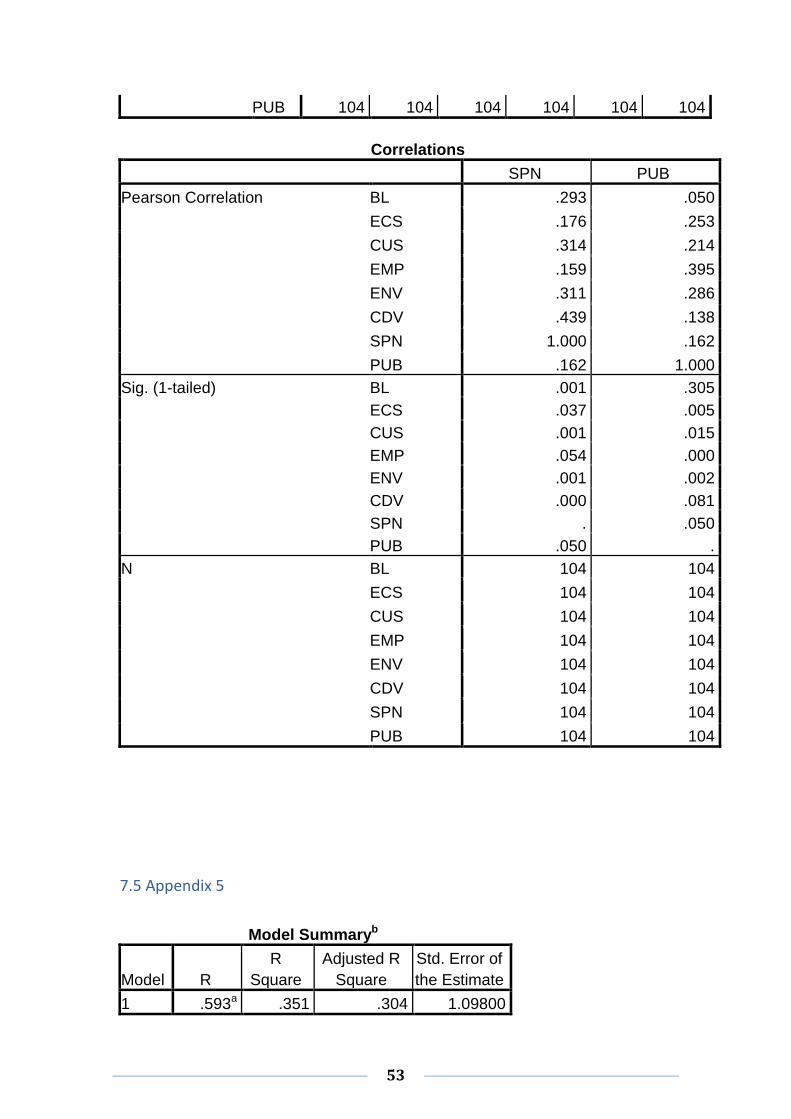
53
PUB 104 104 104 104 104 104
Correlations
SPN PUB
Pearson Correlation BL .293 .050
ECS .176 .253
CUS .314 .214
EMP .159 .395
ENV .311 .286
CDV .439 .138
SPN 1.000 .162
PUB .162 1.000
Sig. (1-tailed) BL .001 .305
ECS .037 .005
CUS .001 .015
EMP .054 .000
ENV .001 .002
CDV .000 .081
SPN . .050
PUB .050 .
N BL 104 104
ECS 104 104
CUS 104 104
EMP 104 104
ENV 104 104
CDV 104 104
SPN 104 104
PUB 104 104
7.5 Appendix 5
Model Summaryb
Model R
R
Square
Adjusted R
Square
Std. Error of
the Estimate
1 .593a .351 .304 1.09800
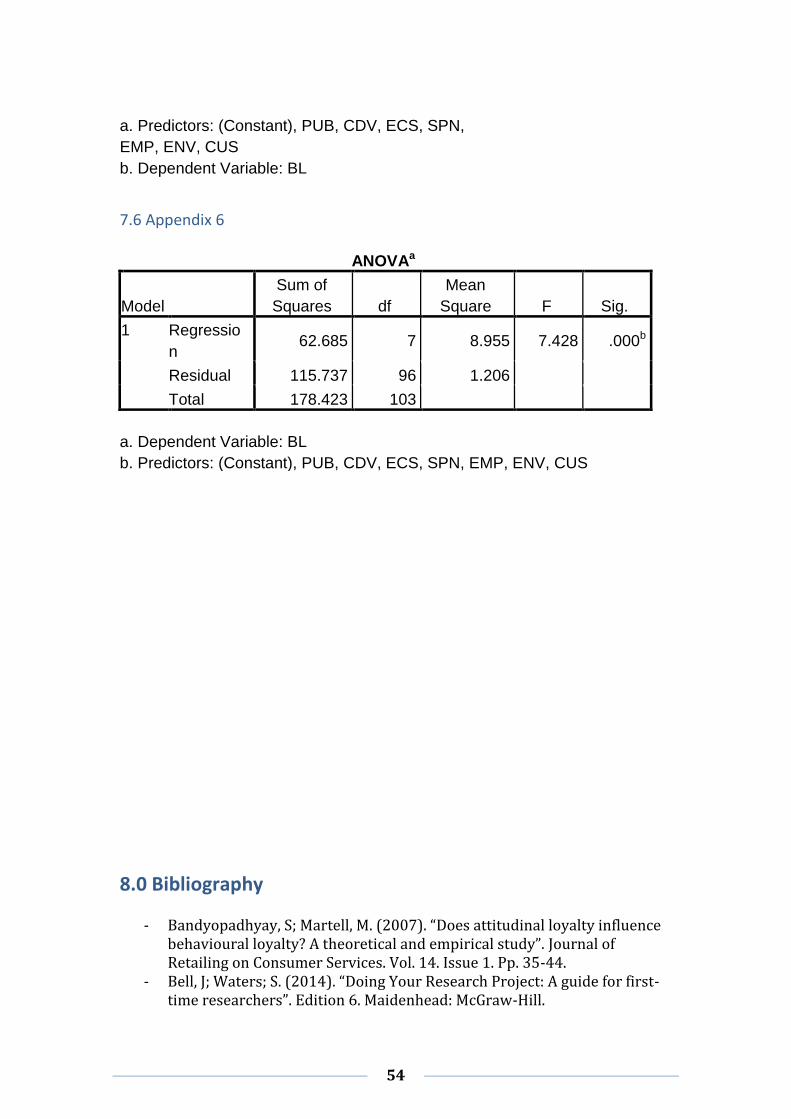
54
a. Predictors: (Constant), PUB, CDV, ECS, SPN,
EMP, ENV, CUS
b. Dependent Variable: BL
7.6 Appendix 6
ANOVAa
Model
Sum of
Squares df
Mean
Square F Sig.
1 Regressio
n 62.685 7 8.955 7.428 .000b
Residual 115.737 96 1.206
Total 178.423 103
a. Dependent Variable: BL
b. Predictors: (Constant), PUB, CDV, ECS, SPN, EMP, ENV, CUS
8.0 Bibliography
- Bandyopadhyay, S; Martell, M. (2007). “Does attitudinal loyalty influence behavioural loyalty? A theoretical and empirical study”. Journal of Retailing on Consumer Services. Vol. 14. Issue 1. Pp. 35-44.
- Bell, J; Waters; S. (2014). “Doing Your Research Project: A guide for first-time researchers”. Edition 6. Maidenhead: McGraw-Hill.
55
- Belton, C; Binham, C; Daneshkhu, S. (2016). “Three former Tesco executives charged with fraud”. Financial Times. [Online]. Available at: https://www.ft.com/content/7d69a61e-7682-11e6-bf48-b372cdb1043a. [Last Accessed: 8th March 2017].
- Berens, G; van Riel, C.B.M; van Bruggen, G.H. (2005). “Corporate associations and consumer product responses: The moderating role of corporate brand dominance”. Journal of Marketing. Vol. 69. Issue 3. Pp. 18-35.
- Brown, T.J; Dacin, P.A. (1997). “The company and the product: corporate associations and consumer product responses”. Journal of Marketing. Vol. 61. Issue 1. Pp. 68-84.
- Carrasco, I. (2007). “Corporate social responsibility, values and cooperation”. International Advances in Economic Research. Vol. 13. Issue 4. Pp. 454-460.
- Carroll, A.B. (1979). “A three-dimensional conceptual model of corporate performance”. Academy of Management Review. Vol. 4. Issue 4. Pp. 497-505.
- Carroll, A.B. (1991). “The pyramid of corporate social responsibility: Toward the moral management of organizational stakeholders”. Business Horizons. Vol. 34. Issue 4. Pp. 39-48.
- Chang, J.S; Van Witteloostuijn, A; Eden, L. (2010). “From the editors: Common method variance in international business research”. Journal of International Business Studies. Vol. 41. Issue 2. Pp. 178-184.
- Clarkson, M.B.E. (1995). “A stakeholder framework for analyzing and evaluating corporate social performance”. Academy of Management Review. Vol. 20. Issue 1. Pp. 92-117.
- Cohen, J.W. (1988). “Statistical power analysis for the behavioural sciences”. Edition 2. Hillsdale, NJ; Lawrence Erlbaum Associates.
- Dick, A.S; Basu, K. (1994). “Consumer loyalty: towards an integrated conceptual approach”. Journal of the Academy of Marketing Science. Vol. 22. Issue 2. Pp. 99-113.
- Donaldson, T. (1994). “When integration fails”. Business Ethics Quarterly. Vol. 4. Issue 2. Pp. 157-170.
- Donaldson, T; Dunfee, T.W. (1999). Ties That Bind. Boston, MA: Harvard Business School Press.
- Donaldson, T; Dunfee, T.W. (1994). “Toward a unified concept of business ethics: Integrative Social Contracts Theory”. Academy of Management Review. Vol. 19. Issue 2. Pp. 252-284.
- Dubois, A; Gadde, E.L. (2002). “Systematic combining: an abductive approach to case research”. Journal of Business Research. Vol. 55. Issue 7. Pp. 553-560.
- Ellis, T. (2010). “The new pioneers: Sustainable business success through social innovation and social entrepreneurship”. Chichester: Wiley.
- Euromonitor. (2016). “Tesco Plc in Retailing (World)”. [Online]. Available at: http://www.portal.euromonitor.com.ezphost.dur.ac.uk/portal/analysis/tab#. [Last Accessed: 8th March 2017].
- Freeman, R.E. (1984). Strategic Management: A Stakeholder Approach. Boston, MA: Pitman Publishing.
56
- Garriga, E; Mele, D. (2004). “Corporate Social Responsibility Theories: Mapping the Territory”. Journal of Business Ethics. Vol. 53. Issue 1. Pp. 51-71.
- Gosling, M; Haung, J.H. (2009). “The fit between integrity and integrative social contracts theory”. Journal of Business Ethics. Vol. 90. Issue 3. Pp. 407-417.
- Gray, R; Owen, D; Adams, C. (1996). Accounting and Accountability: Changes and Challenges in Corporate Social and Environmental Reporting. Harlow: Prentice Hall Europe.
- Gray, E.G. (2014). “Doing research in the real world”. Third Edition. London, SAGE.
- Hart, C. (2001). “Doing a Literature Search: A Comprehensive Guide for the Social Sciences”. London: SAGE.
- Hung, K. H.; Fang Gu, F; Chi Kin, Y. (2007). “A Social Institutional
Approach to Identifying Generation Cohorts in China with a Comparison with
American Consumers”, Journal of International Business Studies. Vol. 38.
Issue 5. Pp. 836–853.
- Jacoby, J; Kyner, D.B. (1973). “Brand loyalty versus repeat purchasing behaviour”. Journal of Marketing Research. Vol. 10. Issue 1. Pp. 1-9.
- James, B. (2015). “Marketing to a Millennial”. [Online]. Available at: http://www.huffingtonpost.co.uk/bev-james/marketing-to-a-millennial_b_8781346.html. [Last Accessed: 10th March 2017].
- Jones, T.M. (1995). “Instrumental Stakeholder Theory: A synopsis of ethics and economics”. Academy of Management Review. Vol. 20. Issue 2. Pp. 404-437.
- Jones, T.M; Wicks, A.C. (1999). “Convergent Stakeholder Theory”. Academy of Management Review. Vol. 24. Issue 2. Pp. 206-221.
- Lee, M.P. (2008). “A review of the theories of corporate social responsibility: its evolutionary path and the road ahead”. International Journal of Management Reviews. Vol. 10. Issue 1. Pp. 53-73.
- Lee, E.M; Park, S.Y; Rapert, M.I; Newman, C.L. (2012). “Does perceived consumer fit matter in corporate social responsibility issues”. Journal of Business Research. Vol. 65. Issue 11. Pp. 1558-1564.
- L’Etang, J. (1994). “Public Relations and Corporate Social Responsibility: Some issues arising”. Journal of Business Ethics. Vol. 13. Issue 2. Pp. 111-123.
- Minocha, S; Petros, M. (2012). “Handbook of social media for researchers and supervisors: digital technologies for research dialogues”. [Online]. Available at: https://www.vitae.ac.uk/vitae-publications/reports/innovate-open-university-social-media-handbook-vitae-2012.pdf. [Last Accessed 07/02/17].
- Mohr, A.L; Webb, J.D; Harris, E.K. (2001). “Do consumers expect companies to be socially responsible? The impact of Corporate Social Responsibility on buying behavior”. Journal of Consumer Affairs. Vol. 39. Issue 1. Pp. 121-147.
- Mohr, A.L; Webb, J.D. (2005). “The Effects of Corporate Social Responsibility and Price on Consumer Responses”. Journal of Consumer Affairs. Vol. 39. Issue 1. Pp. 121-147.
57
- Moir, L. (2001). “What do we mean by corporate social responsibility”. Corporate Governance: The International Journal of Business in Society. Vol. 1. Issue 2. Pp. 16-22.
- Moisescu, O.I. (2015). “The impact of customers’ perception of CSR on corporate brand loyalty: The case of the Romanian mobile telecom industry”. Central European Business Review. Vol. 4. Issue 2. Pp. 21-30.
- Neuman, L.W. (2011). “Social Research Methods: Qualitative and Quantitative Approaches”. Boston: Pearson.
- Oberseder, M; Schlegelmilch, B.B; Gruber, V. (2011). “Why don’t consumers care about CSR?: A qualitative study exploring the role of CSR in consumption decisions”. Journal of Business Ethics. Vol. 104. Issue 4. Pp. 449-460.
- Oberseder, M; Schlegelmilch, B.B; Murphy, E.P; Gruber, V. (2014). “Consumers’ perceptions of Corporate Social Responsibility: Scale development and validation”. Journal of Business Ethics. Vol. 124. Issue 1. Pp. 101-115.
- Oliver, C. (1991). “Strategic Responses to Institutional Processes”. Academy of Management Review. Vol. 16. Issue 1. Pp. 145-179.
- Oliver, R.L. (1999). “Whence consumer loyalty?”. Journal of Marketing. Vol. 63. (Special Issue). Pp. 33-44.
- Palazzo, G; Scherer, G.A. (2006). “Corporate Legitimacy as Deliberation: A Communicative Framework”. Journal of Business Ethics. Vol. 66. Issue 1. Pp. 71-88.
- Palazzo, G; Scherer, G.A. (2011). “The New Political Role of Business in a Globalized World: A Review of a New Perspective on CSR and its Implications for the Firm, Governance, and Democracy”. Journal of Management Studies. Vol. 48. Issue 4. Pp. 899-931.
- Pallant, J. (2010). “SPSS survival manual: a step-by-step guide to data analysis using SPSS”. Maidenhead: McGraw-Hill.
- Pirsch, J; Gupta, S; Grau, S. (2007). “A framework for understanding corporate social responsibility programs as a continuum: An exploratory study”. Journal of Business Ethics. Vol. 70. Issue 2. Pp. 125-140.
- Pivato, S; Misani, N; Tencati, A. (2008). “The impact of corporate social responsibility on consumer trust: the case of organic food”. Business Ethics: A European Review. Vol. 17. Issue 1. Pp. 3-12.
- Podoshen, J.S; Li, L; Zhang, J. (2011). “Materialism and conspicuous consumption in China: A cross-cultural examination”. International Journal of Consumer Studies. Vol. 35. Pp. 17-25.
- Pomering, A; Dolnicar, S. (2009). “Assessing the prerequisite of successful CSR implementation: Are consumers aware of CSR initiatives?”. Journal of Business Ethics. Vol. 85. Issue 2. Pp. 285-301.
- Rosamaria, C.M.L.; Robert, C.P. (2011). “Historical background of corporate social responsibility”. Social Responsibility Journal, Vol. 7. Issue 4. Pp. 528-539.
- Salmones de los, M.G; Crespo, A.H; Bosque del, I.R. (2005). “Influence of corporate social responsibility on loyalty and valuation of services”. Journal of Business Ethics. Vol. 61. Issue 4. Pp. 369-385.
- Samy, M; Odemilin, G; Bampton, R. (2010). “Corporate social responsibility: a strategy for sustainable business success: An analysis of
58
20 selected British companies”. Corporate Governance: The International Journal of Business in Society. Vol. 10. Issue 2. Pp. 203-217.
- Schmeltz, L. (2012). “Consumer-orientated CSR communication: focusing on ability or morality?”. Corporate Communications: An International Journal. Vol. 17. Issue 1. Pp. 29-49.
- Schwartz, M; Carroll, A.B. (2003). “Corporate Social Responsibility: A three-domain approach”. Business Ethics Quarterly. Vol. 13. Issue 4. Pp. 503-530.
- Sen, S; Bhattacharya, C.B. (2001). Does doing good always lead to doing better? Consumer reactions to corporate social responsibility”. Journal of Marketing Research. Vol. 38. Issue 2. Pp. 225-243.
- Snider, J; Paul, R.H; Martin D. (2003). “Corporate social responsibility in the 21st Century: A view from the world’s most successful firms”. Journal of Business Ethics. Vol. 48. Issue 2. Pp. 175-187.
- Stanaland, A.J; Lwin, M.O; Murphy, P.E. (2011). “Consumer perceptions of the antecedents and consequences of corporate social responsibility”. Journal of Business Ethics. Vol. 102. Issue 1. Pp. 47-55.
- Suchman, M.C. (1995). “Managing legitimacy: strategic and institutional approaches”. Academy of Management Review. Vol. 20. Issue 3. Pp. 571-610.
- Tian, Z; Wang; R; Yang, W. (2011). “Consumer responses to Corporate Social Responsibility (CSR) in China”. Journal of Business Ethics. Vol. 101. Issue 2. Pp. 197-212.
- Waddock, S. (2008). “Building a new institutional infrastructure for corporate responsibility”. Academy of Management Perspectives. Vol. 22. Issue 3. Pp. 87-108.
- Webster, J; Watson, T.R. (2002). “Analyzing the past to prepare for the future: Writing a literature review”. MIS Quarterly. Vol. 26. Issue 2. Pp. 13-23.
- Work and Pensions and Business, Innovation and Skills Committee. (2016), “BHS”. HC 54, 2016-17. London: House of Commons.
- Yin, R.K. (1984). “Case study research: Design and methods”. Newbury Park, CA: Sage.
- Zeithaml, V.A; Berry, L.L; Parasuraman, A. (1996). “The behavioral consequences of service quality”. Journal of Business Ethics. Vol. 60. Issue 1. Pp. 31-46.
Author’s Bio This thesis was written by Daniel Field, an undergraduate Business and Management student at Durham University Business School. The author started his degree in 2014, and completed the course in the summer of 2017.

59