Embed Size (px)
Citation preview
Customer order cycle of a production company, its
bottlenecks and potential for improvements
MSc Thesis
Martin Hanus, July 2015
Management Studies Group
of Wageningen University
ii
Wageningen University & Research Centre
MST-80433
MSc Thesis (33 ECTS)
Customer order cycle of a production company, its bottlenecks and potential for
improvements
Author: Martin Hanus
Student ID: 870423304010
Contact: [email protected]
Supervisor: prof.dr. JH (Jacques) Trienekens
Co-reader: dr. EFM (Emiel) Wubben

iii
Acknowledgement
This thesis is the final step to complete my master studies at Wageningen University
and Research centre. Over last two years I pursued Master program Management,
Economics and Consumer studies. This thesis was performed at the chair group
Management studies of Wageningen University.
Throughout the whole research, there were a lot of persons that helped me to carry out
this thesis and I would like to use this as an opportunity to thank them all.
First, I would like to express my gratitude to my supervisors who spend their time and
effort to continuously guide me through the thesis writing process. Without support of
prof. dr. Jacques Trienekens, dr. Emiel Wubben and Michael Kasper I would not be
able to finish my studies.
Second, I would like to thank my family for the endless support. This two years and
especially the last weeks helped me to realize what my family means to me.
Finally, I would like to thank my girlfriend and all my friends from all around the
world. My thanks belong to all those who stood by my side during the thesis
completion no matter what was happening. Thank you!
Martin Hanus
July 2015, Prague
iv
Summary In recent years, the challenge of improving business performance has widely been
discussed. Increasing global competition forces businesses across industries to
optimize their operations in order to stay ahead. Although managers know their
business thoroughly, they may lack unbiased opinion on the actual condition of their
business. Established stereotypes and habits are still part of Typhoon’s operations. In
order to improve the performance of the company by re-designing deeply rooted
practices, an external viewpoint is often necessary to discover bottleneck and propose
changes.
In this manner, the objective of this study is “To recommend performance
improvements to the management of Typhoon by assessing its order cycle and
discovering its bottlenecks”. A literature study is performed in order to gain an insight
to the factors influencing the order cycle. Moreover, communication with regards to
order cycle is studied as well. Information retrieved from the literature study helps to
choose the suited model for the analyses and to detail the theoretical framework for
this case. As the main analysing tool the SCOR model is selected as this model allows
to break down and to measure single processes together forming the operations of
businesses. The theoretical framework shows that the order cycle is influenced by
order entry method, order lead-time, order path and by the customer order decoupling
point. Moreover, the literature study shows that communication and information
influence the order cycle as well. The empirical part of this study is designed
according to the theoretical framework. Observations, interviews and a focus group
are conducted to map the order cycle of the company. When characteristics of the
order cycle are known, bottlenecks can be identified.
The results of this case study presents a set of performance influencing bottlenecks.
For each bottleneck a possible improvement is proposed. In general, all occurring
bottlenecks can be categorized into two groups, namely process bottlenecks and
communication bottlenecks.
Both, process bottlenecks and communication bottlenecks limit the performance of
the company and therefore two major recommendations are made. First, an upgrade

v
of the IT system will be necessary. More specifically the use of ERP (Enterprise
Resource Planning program) should be extended and new modules should be
integrated to manage order cycle processes in more efficient and effective way (e.g.
order picking). Second, communication within the company as well as external
communication with other supply chain actors should be improved because the
amount and quality of exchanged information does not comply with standards
proposed by literature. If these two recommendations would be considered during
restructuring of the business operations of Typhoon, then the bottlenecks will most
probably be mitigated.
Key words: order cycle, SCOR, production, performance, supply chain management,
communication

vi
Table of Contents
Acknowledgement ................................................................................................ iii
Summary ............................................................................................................. iv
List of figures ........................................................................................................ ix
List of tables........................................................................................................... x
List of abbreviations.............................................................................................. xi
Report structure ...................................................................................................xii
1 Introduction ..................................................................................................... 1
1.1 Background information ...............................................................................................1 1.2 Problem definition.........................................................................................................3 1.3 Research objective.........................................................................................................6 1.4 Research questions ........................................................................................................7 1.5 Research framework......................................................................................................7
2 Literature review.............................................................................................. 9
2.1 Order cycle ....................................................................................................................9 2.1.1 The concept of lead-time .............................................................................................................. 10 2.1.2 Controllable order cycle issues .................................................................................................. 10 2.1.3 Manufacturing strategies ............................................................................................................ 12 2.1.4 Summary ............................................................................................................................................. 17
2.2 Supply chain management and logistics .....................................................................17 2.2.1 Supply chain management .......................................................................................................... 17 2.2.2 Logistics ............................................................................................................................................... 19 2.2.3 Integrated logistics management ............................................................................................ 21 2.2.4 Summary ............................................................................................................................................. 23
2.3 Communication and information in SCM...................................................................23 2.4 Bottleneck management ..............................................................................................24 2.5 Supply-Chain Operation Reference-model (SCOR) ...................................................26
2.5.1 SCOR Processes ................................................................................................................................. 26 2.5.2 SCOR Performance .......................................................................................................................... 28 2.5.3 Summary ............................................................................................................................................. 30
2.6 Conclusion literature study..........................................................................................30
vii
2.7 Theoretical framework ................................................................................................32
3 Methodology.................................................................................................. 36
3.1 Research design...........................................................................................................36 3.2 Data collection.............................................................................................................36
3.2.1 Literature ............................................................................................................................................ 36 3.2.2 Interviews............................................................................................................................................ 37 3.2.3 Focus group........................................................................................................................................ 37 3.2.4 Observations ...................................................................................................................................... 38 3.2.5 Additional data sources ................................................................................................................ 39 3.2.6 Data analysis ..................................................................................................................................... 39
3.3 Validity........................................................................................................................40 3.4 Reliability ....................................................................................................................40
4 Results ........................................................................................................... 41
4.1 Order Cycle of Typhoon .............................................................................................41 4.1.1 Order path........................................................................................................................................... 41 4.1.2 Order cycle processes ..................................................................................................................... 44
4.2 Communication affecting Typhoon’s order cycle.......................................................46 4.2.1 External communication.............................................................................................................. 47 4.2.2 Internal communication............................................................................................................... 49
4.3 Bottlenecks affecting Typhoon’s order cycle..............................................................51 4.4 Possible improvements in current order cycle ............................................................52
5 Conclusion and recommendations ................................................................ 59
5.1 Conclusion...................................................................................................................59 5.2 Recommendations .......................................................................................................63
6 Discussion...................................................................................................... 68
6.1 Discussion ...................................................................................................................68 6.2 Limitations ..................................................................................................................69 6.3 Future research ............................................................................................................69
References ........................................................................................................... 71
Appendices .......................................................................................................... 77
6.4 Appendix 1 – Figures and tables of chapter 2 .............................................................77 6.5 Appendix 2 - SCOR Metrics .......................................................................................80 6.6 Appendix 3 - SCOR Processes....................................................................................83 6.7 Appendix 4 - List of interviewees ...............................................................................86

viii
6.8 Appendix 5 - Interviews ..............................................................................................87 6.9 Appendix 6 – Focus group ..........................................................................................97 6.10 Appendix 7 - Recommendation...................................................................................98

ix
List of figures FIGURE 1.1 SIMPLIFIED ILLUSTRATION OF TYPHOON'S HQ .....................................................3 FIGURE 1.2 RESEARCH FRAMEWORK..............................................................................................8 FIGURE 2.1 THE ORDER CYCLE ......................................................................................................10 FIGURE 2.2 ANTICIPATORY AND RESPONSIVE MODEL............................................................14 FIGURE 2.3 ORDER TYPES AND CYCLE LEAD-TIMES ...............................................................14 FIGURE 2.4 CODP IN MTO AND MTS MANUFACTURING STRATEGIES .................................16 FIGURE 2.5 INTEGRATION AND MANAGEMENT OF BUSINESS PROCESSES IN THE
SUPPLY CHAIN...........................................................................................................................19 FIGURE 2.6 FIVE AREAS OF LOGISTICAL WORK ........................................................................21 FIGURE 2.7 SCOR MODEL PROCESSES AND SPANS....................................................................27 FIGURE 2.8 THEORETICAL FRAMEWORK .....................................................................................32 FIGURE 3.1 TYPOLOGY OF PARTICIPANT OBSERVATION RESEARCH ROLES ...................39 FIGURE 4.1 ORDER PATH IN TYPHOON ........................................................................................42 FIGURE 4.2 SCOR PROCESSES LEVEL II ........................................................................................45 FIGURE 4.3 MATERIAL AND INFORMATIONAL FLOWS BETWEEN TYPHOON AND OTHER
SUPPLY CHAIN ACTORS .........................................................................................................49 FIGURE 5.1 PROPOSED EXTENSION OF COMMUNICATION......................................................66 FIGURE 0.1 LEAD-TIME COMPONENTS .........................................................................................77 FIGURE 0.2 ORDER CYCLE TIME CALCULATION .......................................................................78 FIGURE 0.3 CUSTOMER ORDER CYCLE PATH EXAMPLE .........................................................78 FIGURE 0.4 SUPPLY CHAIN STAGES ..............................................................................................79 FIGURE 0.5 SCOR PROCESSES LEVEL III ......................................................................................85 FIGURE 0.6 ERP SYSTEM COMPONENTS ......................................................................................98
x
List of tables
TABLE 1-1 BUSINESSES INVOLVED IN TYPHOON’S INTERNAL OPERATIONS .....................1 TABLE 1-2 PROBLEMS AND EFFECTS ..............................................................................................6 TABLE 2-1 CHARACTERISTICS OF MANUFACTURING STRATEGIES ....................................15 TABLE 2-2 ORDER CYCLE ISSUES AND CHALLENGES..............................................................16 TABLE 2-3 SCOR LEVEL I PROCESS DEFINITIONS .....................................................................27 TABLE 2-4 SCOR PERFORMANCE ATTRIBUTES ..........................................................................29 TABLE 3-1 FOCUS GROUP MEMBERS.............................................................................................38 TABLE 4-1 PROCESS BOTTLENECKS ..............................................................................................46 TABLE 4-2 COMMUNICATION BOTTLENECKS.............................................................................51 TABLE 4-3 OVERVIEW OF BOTTLENECKS....................................................................................52 TABLE 5-1 TYPE OF BOTTLENECKS ...............................................................................................63 TABLE 0-1 LEVEL I METRICS............................................................................................................79 TABLE 0-2 OVERVIEW OF SCOR METRICS....................................................................................82 TABLE 0-3 SCOR PROCESSES – TABLE 1/2 ...................................................................................83 TABLE 0-4 SCOR PROCESSES – TABLE 2/2 ...................................................................................84 TABLE 0-5 RESPONDENTS.................................................................................................................86 TABLE 0-6 FOCUS GROUP MEMBERS.............................................................................................97
xi
List of abbreviations Abbreviation Meaning
ATO assemble to order
CODP customer order decoupling point
EDI electronic data interchange
EDP electronic data processing
ERP enterprise resource planning
ETO engineer to order
EU European Union
FIFO first in, first out
FTE full-time equivalent
GRQ general research question
HQ headquarters
ID identification
IT information technology
JIT just in time
KPI key performance indicator
MTO make to order
MTS make to stock
PR public relations
R&D research and development
SC supply chain
SCC Supply-Chain Council
SCM supply chain management
SCOR Supply Chain Operations Reference model
SKU stock keeping unit
SRQ specific research question
TOC theory of constraints
UK United Kingdom of Great Britain and Northern Ireland
USA United States of America

xii
Report structure
This report is divided into 6 chapters. An introduction is presented in chapter 1. This
chapter aims to describe the background and problems of the case study and presents
the research questions together with the research framework. Literature study is
discussed in chapter 2 and comprises of sections describing the order cycle and
different elements influencing the order cycle. An important part of chapter 2 is the
description of the SCOR model that is the main analyzing tool used during this case
study. Chapter 3 presents methodology while chapter 4 presents framed results of the
case study. Chapter 5 composes of conclusion and answers to the research questions.
Chapter 6 presents the discussions.
Figure 0.0 Report structure overview
Introduc8on(Chapter%1%
Literature(review(Chapter%2%
Methodology(Chapter%3%
Results(Chapter%4%
Conclusion(&(Recommenda8ons(
Chapter%5%
Discussion(Chapter%6%

1
1 Introduction This chapter presents an introduction to the topic of this study. Next, the background
information is discussed as well as problem definition. Furthermore, the research
objective is presented together with the research questions. At the end of this chapter,
the research framework is provided to give an insight into the study.
1.1 Background information Background information about studied company Typhoon will be provided in the
following paragraphs. This will help to understand the characteristics of the studied
business, its processes and problems occurring in its operations. This section is
prevalently based on information provided by managing director of Typhoon
Germany and on internal records of the same company.
Typhoon is a company providing materials for cleaning purposes. Their main focus is
to produce 1) washcloths for automatic cleaning of commercial printing machines,
and 2) quality textiles for manually cleaning printing machines. In total, there is 6200
stock keeping units (SKU) that differ in use, colour, shape, weight or quality (based
on data provided by marketing department of Typhoon Germany).
Typhoon distributes its products globally via its four subsidiaries and two business
partners. Regardless of location or business entity, there is always a strong
connection to Typhoon Germany. This connection is either legal (where Typhoon
Germany actually owns all shares of the subsidiary) or alternatively is based on its
personal relationship with its partner companies (Typhoon Germany delivers its
products to a legally independent company, which is managed by trusted partners of
Typhoon). The annual turnover of Typhoon and its subsidiaries for 2014 was
approximately EUR 7.5 mil (the exchange rate for the calculation is sourced from the
ECB (European Central Bank)), realized by 33 FTE (Full Time Equivalent)(source:
Typhoon internal records).
For purely strategic reasons, the most important allied business unit for Typhoon
Germany is its business partner Typhoon USA, which is trusted with securing the
sourcing of material for further processing and conversion. Initially, supplies of
intermediate products were shipped
directly from Jamison (independent
Table 1-1 Businesses involved in Typhoon’s internal
operations (source: internal data of Typhoon)
Subsidiaries Business partnersTyphoon Germany (HQ) Typhoon USATyphoon Switzerland Typhoon UKCSP GermanyCSP Switzerland
Manufacturing strategy Design
Manufacturing and
procurementMTSATOMTO CODPETO CODP

2
supplier located in the USA) to Germany where the material was converted into the
final products. Such products were either sent back to the USA to be sold, sent to
other markets worldwide or were sold on the local German market. However, since
Jamison has built its second factory in Europe, the regional division of deliveries does
not allow Typhoon to source material from factory in the USA (that offers products of
higher quality). Therefore Typhoon USA sources the material from Jamison USA and
ships the material to Typhoon in Germany at its own expense.
Currently, business partner Typhoon USA is using a consignation warehouse to be
able to sell the final products of Typhoon Germany in the American region. It means,
that approximately 2000 SKU permanently stored in the consignation warehouse are
property of Typhoon Germany. Other products can be sourced from Typhoon
Germany if necessary. Stored products are kept on the accounts of Typhoon
Germany, but they are fully available and accessible for Typhoon USA. When
Typhoon USA receives an order, it first takes the stock from the consignation
warehouse and then charges the customer for it. At the same time an announcement is
made to Typhoon Germany about the withdrawal of the goods from the warehouse.
Every two weeks, Typhoon Germany analyses the total number of goods withdrawn
from the warehouse and sends an invoice to Typhoon USA. Typhoon USA re-orders
in Germany to ensure that the full range of products will be available in sufficient
amounts. Business partner Typhoon UK operates in a similar manner and uses a
consignation warehouse as well. Typhoon UK sells the products of Typhoon
Germany but in contrast with Typhoon USA sources no material for Typhoon
Germany.
Next, there is a subsidiary in Switzerland (Typhoon SUI) that serves local customers
with the products of Typhoon Germany. Finally, there are two more subsidiaries in
Switzerland and Germany. These two subsidiaries (CSP Germany and CSP
Switzerland) are providing products of lower quality but they are not direct
competitors to its holding company since they are focused on different customers.
This is a classic example of a “fighter brand”. A fighter brand is defined by Mark
Ritson of the Harvard Business Review as a brand that “fends off low cost rivals
while allowing a company’s premium brand to stay above the fray” (Ritson, 2012)
Originally, these two subsidiaries were created to compete with companies offering
low-end products and to cover a larger market segment. German HQ processes all
orders of CSP Germany, CSP Switzerland and Typhoon Switzerland. All subsidiaries
3
and partner companies deliver products to their local customers. Customers located
outside of mentioned countries are served by Typhoon Germany or Typhoon USA.
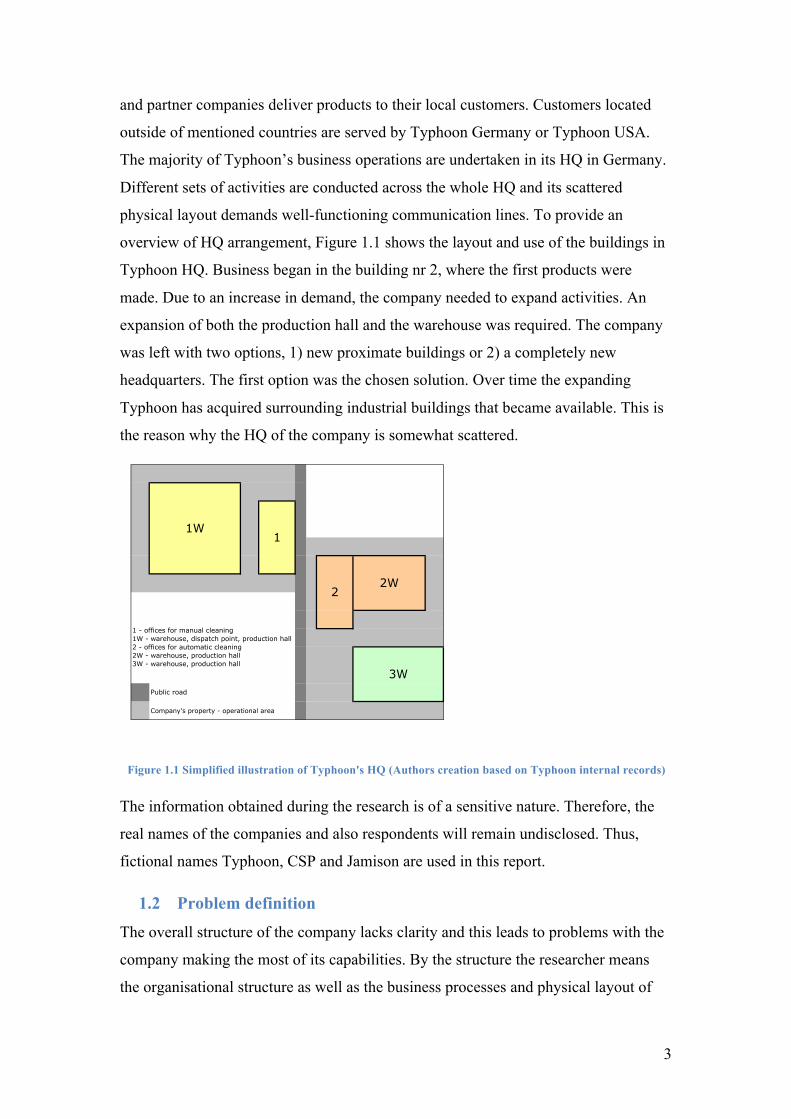
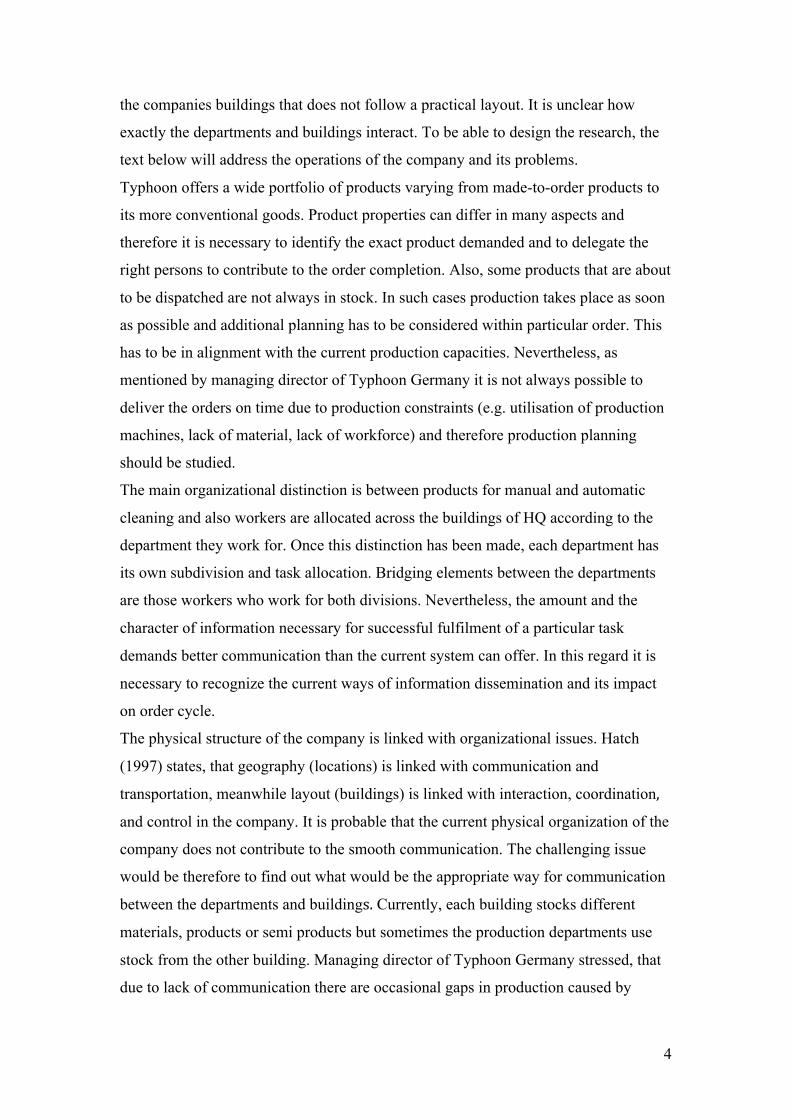
The majority of Typhoon’s business operations are undertaken in its HQ in Germany.
Different sets of activities are conducted across the whole HQ and its scattered
physical layout demands well-functioning communication lines. To provide an
overview of HQ arrangement, Figure 1.1 shows the layout and use of the buildings in
Typhoon HQ. Business began in the building nr 2, where the first products were
made. Due to an increase in demand, the company needed to expand activities. An
expansion of both the production hall and the warehouse was required. The company
was left with two options, 1) new proximate buildings or 2) a completely new
headquarters. The first option was the chosen solution. Over time the expanding
Typhoon has acquired surrounding industrial buildings that became available. This is
the reason why the HQ of the company is somewhat scattered.
Figure 1.1 Simplified illustration of Typhoon's HQ (Authors creation based on Typhoon internal records)
The information obtained during the research is of a sensitive nature. Therefore, the
real names of the companies and also respondents will remain undisclosed. Thus,
fictional names Typhoon, CSP and Jamison are used in this report.
1.2 Problem definition The overall structure of the company lacks clarity and this leads to problems with the
company making the most of its capabilities. By the structure the researcher means
the organisational structure as well as the business processes and physical layout of
3WPublic road
Company's property - operational area
1W1
22W
1 - offices for manual cleaning 1W - warehouse, dispatch point, production hall 2 - offices for automatic cleaning 2W - warehouse, production hall 3W - warehouse, production hall
4
the companies buildings that does not follow a practical layout. It is unclear how
exactly the departments and buildings interact. To be able to design the research, the
text below will address the operations of the company and its problems.
Typhoon offers a wide portfolio of products varying from made-to-order products to
its more conventional goods. Product properties can differ in many aspects and
therefore it is necessary to identify the exact product demanded and to delegate the
right persons to contribute to the order completion. Also, some products that are about
to be dispatched are not always in stock. In such cases production takes place as soon
as possible and additional planning has to be considered within particular order. This
has to be in alignment with the current production capacities. Nevertheless, as
mentioned by managing director of Typhoon Germany it is not always possible to
deliver the orders on time due to production constraints (e.g. utilisation of production
machines, lack of material, lack of workforce) and therefore production planning
should be studied.
The main organizational distinction is between products for manual and automatic
cleaning and also workers are allocated across the buildings of HQ according to the
department they work for. Once this distinction has been made, each department has
its own subdivision and task allocation. Bridging elements between the departments
are those workers who work for both divisions. Nevertheless, the amount and the
character of information necessary for successful fulfilment of a particular task
demands better communication than the current system can offer. In this regard it is
necessary to recognize the current ways of information dissemination and its impact
on order cycle.
The physical structure of the company is linked with organizational issues. Hatch
(1997) states, that geography (locations) is linked with communication and
transportation, meanwhile layout (buildings) is linked with interaction, coordination,
and control in the company. It is probable that the current physical organization of the
company does not contribute to the smooth communication. The challenging issue
would be therefore to find out what would be the appropriate way for communication
between the departments and buildings. Currently, each building stocks different
materials, products or semi products but sometimes the production departments use
stock from the other building. Managing director of Typhoon Germany stressed, that
due to lack of communication there are occasional gaps in production caused by

5
scarcity of resources available. That is caused by the fact that two production
departments, namely manual cleaning department and automatic cleaning department,
receive the orders independently from each other and use one common stock.
Therefore if large order arrives to any of the two departments concerned with
production of cleaning materials, the stock might drop below the re-order point
without the relevant personnel knowing. Consequently production or picking of the
order is affected. This results in the customer order cycle being extended by the time
necessary to fix the problem or the costs may increase in case of backorder. So far it
is not clear which of the two production departments has a preferential right on
particular resource or on the use of production machinery. Also, tasks executed once
too many, too many employees engaged in a simple task completion or technologies
used under its maximum capacity utilisation can be also interpreted as a result of
miscommunication or weak coordination.
Unfortunately, there is not a clear structure of the work process and organization of
order cycle. Without a clear structure of the processes the company is not able to
follow the way the order traverses and is not able to stimulate the customer order
lead-time (Bhagwat & Sharma, 2007).
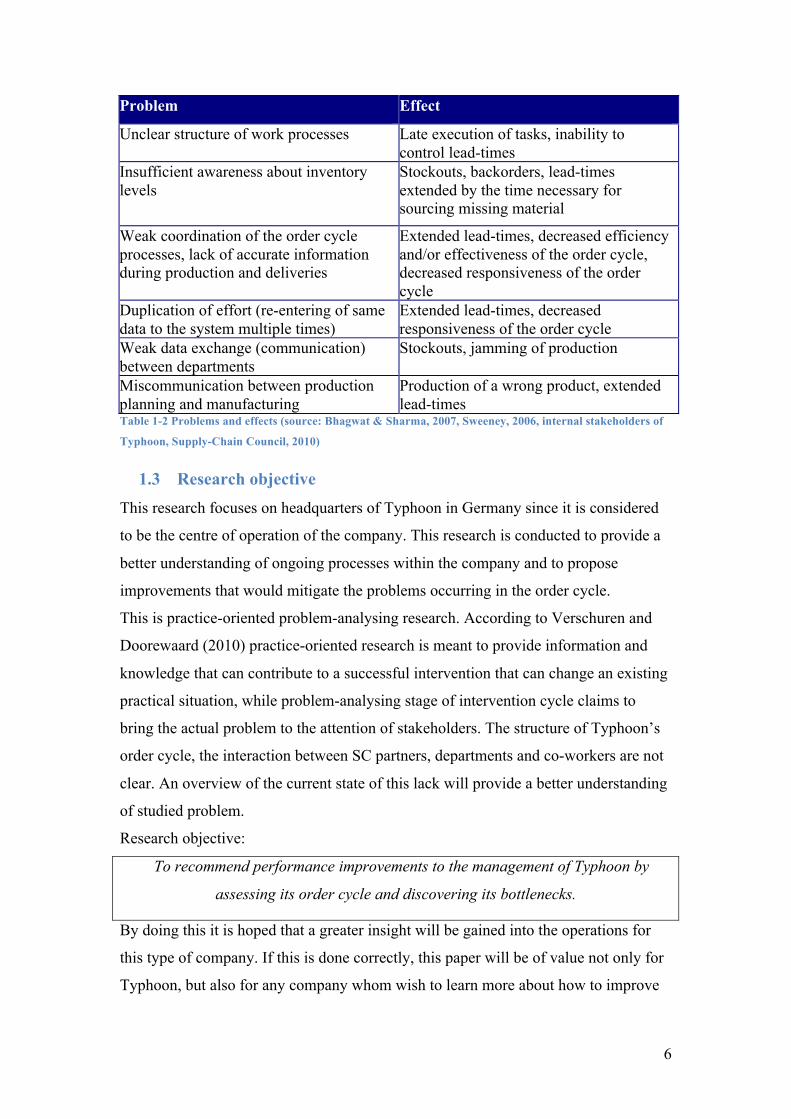
A detailed explanation of the problem definition is summarized in Table 1-2 where
specific problems and effects are listed. These are the problems affecting company’s
order cycle and subsequently the total performance of the company. As result, total
cycle times and total expenses are longer and higher respectively. The problems will
be studied closely in order to find out how to tackle them and consequently find
possible improvements in company’s order cycle.
6
Problem Effect
Unclear structure of work processes Late execution of tasks, inability to control lead-times
Insufficient awareness about inventory levels
Stockouts, backorders, lead-times extended by the time necessary for sourcing missing material
Weak coordination of the order cycle processes, lack of accurate information during production and deliveries
Extended lead-times, decreased efficiency and/or effectiveness of the order cycle, decreased responsiveness of the order cycle
Duplication of effort (re-entering of same data to the system multiple times)
Extended lead-times, decreased responsiveness of the order cycle
Weak data exchange (communication) between departments
Stockouts, jamming of production
Miscommunication between production planning and manufacturing
Production of a wrong product, extended lead-times
Table 1-2 Problems and effects (source: Bhagwat & Sharma, 2007, Sweeney, 2006, internal stakeholders of
Typhoon, Supply-Chain Council, 2010)
1.3 Research objective This research focuses on headquarters of Typhoon in Germany since it is considered
to be the centre of operation of the company. This research is conducted to provide a
better understanding of ongoing processes within the company and to propose
improvements that would mitigate the problems occurring in the order cycle.
This is practice-oriented problem-analysing research. According to Verschuren and
Doorewaard (2010) practice-oriented research is meant to provide information and
knowledge that can contribute to a successful intervention that can change an existing
practical situation, while problem-analysing stage of intervention cycle claims to
bring the actual problem to the attention of stakeholders. The structure of Typhoon’s
order cycle, the interaction between SC partners, departments and co-workers are not
clear. An overview of the current state of this lack will provide a better understanding
of studied problem.
Research objective:
To recommend performance improvements to the management of Typhoon by
assessing its order cycle and discovering its bottlenecks.
By doing this it is hoped that a greater insight will be gained into the operations for
this type of company. If this is done correctly, this paper will be of value not only for
Typhoon, but also for any company whom wish to learn more about how to improve

7
order cycle and communication throughout their company and thus, improve its
performance.
1.4 Research questions
General Research Question (GRQ):
How can bottlenecks in Typhoon’s operations be identified, analysed and potentially
reduced by improvements in company’s order cycle and communication?
Specific Research Questions (SRQ):
1. Which theoretical framework can be designed from existing knowledge
about supply chain, order cycle and communication in order to be able to
recommend performance improvements?
2. Which processes forms the order cycle of Typhoon, how are they executed
and what is the sequence of the processes?
3. What communications take place that affects Typhoon’s order cycle?
4. What are bottlenecks that affect efficiency and effectiveness of Typhoon’s
order cycle?
5. What are possible improvements in the order cycle and communication of
Typhoon?
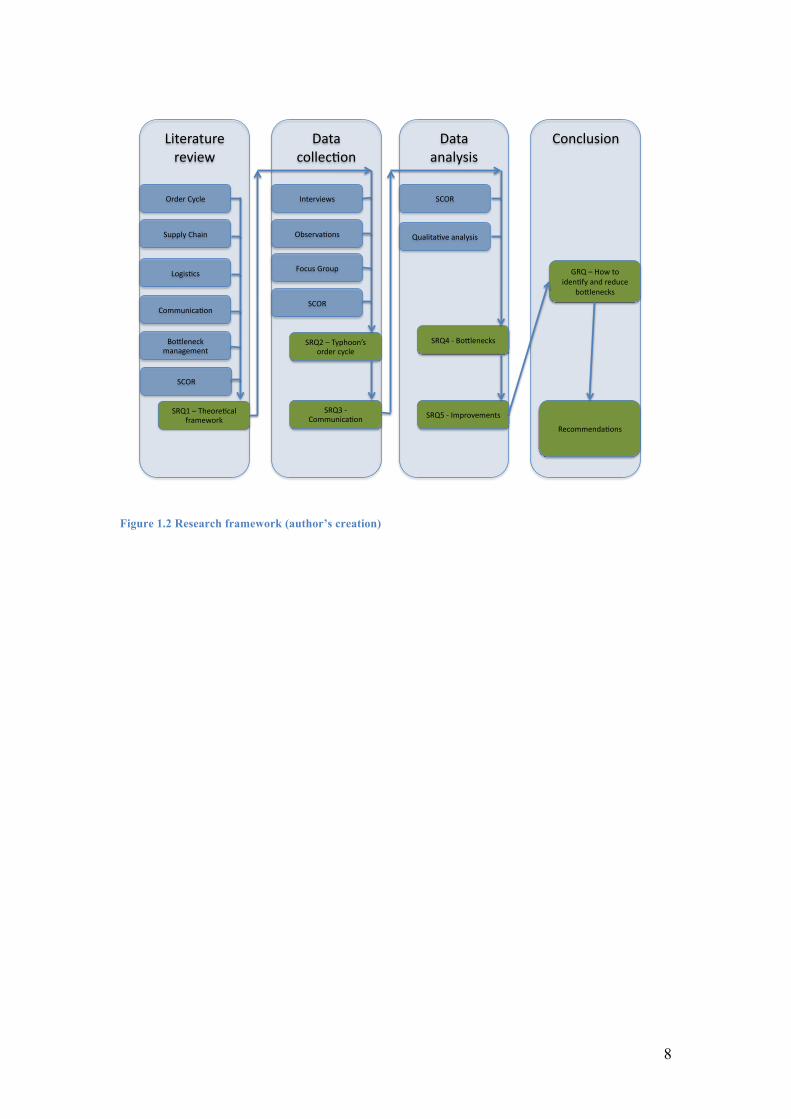
1.5 Research framework A research framework is a visualization representing the procedures and the actions to
be taken in order to fulfil the research objective. In this case the literature review
builds up the theoretical framework to answer the first specific research question, data
collection is conducted to answer specific research questions two and three. SCOR
model is used as guidance during the data collection as well as during the data
analyses. Qualitative data analyses helps to answer specific question four and five.
Finally, conclusion stage wraps up the findings in order to provide the answer to the
general research question and to make recommendations.
Figure 1.2 depicts the research framework of this research.
8
Figure 1.2 Research framework (author’s creation)
Literature(review(
Data(collec/on(
Data((analysis(
Conclusion(
Order(Cycle( Interviews(
Observa/ons(
Focus(Group(
SCOR(
Qualita/ve(analysis(Supply(Chain(
Logis/cs(
SRQ1(–(Theore/cal(framework(
Recommenda/ons(
SRQ2(–(Typhoon’s(order(cycle(
SRQ3(I(Communica/on(
SRQ4(I(BoLlenecks(
SRQ5(I(Improvements(
GRQ(–(How(to(iden/fy(and(reduce(
boLlenecks((
Communica/on(
BoLleneck(management(
SCOR(
SCOR(

9
2 Literature review This chapter discusses the results of the literature study in order to provide an answer
to the first specific research question. A set of topics shapes the theoretical framework
that steer the empirical research towards its successful execution. The framework will
be discussed in the final section of chapter two.
To understand the function of the order cycle, the following paragraphs will describe
the characteristics of the order cycle (2.1) and supply chain management and logistics
(2.2) as disciplines influencing order cycle performance. Information and
communication in SCM (2.3) is described in this chapter as well as bottleneck
management (2.4). As a tool to assess the order cycle, the Supply Chain Operations
Reference model was selected and described (2.5). Finally, the conclusions of the
literature study are discussed (2.6) and the theoretical framework is derived (2.7).
2.1 Order cycle In this section, the order cycle as the essential part if this study is described as well as
elements determining its form and length. Subsection 2.1.1 presents the concept of
lead-time, subsection 2.1.2 focuses on controllable order cycle issues and subsection
2.1.3 presents manufacturing strategies. The purpose of this section is to give the
readers a clear understanding of the order cycle and it’s meaning to the company so
they may comprehend the situation in its entirety.
The order cycle as such is a part of the supply chain. The function of the order cycle is
to secure an ordered product or service for the customer. The sequence of activities
begins and ends on customers’ side, but majority of activities are done by its
counterparties (e.g. suppliers, manufacturer, distributors, carriers). The order cycle
starts when the customer recognizes a need for a product and places an order and ends
when the product is delivered to the customer and is ready for use.
Figure 2.1 depicts a simplified version of a typical order cycle with its core
components that need to be present in every order cycle. The arrow under the figure
determines the sequence of order cycle components that cannot stand-alone but must
be gradually executed one by one. Each component in the cycle can be further
decomposed into a set of different activities. According to the character and
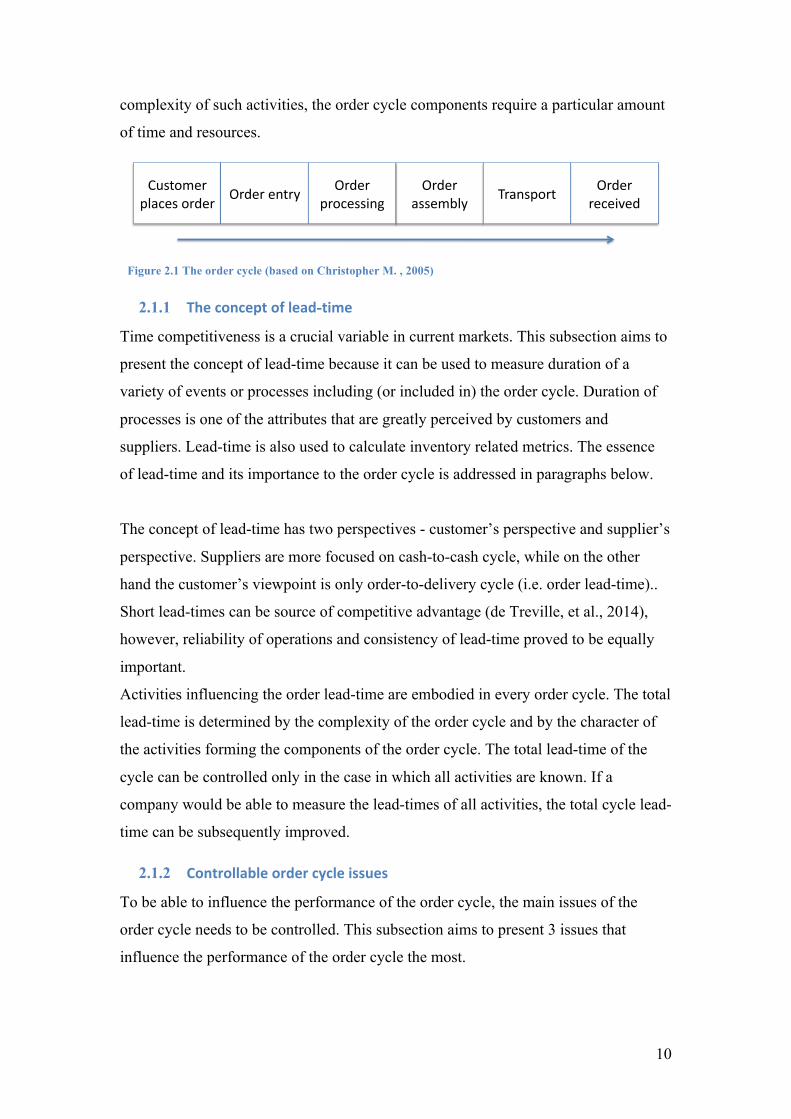
10
complexity of such activities, the order cycle components require a particular amount
of time and resources.
Figure 2.1 The order cycle (based on Christopher M. , 2005)
2.1.1 The concept of lead-time
Time competitiveness is a crucial variable in current markets. This subsection aims to
present the concept of lead-time because it can be used to measure duration of a
variety of events or processes including (or included in) the order cycle. Duration of
processes is one of the attributes that are greatly perceived by customers and
suppliers. Lead-time is also used to calculate inventory related metrics. The essence
of lead-time and its importance to the order cycle is addressed in paragraphs below.
The concept of lead-time has two perspectives - customer’s perspective and supplier’s
perspective. Suppliers are more focused on cash-to-cash cycle, while on the other
hand the customer’s viewpoint is only order-to-delivery cycle (i.e. order lead-time)..
Short lead-times can be source of competitive advantage (de Treville, et al., 2014),
however, reliability of operations and consistency of lead-time proved to be equally
important.
Activities influencing the order lead-time are embodied in every order cycle. The total
lead-time is determined by the complexity of the order cycle and by the character of
the activities forming the components of the order cycle. The total lead-time of the
cycle can be controlled only in the case in which all activities are known. If a
company would be able to measure the lead-times of all activities, the total cycle lead-
time can be subsequently improved.
2.1.2 Controllable order cycle issues
To be able to influence the performance of the order cycle, the main issues of the
order cycle needs to be controlled. This subsection aims to present 3 issues that
influence the performance of the order cycle the most.
Customer*places*order*
Order*entry*Order*
assembly*Order*
processing*Order*
received*Transport*
The*Order*Cycle*

11
Time and resource requirements of single order cycle components should be
monitored in order to assess the performance of the order cycle. To be able to do so, it
is necessary to analyze the way the order-related activities are carried out. Many
scientists argued, that the main issues to control and measure the performance of the
order cycle are the order entry method, order lead-time and the customer order path
(Bhagwat & Sharma, 2007) (Gunasekaran, Patel, & McGaughey, 2004). The details
of the 3 issues are described hereunder.
The order entry method
Order entry is a process of receiving a customer order. The order entry method
determines the way in which customer order specifications are converted into useful
information and passed through the supply chain (Bhagwat & Sharma, 2007). Also,
the extent of this information plays a significant role. This initial information and its
form connect all layers of the supply chain and affect the activity scheduling. Proper
control of the order is possible and can be used as a performance measure. However,
the order entry method should ultimately provide timely, accurate and usable
data(Gunasekaran, Patel, & Tirtiroglu, 2001). Influence of the order entry method on
order lead-time and responsiveness of the order cycle can be described as twofold.
First, it influences the order lead-time by duration of the entry process itself and
second, the total order lead-time is influenced by outcome of the order entry, where
the quality of the information and its form influence the execution of order cycle
related processes that follow and use provided outcome.
Order lead-time
The total order cycle time that is also called “order lead-time”, is defined as time
necessary to deliver the order to the customer. Order lead-time elapses between the
moment of receiving the customer’s order and the moment of delivering the order to
the place given by the customer. The time elements determining the total order lead-
time are order entry time, order planning time, order sourcing, assembly and follow
up time and finished goods delivery time. Order lead-time also includes the time
when the order is idle (e.g. order waits to be produced, order waits to be shipped).
Any reduction in the order cycle time will improve the SC responsiveness. This can
be used as a performance measure. Reduction of the order cycle time is a source of
competitive advantage as well (Christopher M. , 1992). Furthermore, reliability and
12
consistency of lead-time is equally important. Due to bottlenecks, inefficient
processes and fluctuation in the volume of orders handled the completion times may
vary. Thus, customer service levels can be affected (Gunasekaran, Patel, & Tirtiroglu,
2001).
The customer order path
Another important measure is the order path. The path that orders must go through is
composed of different activities. It is important to map these activities and processes
in order to be able to specify activities or sequence of activities that need to be
improved. It is also a necessary prerequisite for calculating the lead-time, because the
problematic processes can be traced only if the order path is clearly defined, as there
are usually more possible routes that the order must travel. If this is done correctly the
improvements can be projected.
2.1.3 Manufacturing strategies
Another factor that influences the order cycle is manufacturing strategy. This section
presents different manufacturing strategies in order to introduce their characteristics
and influence on operations of businesses.
Literature by Bowersox et al.(2010) and Paton et al. (2011) distinguishes, among
others, two manufacturing strategies, next to be elaborated: 1) made to order (MTO),
and 2) made to stock (MTS). Each strategy has different characteristics and suits
different operations.. The 2 strategies have two characteristics in common, namely the
impact on lead-time and amount of inventory in system because each strategy applies
a different approach to the use of resources. Understandably, each manufacturing
strategy has advantages and disadvantages. Description of both manufacturing
strategies is provided below.
Made to stock
MTS strategy is typical for industries exploiting economy of scale resulting from long
production runs. Companies that are unwilling or unable to share information with
other actors in the distribution channel usually adopt this strategy. Production of such
companies is based upon a market forecast and substantial portion of finished goods
inventory is stored in anticipation of future demand. This requires large storing
capacity especially for wide product assortment because MTS manufacturing strategy
sources the material before the product is ordered. Unfortunately, if the company fails

13
to forecast accurately, the result is typically an unplanned inventory. The likelihood of
misgauging customer requirements makes the MTS strategy risky. If the forecasts are
accurate, the advantage of the anticipatory model is a short order lead-time. This is
because the desired product is picked from the warehouse and immediately shipped to
the customer after the order is placed. A disadvantage of the MTS strategy is low
flexibility of production because switchover between produced goods can be costly
and lengthy.
Made to order
MTO strategy, in contrast to MTS, seeks to manufacture products according to
customers’ preferences and specifications and sources the material in the moment
when order is placed. The significant difference between the MTO and the MTS
strategy is in use of information. The MTS manufacturing strategy uses information
generated by forecasts while the MTO strategy seeks to quickly spread accurate
information between supply chain actors. Information sharing improves both the
speed and accuracy of supply chain operations. Continuously developing technologies
enables supply chain actors to obtain accurate sales data and share it with each other
and therefore improve the overall control of supply chain.
This strategy is connected with higher costs for manufacturing, but saves on
warehousing and handling because the product is usually shipped directly to the
customer after its finished.
Figure 2.2 illustrates properties of MTS and MTO strategies and represents the
difference between anticipation and responsiveness. The strategies set the planning
horizon as each strategy applies a different approach to the use of resources. It can be
seen that the total lead-time of anticipatory model is longer in compare with the
responsive model. Nevertheless, the lead-time perceived by customers is shorter when
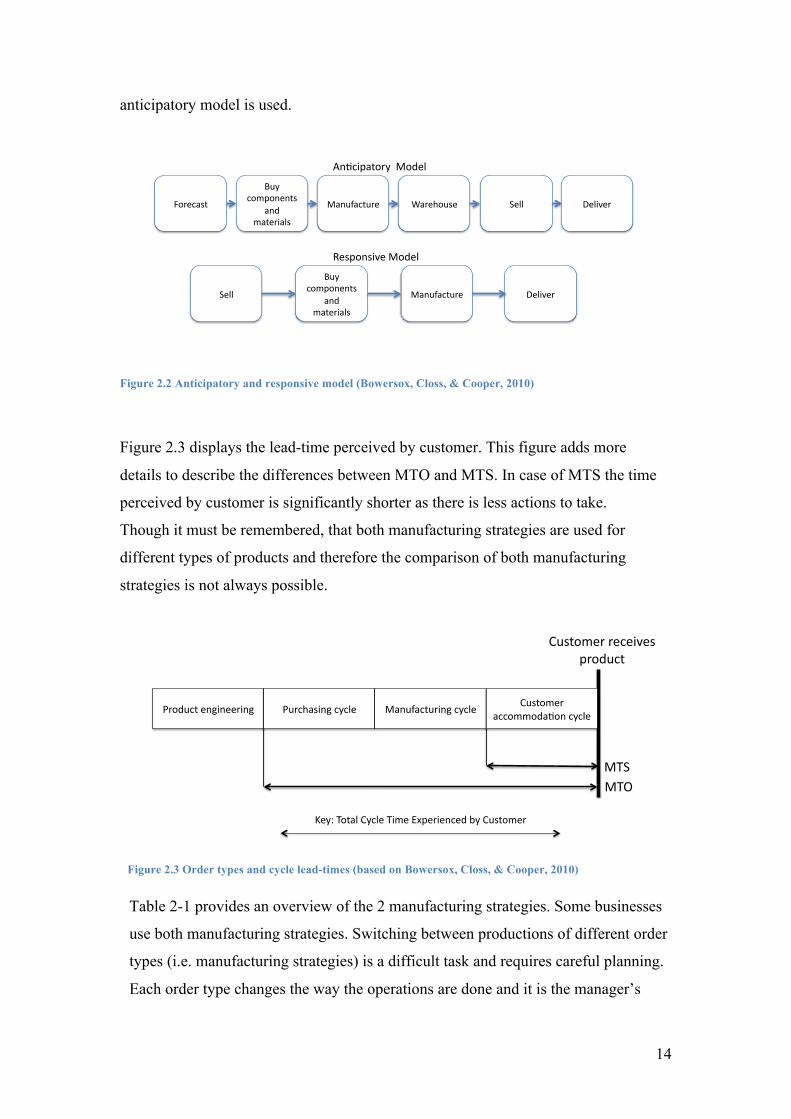
14
anticipatory model is used.
Figure 2.2 Anticipatory and responsive model (Bowersox, Closs, & Cooper, 2010)
Figure 2.3 displays the lead-time perceived by customer. This figure adds more
details to describe the differences between MTO and MTS. In case of MTS the time
perceived by customer is significantly shorter as there is less actions to take.
Though it must be remembered, that both manufacturing strategies are used for
different types of products and therefore the comparison of both manufacturing
strategies is not always possible.
Figure 2.3 Order types and cycle lead-times (based on Bowersox, Closs, & Cooper, 2010)
Table 2-1 provides an overview of the 2 manufacturing strategies. Some businesses
use both manufacturing strategies. Switching between productions of different order
types (i.e. manufacturing strategies) is a difficult task and requires careful planning.
Each order type changes the way the operations are done and it is the manager’s
Forecast*
Buy*components*
and*materials*
Manufacture* Warehouse* Deliver*Sell*
An)cipatory**Model*
Sell*
Buy*components*
and*materials*
Manufacture* Deliver*
Responsive*Model*
MTS(MTO(
Customer(receives(product(
Key:(Total(Cycle(Time(Experienced(by(Customer(
Product(engineering( Purchasing(cycle( Manufacturing(cycle(Customer(
accommoda/on(cycle(

15
decision what approach will be used. The manager’s decision is influenced by
several factors such customer involvement, character of the production, or physical
layout of processes.
Make to stock (MTS)
Make to order (MTO)
Product Producer specified low variety, inexpensive
Customer specified, high variety, moderate cost
Production volume of each sales unit
High Medium
Objectives Balance inventory, capacity and service
Manage delivery lead-times and capacity
Main operations problems
Forecasting, production planning, control of inventory
Specification, quality levels, delivery time
Lead-time Short Long
Interaction between production function and customer
Low – products are already finished, customer receives unchanged product
Medium – products are produced according to customers needs, though the products were already engineered and tested
Order promising According to the level of finished goods inventory
AcAccording to availability of manufacturing capacity
Table 2-1 Characteristics of manufacturing strategies (based on Paton, Clegg, Hsuan & Pilkington, 2011;
Wemmerlöv, 1984 and Yang, 2013)
Manufacturing strategies are distinguished according to customer involvement.
Figure 2.4 shows customer involvement for both manufacturing strategies. The point
of customer involvement is known as Customer Order Decoupling Point (CODP).
The CODP is a point in the SC system where “push” and “pull” elements of a SC
meet, in other words, CODP is a point which separates order-driven activities from
the forecast driven activities(van Donk, 2001) At this point, the customer triggers
operations belonging to the particular strategy and are necessary to complete the
order cycle according to the customers requirements. From that moment onwards
the customer may influence the process and subsequently the delivery, or
customisation can begin. In case of MTS the customization occurs after design and
production phase and influences packaging and delivery only. Involvement of the

16
customer in the MTO production is greater, because the customer is involved
already during the manufacturing phase. This is typical for tailor-made products
where the maximal amount of customization is necessary. Disadvantages of MTO
are longer lead-time and higher price of the product.
Figure 2.4 CODP in MTO and MTS manufacturing strategies (based on Sjobakk, Thomassen, & Alfnes,
2014)
Finally, Table 2-2 summarizes the higher presented information about the order cycle
issues and manufacturing strategies and includes their challenges and benefits.
Issues Description Challenge Effect / Benefit
Entry method The way customer requirements are received and transformed into usable information that is passed along the supply chain, its extent and form
To make the information understandable and convenient to handle and interpret
Less effort necessary during manipulation with the information, associated activities consume less amount of time
Order lead-time Time elapsed between the receipt of customer order and delivery of goods
Lead-time reduction Improved responsiveness of the OC (and the SC), competitive advantage
Customer order path
The path that an order has to travel through the supply chain
Identification of ineffective processes and time consuming activities
Elimination or reduction of redundant and ineffective activities
Manufacturing strategy
Strategy that drives manufacturing processes of a company
To find balance between MTO/MTS
Inventory cost and manufacturing time optimisation
Table 2-2 Order cycle issues and challenges (based on Christopher, 1992, Cho, et al., 2012, Gunasekaran,
et al., 2004 and Bhagwat & Sharma, 2007, Arreola-Risa & De Croix, 1998)
Subsidiaries Business partnersTyphoon Germany (HQ) Typhoon USATyphoon Switzerland Typhoon UKCSP GermanyCSP Switzerland
Manufacturing strategy Design
Manufacturing and
procurement Assembly ShipmentMTS CODPMTO CODP

17
2.1.4 Summary
In this section, the order cycle and factors influencing the order cycle are presented.
The order cycle is a process with sequence of activities that generates value to the
customer. The concept of lead-time determines the duration of the order cycle as such
and can also be used to measure duration of any other activity or process. The order
cycle composes of different components. Each component can be broken down into
single activities. There are 3 order cycle related issues that needs to be controlled in
order to be able to manipulate the performance of the order cycle. The 3 issues are the
order entry method, order lead-time and the customer order path. To reduce the total
cycle time, it is necessary to manage one or more activities more efficiently.
Moreover, manufacturing strategy also plays its role in order cycle formation. MTO
and MTS manufacturing strategies determine the total order lead-time as well as the
amount of inventory in the system.
In order to enrich the reader’s notion about information presented in section above,
there are supplementary figures presented in Appendix 1 – Figures and tables of
chapter 2.
2.2 Supply chain management and logistics This section aims to present supply chain management (2.2.1), logistics (2.2.2) and
integrated logistic management (2.2.3). These topics are presented because they are
related to the order cycle and influence its formation, structure and performance. Key
findings about these topics are summarized at the end of this section (2.2.4).
2.2.1 Supply chain management
Supply chain and supply chain management are despite many commonalities two
different terms. To stress the differences, both supply chain (SC) and supply chain
management (SCM) are described in this subsection to understand the meanings and
its relation to the order cycle.
Supply chain
A variety of definitions of a SC have been presented in the past years as the concept
has gained importance. Martin Christopher (1998) suggests that a SC is a network of
organizations cooperating through upstream and downstream linkages, in the different
processes and activities that create value in the form of products and services in the
hands of the ultimate consumer. Apics dictionary defines SC as the global network

18
used to deliver products and services from raw materials to end customers through
engineered flow of information, physical distribution, and cash (Apics, 2013).
Lummus and Vokurka (1999) examined a variety of SC definitions. They summarize
SC definitions into one as: “all the activities involved in delivering a product from
raw material through to the customer including sourcing raw materials and parts,
manufacturing and assembly, warehousing and inventory tracking, order entry and
order management, distribution across all channels, delivery to the customer, and the
information systems necessary to monitor all of these activities”. In the broad sense a
SC can also be called inter-organizational SC while in the narrow sense it can be
called intra-organizational SC (Stadtler, 2015). Both types of supply chains consist of
directly and indirectly involved parties fulfilling customer requests. Such parties are
not only manufacturers and suppliers but also other parties that secure transportation
or warehousing. A SC may involve different stages (i.e. agents) including the
following (Chopra & Meindl, 2013):
• customers,
• retailers,
• wholesalers/ distributors,
• manufactures and
• component/ raw material suppliers
SC is a wide topic with number of stages, linkages and activities. All of the presented
SC stages influence the structure of the order cycle. Linkages and activities
influencing the order cycle are described later in this section.
Supply chain management
SCM is the task of integrating organizational units (stages) along a SC and
coordinating materials, information and financial flows in order to fulfil
customer demands with the aim of improving competitiveness of the SC as a
whole (Stadtler, 2015). Such flows are going up and down the stream and are
controlled by one of the stages or by an intermediary.
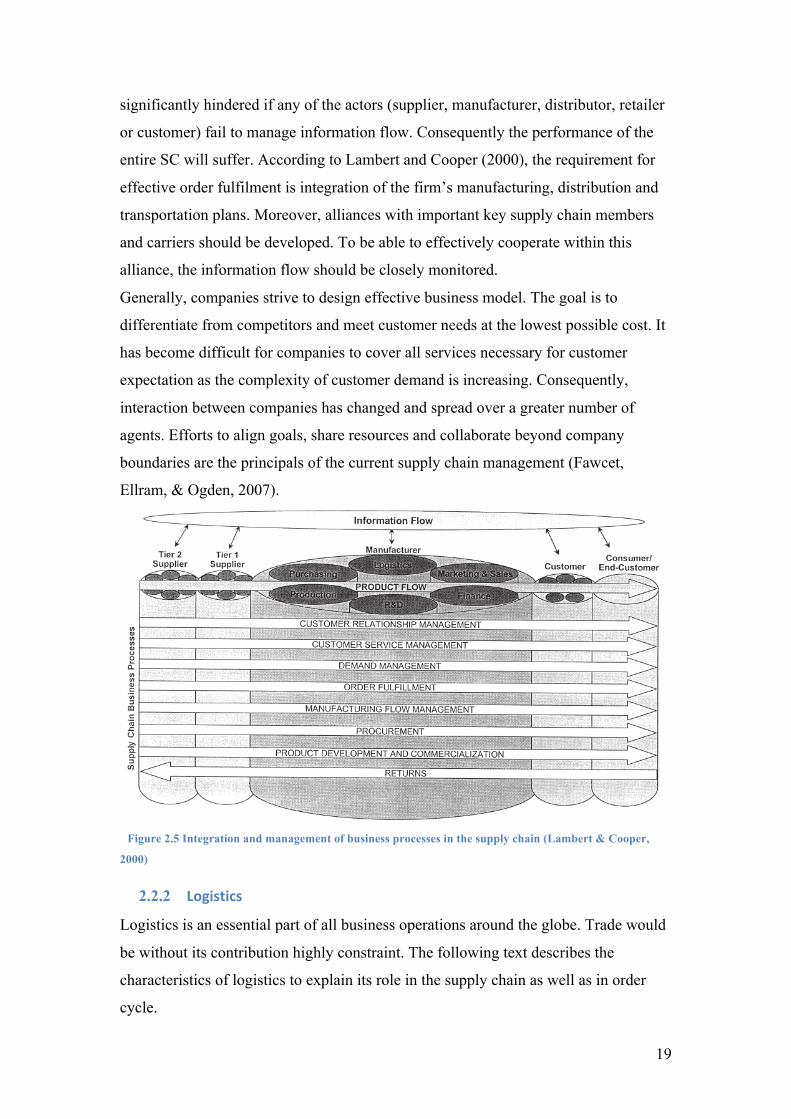
Figure 2.5 depicts the ongoing processes in the SC according to Lambert and Cooper
(2000). The figure shows that all business processes are going through the entire
chain and each actor plays its role. Since the chain connects several actors, the overall
performance is significantly influenced by information flow. Information flow and
exchange is the overwhelming element in a SC. All processes in a SC will be
19
significantly hindered if any of the actors (supplier, manufacturer, distributor, retailer
or customer) fail to manage information flow. Consequently the performance of the
entire SC will suffer. According to Lambert and Cooper (2000), the requirement for
effective order fulfilment is integration of the firm’s manufacturing, distribution and
transportation plans. Moreover, alliances with important key supply chain members
and carriers should be developed. To be able to effectively cooperate within this
alliance, the information flow should be closely monitored.
Generally, companies strive to design effective business model. The goal is to
differentiate from competitors and meet customer needs at the lowest possible cost. It
has become difficult for companies to cover all services necessary for customer
expectation as the complexity of customer demand is increasing. Consequently,
interaction between companies has changed and spread over a greater number of
agents. Efforts to align goals, share resources and collaborate beyond company
boundaries are the principals of the current supply chain management (Fawcet,
Ellram, & Ogden, 2007).
Figure 2.5 Integration and management of business processes in the supply chain (Lambert & Cooper,
2000)
2.2.2 Logistics
Logistics is an essential part of all business operations around the globe. Trade would
be without its contribution highly constraint. The following text describes the
characteristics of logistics to explain its role in the supply chain as well as in order
cycle.
67
of Logistics Management (CLM) in 1986.
2
That is, SCMwas viewed as logistics outside the firm to include cus-tomers and suppliers. Logistics, as defined by the CLM,always represented a supply chain orientation “frompoint of origin to point of consumption.” Then why theconfusion? It is probably due to the fact that logistics is afunctional silo within companies and is also a bigger con-cept that deals with the management of material and in-formation flows across the supply chain. This is similarto the confusion over marketing as a concept and market-ing as a functional area. Thus the quote from CEO:“Marketing is too important to be left to the marketingdepartment.” Everybody in the company should have acustomer focus. The marketing concept does not apply
just to the marketing department. It is everybody’s re-sponsibility to focus on serving the customer’s needs.
The understanding of SCM has been re-conceptualizedfrom integrating logistics across the supply chain to thecurrent understanding of integrating and managing keybusiness processes across the supply chain [5]. Based onthis emerging distinction between SCM and logistics, inOctober 1998 CLM announced a modified definition oflogistics. The modified definition explicitly declaresCLM’s position that logistics management is only a partof SCM. The revised definition is as follows:
Logistics is that part of the supply chain process thatplans, implements, and controls the efficient, effectiveflow and storage of goods, services, and related informa-tion from the point-of-origin to the point-of-consumptionin order to meet customers’ requirements.
3
Imagine the degree of complexity required to manageall suppliers back to the point of origin and all products/
FIGURE 1. Supply chain management: integrating and managing business processes across the supply chain.Source: [7, p. 10]
2
In 1986, the Council of Logistics Management, the leading-edge professionalorganization with a current membership of over 15,000, defined logisticsmanagement as:
The process of planning, implementing, and controlling theefficient, cost-effective flow and storage of raw materials, in-process inventory,finished goods, and related information flow from point-of-origin to point-of-consumption for the purpose of conforming to customer requirements.
What’s ItAll About?
Council of Logistics Management, Oak Brook, Illinois, 1986.
3
Presented at the annual business meeting, Council of LogisticsManagement (CLM), in Anaheim, California, in October 1998. The definitionis posted at the CLM’s homepage at http://www.CLM1.org.

20
Logistics within a firm’s supply chain is described as the work necessary to move
inventory in time and position (Bowersox, Closs, & Cooper, 2010). Generally, the
complexity of logistics has increased because organizations have moved from single-
site, centralized manufacturing facilities to more complex and geographically
scattered networks using different resources in order to create maximal value for the
customer (Stock, Greis, & Kasadra, 2000). The growing importance of logistics is
nowadays widely recognized because it is concerned with getting products and
services to the places where they are required at the desired time. Logistics is the key
element for supply chain. Accomplishing any business activity without logistics
would be very difficult because it involves diversified activities that are integrated in
a functional network. The challenge of such network is to coordinate the functional
competency in order to serve customers and to complete the order cycle. According to
Bowersox et al.(2010) logistics refers to the responsibility to design and administrate
the system and control the movement and geographical positioning of raw materials,
work-in-process , and finished inventories at minimal cost. Inventory that is not
delivered at the right time to the right place has limited value. To exploit strategic
benefits of logistic it is necessary to control five areas of logistical work. These are
(Bowersox et al., 2010):
• Inventory,
• Order processing,
• Transportation,
• Warehousing,
• Material handling and packaging,
• Facility network.
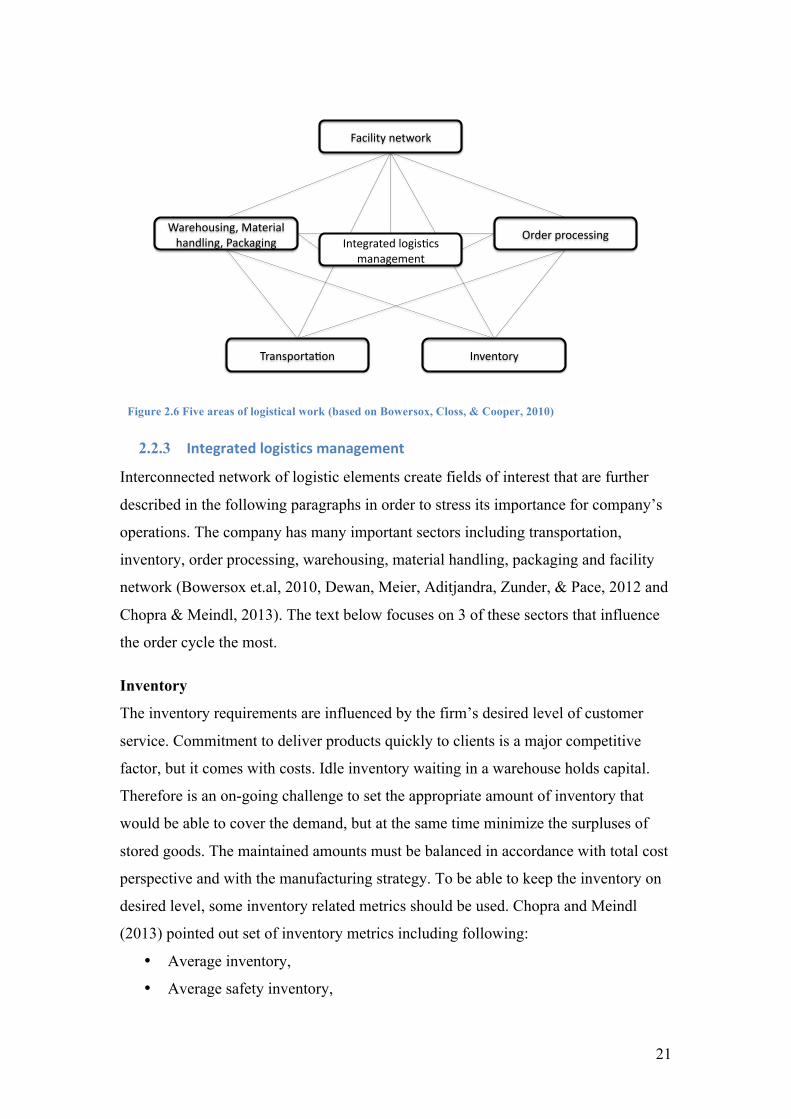
Figure 2.6 depicts the relations between single areas of logistical work. The functional
areas are mutually interconnected and decisions taken in one area are influencing to
the rest of the network. Moreover, these activities facilitate order fulfilment.
21
Figure 2.6 Five areas of logistical work (based on Bowersox, Closs, & Cooper, 2010)
2.2.3 Integrated logistics management
Interconnected network of logistic elements create fields of interest that are further
described in the following paragraphs in order to stress its importance for company’s
operations. The company has many important sectors including transportation,
inventory, order processing, warehousing, material handling, packaging and facility
network (Bowersox et.al, 2010, Dewan, Meier, Aditjandra, Zunder, & Pace, 2012 and
Chopra & Meindl, 2013). The text below focuses on 3 of these sectors that influence
the order cycle the most.
Inventory
The inventory requirements are influenced by the firm’s desired level of customer
service. Commitment to deliver products quickly to clients is a major competitive
factor, but it comes with costs. Idle inventory waiting in a warehouse holds capital.
Therefore is an on-going challenge to set the appropriate amount of inventory that
would be able to cover the demand, but at the same time minimize the surpluses of
stored goods. The maintained amounts must be balanced in accordance with total cost
perspective and with the manufacturing strategy. To be able to keep the inventory on
desired level, some inventory related metrics should be used. Chopra and Meindl
(2013) pointed out set of inventory metrics including following:
• Average inventory,
• Average safety inventory,
Facility*network*
Warehousing,*Material*handling,*Packaging*
Order*processing*
Inventory*Transporta)on*
Integrated*logis)cs*management*
22
• Average replenishment batch size,
• Fill rate, or
• Cash to cash cycle time
Furthermore, inventory related metrics are extensively described by Steven Bragg
(Bragg, 2005). Selection and use of metrics is different for every business.
Determination of the key metrics and measures should be tailored to each business
individually according to its needs and goals.
Order processing
Order processing is important because it has a large impact on the customer
satisfaction and their perception of the service(Baltacioglu, Ada, Kaplan, & Yurt,
2007). There are facets of the critical information in this operation including the order
entry method, order lead-time and the customer order path (Gunasekaran, Patel, &
Tirtiroglu, 2001). The metrics of order processing were previously discussed in
section 2.1. In most supply chains, orders are formed by the customer’s need and
desires. The processing of such order demands a high level of organization in order to
fulfil the customer requirements. The order-processing competency is considered to
be crucial for company competitiveness (Bowersox et al., 2010). Order processing is
composed of numerous sub processes such as order preparation, order entry, order
transmittal, order filling and order status reporting(Balou, 2004) and these sub-
processes are interlinked with other functions of SCM.
Warehousing, material handling, packaging
Warehousing, material handling and packaging are integral part of the logistical
operations. These are basic processes that are necessary for any business focused on
production. A decision that needs to be made is whether to use own facilities for these
operations or whether to outsource them. These processes are connected with its costs
and according to the character of the business are either outsourced or performed by
the company itself. Nevertheless, all operations are important to the company and it is
necessary to secure them. Warehouse processes that need to be designed and
controlled include: product storage, order batching, picking, packing and release,
value-added logistics activities, and shipment. Especially order picking and storage
are often labor-intensive processes that determine warehouse performance to a large
part (Faber, de Koster, & Smidts, 2013). If all operations are implemented in one

23
facility, such facility creates independent micro system within the overall logistical
process. If this is effectively integrated into an enterprise’s logistical operation,
product flow can be facilitated. Each activity should be measured independently with
different metrics, but measurements common for all three activities are evaluated on
basis of:
• total costs,
• total times and
• capacities
These activities are not the main point of interest while measuring the performance of
entire SC since these activities are used rather as supportive ones. However, these
activities must be controlled and measured as well.
2.2.4 Summary
A SC is a network of organizations cooperating in order to fulfil customer’s demand.
A SC includes 5 different stages (supplier, manufacturer, distributor, retailer and
customer). These stages are interlinked with material, informational and financial
flows. SCM coordinates these flows in order to generate the highest possible value to
the customer at the lowest possible cost. The most important linkage for SC and SCM
is information. SC performance would be without proper control of information very
limited. Information is necessary to control and manage all SC activities. An essential
part of SC activities form logistics related activities. Logistics as such can be
subdivided into 5 areas of logistical work. The 5 areas of logistical work create so-
called integrated logistical management. Out of the 5 areas, 3 areas were selected as
relevant to this case. The 3 selected areas are: 1) order processing, 2) inventory and 3)
warehousing, material handling, packaging.
2.3 Communication and information in SCM The following paragraphs examine the roles of communication and information in
supply chain management because previous sections mentioned their importance.
Information and communication are the basic elements but are fundamentally
important for a functioning supply chain. Firms engaged in SC relationships, as well
as customers, suppliers, or service providers need to share a great deal of information
in the course of their interaction (Cutting-Decelle, et al., 2007). Quality information
can enhance utilization of SC assets and coordination of SC flows to increase

24
responsiveness and reduce costs (Chopra & Meindl, 2013). The role of information
was previously discussed and depicted in Figure 2.5.
The information-sharing paradigm is the known belief that a high degree of
cooperation requires actors in the supply chain to voluntarily share operating
information. The extent of cross-enterprise collaboration should go beyond customer
details or sales. Important data that should be shared are about day-to-day operations.
By sharing the data with other SC actors, an organization can improve the efficiency
and effectiveness of the SC and act more responsively on changes in customers needs
(Li & Lin, 2006). Bowersox et al. (2010) stressed, that willingness to share
information about future joint operations is of great importance. Lack of information
sharing may cause a so called “bullwhip effect” - the phenomenon in which
information on demand is distorted and amplified as moving up the stream in the
supply chains (Lee, Padmanabhan, & Whang, 1997). Moreover, Sweeney (2006)
pointed out that good information could be substitute for high-level inventory.
Communication and information exchange is essential for supply chain management.
The role is to identify specific locations in the SC system that has requirements for
specific information such as faults, dates and amounts of orders. Chopra and Meindl
(2013) identified information as the biggest driver of the supply chain because it
directly affects all other drivers. Information allows managers to make supply chains
more responsive and efficient. Also, as previously discussed, according to the
availability of information, managers can adopt either the anticipatory or responsive
model of production.
2.4 Bottleneck management This section describes how to spot the weak elements in systems that are called
bottlenecks. In order to re-design business processes or to improve any kind of
performance it is necessary to identify and manage these bottlenecks.
Christopher (2005) defined bottleneck as an activity that determines the performance
of the whole system. Bottleneck is a weak part of a chain and it can occur in different
forms. A bottleneck can be staff capacity, operational processes, human error,
mechanical fault, facility, resource, or it could also be a part of the information flow
such as order processing (Hinckeldeyn, Dekkers, Altfeld, & Kreutzfeld, 2014, Apics,
2013).

25
All ongoing processes in the supply chain can be perceived as series of complex and
inter-linked activities that can only be optimized as a whole by focusing on total
output. Attempts to manage single elements independently will not bring the optimal
result (Christopher M. , 2005). There are different aspects of bottleneck management.
For unplanned bottlenecks (bottlenecks that occur in the system without anyone
wanting them) the 4 aspects are: 1) prevention, 2) identification, 3) exploitation and 4)
elimination. For planned bottlenecks (bottlenecks placed to the system on purpose)
there is an extra aspect on top of the 4 aspects: 5) location (Tse, Mathew, Wong, Lam,
& Ko, 2014).
Bottleneck prevention does not apply for this case as it is focused on existing
bottlenecks. Bottleneck identification is crucial for improvements of the system. To
identify bottleneck utilization-based, queue length-based or wait-time based method
can be employed (Tse et al., 2014). Once the bottleneck has been identified, the
particular part should be resolved in order to improve the performance of entire
system. Any improvements in non-bottleneck links of a chain would only lead to an
accumulation of unwanted inventory in bottlenecks. In other words, benefits of the
improvements in non-bottlenecks will not be exploited unless the bottlenecks are
removed. Thus, the output of non-bottlenecks should be governed in a way that
subsequent bottlenecks will not be overwhelmed. This would result in improved
throughput time and minimization of inventory in the system.
Next aspect, exploitation of bottlenecks demands to adjust bottleneck related activities
in a way that bottleneck item will be maximally utilized. Hence, any impediments or
idle times of bottleneck use should be minimized. Moreover, to maximize the
utilization of bottleneck, there should be a buffer behind the item to prevent blockages
if subsequent items are not in use (e.g. bottleneck item is working extra time). This
applies especially to processes treating physical flows. To eliminate bottleneck, it is
necessary to improve the methods in use or it can be eliminated through facility
addition (Koenig, 1994).
To summarize the important information about bottleneck management, it should be
pointed out, that bottleneck can occur is every type of system in several different
forms. By managing occurring bottleneck, the performance of the whole system can
be enhanced. For this case, bottleneck is defined as a process or a way of
communication that impedes the order cycle from a higher performance. To manage
such bottlenecks, it is necessary to identify, exploit and eliminate them.

26
2.5 Supply-Chain Operation Reference-model (SCOR) In order to asses the order cycle related operations, the SCOR model was selected.
The SCOR model was developed and introduced by the Supply-Chain Council (SCC).
The first version was released in 1997 and over the years the model has been
improved and adjusted with more versions introduced. Currently, Version 10.0 is
being used. This section presents 2 of its 4 components, more specifically processes
(2.5.1) and performance (2.5.2). The 2 components are presented because they cover
most of the issues of this study. Finally, summary of key details is presented (2.5.3).
The SCOR model is a framework that evaluates and compares supply chain activities
and their performance. This framework allows its users to determine the performance
of their supply chain and evaluate it internally as well as to compare the performance
against other organizations. The SCOR model helps organizations define and refine
strategy, manage processes, and measure performance. The SCOR model can also
capture the “as-is” (current) state of operations in businesses, which is important for
deriving the desired “to-be” (future) state. The model consists of four major
components:
• Processes: Description of management procedures in a company and process
relationship,
• Performance: Metrics describing process performance,
• Best practises: Practices that contribute to the best-in-class performance, and
• People: Standard definition of requirements necessary to achieve supply
chain processes
2.5.1 SCOR Processes
The SCOR model identifies the unique processes of a supply chain to support value
creation. The SCC (2010) defines a process as a unique activity with predefined
outcomes. The model distinguishes five processes: Plan, Source, Make, Deliver and
Return. These processes are further described in Table 2-3.
The model contains three different levels of process details. Level I (the top level)
deals with the process types included in a supply chain and defines its scope. Level II
deals with the process categories and is considered to be the configuration level.
Level III consists of process elements and is the bottom level in the scope of the
SCOR model.

27
SCOR Process Definition
Plan The Plan processes describe the planning activities associated with a supply chain. This includes the gathering of customer requirements, collecting information on available resources, and balancing resources according to requirements.
Source Processes that describe the scheduling, ordering, and receipt of goods and services.
Make Processes and activities associated with the material conversion or creation of content for services. Make represents all types of material conversion: assembly, chemical processing, maintenance, repair, overhaul, recycling etc. These are recognized by the fact, that one or more item numbers go in, and one or more different item numbers come out of the process.
Deliver The Deliver processes describe activities associated with creation, maintenance, and fulfilment of customer orders.
Return The Return processes describe the activities associated with the reverse flow of goods back from the customer.
Table 2-3 SCOR Level I Process definitions (Supply-Chain Council, 2010)
Figure 2.7 depicts the boundaries of the model and the process types included in a
supply chain. It shows that the model spans from the supplier’s supplier, to the
customer’s customer. This model covers the same scope as previously presented in
Figure 2.5 and the business processes performed in a SC. Therefore it is necessary to
obtain as much information as possible to be able to plan effectively because Plan
process covers all SC actors. This is in alignment with the previously discussed figure
presented by Lambert and Cooper (2000).
Figure 2.7 SCOR model processes and spans (Supply-Chain Council, 2003) 3
The Boundaries of Any Model Must Be Carefully Defined“From your supplier’s supplier to your customer’s customer”
SCOR spans:• All customer interactions, from order entry through paid invoice• All product (physical material and service) transactions, from your supplier’s supplier to your
customer’s customer, including equipment, supplies, spare parts, bulk product, software, etc.• All market interactions, from the understanding of aggregate demand to the fulfillment of
each order
SCOR does not attempt to describe every business process or activity, including:• Sales and marketing (demand generation)• Research and technology development• Product development• Some elements of post-delivery customer support
Links can be made to processes not included within the model’s scope, such as product development,and some are noted in SCOR.
SCOR assumes but does not explicitly address:• Training• Quality• Information Technology (IT)• Administration (non SCM)
SCOR is Based on Five Distinct Management Processes
Deliver Deliver DeliverDeliverSource SourceSource SourceMake MakeMake
Plan
Suppliers’Supplier
SupplierYour Company
Customer Customer’sCustomer
Internal or External Internal or External
Return Return
ReturnReturnReturnReturnReturn
Return
PlanPlan

28
SCOR model contains 185 level III processes (Supply-Chain Council, 2010).
All SCOR Processes are listed in Appendix 3 -
2.5.2 SCOR Performance
The SCOR Performance subsection is comprised of two elements, performance
attributes and metrics. These elements were introduced to measure the performance of
each specific supply chain process. According to Neely et al.(2005), a performance
measurement can be characterized as the process of determining the efficiency and
effectiveness of action. In essence, if the performance cannot be measured, it cannot
be improved.
Performance attributes
A performance attribute composes of a set of metrics used to communicate the
performance of a firm. Each specific attribute can be individually measured and is
used to set the strategic track. SCOR consists of five core SC performance attributes:
Reliability, Responsiveness, Agility, Costs, and Assets. Reflection on these attributes
helps managers choose the strategy for the business, and compare it with others. For
example, managers can pursuit a low cost strategy or compete on reliability and high
performance.
Table 2-4 describes each performance attribute and gives its key performance
indicator. Performance indicators related to order cycle are allocated to reliability and
responsiveness attributes.

29
Attribute Description Key
Performance Indicator
Focus
Reliability The reliability attribute addresses the ability to execute tasks as expected. It is focused on the outcome of a process and its predictability. Distinctive metrics for reliability attribute are (among others): on time, the right quality and quantity.
Perfect order fulfilment
Customer- focused
Responsiveness The responsiveness attribute is focused on the speed at which tasks are performed. Examples include cycle time metrics.
Order fulfilment cycle time
Customer- focused
Agility The agility attribute addresses the ability to react on external influences and the ability to change. External influences incorporate: non-forecasted fluctuation in demand and supply, availability of financial tools, or labour issues.
Flexibility and adaptability
Customer- focused
Costs The cost attribute describes the cost associated with operating the process. Labour costs, transportation costs, and material costs are included in this category.
Cost of goods sold and SCM cost
Internally-focused
Assets The asset attribute expresses the ability to efficiently use the assets. Asset strategies in SC can include inventory reduction.
Cash-to-cash cycle time and return on fixed assets
Internally-focused
Table 2-4 SCOR performance attributes (Supply-Chain Council, 2010)
Metrics
Building on previously discussed SCOR Performance attributes, associated metrics
will be presented in this sub section because ability to measure the performance of the
processes is for all businesses very important.
Neely et at. (2005) describe the term “metric” as a performance measure that is used
to quantify the efficiency and/or effectiveness of an action. It should be clearly
defined how the measure will be calculated, who will perform the calculation, and
from where the data will be obtained.
The SCOR Metrics are a standardized diagnostic measurement. The SCOR model
defines metrics distributed in three levels(Supply-Chain Council, 2010):

30
• Level I metrics are used as a diagnostic tool to measure the overall performance
of the SC. The metrics are used to set reasonable targets that are aligned with
strategic objectives.
• Level II metrics are diagnostic metrics for the superior level I metrics. The
diagnostic relationship helps to identify the causes of a potential performance gap
in Level I.
• Level III metrics are diagnostic metrics for Level II metrics. The relationship is
similar to the relationship between Level II and Level I.
Level I metrics are the indicators of the supply chain performance. To calculate the
values of the level I metric, the values of the level II metrics must be identified.
Unique metric coding allows users to recognize the category and the level where
particular metric belongs. Order cycle related metrics can be found in
Appendix 2 - SCOR Metrics
2.5.3 Summary
In summary it can be stated, that the SCOR model is an all-embracing tool for
assessing SC operations. Its features allow its users to focus on every process
separately. Added value of the SCOR model for this case study is its ability to
distinguish order cycle related processes and metrics. To asses the performance of the
order cycle, performance attributes Reliability and Responsiveness of Typhoon’s
operations needs to be studied. Performance attributes Agility, Costs and Assets are
designed for application on complete SC. Furthermore, the Best practice database can
be of value for improvement suggestions.
2.6 Conclusion literature study Conclusions drawn from the previously discussed literature study will be presented in
the following paragraphs to provide a basis for the theoretical framework.
SC environment influences single attributes of the order cycle and consequently also
its performance. Previously discussed topics pointed out, that factors such logistics,
manufacturing strategy or relationships between the focal company and its customers
and suppliers denote the performance of the order cycle. More specifically the order
entry method, selected manufacturing strategy, quality of used logistics services and
31
customer order path determine the length of the order cycle and worth of created
value to the customer. This is crucial for any kind of company because it is the
customer who ultimately decides about the purchase and initiation of the supply
chain. It is important to point out that order cycle is process, which the customer
perceives in its entirety. The way the company and the customer interact sets the basis
for the performance of the order cycle. It is up to the company and its ability to
forecast, read the market and communicate in order to stimulate issues occurring in
the order cycle. Moreover, communication of information significantly influences not
only the order cycle, but also the entire supply chain and its performance. The way
information is treated and communicated along the chain influences coordination of
SC flows.
A different section of literature study presents bottleneck management. Bottleneck is
a weak part of the chain whose capacity is less than the demand placed upon it (Apics,
2013) and it can be part of any system. To manage such bottleneck, it is necessary to
identify it, exploit it and ultimately eliminate it. To be able to use one of the
bottleneck identifying methods (utilization, queue length or wait-time based method),
it is necessary to map the system where bottleneck occurs. For this task the SCOR
model can be used. The SCOR model identifies the categories to measure as well as
the formulas. The model builds on four links (plan, source, make and deliver) that
constitutes the supply chain. Four basic links that categorize the measurements are
also used in other studies(Gunasekaran, Patel, & Tirtiroglu, 2001, Stewart, 1995). The
most updated SCOR model version also works with fifth link (return) but this was
excluded from this study from two reasons. First, not all versions of the SCOR model
used during this case study include return nor all used literature does. Second,
Typhoon offers disposable products and returns of such products are generally very
rare. The model allows its users to measure entire supply chain performance and
benchmark it against other supply chains from the industry. Nevertheless, the SCOR
model also allows the users to assess single parts of the supply chain (e.g. order cycle)
as it distinguishes between different performance attributes that can be observed and
measured. This study aims to assess the order cycle of a production company. The
SCOR model as order cycle related attributes Responsiveness and Reliability and
therefore these two attributes will be examined.
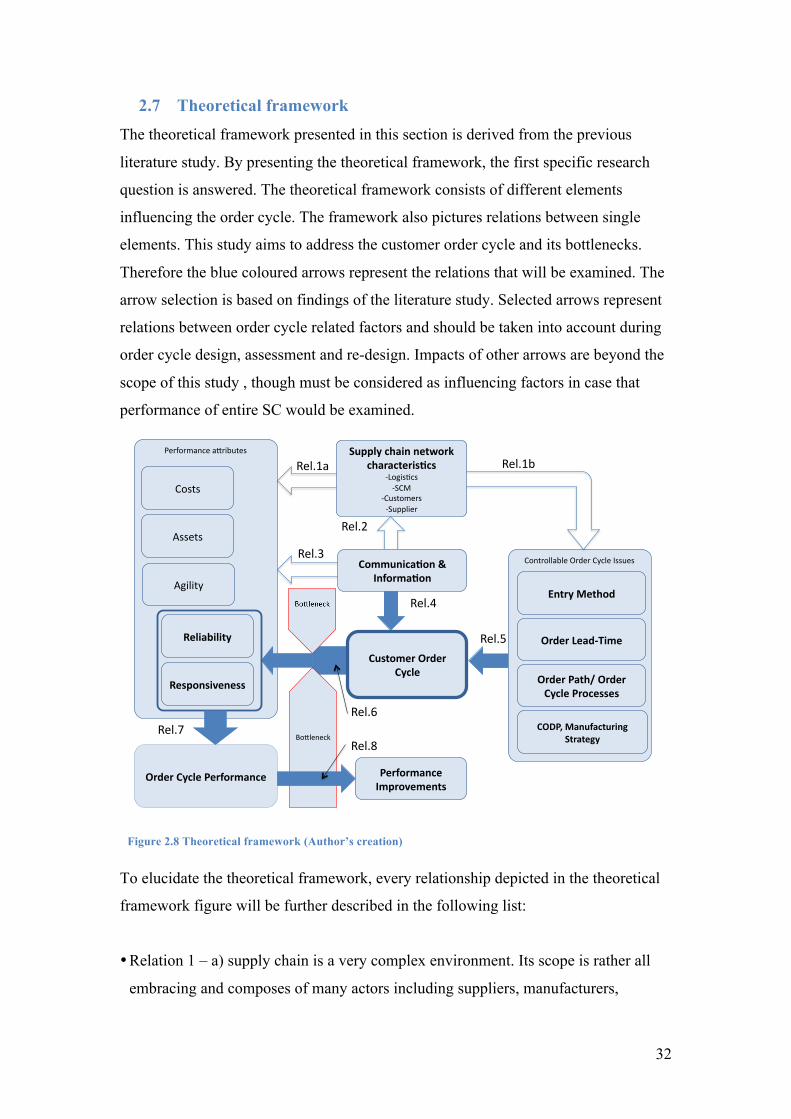
32
2.7 Theoretical framework The theoretical framework presented in this section is derived from the previous
literature study. By presenting the theoretical framework, the first specific research
question is answered. The theoretical framework consists of different elements
influencing the order cycle. The framework also pictures relations between single
elements. This study aims to address the customer order cycle and its bottlenecks.
Therefore the blue coloured arrows represent the relations that will be examined. The
arrow selection is based on findings of the literature study. Selected arrows represent
relations between order cycle related factors and should be taken into account during
order cycle design, assessment and re-design. Impacts of other arrows are beyond the
scope of this study , though must be considered as influencing factors in case that
performance of entire SC would be examined.
Figure 2.8 Theoretical framework (Author’s creation)
To elucidate the theoretical framework, every relationship depicted in the theoretical
framework figure will be further described in the following list:
• Relation 1 – a) supply chain is a very complex environment. Its scope is rather all
embracing and composes of many actors including suppliers, manufacturers,
Performance*a+ributes*
Agility*
Costs*
Assets*
Rel.1a*
Rel.6**Rel.7**
Communica)on*&*Informa)on*
Customer*Order*Cycle*
Rel.2**
Rel.4**
Rel.3**Controllable*Order*Cycle*Issues**
Entry*Method*
Order*Lead:Time*
Order*Path/*Order*Cycle*Processes*
CODP,*Manufacturing*Strategy*
Rel.5**
Performance*Improvements*
Responsiveness*
Reliability*
Order*Cycle*Performance*
Supply*chain*network*characteris)cs*
C LogisEcs*C SCM*
C Customers**C Supplier*
Rel.1b*
Bo+leneck*Rel.8**
33
customers, and service providers. The way the supply chain actors interact with each
other, which strategies and technologies they use, all of mentioned influences the
performance attributes of the company. Consequently, the overall performance of
the supply chain is influenced.
b) Supply chain network characteristics influence the order cycle issues in several
ways. Entry method is for example influenced by the technology used by both
customer and producer. Customer also determines the form of order and position of
CODP. Supplier on the other hand influences the order cycle issues by own delivery
performance that is consequently part of sum of the order lead-time perceive by the
ultimate customer. According to this information can producer plan own operations.
• Relation 2 – Importance and role of communication was previously stressed the
section 2.3. Its influence reaches up to the every supply chain actor as well as up to
every activity undertaken in the network. According to the availability of
information and its communication through the network, single elements of the
supply chain environment are formed. Generally applies, that better communication
and accuracy of information help activities to perform better. Nevertheless, the
exact impact of communication and information on the supply chain generally is
beyond the scope of this research and will not be further examined. However, its
influence needs to be considered during an evaluation of the supply chain
performance.
• Relation 3 – SC performance attributes are influenced by level of communication
and information quality. Some attributes are influenced more than others but
ultimately every attribute is influenced. This case focuses on order cycle and its
related attributes. This general relation includes other performance attributes and
will be therefore omitted from the study. Relation 4 and 6 address the effect of
communication on order cycle related performance attributes.
• Relation 4 – The relation of communication and information to order cycle has two
perspectives. First, communication within the company itself (internal
communication) where departments and individuals contributing to completion of
the order cycle. Second, communication of the company with its customers and
suppliers (external communication). In both perspectives better communication

34
enhances the performance of the order cycle. Better communication mitigates any
uncertainties within the order cycle and accurate information helps to improve
inventory management and complete the order cycle in a timely manner. Potential
bottlenecks in communication or in information negatively influence responsiveness
and reliability of the order cycle and their elimination is required for any
improvements of the system performance.
• Relation 5. Four different but mutually interlinked factors define the form of the
order cycle. Order entry method determines the quality of information. Depending
on the form and quality of the information the order lead-time is shortened or
extended. Processes incorporated in path the order must travel also affect lead-time.
Apart of lead-time the order path and related processes determines the total costs of
order cycle associated operations. CODP and manufacturing strategy respectively
determine the characteristics of the order cycle as well. As stressed in subsection
2.1.3, manufacturing strategies are associated with different lead-times, interactions
with customers, production costs, forecasts or inventory requirements. The higher
mentioned order cycle issues influence the dispositions of order cycle and
consequently also the reliability and responsiveness of the supply chain. However,
the issues all together create large space and opportunity for bottleneck creation.
Though these issues can be controlled in order to change the characteristics of the
customer order cycle.
• Relation 6 - In order to evaluate supply chain performance, it is necessary to
measure single attributes of the system. The overall performance can be afterwards
estimated and benchmarked against other systems. According to the SCOR model
metrics, order cycle related attributes are Reliability and Responsiveness (RL and
RS). Reliability indicates how the particular supply chain is able to fulfil its
commitments. Responsiveness, as mentioned in section 2.5.2, is an attribute that
shows how the supply chain responds to customer requirements with regard to time
and shows the velocity of the order fulfilment cycle time.
The framework shows, that the order cycle characteristics are influenced by 1)
controllable order cycle issues and 2) communication and information. Both
influencers can contain bottlenecks limiting the performance of discussed attributes
and consequently also the performance of the entire supply chain.
35
• Relation 7 – Reliability and responsiveness are (apart of others) performance
attributes necessary for assessment of the entire SC. In this case these two attributes
together determine the performance of the order cycle. If a company wants to
control and measure the order cycle in its entirety, it needs to agree on exact
performance measurements and metrics with business partners in order to measure
the same outcomes. This will allow the partners to set common goals and
improvement strategies. However, to be able to continuously improve the
performance, these performance measures and metrics should be constantly
updated(Gunasekaran & Kobu, 2007).
• Relation 8 – The last arrow stands for performance improvement selection. The
whole framework gradually leads to this endpoint. Once the order cycle
characteristics and performance are known, bottlenecks can be identified, managed
and ultimately eliminated. Complete elimination of existing bottleneck as well as
any improvements of these bottleneck items then improve performance of the order
cycle.

36
3 Methodology This chapter explains which methods are used and why. Data collection and data
analysis are further described in following sections. The research design is discussed
in section 3.1. Next, the data collection will be described in section 3.2. Validity of
the research is discussed in section 3.3 and section 3.4 examines research reliability.
3.1 Research design In order to answer the general research question of this study, a case study research is
selected.
This is a single case study where only one entity is investigated. The studied entity is
production company Typhoon. This qualitative method of investigation contributes to
the aim of this study to increase the performance of the company by improving its
order cycle. Single case study design allows the researcher to study the selected case
in detail. Moreover, since this is a single case study, possible use of the findings
beyond the scope of the company does not apply, because the findings are based on
data provided by Typhoon only.
3.2 Data collection Data collection for this case study can use several sources and techniques. These are
further described in the following subsections.
3.2.1 Literature
The literature study was carried out to obtain relevant data with regard on given
topics. The literature used for the research was obtained from different sources.
Majority of information was sourced from scientific e-journals obtained through the
search engine of Wageningen UR Library from databases such Scopus or
Sciencedirect. Though, printed and electronic books provided a lot of information and
additional information were found on interned. The outcome of the literature study
was used as an input for the empirical part of the case study. The list of references is
part of this report.

37
3.2.2 Interviews
Interviewing the employees of Typhoon and other respondents was one of the main
sources of information. To be clear about the proposition of interviews, this
subsection describes its aspects such as the type of interview and how was it carried
out.
Semi-structured interview
A suitable type of interview for this study is a semi-structured interview. This type of
interview suits this study the most because it allows debate on a particular topic
between interviewer and respondent. Apart of prepared list of themes some additional
questions can be asked. Nevertheless, the themes and questions may vary from
interview to interview. The form of interview is non-standardised face-to-face
interview (Saunders, Lewis, & Thornhill, 2007). This type of interview aims to obtain
personal perspective of the respondent. The interview should capture interviewee’s
thoughts, experience and facts in relation to the topic area.
In total, 7 interviews were performed with representatives of Typhoon and CSP to
gain a deeper understanding of how a department belonging under interviewee’s
competence works and what is the contribution or influence of particular department
on the order cycle. All interviews were carried out on a one-to-one basis, while face-
to-face contact was preferred. During completion of the interview, some of the
characteristics of semi-structured interviews were taken into account. The questions
asked were prevailingly open-ended questions but also close-ended questions were
asked. The respondents mostly elucidated the topic and elaborated their responses. If
an incentive for deeper explanation was necessary, some probing questions were used.
During the interviews the researcher aimed to collect a rich and detailed data. The list
of interviewees can be found in Appendix 4 - List of .
3.2.3 Focus group
Focus group was gathered to discuss selected topics in-depth and to let the
participants interact between themselves with the researcher facilitating the
discussion. Focus group was preferred more than group interview because the issue
for discussion was rather specific. The issue to discuss was the order cycle of
Typhoon and the objective of the focus group was to build a consensus about the
current state of the order cycle and its characteristics.
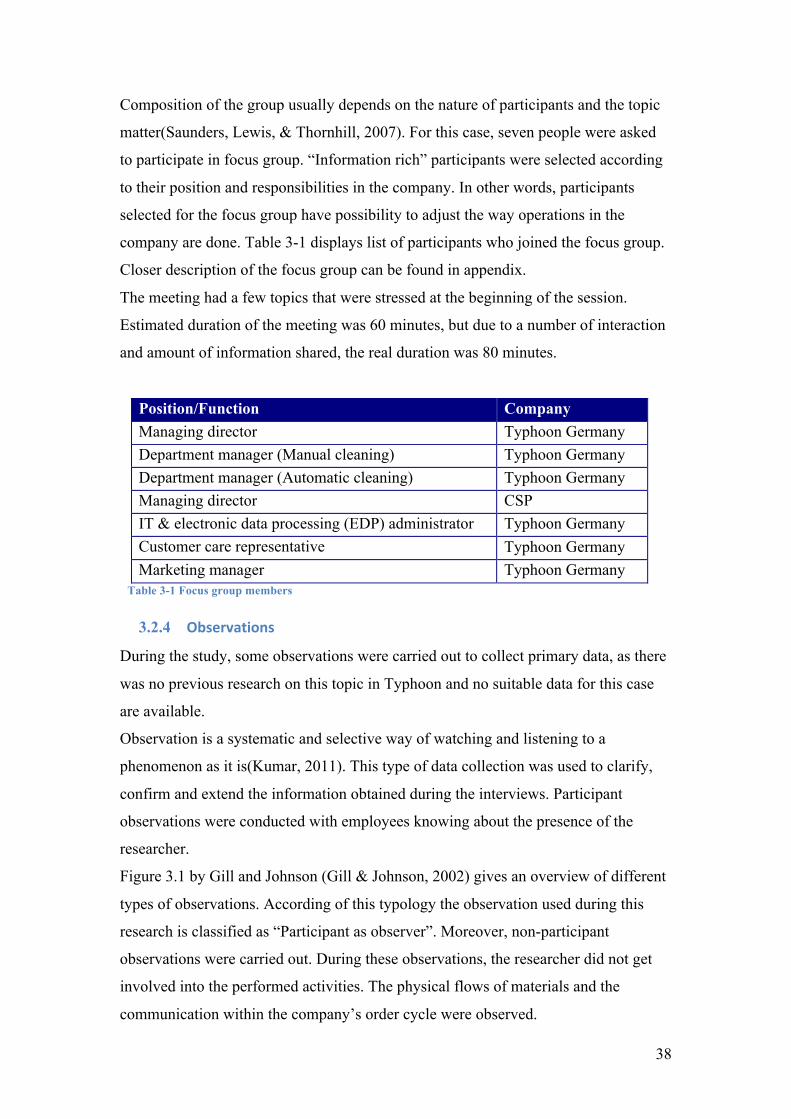
38
Composition of the group usually depends on the nature of participants and the topic
matter(Saunders, Lewis, & Thornhill, 2007). For this case, seven people were asked
to participate in focus group. “Information rich” participants were selected according
to their position and responsibilities in the company. In other words, participants
selected for the focus group have possibility to adjust the way operations in the
company are done. Table 3-1 displays list of participants who joined the focus group.
Closer description of the focus group can be found in appendix.
The meeting had a few topics that were stressed at the beginning of the session.
Estimated duration of the meeting was 60 minutes, but due to a number of interaction
and amount of information shared, the real duration was 80 minutes.
Position/Function Company Managing director Typhoon Germany Department manager (Manual cleaning) Typhoon Germany Department manager (Automatic cleaning) Typhoon Germany Managing director CSP IT & electronic data processing (EDP) administrator Typhoon Germany Customer care representative Typhoon Germany Marketing manager Typhoon Germany
Table 3-1 Focus group members
3.2.4 Observations
During the study, some observations were carried out to collect primary data, as there
was no previous research on this topic in Typhoon and no suitable data for this case
are available.
Observation is a systematic and selective way of watching and listening to a
phenomenon as it is(Kumar, 2011). This type of data collection was used to clarify,
confirm and extend the information obtained during the interviews. Participant
observations were conducted with employees knowing about the presence of the
researcher.
Figure 3.1 by Gill and Johnson (Gill & Johnson, 2002) gives an overview of different
types of observations. According of this typology the observation used during this
research is classified as “Participant as observer”. Moreover, non-participant
observations were carried out. During these observations, the researcher did not get
involved into the performed activities. The physical flows of materials and the
communication within the company’s order cycle were observed.

39
Both types of observations were performed under natural condition, as there was no
stimulus. The form of recording used during the observations was narrative recording.
Narrative recording is a form of recording where the evidence of observed
phenomenon is interpreted by researcher’s own words (Kumar, 2011).
Figure 3.1 Typology of participant observation research roles (based on Gill & Johnson, 2002)
3.2.5 Additional data sources
In addition to the main data sources some additional sources were utilized. In order to
find general information about suppliers and carriers who serve Typhoon, websites of
those companies were accessed. Next, background information about Typhoon was
accessed in company’s internal records, websites and confirmed by Typhoon’s
managing director. Furthermore, operations data records were obtained from
Typhoon’s EDP system. Nevertheless, these data are not part of the report as it lacks
the necessary level of details proposed by the SCOR model. Therefore these data had
rather orientation character during the research.
3.2.6 Data analysis
Data gathered during the empirical part of the research were compared to the
theoretical framework. Data collected in interviews, observations and focus group
(e.g. the way the order cycle processes are executed, data about the communication of
the company) are not quantifiable. Moreover, it is necessary to explore studied topics
in detail. Therefore a qualitative analysis is preferred.
Qualitative analysis composes of comparison of empirical data to the categories
distinguished by the SCOR model. The properties of the SCOR model have been
Researcher*takes*part*in*
ac=vity*
Researcher*observes*ac=vity*
Researcher’s*iden=ty*is*concealed*
Researcher’s*iden=ty*is*revealed*
Par=cipant*as*observer*
Observer*as*par=cipant*
Complete*par=cipant*
Complete*observer*

40
transformed into a grid that was used during the observations for recording the
ongoing processes and helped to design the themes for the interviews. An interpretive
and reflexive reading of data was used during this study. In this type of reading the
data, the researcher is located as a part of the generated data because the researcher is
inextricably implicated in the process of data generation and interpretation (Mason,
2002).
3.3 Validity
Validity of the research instrument refers to ability of to measure what it is supposed
to measure. Validity composes of internal validity and external validity.
Since case study designs are focused on one case only, its outcome cannot be
generalized beyond the scope of the researched company. It can only serve as an
indicator how to conduct similar research in comparable companies. Therefore the
external validity is low. It could be improved if other cases would be studied.
Internal validity, on other hand, is supported by an extensive literature study. The
relations stated in theoretical framework are influenced by a number of factors. The
internal validity could be improved if all the relations if the framework would be
tested. Nevertheless, due to time constraints it is not feasible to test all relations
during this research and therefore the internal validity is low.
3.4 Reliability Reliability refers to the consistency of the results when a research instrument is used
repetitively (Kumar, 2011). First, a semi-structured interview allows sharing the true
and opinion of the interviewee. Therefore the answers should be the same if the
interview would be repeated. Nevertheless, different information can be received if
another researcher would conduct the interviews. In this research, researcher himself
carried out the interviews but in case any other person would conduct the interviews,
the obtained data and its interpretation may vary.
Additionally, the output of the focus group can also vary since its dependent on the
progress of the particular session. If the focus group meeting would be repeated, the
interaction of participants will most likely be not the same. Reliability of the research
is therefore low.

41
4 Results The objective of this chapter is to present framed information resulting from the
conducted research. First, the organization of the order cycle in Typhoon is described
in section 4.1. Section 4.2 highlights the communications affecting the order cycle.
Section 4.3 summarizes all discovered bottlenecks (process bottlenecks and
communication bottlenecks) that influence the order cycle of Typhoon. Finally,
section 4.4 suggests possible improvements based on literature and the SCOR model
best practices. These suggestions are believed to improve order cycle of Typhoon.
4.1 Order Cycle of Typhoon The second specific research question addresses the characteristics of the current
order cycle used by Typhoon. A range of information was gathered during interviews
and observations to find out how Typhoon’s order cycle is organized. The results
from this research are presented in subsections below, where the customer order path
(4.1.1) and the order cycle processes (4.1.2) are discussed. Bottlenecks occurring in
the order cycle of Typhoon are derived from both subsections and their summary is
provided in the end of this section.
4.1.1 Order path
To identify the activities and actions influencing Typhoons operations, the structure
of the order path must be elaborated.
Figure 4.1 depicts the order path of Typhoon. This figure is based on observations and
interviews conducted during this case study. The figure together with the text below
describes the structure of the order cycle as well as associated activities.
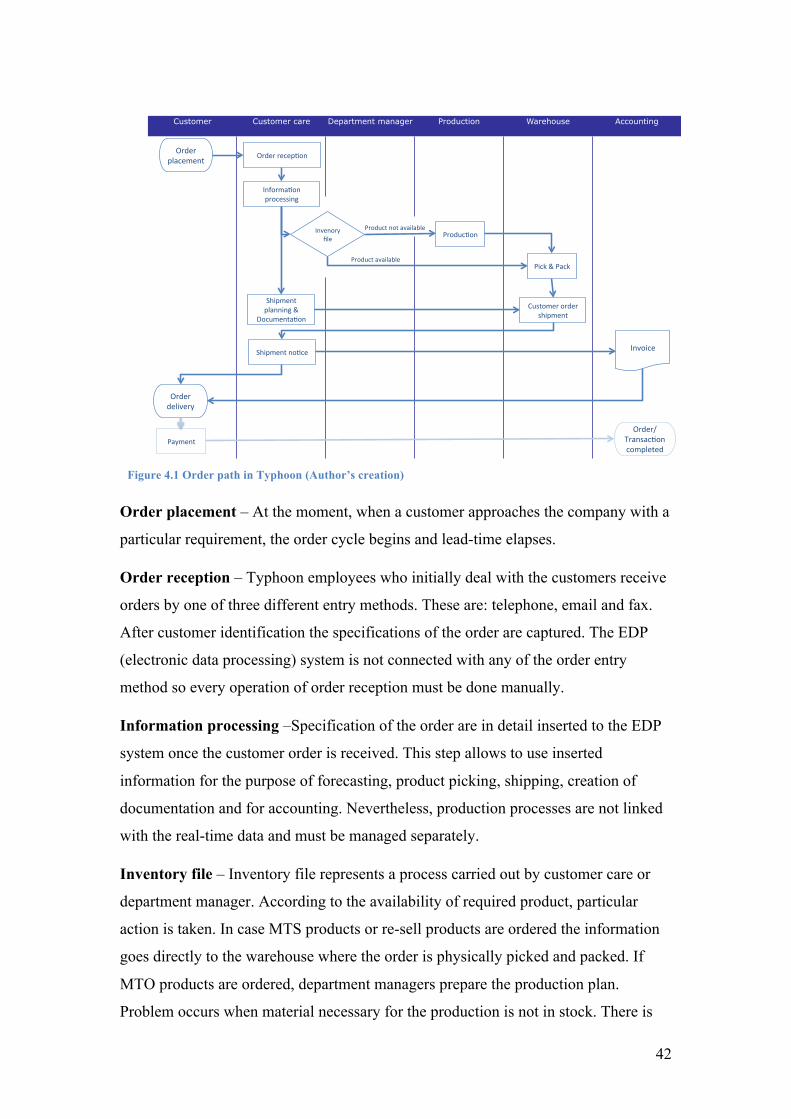
42
Figure 4.1 Order path in Typhoon (Author’s creation)
Order placement – At the moment, when a customer approaches the company with a
particular requirement, the order cycle begins and lead-time elapses.
Order reception – Typhoon employees who initially deal with the customers receive
orders by one of three different entry methods. These are: telephone, email and fax.
After customer identification the specifications of the order are captured. The EDP
(electronic data processing) system is not connected with any of the order entry
method so every operation of order reception must be done manually.
Information processing –Specification of the order are in detail inserted to the EDP
system once the customer order is received. This step allows to use inserted
information for the purpose of forecasting, product picking, shipping, creation of
documentation and for accounting. Nevertheless, production processes are not linked
with the real-time data and must be managed separately.
Inventory file – Inventory file represents a process carried out by customer care or
department manager. According to the availability of required product, particular
action is taken. In case MTS products or re-sell products are ordered the information
goes directly to the warehouse where the order is physically picked and packed. If
MTO products are ordered, department managers prepare the production plan.
Problem occurs when material necessary for the production is not in stock. There is
Customer Customer care Department manager Production Warehouse Accounting
Order%recep(on%
Invenory%file%%
Order%placement%
Informa(on%processing%
Produc(on%
Pick%&%Pack%
Shipment%planning%&%
Documenta(on%
Customer%order%shipment%
Shipment%no(ce%
Order%delivery%
Invoice%
Product%available%
Product%not%available%
Payment%
Order/Transac(on%completed%
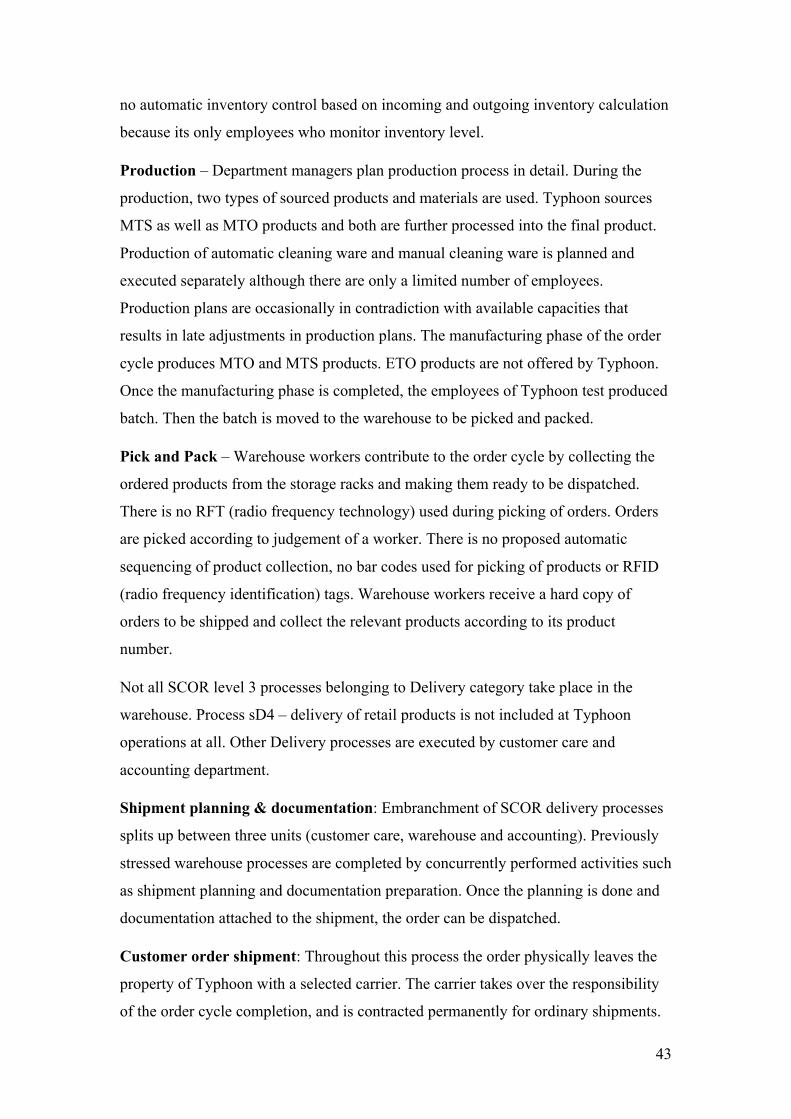
43
no automatic inventory control based on incoming and outgoing inventory calculation
because its only employees who monitor inventory level.
Production – Department managers plan production process in detail. During the
production, two types of sourced products and materials are used. Typhoon sources
MTS as well as MTO products and both are further processed into the final product.
Production of automatic cleaning ware and manual cleaning ware is planned and
executed separately although there are only a limited number of employees.
Production plans are occasionally in contradiction with available capacities that
results in late adjustments in production plans. The manufacturing phase of the order
cycle produces MTO and MTS products. ETO products are not offered by Typhoon.
Once the manufacturing phase is completed, the employees of Typhoon test produced
batch. Then the batch is moved to the warehouse to be picked and packed.
Pick and Pack – Warehouse workers contribute to the order cycle by collecting the
ordered products from the storage racks and making them ready to be dispatched.
There is no RFT (radio frequency technology) used during picking of orders. Orders
are picked according to judgement of a worker. There is no proposed automatic
sequencing of product collection, no bar codes used for picking of products or RFID
(radio frequency identification) tags. Warehouse workers receive a hard copy of
orders to be shipped and collect the relevant products according to its product
number.
Not all SCOR level 3 processes belonging to Delivery category take place in the
warehouse. Process sD4 – delivery of retail products is not included at Typhoon
operations at all. Other Delivery processes are executed by customer care and
accounting department.
Shipment planning & documentation: Embranchment of SCOR delivery processes
splits up between three units (customer care, warehouse and accounting). Previously
stressed warehouse processes are completed by concurrently performed activities such
as shipment planning and documentation preparation. Once the planning is done and
documentation attached to the shipment, the order can be dispatched.
Customer order shipment: Throughout this process the order physically leaves the
property of Typhoon with a selected carrier. The carrier takes over the responsibility
of the order cycle completion, and is contracted permanently for ordinary shipments.

44
Air cargo and bulk deliveries transported in intermodal containers are solved
individually.
Shipment notice: Message containing all information about the delivery is sent to the
customer in the moment when the order leaves the house. In the same moment
accounting department receives a note about incurring liability of the customer.
Invoice: Together with the order, customer receives also an invoice that is due to pay
usually in 14 days time. Typhoon motivates its customers by standard sale 2% of the
total due if the invoice is paid within 7 days to improve the cash flow.
Order delivery: Order delivery to the customers desired place closes the order cycle.
In case of Typhoon there are no installations at the customer site. Therefore not all of
proposed processes of the SCOR model are applicable.
Payment and order clearance: Activities that inherently belong to the cycle are
payment and order completion. These activities are not considered during the lead-
time calculation but the order cycle as such is not complete without them. Therefore
are these activities included in Figure 4.2.
4.1.2 Order cycle processes
SCOR level I processes were discussed in the literature study in section 2.5 earlier in
this report. Level I processes are given by the model and also in Typhoon operations
processes Plan, Source, Make and Deliver are present.
Processes of Typhoon are further decomposed into levels II and III and these are
discussed hereunder.
SCOR level II processes
SCOR level I set up the four processes and SCOR level II decomposes the processes
into more detailed activities.
Figure 4.2 displays level II SCOR processes of Typhoon’s operations as well as the
sequence of the processes. Typhoon as the studied actor adapts processes sP1, sP2,
sP3 and sP4. Process sP1 balances the forecasted demand with production and
deliveries of Typhoon products. Processes sP2, sP3 and sP4 are all dependent on
process sP1 as it sets the requirements for further planning of Typhoon’s operations.
Process sP2 plans sourcing of products and materials from different suppliers in a way
to meet production requirements. Process sP3 plans use of resources over a given
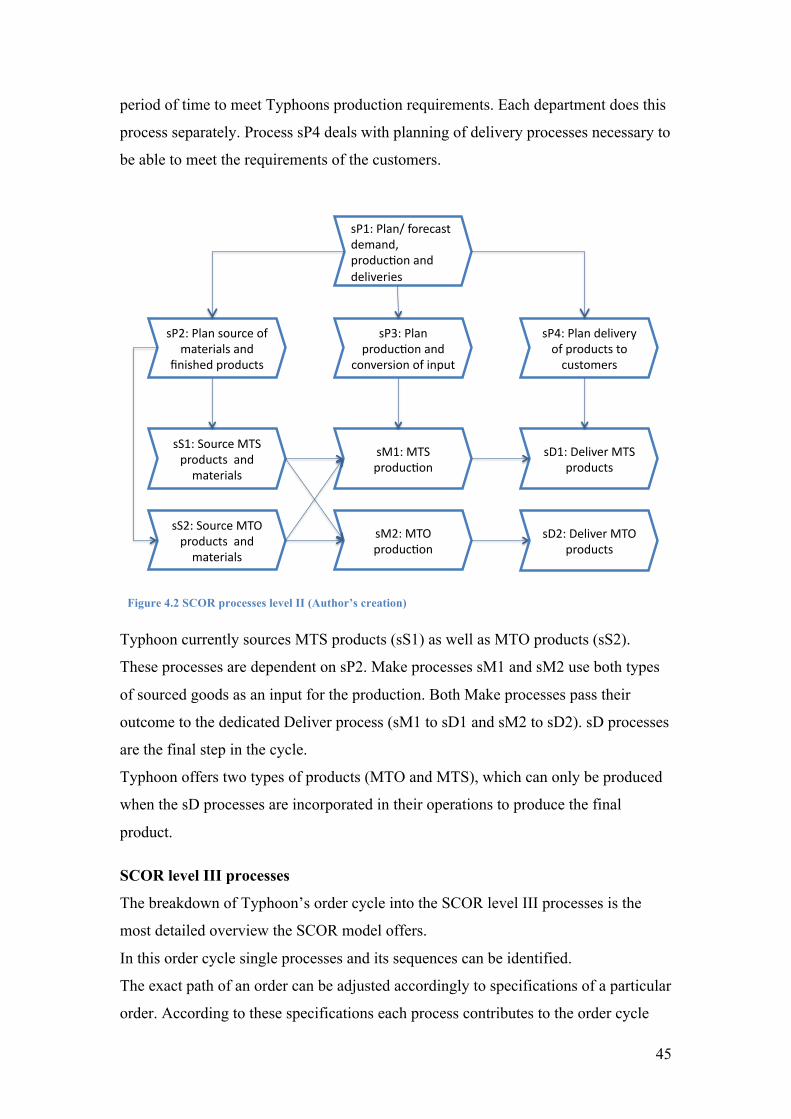
45
period of time to meet Typhoons production requirements. Each department does this
process separately. Process sP4 deals with planning of delivery processes necessary to
be able to meet the requirements of the customers.
Figure 4.2 SCOR processes level II (Author’s creation)
Typhoon currently sources MTS products (sS1) as well as MTO products (sS2).
These processes are dependent on sP2. Make processes sM1 and sM2 use both types
of sourced goods as an input for the production. Both Make processes pass their
outcome to the dedicated Deliver process (sM1 to sD1 and sM2 to sD2). sD processes
are the final step in the cycle.
Typhoon offers two types of products (MTO and MTS), which can only be produced
when the sD processes are incorporated in their operations to produce the final
product.
SCOR level III processes
The breakdown of Typhoon’s order cycle into the SCOR level III processes is the
most detailed overview the SCOR model offers.
In this order cycle single processes and its sequences can be identified.
The exact path of an order can be adjusted accordingly to specifications of a particular
order. According to these specifications each process contributes to the order cycle
sP1:%Plan/%forecast%demand,%produc5on%and%deliveries%
sP2:%Plan%source%of%materials%and%
finished%products%%
sP3:%Plan%produc5on%and%
conversion%of%input%
sP4:%Plan%delivery%of%products%to%customers%%%
sS2:%Source%MTO%products%%and%materials%
sS1:%Source%MTS%products%%and%materials%
sM2:%MTO%produc5on%
sM1:%MTS%produc5on%
sD1:%Deliver%MTS%products%
sD2:%Deliver%MTO%products%
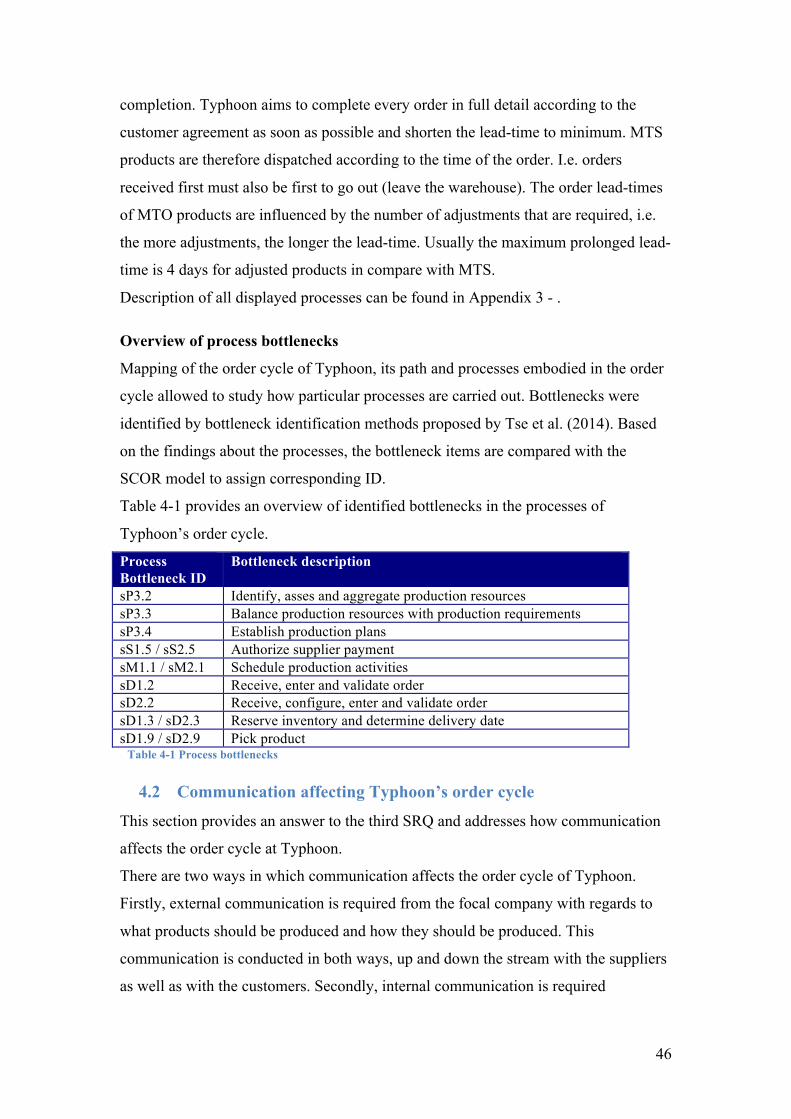
46
completion. Typhoon aims to complete every order in full detail according to the
customer agreement as soon as possible and shorten the lead-time to minimum. MTS
products are therefore dispatched according to the time of the order. I.e. orders
received first must also be first to go out (leave the warehouse). The order lead-times
of MTO products are influenced by the number of adjustments that are required, i.e.
the more adjustments, the longer the lead-time. Usually the maximum prolonged lead-
time is 4 days for adjusted products in compare with MTS.
Description of all displayed processes can be found in Appendix 3 - .
Overview of process bottlenecks
Mapping of the order cycle of Typhoon, its path and processes embodied in the order
cycle allowed to study how particular processes are carried out. Bottlenecks were
identified by bottleneck identification methods proposed by Tse et al. (2014). Based
on the findings about the processes, the bottleneck items are compared with the
SCOR model to assign corresponding ID.
Table 4-1 provides an overview of identified bottlenecks in the processes of
Typhoon’s order cycle.
Process Bottleneck ID
Bottleneck description
sP3.2 Identify, asses and aggregate production resources sP3.3 Balance production resources with production requirements sP3.4 Establish production plans sS1.5 / sS2.5 Authorize supplier payment sM1.1 / sM2.1 Schedule production activities sD1.2 Receive, enter and validate order sD2.2 Receive, configure, enter and validate order sD1.3 / sD2.3 Reserve inventory and determine delivery date sD1.9 / sD2.9 Pick product
Table 4-1 Process bottlenecks
4.2 Communication affecting Typhoon’s order cycle
This section provides an answer to the third SRQ and addresses how communication
affects the order cycle at Typhoon.
There are two ways in which communication affects the order cycle of Typhoon.
Firstly, external communication is required from the focal company with regards to
what products should be produced and how they should be produced. This
communication is conducted in both ways, up and down the stream with the suppliers
as well as with the customers. Secondly, internal communication is required
47
throughout the order cycle to assure the processes are conducted in a proper way and
the final product is produced to the highest quality.
4.2.1 External communication
Typhoon as an international company has over the years developed numerous
connections to other supply chain actors. Communication with external supply chain
actors was studied because it facilitates coordination of SC, which can improve the
performance of the order cycle. Nevertheless, at the moment there is only limited
communication within the supply chain Typhoon participates in. Communication
described in this subsection refers to communication of Typhoon HQ with its
partners, subsidiaries and other supply chain actors.
In the case of Typhoon, communication between supply chain actors can be
distinguished according to their position in the supply chain. Actors imminently
attached to the focal company are among others subsidiaries and business partners.
Communication between Typhoon HQ, their business partners and subsidiaries in
surrounding upstream and downstream tiers 1 is well facilitated as they use a common
EDP system. Use of the same, mutually integrated system allows all involved parties
to exchange information, e.g. sales of Typhoon UK are available to Typhoon HQ in
Germany.
During upstream operations, Typhoon HQ has overview about sales and emerging
needs of its subsidiaries and business partners. This allows responsive action and
continuous preparation for the next replenishment of the inventory available to the
business partner or subsidiary.
Information about operations of Typhoon HQ is communicated to Typhoon USA that
secures sourcing of material from Jamison. In this case, the communication is the
same as in the previously described case. As a result of the facilitated information,
Typhoon USA is able to secure the necessary materials for the production processes
undertaken at Typhoon HQ.
Figure 4.3 portrays communication between Typhoon and other actors in the supply
chain. In this figure Typhoon HQ is depicted as a focal company since the case study
took place there. The incoming and outgoing streams from the company are
distinguished according to the information they carry. The distinction is made
between information flows (grey, dashed lines) that carry information necessary for
coordination and planning of action, while material flows (black, solid lines) carry
48
information concerning one particular order only. Such information identifies the
ordered product, amounts ordered, delivery address and desired date of delivery.
MTO orders also carry information about the specification of the product that is to be
manufactured.
Figure 4.3 also shows, that informational exchange between Typhoon HQ, its partners
and subsidiaries allows planning and coordination of the supply chain. Nevertheless
this cooperation does not extend to other supply chain actors. The information
exchange is limited only to order specifications that do not allow accurate planning.
Such information can be used for forecasting, but due to continuously changing
conditions it may be inaccurate. To preserve the responsiveness of the company’s
supply chain, Typhoon has to keep high inventory levels otherwise it wont be capable
of a responsive reaction on demand and reliable deliveries. High inventory levels also
results from long materials lead-times while the longest supply lead-time reaches 8
weeks due to shipping time (From USA to Germany by standard container shipment).
Apart from Typhoon’s business partners and subsidiaries there is only one actor who
shares more than one-time information about the order specifications. One customer
uses just-in-time (JIT) sourcing system and provides Typhoon with information about
projected demand at least one month in advance. This allows Typhoon to plan its
operation accurately and also to save some money and time by unification of
production with other orders so it will not be necessary to convert the machines that
frequently. Apart from this case no other customer provides any detailed information
and the information provided is bonded only to a specific time and a specific product.

49
Figure 4.3 Material and informational flows between Typhoon and other supply chain actors (Author’s
creation)
4.2.2 Internal communication
Internal communication observed during the case study influences the operations in
the company in several ways.
Firstly, the EDP system used by Typhoon displays information about accepted orders
but this information is not fully available to the rest of the company’s departments. To
communicate the information about order specification, a hard copy with a list of the
orders needs to prepared and physically delivered to the warehouses and production
halls where the orders will be further processed. The information saved in the system
needs to be manually retyped on a hard copy. There are no electronic devices in
production halls or in warehouses to display real-time data about incoming orders
based on data in the EDP system. Moreover, there is no possibility to track the status
of an order. The only information provided to the customer is confirmation of order
acceptance and shipment of their order to a requested address. There is no more
situation between these two moments where the customer would be informed about
the progress of an order. This is not a problem for MTS products because after the
confirmation of the order the desired product is shipped to the customer. The problem
Jamison% Typhoon%USA% Typhoon%HQ% Customers%Typhoon%USA,%GB,%CSP%SUI%
sD1%
sD2%
sS1%
sS2%
sD1%
sD2%
sS1%
sS2%
sM1% sD1%
sD2%
Suppliers%
sD1%
sD2%
sM2%
sS1% sD1%
Customers%
sS1%
sS1%
sS2%
Suppliers% Customers%
sP1% sP1%
sP4%sP2% sP3%
sP1%
sP4%sP2%sP4%sP2%
Focal%company%
KEY:%Process%%%%%%%%,%%%%%%%%%%%%%%%%%%%%%%%%%%Material%flows%%%%%%%%%%%%%%%%%%%%%%%%%%%%%%%%%Informa5on%exchange%
Tier%2% Tier%1% Tier%1% Tier%2%
Suppliers% Customers%

50
occurs during MTO production that in general takes up to 5 days and the customers
should be informed about the progress of an order to be able to adjust their own
planning. The information about the status of an order is not available internally
either. The status of an order can be obtained only on request via phone or by personal
check.
Secondly, communication between manual cleaning and automatic cleaning
departments in Typhoon HQ proved to be insufficient due to lack of information
exchange. Production of both departments has different characteristics, but
occasionally there is a contradicting production planning where a machine or an
employee is assigned for an order completion by both departments. Such
miscommunication of use of resources results in extended lead-times due to re-
scheduling or postponements. A direct insight to the planning of prospective actions
of one department is for other departments of the company not possible.
Internal communication is also necessary between the staff assigned to control
inventory levels and the managers in charge of production and replenishment
planning. In order to control the appropriate amount of inventory employees must
oversee the levels and report it to the managers because this is not an automatic
operation. This activity is done on a weekly basis. Unfortunately, possible human
error goes undetected until the problem arises, either when there is a surplus or deficit
or stock. The EDP system in use does not include any warehouse management or
inventory control modules, e.g. in case of a large order shortly after the inventory
level check it may happen that the actual inventory levels drop way below the re-
order point and due to the frequency of the controls the company may experience
stockouts.
Overview of communication bottlenecks
Communications of Typhoon were examined in order to find their bottlenecks.
Communication bottlenecks were derived by comparing the SCOR model with
communication of the company captured during this case study. Other communication
bottlenecks were identified in situations where the way of communication caused
obvious complication to the company in a form of queues or inaccuracies.
Table 4-2 provides an overview of the identified bottlenecks.

51
Communication Bottleneck ID
Bottleneck description
Com 1 / sP1.4 Lack of information sharing with other supply chain actors Com 2 Inability to work with real-time data throughout the order
cycle. Com 3 / sP3.4 Separate production planning of two departments Com 4 Inventory level control
Table 4-2 Communication bottlenecks
4.3 Bottlenecks affecting Typhoon’s order cycle Previously discussed details about Typhoon’s order cycle were used as a foundation
for this subsection, where overview of bottlenecks affecting Typhoon’s order cycle is
presented. By doing so, the fourth specific research question is answered.
Table 4-3 lists bottlenecks of Typhoon’s operations that affect its order cycle. The
first column composes of the bottleneck ID that was retrieved from associated SCOR
process. In case of communication bottleneck the ID is labelled by abbreviation
“Com” and an ordinal number. Next, there is a bottleneck description and occurring
issue caused by the bottleneck. The last column contains associated metrics that
belong to the listed bottleneck.
ID Bottleneck description Issue Metric
sP3.2 Identify, asses and aggregate production resources
Inventory levels must be sufficient for planed production, assigned staff needs to be available
RS.3.38
sP3.3 Balance production resources with production requirements
Production resources and production requirements are misbalanced due to separate planning of two departments use of common resources and due to inaccurate monitoring of inventory levels.
RS.3.13
sS1.5 / sS2.5
Authorize supplier payment
Complicated and lengthy authorisation. Authorization of payment must be signed on original hard copy travelling from one building to another several times. There is no possibility to approve the payments electronically
RS.3.8
sM1.1 / sM2.1
Schedule production activities
Last minute rescheduling worsen reliability attribute because schedule achievement percentage decreases.
RL.3.49 RS.3.123
sD1.2 Receive, enter and validate order RS.3.94
sD2.2 Receive, configure, enter and validate order
EDP system not connected with any of the order entry method, automatic identification of the customer is missing RS.3.94
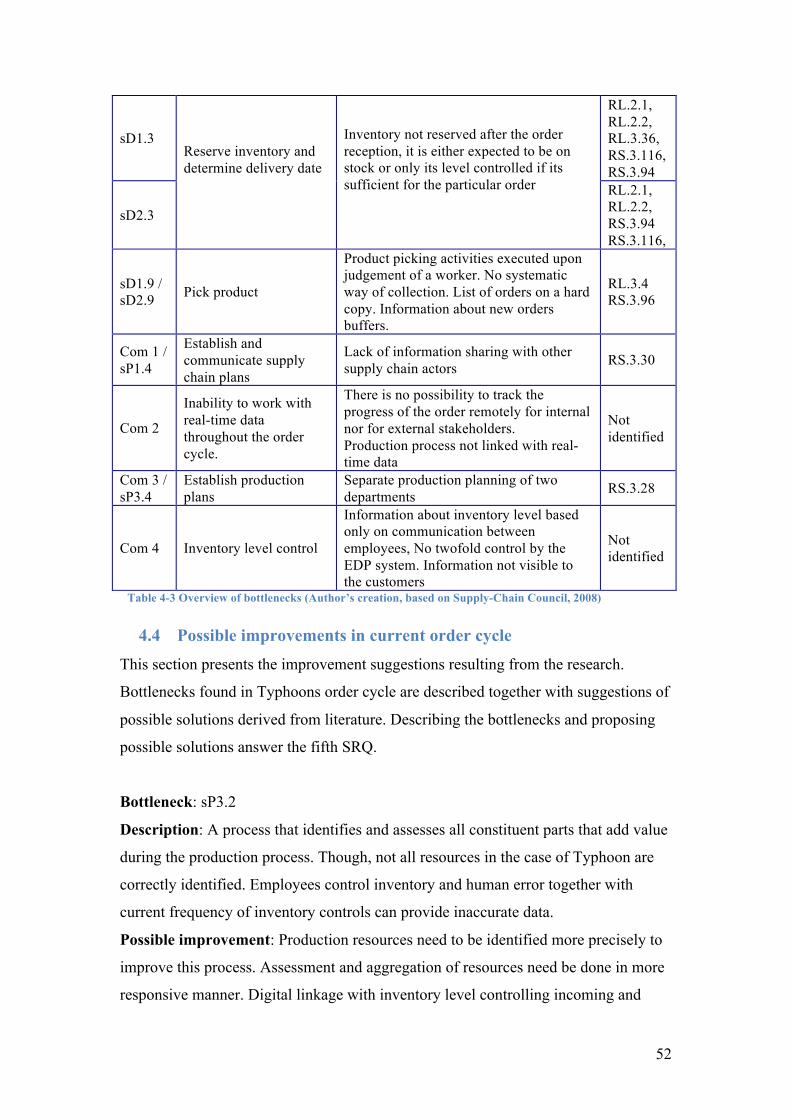
52
sD1.3
RL.2.1, RL.2.2, RL.3.36, RS.3.116, RS.3.94
sD2.3
Reserve inventory and determine delivery date
Inventory not reserved after the order reception, it is either expected to be on stock or only its level controlled if its sufficient for the particular order
RL.2.1, RL.2.2, RS.3.94 RS.3.116,
sD1.9 / sD2.9 Pick product
Product picking activities executed upon judgement of a worker. No systematic way of collection. List of orders on a hard copy. Information about new orders buffers.
RL.3.4 RS.3.96
Com 1 / sP1.4
Establish and communicate supply chain plans
Lack of information sharing with other supply chain actors RS.3.30
Com 2
Inability to work with real-time data throughout the order cycle.
There is no possibility to track the progress of the order remotely for internal nor for external stakeholders. Production process not linked with real-time data
Not identified
Com 3 / sP3.4
Establish production plans
Separate production planning of two departments RS.3.28
Com 4 Inventory level control
Information about inventory level based only on communication between employees, No twofold control by the EDP system. Information not visible to the customers
Not identified
Table 4-3 Overview of bottlenecks (Author’s creation, based on Supply-Chain Council, 2008)
4.4 Possible improvements in current order cycle This section presents the improvement suggestions resulting from the research.
Bottlenecks found in Typhoons order cycle are described together with suggestions of
possible solutions derived from literature. Describing the bottlenecks and proposing
possible solutions answer the fifth SRQ.
Bottleneck: sP3.2
Description: A process that identifies and assesses all constituent parts that add value
during the production process. Though, not all resources in the case of Typhoon are
correctly identified. Employees control inventory and human error together with
current frequency of inventory controls can provide inaccurate data.
Possible improvement: Production resources need to be identified more precisely to
improve this process. Assessment and aggregation of resources need be done in more
responsive manner. Digital linkage with inventory level controlling incoming and

53
outgoing flows of inventory automatically should be implemented to the EDP system
of the company (Supply-Chain Council, 2008). This will mitigate the problem of
inaccurate data and will shorten the lead-time necessary for performing this process.
Bottleneck: sP3.3
Description: Production resources and production requirements are misbalanced.
This is partly caused by separate planning of two departments and also by the fact,
that production resources are not identified accurately. Not only inventory is
considered as production resource but also capacity of machinery and available
workforce. In case of overloaded machinery or workforce, the lead-times are extended
because the orders buffer. In such case planning adjustments must be done or the
orders must wait until there is a capacity to process them.
Bottleneck occurring during manual production can be used as an example of
workforce shortage. Production of cloths for manual cleaning composes of four
stages: folding and cutting and machine, two packing machines (cleaning cloths to
package and packages to box) and packing area where completed labelled boxes are
being stacked on pallets. One person can do this production, but the efficiency of the
production is significantly lower than if two persons do it. To reach the maximal
efficiency, three employees must participate on the process.
Possible improvement: Any improvements in preceding process bottleneck sP3.2
will lead to an improvement of sP3.3. Special attention should be paid to automatic
query of inventory levels (Supply-Chain Council, 2008). The process will be more
accurate with exact data and its lead-time will be shortened if there would be no need
of repetition of the planning process. Also, staff allocation should be planned in a way
to reach the maximal efficiency of processes. Therefore human resource management
should be improved either by implementation of a software that would help to plan
the use of workforce more effectively or by a clear distinction of optimal workforce
deployment on each process that would help current planners to improve the
efficiency of processes.
Bottleneck: sS1.5/sS2.5
Description: The entire process composes of invoice collection, invoice matching and
issuance check, though the bottleneck occurs in the last phase where the payment
must be confirmed by four persons. Too much time elapses until the payment can be
54
released, because the responsible persons are occasionally not present at HQ to sign
the original hard copies. Moreover, the hard copies must travel across the HQ from
one building to another to collect all necessary approving signatures. Occurring post
due payments decrease Typhoon’s responsiveness.
Possible improvement: Electronic confirmation of payment will shorten the supplier
payment authorization cycle time because the payments will be authorized
electronically regardless on location of responsible person (Supply-Chain Council,
2008, SAGE, 2015). This will quicken the authorization cycle time and improve the
responsiveness towards suppliers.
Bottleneck: sM1.1/ sM2.1
Description: Late re-scheduling of production activities worsens reliability attribute
of OC because it decreases schedule achievement. Also, re-scheduling requires
repetition of previous effort and extends the lead-time allocated for scheduling
(planning) activities.
Possible improvement: SCOR model (2008) proposes to maintain production data, inventory levels and
schedule requirements on 99+% accuracy. To achieve this, Plan and Make activities
needs to be synchronized in a detailed production model working with real-time
information. This kind of information needs to come from inside as well as from
outside of the company. Internal information needs to inform about current resources
and production capacities. External information should inform about current and
prospective needs of customers on one side, and about activities and performance of
suppliers on the other side.
Bottleneck: sD1.2/ sD2.2
Description: While orders are being received via phone, certain amount of time is
allocated customer identification. Even though the information about the customer is
already known from past deals, employee receiving the phone order needs to obtain
and confirm the identity of a customer, retrieve it from the system and then continue
with the order. Moreover, despite the possibility to order through the company
websites there is no connection of the order to EDP. Order entered by customers on
the websites is accepted in textual form by email and must be re-entered to the system
again.
55
Possible improvement: Customer’s telephone number is saved in the EDP system.
Incoming calls can be connected with the database of customers and directly linked
with the folder of the customer to shorten the cycle time and increase responsiveness.
Order form on company website should be linked with the EDP system. In that case
employees would not have to re-enter the order details again. This will shorten the
lead-times of sD1.2 and sD2.2 processes and will increase responsiveness.
Bottleneck: sD1.3/sD2.3
Description: Inventory is not reserved in the system. Not in anticipation of important
customer demand and not even for accepted orders. Customer order is accepted and in
case of MTS products it is anticipated that it is on stock and therefore the order is
confirmed to the customer. In case of increased demand for one product, amount of
ordered products can exceed actual inventory level and delivery of some orders can be
delayed. If the order is not delivered on time, reliability as well as responsiveness of
the OC suffers.
Possible improvement: Automatic reservation of inventory that monitors incoming
orders and inventory levels (Supply-Chain Council, 2008). Reservation can be
prioritized for key customers and FIFO allocation can be used for all others. However,
reservations of MTS products should be determined precisely. Myopic methods to
determine inventory reservations can have detrimental effects on order cycle
performance (Pibernik & Yadav, 2009). Precise reservation of inventory helps to
determine the delivery dates more accurately and therefore reliability of the order
cycle will increase.
Bottleneck: sD1.9/sD2.9
Description: Series of activities to retrieve orders from warehouse are completed by
workers without assistance of electronic device that would plan the sequence of order
collection. To compare the product specifications with the order documentation is not
possible either. There is no bar code identification or RFID identification of picked
product. There is only number assigned to the product that must match with the
number in the list of orders. Human factor can cause mismatch of products and such
error can go undetected until order reception on customer side.
Another issue is communication of order specification from the office to the
warehouse. There are only hard copies of orders that must be collected from both
56
departments. Orders are collected one by one meanwhile other orders buffer in
offices. Pick product process is conducted in a way that extends pick product cycle
time, which worsens responsiveness of the order cycle.
Possible improvement: An improvement in reliability of the pick product process
would be implementation of automatic (e.g. radio frequency) identification of
products. Electronic devices connected to EDP system will identify desired product,
its location in any of the warehouses and after its collection will automatically
generate information about executed action. This information can be then distributed
to the entire system. Therefore the possibility of error will be minimized and
reliability will be improved. These systems greatly improve picking efficiency and
accuracy (Fawcet et al., 2007). It should be noted, that this is a prerequisite for the
other possible improvement of this process.
The other possible improvement is wave picking. Consolidation of order into waves
can help to increase labour productivity and reduce labour cost per pick. Electronic
devices with updated list of orders will help to plan the waves to improve the pick
product cycle time. Manipulation with machinery as well as movement within the
warehouse (in the case of Typhoon also transfer to other buildings across the street or
even in remote warehouses) can be consequently minimized. This will speed up the
process. Advanced warehouse software can also propose an optimal way to collect the
products. Such technology can propose the ideal sequence of product collection to
load the collecting vehicle to the maximum and to minimize the route to travel
(Gademann et al., 2001).
It should be noted, that introduction of radio frequency identification is associated
with high costs. Therefore it should be carefully assessed whether the implementation
in Typhoon is feasible.
Bottleneck: Com 1/ sP1.4
Description: Current establishment and communication of actions is not
communicated among entire supply chain in which Typhoon participates. The only
communication is between Typhoon and its subsidiaries and partners. There is no
detailed communication (strategic, tactical nor operational information exchange)
between Typhoon and other supply chain actors.
Possible improvement: Digital links between SC actors providing real-time
exchange of supply chain information will enhance collaborative planning of all types

57
of actions. Collaborative planning will help to project allocation of SC resources to
meet SC requirements in most effective and efficient way (Supply-Chain Council,
2008, Childerhouse & Towill, 2011).
Bottleneck: Com 2
Description: Current system of communication within the company does not allow
dissemination of newly emerging information to/from all workers and locations
involved in order cycle. Majority of information is conveyed on hardcopies that
usually buffer at one stage before it moves on to another, which worsens
responsiveness of the order cycle. A faster way of communication is conducted by
telephone, but in that case the original information can be misinterpreted or distorted.
That results in extended lead-times when the order is controlled and additionally
aligned with later delivered documentation or in worse case in wrong delivery that
decreases reliability of the order cycle.
Inability to work with real-time information is rooted in currently used EDP system.
This system does not allow to pass order file received on order reception further to
other stages of the order cycle. The information must be for different purposes
repetitively re-typed or verbally communicated.
Possible improvement: Electronic devices (e.g. handhelds) that would be able to
identify the desired product (bar code or RFID system), display and adjust the data in
EDP system database could bring direct benefits (Véronneau & Roy, 2009 ). It would
also enhance internal communication and consequently both responsiveness and
reliability of the order cycle, because employees would have direct access to all
(reliable) information concerning the order. Throughout the entire order cycle the
system would keep the information updated, if developments of all processes
necessary for order completion would be recorded to the EDP (e.g. product ordered,
product picked, product out of stock, product shipped, production finished). Any
change of order status will be integrated to the system and will become accessible to
all authorized persons.
Bottleneck: Com 3/sP3.4
Description: Production plans of both departments are established independently
despite use of some common resources. This occasionally result in contradiction of
plans and delays in production. Production is not connected to EDP system and its
58
outcome is only communicated to the office by approval that particular production is
finished and ready to be processed in the next stage. There is no real-time
communication of production activities that would assist in case of establishing new
production plans that might occur for example due to unplanned orders.
Possible improvement: Real-time data that would keep managers informed about
production progress will be of high value to the company. Current system does not
allow tracking of production progress or online controlling what was produced, what
is being produced and what will be produced. Therefore production-monitoring
module should be implemented to the currently used EDP system to control the
production and establish punctual and feasible production plans for entire company.
Production capacity monitoring should allow to change production plans only if there
will be no detrimental impact on product delivery plan (Supply-Chain Council, 2008).
Benefit of real-time production information is also more precise estimation of ATP
(available-to-promise).
Bottleneck: Com 4
Description: Inventory levels are controlled by employees and not by EDP system.
Inventory levels are not updated once a week and the information is available to
managers only. There is no communication about inventory levels between the
company and other SC actors.
Possible improvement: Implementation of an EDP system with a module that can
keep control of inventory levels based on incoming and outgoing inventory flows.
This will enable managers to see actual inventory levels at all times and plan
replenishment as well as production activities more accurately. Such systems can be
built specifically according to the needs of a company (tailor-made) or it can use
standard software package (Faber, de Koster, & van de Velde, 2002). Moreover, the
customers would appreciate visible inventory levels because in that case they will be
able to plan their own activities including sourcing, production and promotion action
(Altug & Muharremoglu, 2011).
59
5 Conclusion and recommendations This chapter aims to provide the answers to the research questions as well as to
provide recommendations to improve the performance of the studied company.
Conclusion is presented in section 5.1 and the recommendations are presented in
section 5.2.
5.1 Conclusion This section composes of conclusion to clarify the findings of proposed research
questions so as to enable one to understand this study. The performed study is in the
form of case study and literature, observations, interviews and focus group provided
the input for this study. The output of the research activities is used to answer the
research questions. SRQ questions are gradually discussed in paragraphs below in the
same order as they are ordered in section 1.4. At the end of this section, GRQ is
answered.
Looking at the existing literature, it is important to notice that the customer order
cycle is a very complex business activity influenced by multiple issues.
As an answer to SRQ1 – “Which theoretical framework can be designed from existing
knowledge about supply chain, order cycle and communication in order to be able to
recommend performance improvements?” Figure 2.8 was designed. The theoretical
framework was derived after extensive literature study of given topics and topics
related to them. To be able to estimate the performance of a SC, it is necessary to
know its influencing factors. These are SC characteristics on one hand, and on the
other hand communication and information. Nevertheless, factors influencing only the
order cycle proved to be different. SC network characteristics comprise of
controllable order cycle issues that together with communication and information
(communication and information grouped together due to their correlation) influence
the order cycle characteristics. These issues influence the performance of the order
cycle and were used to project the research activities in order to find bottleneck of the
order cycle.
To manage bottlenecks, the system must be properly mapped. Bottlenecks can be then
identified and eventually eliminated.

60
Next, the operations of Typhoon’s order cycle were closely studied in order to answer
SRQ2 – “Which processes forms the order cycle of Typhoon, how are they executed
and what is the sequence of the processes?”
Application of the SCOR model allowed to define how is the current order cycle
organized. Unfortunately, these results cannot be compared as one piece to any
literature as the complexity of the order cycle differs from business to business and
cannot be unified. It is improbable that there would be a company where the
operations and processes will be carried out exactly the same way.
The procedure of breakdown of the processes into the detailed SCOR level III is
described in the literature (Li, Su, & Chen, 2011). The most detailed Level III of the
SCOR model identifies single processes of Typhoon’s operations. That allows to map
the order cycle and approach each process individually. The identification of the order
cycle processes embodied in this study is beneficial for Typhoon for making the
improvements more systematic and logical. After identification of Level III processes,
it became clear which department is responsible for which process. If there would not
be a clear and unified distinction of single processes it would be complicated to
address the process issues. Moreover, the use of SCOR model identifies process
performance measures appropriate for the case of Typhoon. The metrics are attached
to this report.
To find the answer to SRQ3 – “What communications take place that affects
Typhoon’s order cycle?” a different approach was taken. In this case the literature
distinguishes internal (Verčič, Verčič, & Shriramesh, 2012) and external (Dirsmith &
Covaleski, 1983; Winthereik & Vikkelso, 2005) communication. Unfortunately,
ongoing external communications of Typhoon proved to be on a lower level than the
literature proposes (Fawcett & Mangan, 2002). Typhoon is lacking in communication
with other supply chain actors and shares minimum information among the chain.
Furthermore, internal communication influencing the order cycle is in the literature
discussed rarely and therefore it was rather the SCOR model that was used to map the
current practice. In this way it turned out, that Typhoon is unable to disseminate real-
time data among the company and work with it throughout the order cycle (Internally
and externally). As a consequence, the company is unable to share the information
61
externally no matter whether it is intended or not. Taking in account the answers to
the third SRQ and the importance of communication discussed by the literature, it can
be derived that the current communication is lagging the ideal state. As shown in the
theoretical framework of this study, communication influences the performance of the
order cycle as well as the performance of the supply chain. Considering this, it can be
derived that communication should not be seen as a complement of the order cycle
operations or supply chain operations respectively, but as a performance enhancing
activity. To improve both dimensions of communication, internal communication and
information sharing should be improved first otherwise the company would
communicate inaccurate information and data with other supply chain actors, which
would not be beneficial to any of the parties.
To answer SRQ4 – “What are bottlenecks that affect efficiency and effectiveness of
Typhoon’s order cycle?” findings of SRQ1, 2 and 3 were used. According to the
theoretical framework, the research focused on processes and communication
influencing the order cycle. The state of order cycle processes and communications
was obtained by observations, interviews and focus group was compared to the SCOR
model and literature. Processes and communications exhibiting ineffective or
inefficient activities were identified as bottlenecks. Important to mention is the fact
that these bottlenecks constrain the performance of the order cycle, though they do
not represent an imminent danger for the existence of the company. Process
bottlenecks are in majority of cases caused by an absence of an IT system that would
either replace or assist the processes carried out by the employees. These processes
are endangered by a human error and together with the frequency of the activities do
not allow the process to perform better. Bottlenecks in communication are derived
after comparison of the captured state with other practices in the literature. It can be
concluded, that communication bottlenecks are rooted in inability to provide real-time
information and communicate this information on intra-organisational and inter-
organisational level. Complete overview of bottlenecks is presented in preceding
section 4.3.
GRQ5 – “What are possible improvements in the order cycle and communication of
Typhoon?” To answer this SRQ, empirical findings were compared with the
information contained in the SCOR model and in the literature. According to the
62
discrepancy between the current state of operations and literature, some possible
performance improvements are suggested.
Bottlenecks sP3.2, sP3.3, sS1.5, sS2.5, sM1.1, sM2.1, sD1.2, sD2.2, sD1.3, sD2.3,
sD1.9, sD2.9, Com 1/sP1.4 and Com /sP3.4 have one characteristics in common,
namely, a need for an IT enabler. To overcome these bottlenecks and increase the
performance of the company it is imperative to improve the current or implement a
new IT enabler. The literature describes different IT enablers introduced in past years
(Fawcet et al., 2007; Bowersox et al., 2010; Botta-Genoulaz & Millet, 2005; Hald &
Mouritsen, 2013). Such IT enablers would provide a better control of all processes
and would help to mitigate or eliminate discussed bottlenecks. Communication
bottlenecks are rooted in the way Typhoon communicates within and beyond the
scope of the company. The order cycle suffers from inability to work with the real-
time information and unify the intra-organizational and inter-organizational planning
a well as coordination of processes. Moreover, external communication of Typhoon is
not in alignment with the existing literature (Li & Lin, 2006) either because the
amount of shared information is limited to information about order specifications
only. Moreover, this information is communicated with the direct customers and
suppliers only, other actors of the SC in more remote tiers 2 have no access to the
information.
GRQ - “How can bottlenecks in Typhoon’s operations be identified, analysed and
potentially reduced by improvements in company’s order cycle and communication?”
Operations of Typhoon were extensively studied to answer all SRQ’s that gradually
discovered all facts necessary to answer GRQ. Literature study was used to design
areas where bottlenecks in Typhoon’s operations can occur. Moreover, literature
study presents how to manage bottlenecks. To manage them, bottlenecks need to be
identified, exploited and eventually eliminated.
Identification of bottlenecks can be realized by utilization-based method, queue
length-based method or wait-time based method. Exposing bottlenecks to its maximal
utilisation helps to analyze their capacitive properties and influence on the system.
Identified and analysed bottlenecks can be then mitigated or eliminated by adding
extra capacities (more workforce, facility/machine addition), improvements in used
methods or by introduction of different technology.
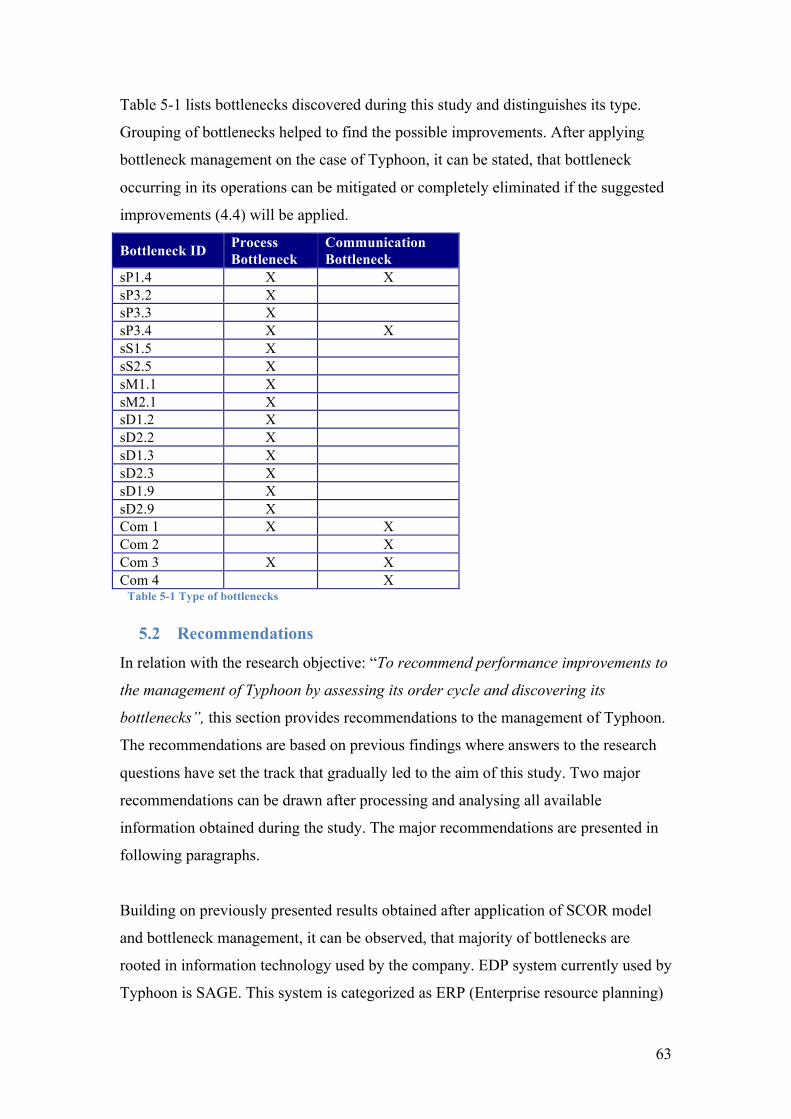
63
Table 5-1 lists bottlenecks discovered during this study and distinguishes its type.
Grouping of bottlenecks helped to find the possible improvements. After applying
bottleneck management on the case of Typhoon, it can be stated, that bottleneck
occurring in its operations can be mitigated or completely eliminated if the suggested
improvements (4.4) will be applied.
Bottleneck ID Process Bottleneck
Communication Bottleneck
sP1.4 X X sP3.2 X sP3.3 X sP3.4 X X sS1.5 X sS2.5 X sM1.1 X sM2.1 X sD1.2 X sD2.2 X sD1.3 X sD2.3 X sD1.9 X sD2.9 X Com 1 X X Com 2 X Com 3 X X Com 4 X
Table 5-1 Type of bottlenecks
5.2 Recommendations
In relation with the research objective: “To recommend performance improvements to
the management of Typhoon by assessing its order cycle and discovering its
bottlenecks”, this section provides recommendations to the management of Typhoon.
The recommendations are based on previous findings where answers to the research
questions have set the track that gradually led to the aim of this study. Two major
recommendations can be drawn after processing and analysing all available
information obtained during the study. The major recommendations are presented in
following paragraphs.
Building on previously presented results obtained after application of SCOR model
and bottleneck management, it can be observed, that majority of bottlenecks are
rooted in information technology used by the company. EDP system currently used by
Typhoon is SAGE. This system is categorized as ERP (Enterprise resource planning)

64
system. Such systems are defined as “a single database surrounded by applications
programs that take data from the database and either conduct analysis or collect
additional data for the firm”(Lawrence, Jennings, & Reynolds, 2005). SAGE program
in its current form is missing modules that would eliminate the bottlenecks. The
principal of the ERP system is a database with bidirectional information flows used
for all operations. Previously discussed results showed that the connections to the
central database are rare and together with present handling of information hinder the
operations of the company.
Typhoon currently does not employ all of the features of ERP proposed by Fawcet et
al. (2007). Presented bottlenecks can be mitigated or eliminated if other modules were
part of the system. Therefore, in order to improve Typhoon’s performance, following
recommendation is made:
Extend the use of ERP program and assimilate to the currently used system new
modules to control all necessary Plan, Source, Make and Deliver processes.
Improved ERP system will help the current fragmentation of information flows to
merge into one system that will be accessible to all departments and workers. Benefits
of implementation of ERP are vast. Lozinsky (1998) stated that improved access to
information would make decision making more responsive. This will help shorten the
lead-times of order cycle processes. New ERP will also enhance communication with
customers and suppliers because there will be no need to retype information twice and
enterprise-wide information will be provided in timely and accurate form(Botta-
Genoulaz & Millet, 2005). ERP system is powerful management solution (Gulledge
& Cavusoglu, 2001) and its complete implementation of will increase organizational
performance immediately or over time (Hald & Mouritsen, 2013).
Chang (2002) confirms, that improved manufacturing performance can be achieved
by integrating ERP and also that efficient information flow is critical for achieving
high SC performance. Implementation of informational system like ERP in SME
(small and medium enterprises) was examined by Černá (2014). This case study
presents benefits of ERP implementation such as: simplification of communication
between the company departments, simplification of cooperation with suppliers and
customers, easier access to information, integrated database or faster and more
accurate business processes (Černá, 2014).

65
This improvement in ERP will tackle the bottlenecks occurring in order cycle
processes. Though this improvement is important for mitigation of communication
bottlenecks as well.
Communication and information sharing among supply chain actors are extremely
important. Communication of Typhoon is discussed in section 4.2. Typhoon proved
that communication with its subsidiaries and business partners is different than
communication with entirely external suppliers and customers. Therefore in order to
improve Typhoon’s performance it is recommended to:
Increase the amount and quality of exchanged information with external suppliers
and customers in order to enhance communication among the supply chain.
Currently, the information exchange between Typhoon group and other supply chain
actors is negligible. Figure 4.3 shows that suppliers and customers of Typhoon have
minimal or no access to information about Typhoon’s operations. Increased amount
of information exchanged between SC actors can bring the benefits discussed in
section 2.3 and also mitigate discovered communication bottlenecks. The information
exchange should be extended to tiers 1 and 2 both up and down the stream.
Figure 5.1 highlights the areas of proposed communication extension (the coloured
areas). Typhoon should communicate and share information not only with its partners
and subsidiaries (depicted with no fill – white colour areas), but also with other SC
actors. By doing so, supply chain integration of Typhoon will improve which helps to
lower investments in inventory, reduce cycle times and lower logistics costs (Lummus
& Vokurka, 1999).
The first recommendation is up to a certain extend prerequisite for the successful
execution of the second recommendation because the ERP system and its features
facilitate exchange of quality and accurate information. This is believed to bring more
coordination and control over resources and processes within the supply chain and
increase responsiveness and reliability of Typhoon’s operations.
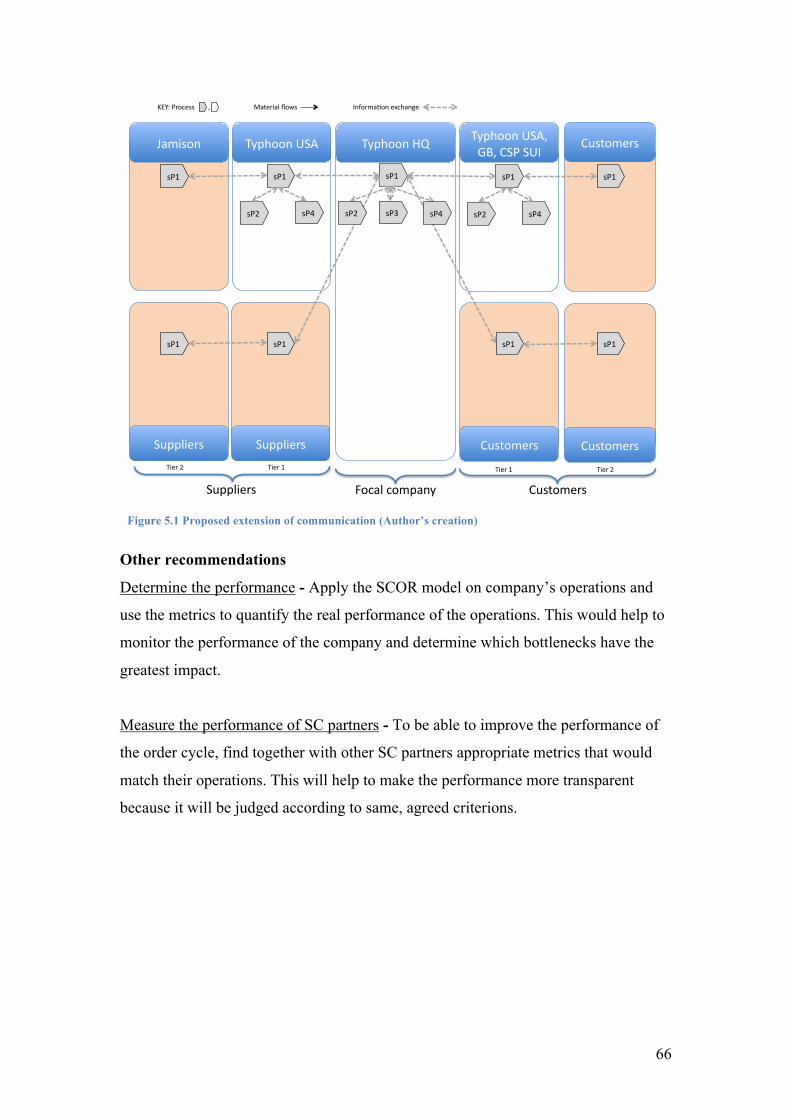
66
Figure 5.1 Proposed extension of communication (Author’s creation)
Other recommendations
Determine the performance - Apply the SCOR model on company’s operations and
use the metrics to quantify the real performance of the operations. This would help to
monitor the performance of the company and determine which bottlenecks have the
greatest impact.
Measure the performance of SC partners - To be able to improve the performance of
the order cycle, find together with other SC partners appropriate metrics that would
match their operations. This will help to make the performance more transparent
because it will be judged according to same, agreed criterions.
Jamison% Typhoon%USA% Typhoon%HQ% Customers%Typhoon%USA,%GB,%CSP%SUI%
Suppliers% Customers%
Suppliers% Customers%
sP1% sP1%
sP3%
sP1%
sP4%sP2%sP4%sP2%
Focal%company%
KEY:%Process%%%%%%%%,%%%%%%%%%%%%%%%%%%%%%%%%%%Material%flows%%%%%%%%%%%%%%%%%%%%%%%%%%%%%%%%%Informa5on%exchange%
Tier%2% Tier%1% Tier%1% Tier%2%
Suppliers% Customers%
sP1% sP1%sP1%
sP1%
sP1%
sP1%
sP2% sP4%

67
Optimize inventory - Typhoon keeps a number of products on stock to be able to
always meet the demand of its customers. Creating insight to the stock levels of
upstream supply chain actors can optimize stock level management. This applies on
Typhoon in two ways: Typhoon as a customer and as a supplier. It would be
beneficial to see the stock levels at any time without placing an inquiry.
Use barcodes - Current numeric code identification can cause errors during product
picking process. Use of barcodes on all products will not only improve the reliability
of the process, bar codes can be taken over by customers and there will be no need to
label products again in case of further sale.
Cross-train staff – train employees and make them be able to operate on more than
one position to make sure that a machine or process (potential bottlenecks) is never
idle due to an absence permanently assigned worker.
68
6 Discussion This chapter presents three final sections of this report. Section 6.1 presents
discussion while the limitations of this study are presented in section 6.2. Finally,
section 6.3 presents suggestions for further research.
6.1 Discussion This study was set out to recommend performance improvements to a production
company. To reach this goal the study sought to explore bottlenecks in customer order
cycle and communication system of the company. This study has also undergone a
literature review in order to understand the studied phenomena and to project the
appropriate framework.
Large amount of literature is focused on the matter of supply chains, though literature
with a clear description of what is the customer order cycle and what is its role in
supply chain is deficient. Remarkable topic discussed in literature is related to system
bottlenecks. On one hand, this topic is widely discussed in terms of manufacturing,
while on the other hand, literature seems to not pay enough attention to non-
manufacturing bottlenecks. Majority of information about bottlenecks presented in
literature was linked to manufacturing and more specifically to material flows. This
study shows that bottlenecks limiting system performance can also occur in
communication and information flow. Communication bottlenecks of Typhoon are
partly caused by absence of appropriate technology while other communication
problems are rooted in the amount and quality of information shared with other SC
actors.
Suggested improvements for each bottleneck are derived from the literature and from
the SCOR model. The result of this study covers the knowledge gap of Typhoon
about bottlenecks of its operations. In case of communication bottleneck it should be
remembered, that IT enablers are not the only prerequisite for good communication
within the supply chain. Literature identifies other important factors that influence the
communication like willingness to share information or relations between the SC
partners. Moreover, during examination of Typhoon’s communication, the research

69
direction was shifted towards SC integration that also proved to be important to
communication in SC and vice versa. This learning was used in recommendation.
6.2 Limitations
Despite the fact this study was carried out carefully, some limitations should be
drawn. The objective of this research was to recommend performance improvements
to the management of Typhoon. Therefore, the results are derived from a single case.
This fact disallows to apply the results beyond the scope of the company.
Nevertheless, generalisation of results was not intended.
Besides that, information obtained during the observations might not represent the
real state of observed phenomena due to disclosed identity and purpose of the visit of
the researcher. Since the employees of Typhoon knew that they are being observed,
they might have changed their normal behaviour. Therefore, the reliability of the
information obtained during the observations might be limited.
Another limitation is rooted in the tools used for the performance assessment. Due to
the limited access to the database of Supply Chain Council and Apics, it was not
possible to use the latest version of the model and therefore older versions and
materials were used to carry out the study. Nevertheless, the impact of this limitation
should not significantly influence the results.
6.3 Future research Due to the approach selected for this study, the results cannot be generalized. The
single case approach is limited only to the case of Typhoon only. It might be
interesting to scale up the research to find out what are the typical bottlenecks of
production companies of similar size and how do the companies deal with them.
Next, for Typhoon it would be interesting to extend the research and include all
performance attributes presented in the theoretical framework and their impact on the
performance of the company. The extension of the research will be of value to the
management of Typhoon, but its application on the proposed broader scale might
bring interesting results that could be generalized.
Furthermore, as the results have shown, Typhoon is recommended to adapt new
system that will most likely influence its functionality. It will be interesting to study
the ability and willingness of Typhoon to change and adjust the established work
processes. Moreover, another recommendation is to increase communication and

70
information sharing with other supply chain actors. Possible investigation of
willingness to share the information in such specific industry where Typhoon
participates might bring valuable results as well.
71
References Černá, M. (2014). Aspects of Information Management in Context with IS Selection by
SME. Proceedia Engineering , 745-750.
Altug, M. S., & Muharremoglu, A. (2011). Inventory management with advance supply
chain information. International Journal of Production Economics , 302-313.
Apics. (2013). Apics Dictionary . Fourteenth. Chicago: Apics.
Arreola-Risa, A., & De Croix, G. A. (1998). Make-to-Order versus make-to-stock in a
production-inventory system with general production times. IIE Transactions , 705-713.
Balou, R. H. (2004). Business logistics/supply chain management (5th Edition ed.). New
Jersey: Pearson-Prentice Hall.
Baltacioglu, T., Ada, E., Kaplan, M., & Yurt, O. (2007). A New Framework for Service
Supply Chains. The Service Industries Journal , 105-124.
Bhagwat, R., & Sharma, M. K. (2007). Performance measurement of supply chain
management: A balance scorecard approach. Computer and Industrial Engineering , 43-62.
Botta-Genoulaz, V., & Millet, P.-A. (2005). An invetigation into the use of ERP systems in
the service sector. International Journal of Production Economics , 202-221.
Bowersox, D. J., Closs, D. J., & Cooper, M. B. (2010). Supply Chain Logistics Management
(International 3rd Edition ed.). Singapore: McGraw-Hill.
Bragg, S. M. (2005). Inventory Accounting. John WIley and Sons.
Brillouin, L. (2013). Science and Information Theory (Dover ed., Vol. II). Dover: Dover
publication.
Chang, H. H. (2002). A model of computerization of manufacturing systems: an
international study. Information and Management , 605-624.
Childerhouse, P., & Towill, D. R. (2011). Arcs of Supply Chain Integration. International
Journal of Production Research , 7441-7468.
Cho, D. W., Lee, Y. H., Ahn, S. H., & Hwang, M. K. (2012). A framework for measuring
the performance of service supply chain management. Computer & Industrial Engineering ,
801-818.

72
Chopra, S., & Meindl, P. (2015). Retrieved 2015 йил January from
http://216.54.19.111/~mountaintop/log102/scopage_dir/mod06a/elo1.html
Chopra, S., & Meindl, P. (2013). Supply Chain Management: Strategy, Planning, and
Operations. Essex: Paerson Education Limited.
Christopher, M. G. (1998). Logistics and Supply Chain Management: Strategies for
Reducing Costs and Improving Services. London: FT Pitman Publishing.
Christopher, M. (1992). Logistics and Supply Chain Management. London: Pitman
Publishing.
Christopher, M. (2005). Logistics and Supply Chain Management (3rd Edition ed.). Paerson
Edication Limited.
Cutting-Decelle, A.-F., Young, B., Das, B., Keith, C., Rahimifard, S., Anumba, C., et al.
(2007). A Review of Approaches to Supply Chain Communications: From Manufacturing to
Construction. ITcon , 73-102.
de Treville, S., Bicer, I., Chavez-Demoulin, V., Hagspiel, V., Schürhof, N., Tasserit, C., et
al. (2014). Valuing lead time. Journal of Operations Management , 337-346.
Dewan, Z. I., Meier, J. F., Aditjandra, P. T., Zunder, T. H., & Pace, G. (2012). Logistics and
Supply Chain Management. Research in Transportational Economics , 3-16.
Dirsmith, M. W., & Covaleski, M. A. (1983). Strategy, External communication and
Environmental Contexte. Strategic Management Journal , 4 (2), 137-151.
European Central Bank. (n.d.). Euro foreign exchange reference rates. Retrieved 2014 йил
11-12 from Euro foreign exchange reference rates:
https://www.ecb.europa.eu/stats/exchange/eurofxref/html/index.en.html
Faber, N., de Koster, M., & Smidts, A. (2013). Organizing wareouse management.
International Journal of Operations & Production Management , 1230-1256.
Faber, N., de Koster, R., & van de Velde, S. (2002). Organizing Warehouse Management.
International Journal of Operations and Productions Management , 1230-1256.
Fawcet, S. E., Ellram, L. M., & Ogden, J. A. (2007). Supply Chain Management - From
Vision to Implementation. New Jersey: Paerson Education.
Fawcett, S., & Mangan, G. (2002). The rhetoric and reality of supply chain integration.
International Journal of Physical Distribution and Logistics Management , 339-361.
Gademann, N., van den Berg, J., & van der Hoff, H. (2001). An order batching algorithm for
wawe picking in a parallel-aisle warehouse . IIE Transactions .
73
Gill, J., & Johnson, P. (2002). Research Methods for Managers. London: Sage Publishing.
Gulledge, T., & Cavusoglu, T. (2001). Alligning the SUpply Chain Operations Reference
Model with Enterprise Applications: Real-time Value Chain Inteligence. Fairfax,
Washington, USA.
Gunasekaran, A., & Kobu, B. (2007). Performance measures and metrics in logistics and
supply chain management: a review of recente literature (1996-2004) for research and
applications. International Journal of Production Research , 2819-2840.
Gunasekaran, A., Patel, C., & McGaughey, R. E. (2004). A Framework for supply chain
performance measurement. International journal of production economics , 333-347.
Gunasekaran, A., Patel, C., & Tirtiroglu, E. (2001). Performance measures and metrics in a
supply chain environment. International Journal of Operations & Production management ,
71-87.
Hald, K. S., & Mouritsen, J. (2013). Enterprise resource planning, operations and
management. International Journal of Operations and Productions Management , 1075-1104.
Hatch, M. J. (1997). Organization Theory. New York: Oxford University Press Inc.
Hinckeldeyn, J., Dekkers, R., Altfeld, N., & Kreutzfeld, J. (2014). Expanding bottleneck
management from manufacturing product design and engineering processes. Computers and
Industrial Engineering , 415-428.
Izmailov, A. (2014). If your company is considering the Theory of Constraints. Procedia -
Social and Behavioral Sciences , 925-929.
Kahraman, C., & Öztaysi, B. (2014). Supply Chain Management Under Fuzziness: Recent
Developments and Techniques. Springer.
Kocaoglu, B., Gülsün, B., & Tanyas, M. (2013). A SCOR based approach for measuring
benchmarkable supply chain performance. Journal of Intellectual Manufacturing , 113-132.
Koenig, D. T. (1994). Manufacturing Engineering: Principles For Oprimization . CRC
Press.
Krone, F. J., Jablin, F. M., & Putnam, L. L. (1987). Communication theory and
organizational communication: multiple perspectives. In F. J. Krone, L. L. Putnam, K. H.
Roberts, & L. M. Porter, Handbook of Organizational Communication: An Interdisciplinary
Perspective (pp. 18-40). Newburry Park, CA: Sage.
Kumar, R. (2011). Research methodology a step-by-step guide for beginners (3rd Edition
ed.). Sage.

74
Lambert, D., & Cooper, M. (2000). Issues in Supply Chain Management. Industrial
Marketing Management , 65-83.
Lawrence, F. B., Jennings, D. F., & Reynolds, B. E. (2005). ERP in distribution.
Thomson/South Western.
Lee, H. L., Padmanabhan, V., & Whang, S. (1997). The bullwhip effect in supply chains.
Spring.
Li, L., Su, Q., & Chen, X. (2011). Ensuring Supply Chain Quality Performance Through
Applying the SCOR Model . International Journal of Production Research , 33-57.
Li, S., & Lin, B. (2006). Accessing information sharing and information quality in supply
chain management. Decision Support System , 1641-1656.
Lozinsky, S. (1998). Enterprise-wide Software Solution: Integration Strategies and
Practices. Edison - Wesley.
Lummus, R. R., & Vokurka, R. J. (1999). Defining supply chain management: a historical
pespective and practical guidelines. Industrial Management & Data Systems , 11-17.
Madenas, N., Tiwari, A., Turner, C. J., & Woodward, J. (2014). Information flow in supply
chan management: A review across the product lifecycle. CIRP Journal of Manufacturing
Science and Technology , 335.346.
Mason, J. (2002). Qulitative researching. London: SAGE Publications.
Neely, A., Gregory, M., & Platts, K. (2005). Performance measurements system design.
International Journal of Operations & Production Management , 1228-1263.
Olhager, J. (2010). The role of the customer order decoupling point in production and supply
chain management. Computers in Industry , 863-868.
Paton, S., Clegg, B., Hsuan, J., & Pilkington, A. (2011). Operations Management.
Maidenhead: McGraw-Hill Education.
Pibernik, R., & Yadav, P. (2009). Inventory reservation and real-time order promising in
Make-to-Stock sytem. OR Spectrum , 281-307.
Pinedo, M. L. (2005). Planning and Scheduling in Manufacturing and Services. New York:
Springer Science + Business Media Inc.
Ritson, M. (2012). Should you launch a fighter brand? . Harward Business Review .
SAGE. (2015). SAGE additions. Retrieved 2015 йил 1-6 from
https://my.sage.co.uk/public/additions/details?additionId=931
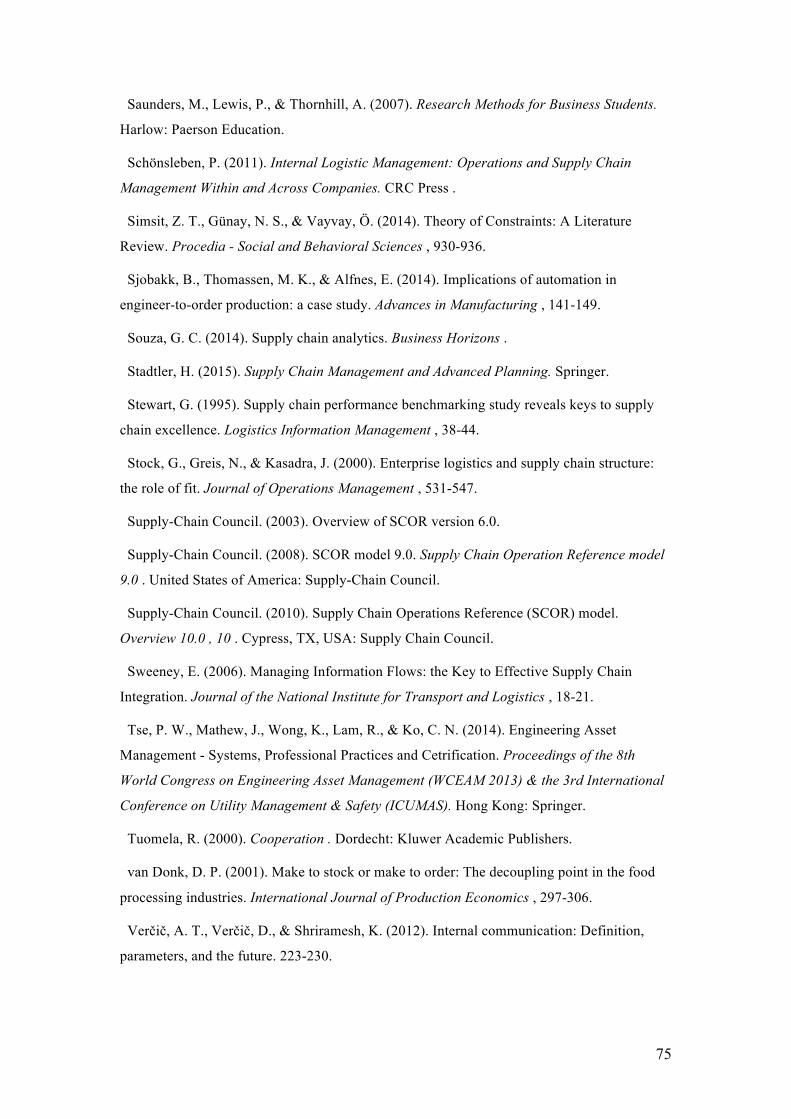
75
Saunders, M., Lewis, P., & Thornhill, A. (2007). Research Methods for Business Students.
Harlow: Paerson Education.
Schönsleben, P. (2011). Internal Logistic Management: Operations and Supply Chain
Management Within and Across Companies. CRC Press .
Simsit, Z. T., Günay, N. S., & Vayvay, Ö. (2014). Theory of Constraints: A Literature
Review. Procedia - Social and Behavioral Sciences , 930-936.
Sjobakk, B., Thomassen, M. K., & Alfnes, E. (2014). Implications of automation in
engineer-to-order production: a case study. Advances in Manufacturing , 141-149.
Souza, G. C. (2014). Supply chain analytics. Business Horizons .
Stadtler, H. (2015). Supply Chain Management and Advanced Planning. Springer.
Stewart, G. (1995). Supply chain performance benchmarking study reveals keys to supply
chain excellence. Logistics Information Management , 38-44.
Stock, G., Greis, N., & Kasadra, J. (2000). Enterprise logistics and supply chain structure:
the role of fit. Journal of Operations Management , 531-547.
Supply-Chain Council. (2003). Overview of SCOR version 6.0.
Supply-Chain Council. (2008). SCOR model 9.0. Supply Chain Operation Reference model
9.0 . United States of America: Supply-Chain Council.
Supply-Chain Council. (2010). Supply Chain Operations Reference (SCOR) model.
Overview 10.0 , 10 . Cypress, TX, USA: Supply Chain Council.
Sweeney, E. (2006). Managing Information Flows: the Key to Effective Supply Chain
Integration. Journal of the National Institute for Transport and Logistics , 18-21.
Tse, P. W., Mathew, J., Wong, K., Lam, R., & Ko, C. N. (2014). Engineering Asset
Management - Systems, Professional Practices and Cetrification. Proceedings of the 8th
World Congress on Engineering Asset Management (WCEAM 2013) & the 3rd International
Conference on Utility Management & Safety (ICUMAS). Hong Kong: Springer.
Tuomela, R. (2000). Cooperation . Dordecht: Kluwer Academic Publishers.
van Donk, D. P. (2001). Make to stock or make to order: The decoupling point in the food
processing industries. International Journal of Production Economics , 297-306.
Verčič, A. T., Verčič, D., & Shriramesh, K. (2012). Internal communication: Definition,
parameters, and the future. 223-230.

76
Véronneau, S., & Roy, J. (2009 ). RFID benefits, costs and possibilities: The economical
analysis of RFID deployment in a cruise corporation global service supply chain.
International Journal of Production Economics , 692-702.
Verschuren, P., & Doorewaard, H. (2010). Designing a Research Project (Vol. II). The
Hague: Eleven International Publishing.
Watson, K. J., Blackstone, J. H., & Gardiner, S. C. (2007). The evolution of a management
philosophy: The theory of constraints. Journal of Operations Management , 387-402.
Wemmerlöv, U. (1984). Assemble-to-Order Manufacturing: Implications For Materials
Management. Journal of Opearions Management , 347-368.
Winthereik, B. R., & Vikkelso, S. (2005). ICT and Integrated Care: Some Dilemmas of
Standardising Inter-Organisational Communication. Computer Supported Cooperative Work ,
43-67.
XE. (2014). XE Currency. Retrieved 2014 29-November from
http://www.xe.com/currencycharts/?from=EUR&to=RUB&view=2Y
Yang, L.-R. (2013). Key practices, manufacturing capability and attainment of
manufacturing goals: The perspective of project/engineer-to-order manufacturing.
International Journal of Project Management , 109-125.
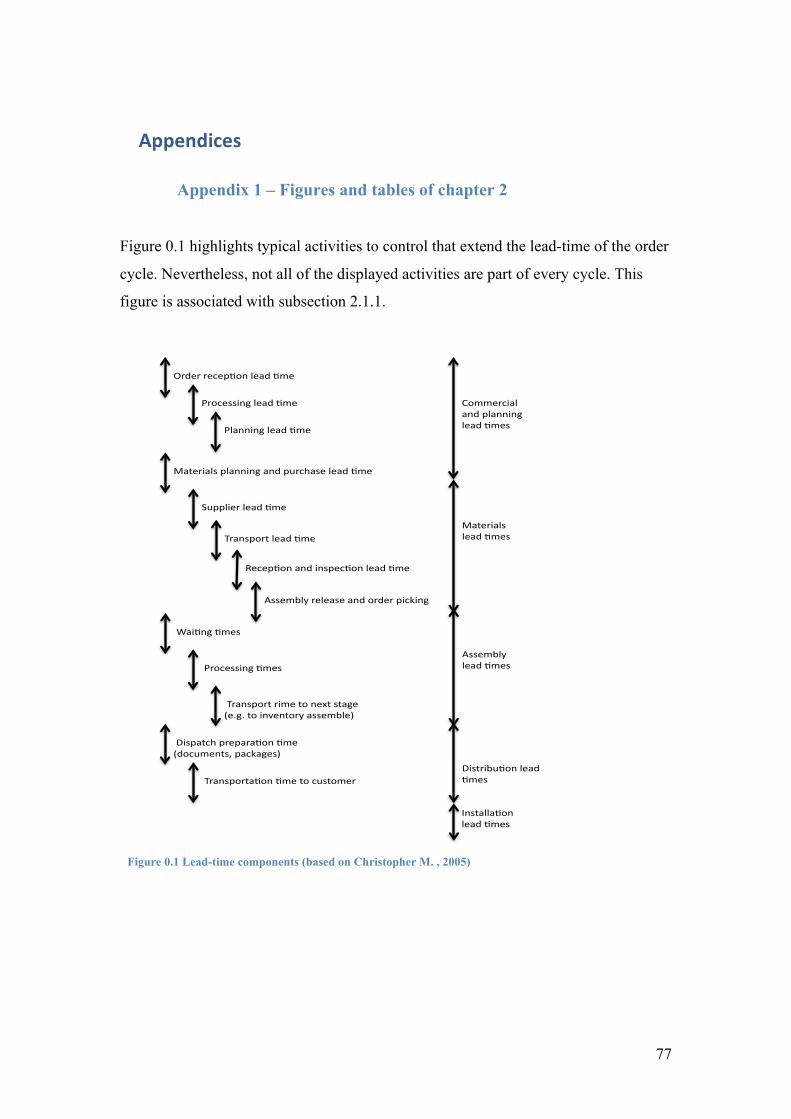
77
Appendices
Appendix 1 – Figures and tables of chapter 2
Figure 0.1 highlights typical activities to control that extend the lead-time of the order
cycle. Nevertheless, not all of the displayed activities are part of every cycle. This
figure is associated with subsection 2.1.1.
Figure 0.1 Lead-time components (based on Christopher M. , 2005)
Order*recep)on*lead*)me*
Processing*lead*)me*
Planning*lead*)me*
Materials*planning*and*purchase*lead*)me*
Supplier*lead*)me*
Commercial*and*planning*lead*)mes*
Transport*lead*)me*
Recep)on*and*inspec)on*lead*)me*
Assembly*release*and*order*picking***
*Wai)ng*)mes*
*Processing*)mes*
*Transport*rime*to*next*stage**(e.g.*to*inventory*assemble)*
*Dispatch*prepara)on*)me*(documents,*packages)**
*Transporta)on*)me*to*customer*
Materials*lead*)mes*
Assembly*lead*)mes*
Distribu)on*lead*)mes*
Lead*)me*components*
Installa)on*lead*)mes*

78
Figure 0.2 shows calculation of total order cycle time (i.e. order lead-time) and is
associated with subsection 2.1.1.
tT= tentry + tplanning + tsaf + tdelivery
tT - Total order cycle time
tentry - Order entry time
tplanning - Order planning time (design+ communication+ scheduling time)
tsaf – Order sourcing, assembly, and follow up time
tdelivery – Finished goods delivery time
Figure 0.2 Order cycle time calculation (Gunasekaran, Patel, & Tirtiroglu, 2001)
Figure 0.3 depicts an example path of a customer order in detail. From the figure it is
clear that the way the orders are processed can be complex and several different
scenarios can occur during the order cycle. Therefore it is important to map the order
path, identify the processes and measure their performances with foreordain metrics
selected by each company according to its policy. This figure is associated with
subsection 2.1.2.
Figure 0.3 Customer order cycle path example (Christopher M.1992)
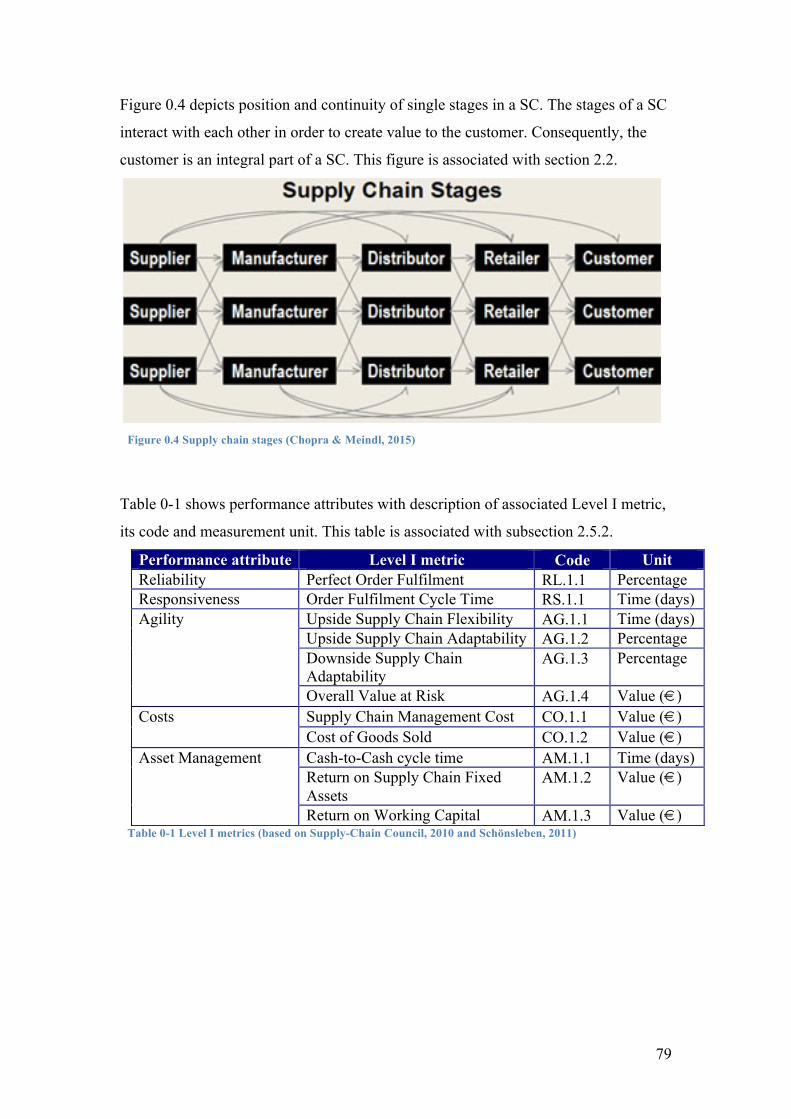
79
Figure 0.4 depicts position and continuity of single stages in a SC. The stages of a SC
interact with each other in order to create value to the customer. Consequently, the
customer is an integral part of a SC. This figure is associated with section 2.2.
Figure 0.4 Supply chain stages (Chopra & Meindl, 2015)
Table 0-1 shows performance attributes with description of associated Level I metric,
its code and measurement unit. This table is associated with subsection 2.5.2.
Performance attribute Level I metric Code Unit Reliability Perfect Order Fulfilment RL.1.1 Percentage Responsiveness Order Fulfilment Cycle Time RS.1.1 Time (days)
Upside Supply Chain Flexibility AG.1.1 Time (days) Upside Supply Chain Adaptability AG.1.2 Percentage Downside Supply Chain Adaptability
AG.1.3 Percentage
Agility
Overall Value at Risk AG.1.4 Value (€) Supply Chain Management Cost CO.1.1 Value (€) Costs Cost of Goods Sold CO.1.2 Value (€) Cash-to-Cash cycle time AM.1.1 Time (days) Return on Supply Chain Fixed Assets
AM.1.2 Value (€) Asset Management
Return on Working Capital AM.1.3 Value (€) Table 0-1 Level I metrics (based on Supply-Chain Council, 2010 and Schönsleben, 2011)

80
Appendix 2 - SCOR Metrics Metric Code Level 1
Metric Code Level II
Metric Code Level III
Name Definition Measurement
RL.1.1 Perfect Order Fulfilment [Total Perfect Orders] / [Total Number of Orders] x 100% % RL.2.1 %of Orders Delivered In Full [Total number of orders delivered in full] / [Total number of orders delivered] x 100% % RL.3.33 Delivery Item Accuracy Percentage of orders in which all items ordered are the items actually provided, and no extra items are provided % RL.3.35 Delivery Quantity Accuracy Percentage of orders in which all quantities received by the customer match the order quantities (within mutually
agreed tolerances) %
RL.2.2 Delivery Performance to Customer Commit Date
[Total number of orders delivered on the original commitment date] / [Total number of orders delivered] x 100% %
RL.3.32 Customer Commit Date Achievement Time Customer Receiving
Percentage of orders which is received on time as defined by the customer %
RL.3.34 Delivery Location Accuracy Percentage of orders which is delivered to the correct location and customer entity % RL.2.3 Documentation Accuracy [Total number of orders delivered with accurate documentation] / [Total number of orders delivered] x 100% % RL.3.31 Compliance Documentation
Accuracy
Percentage of compliance documentations are complete, correct, and readily available when and how expected by customer, Government and other supply chain regulatory entities. Compliance documentations includes material safety data sheets
%
RL.3.43 Other Required Documentation Accuracy
Percentage of other required documentations (besides of compliance documentation, payment documentation and shipping documentation) are complete, correct, and readily available when and how expected by customer, Government and other supply chain regulatory entities. This kind of documentations includes quality certification
%
RL.3.45 Payment Documentation Accuracy
Percentage of payment documentations are complete, correct, and readily available when and how expected by customer, Government and other supply chain regulatory entities. Payment documentations includes invoice, contractual outline agreement
%
RL.3.50 Shipping Documentation Accuracy Percentage of shipping documentations are complete, correct, and readily available when and how expected by customer, Government and other supply chain regulatory entities. Shipping documentations includes packing slips (customers), bill of lading (carriers) and government or customs documentation / forms
%
RL.2.4 Perfect Condition [Number of orders delivered in Perfect Condition] / [Number of orders delivered] x 100% % RL.3.12 % Of Faultless Installations Number of Faultless Installations divided by Total Number of Units Installed. % RL.3.24 % Orders/ lines received damage free The number of orders / lines that are processed damage free divided by the total orders / lines processed in the
measurement period %
RL.3.41 Orders Delivered Damage Free Conformance
Percentage of orders which is delivered without damage
%
RL.3.42 Orders Delivered Defect Free Conformance
Percentage of orders which is delivered without defect %
RL.3.55 Warranty and Returns Number of returns within the warranty period. Nr. of units

81
Other RL metrics RL.3.49 Schedule Achievement % of time that a plant achieves its production schedule. This calculation is based on the number of scheduled end-items or total volume for a specific period. Note: over- shipments do not make up for under- shipments.
%
RL.3.4 % correct material documentation The percent of total shipments that include the correct environmental documentation % RL.3.36 Fill Rate The percentage of ship-from-stock orders shipped within 24 hours of order receipt. % RS1.1 Order Fulfilment Cycle Time [Sum Actual Cycle Times For All Orders Delivered] / [Total Number Of Orders Delivered] Time RS.2.1 Source Cycle Time Sum of all source cycle times Time RS.3.8 Authorize Supplier Payment Cycle
Time The average time associated with authorization of a payment to suppliers. Time
RS.3.35 Identify Sources of Supply Cycle Time
The average time associated with the identification of sources of supply Time
RS.3.107 Receive Product Cycle Time The average time associated with receiving product Time RS.3.122 Schedule Product Deliveries Cycle
Time The average time associated with scheduling the shipment of the return of MRO product Time
RS.3.125 Select Supplier and Negotiate Cycle Time
The average time associated with selecting a supplier and negotiating Time
RS.3.139 Transfer Product Cycle Time The average time associated transfer until product is moved to the next process. Time RS.3.140 Verify Product Cycle Time
The average time associated with verifying raw material product Time
RS.2.2 Make Cycle Time Sum of all make cycle times Time RS.3.33 Finalize Production Engineering Cycle
Time The average time associated with the finalization of production engineering Time
RS.3.49 Issue Material Cycle Time The average time associated with the issuance of material to production Time RS.3.101 Produce and Test Cycle Time The average time associated with production and test Time RS.3.114 Release Finished Product to Deliver
Cycle Time The average time associated with releasing finished product to deliver Time
RS.3.123 Schedule Production Activities Cycle Time
The average time associated with scheduling production activities Time
RS.3.128 Stage Finished Product Cycle Time The average time associated with staging finished product Time RS.3.142 Package Cycle Time The total time required to containerize finished product for sale or storage Time RS.2.3 Deliver Cycle Time Sum of all delivery cycle times Time RS.3.16 Build Loads Cycle Time The average time associated with building shipment loads. Time RS.3.18 Consolidate Orders Cycle Time The average time required for customer order consolidation Time RS.3.46 Install Product Cycle Time The average time associated with product installation Time RS.3.51 Load Product
& Generate Shipping Documentation Cycle Time
The average time associated with product loading and the generation of shipping documentation Time
RS.3.95 Pack Product Cycle Time The average time associated with packing a product for shipment. Time RS.3.96 Pick Product Cycle Time The average time associated with product pick Time RS.3.102 Receive & Verify Product by Customer
Cycle Time The average time associated with receiving and verifying an order at the customer site Time
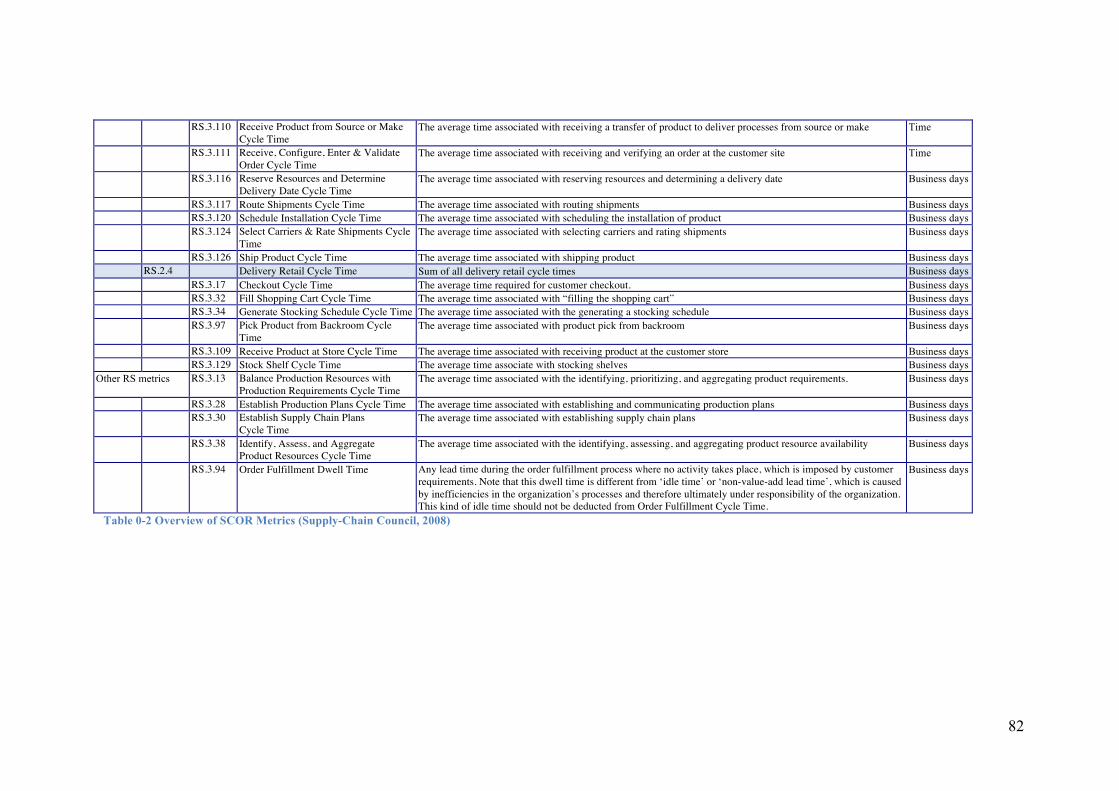
82
RS.3.110 Receive Product from Source or Make Cycle Time
The average time associated with receiving a transfer of product to deliver processes from source or make Time
RS.3.111 Receive, Configure, Enter & Validate Order Cycle Time
The average time associated with receiving and verifying an order at the customer site Time
RS.3.116 Reserve Resources and Determine Delivery Date Cycle Time
The average time associated with reserving resources and determining a delivery date Business days
RS.3.117 Route Shipments Cycle Time The average time associated with routing shipments Business days RS.3.120 Schedule Installation Cycle Time The average time associated with scheduling the installation of product Business days RS.3.124 Select Carriers & Rate Shipments Cycle
Time The average time associated with selecting carriers and rating shipments Business days
RS.3.126 Ship Product Cycle Time The average time associated with shipping product Business days RS.2.4 Delivery Retail Cycle Time Sum of all delivery retail cycle times Business days RS.3.17 Checkout Cycle Time The average time required for customer checkout. Business days RS.3.32 Fill Shopping Cart Cycle Time The average time associated with “filling the shopping cart” Business days RS.3.34 Generate Stocking Schedule Cycle Time The average time associated with the generating a stocking schedule Business days RS.3.97 Pick Product from Backroom Cycle
Time The average time associated with product pick from backroom Business days
RS.3.109 Receive Product at Store Cycle Time The average time associated with receiving product at the customer store Business days RS.3.129 Stock Shelf Cycle Time The average time associate with stocking shelves Business days Other RS metrics RS.3.13 Balance Production Resources with
Production Requirements Cycle Time The average time associated with the identifying, prioritizing, and aggregating product requirements. Business days
RS.3.28 Establish Production Plans Cycle Time The average time associated with establishing and communicating production plans Business days RS.3.30 Establish Supply Chain Plans
Cycle Time The average time associated with establishing supply chain plans Business days
RS.3.38 Identify, Assess, and Aggregate Product Resources Cycle Time
The average time associated with the identifying, assessing, and aggregating product resource availability Business days
RS.3.94 Order Fulfillment Dwell Time Any lead time during the order fulfillment process where no activity takes place, which is imposed by customer requirements. Note that this dwell time is different from ‘idle time’ or ‘non-value-add lead time’, which is caused by inefficiencies in the organization’s processes and therefore ultimately under responsibility of the organization. This kind of idle time should not be deducted from Order Fulfillment Cycle Time.
Business days
Table 0-2 Overview of SCOR Metrics (Supply-Chain Council, 2008)
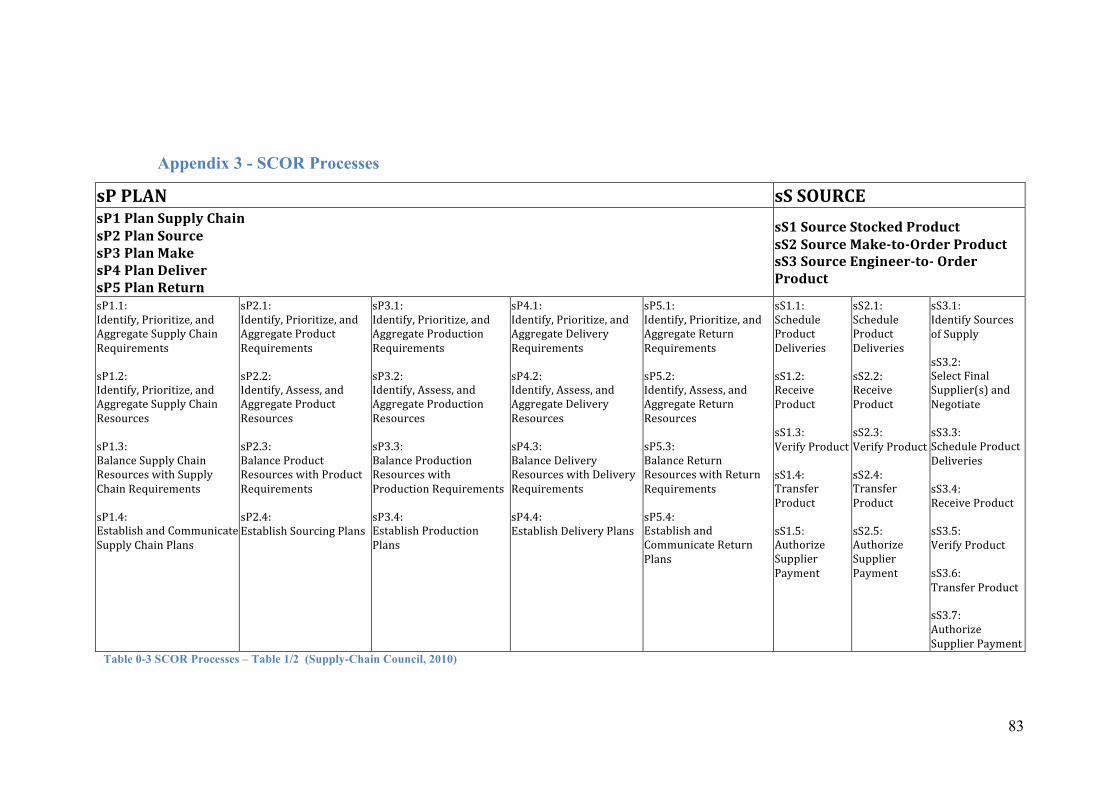
83
Appendix 3 - SCOR Processes
sP PLAN sS SOURCE sP1 Plan Supply Chain sP2 Plan Source sP3 Plan Make sP4 Plan Deliver sP5 Plan Return
sS1 Source Stocked Product sS2 Source Make-to-Order Product sS3 Source Engineer-to- Order Product
sP1.1: Identify, Prioritize, and Aggregate Supply Chain Requirements sP1.2: Identify, Prioritize, and Aggregate Supply Chain Resources sP1.3: Balance Supply Chain Resources with Supply Chain Requirements sP1.4: Establish and Communicate Supply Chain Plans
sP2.1: Identify, Prioritize, and Aggregate Product Requirements sP2.2: Identify, Assess, and Aggregate Product Resources sP2.3: Balance Product Resources with Product Requirements sP2.4: Establish Sourcing Plans
sP3.1: Identify, Prioritize, and Aggregate Production Requirements sP3.2: Identify, Assess, and Aggregate Production Resources sP3.3: Balance Production Resources with Production Requirements sP3.4: Establish Production Plans
sP4.1: Identify, Prioritize, and Aggregate Delivery Requirements sP4.2: Identify, Assess, and Aggregate Delivery Resources sP4.3: Balance Delivery Resources with Delivery Requirements sP4.4: Establish Delivery Plans
sP5.1: Identify, Prioritize, and Aggregate Return Requirements sP5.2: Identify, Assess, and Aggregate Return Resources sP5.3: Balance Return Resources with Return Requirements sP5.4: Establish and Communicate Return Plans
sS1.1: Schedule Product Deliveries sS1.2: Receive Product sS1.3: Verify Product sS1.4: Transfer Product sS1.5: Authorize Supplier Payment
sS2.1: Schedule Product Deliveries sS2.2: Receive Product sS2.3: Verify Product sS2.4: Transfer Product sS2.5: Authorize Supplier Payment
sS3.1: Identify Sources of Supply sS3.2: Select Final Supplier(s) and Negotiate sS3.3: Schedule Product Deliveries sS3.4: Receive Product sS3.5: Verify Product sS3.6: Transfer Product sS3.7: Authorize Supplier Payment
Table 0-3 SCOR Processes – Table 1/2 (Supply-Chain Council, 2010)

84
sM MAKE sD DELIVER sM1 Make-to-Stock sM2 Make-to-Order sM3Engineer-to-Order
sD1 Deliver Stocked Product sD2 Deliver Make-to-Order Product sD3 Deliver Engineer-to-Order Product sD4 Deliver Retail Product
sM1.1: Schedule Production Activities sM1.2: Issue Product sM1.3: Produce and Test sM1.4: Package sM1.5: Stage Product sM1.6: Release Product to Deliver sM1.7: Waste Disposal
sM2.1: Schedule Production Activities sM2.2: Issue Product sM2.3: Produce and Test sM2.4: Package sM2.5: Stage Finished Product sM2.6: Release Finished Product to Deliver sM2.7: Waste Disposal
sM3.1: Finalize Production Engineering sM3.2: Schedule Production Activities sM3.3: Issue Product sM3.4: Produce and Test sM3.5: Package sM3.6: Stage Finished Product sM3.7: Release Product to Deliver sM3.8: Waste Disposal
sD1.1: Process Inquiry and Quote sD1.2: Receive, Enter, and Validate Order sD1.3: Reserve Inventory and Determine Delivery Date sD1.4: Consolidate Orders sD1.5: Build Loads sD1.6: Route Shipments sD1.7: Select Carriers and Rate Shipments sD1.8: Receive Product from Source or Make sD1.9: Pick Product sD1.10: Pack Product sD1.11: Load Vehicle and Generate Shipping Docs sD1.12: Ship Product sD1.13: Receive and Verify Product by Customer sD1.14: Install Product sD1.15: Invoice
sD2.1: Process Inquiry and Quote sD2.2: Receive, Configure, Enter, and Validate Order sD2.3: Reserve Inventory and Determine Delivery Date sD2.4: Consolidate Orders sD2.5: Build Loads sD2.6: Route Shipments sD2.7: Select Carriers and Rate Shipments sD2.8: Receive Product from Source or Make sD2.9: Pick Product sD2.10: Pack Product sD2.11: Load Product and Generate Shipping Docs sD2.12: Ship Product sD2.13: Receive and Verify Product by Customer sD2.14: Install Product sD2.15: Invoice
sD3.1: Obtain and Respond to RFP/RFQ sD3.2: Negotiate and Receive Contract sD3.3: Enter Order, Commit Resources, and Launch Program sD3.4: Schedule Installation sD3.5: Build Loads sD3.6: Route Shipments sD3.7: Select Carriers and Rate Shipments sD3.8: Receive Product from Source or Make sD3.9: Pick Product sD3.10: Pack Product sD3.11: Load Product and Generate Shipping Docs sD3.12: Ship Product sD3.13: Receive and Verify Product by Customer sD3.14: Install Product sD3.15: Invoice
Table 0-4 SCOR Processes – Table 2/2 (Supply-Chain Council, 2010)

85
Figure 0.5 displays level III processes embodied in the order cycle of Typhoon together with its position and responsible actor. The figure builds
on figures presented in chapter 4, more specifically on Figure 4.1 and Figure 4.2. Each of the presented figures contained processes that were
subject for further breakdown of processes into level III. The most detailed overview of Typhoons order cycle could thus be created. Figure 0.5
adds more details about sequencing of the order cycle processes. This figure is associated with subsection 4.1.2 - Order cycle processes
Figure 0.5 SCOR processes level III (Authors creation)

86
Appendix 4 - List of interviewees
Number Code Position/Function Company Date of interview
1 MKa Managing director Typhoon, Typhoon USA, Typhoon UK
24.3.2015
2 MKo Department manager (Manual cleaning)
Typhoon 31.3.2015
3 KBa Department manager (Automatic cleaning)
Typhoon 7.4.2015
4 EGi Managing director CSP 9.4.2015 5 ESt Customer care Typhoon 31.3.2015 6 MJe Production officer Typhoon 30.3.2015 7 FLe Warehouse officer Typhoon 8.4.2015
Table 0-5 Respondents

87
Appendix 5 - Interviews All conducted interviews had similar structure. At the beginning the interviewees
were greeted and the researcher thanked them for accepting the invitation and taking
part in the research. The interviews started with an introduction of the researcher,
introduction of the goal of the research and the general structure of the interview.
The researcher also introduced his study background and personal motivation for the
research. The goal introduction emphasized the aspiration “To recommend
performance improvements to the management of Typhoon by assessing its order
cycle and discovering its bottlenecks”. The respondents were also informed about the
timeframe of the interview. The estimated duration was 40 minutes.
After opening the interview, the researcher clarified the role and responsibilities of the
interviewee in their company. Once this was clear, the interview moved on to the
main part where specific topics related to the position of the interviewee were
discussed. The themes and questions to discuss were derived from the literature study
and theoretical framework. The themes included:
• Operations lead-times • Order Path • Manufacturing strategy • SCOR model related processes and practices • Customer order cycle • Information and communication inside and outside of the company
Themes of the interview differed according to the profile of the interviewee. Special
attention was paid to SCOR elements (process, performance and metrics) of all levels.
Interviewees were asked to refer to topics from two perspectives. The first perspective
was supposed to reveal the interviewees opinion on current policy and the second
perspective was believed to discover interviewee’s view on possible changes and
challenges of the policy in the future. Before the interview had finished, the
conclusions and summaries were discussed. This helped to confirm the understanding
of the obtained information. Finally, the interviewees were thanked for the input
provided and time spared for the interview.
Each interview is numbered and composes of information about the interviewee and
there is also a summary of information obtained during the interviews. The most
important outcomes are summarized below.

88
Interview 1
Position of interviewee: Managing director
Company: Typhoon
Date of interview: 24.3.2015
Additional information:
• Executive director of Typhoon, Typhoon USA and Typhoon UK,
• Majority of time in HQ in Germany
• Business trips to USA and UK at least once in two months
• Sets the strategic and tactical plans
Current policy
Currently there is a couple of way the orders are processed. The majority of orders are
received by email and workers of customer care take care of it. Some orders,
especially from new customers or orders with a specific inquiry are forwarded to
department managers to process. The current situation allows promising order
shipment on the same date if the ordered product is on stock and the order arrives
before 11am. Unfortunately a lot of attention is paid to duties that might be performed
automatically. That is for example identification of incoming calls.
The top priority is perfect customer service. The internal motto of the company is
“Customer is the king” and therefore reliability and responsiveness are the most
important attributes.
Lead-times are very important to the company and it is crucial to keep them at least
on current levels. Though the lead-times are important, there are only records of the
entire order cycle but not of the activities that creates the order cycle.
The managing director stated that the internal communication is not good, as the
departments do not communicate with each other. The departments do not know
about problems and obstructions of the other department. There are misinterpretations
during the production due to poor communication. On the other hand there is good
communication with the main supplier and business partners in UK and USA that
benefits from long lasting cooperation and personal relations.
New policy
New policy must contain a clear definition of the work processes related to the daily
operations. Department representative need to define what will be the framework for

89
internal communication in order to increase the productivity and prevent
shortcomings.
Lead-times need to be measured in better detail than it is measured currently so the
lead-times can be shortened.
Interview 2
Position of interviewee: Department manager (manual cleaning)
Company: Typhoon
Date of interview: 31.3.2015
Additional information:
• Plans sourcing for the department
• Plans production for the department
• In charge of inventory management and contracting
Current policy
Currently the production planning is being adjusted to the level of MTS inventory and
incoming inquiries for MTO products. The challenge is to plan the production in a
way the conversion of the machine that takes up to 4 hours will not disrupt the
production. One person reviews inventory level periodically once a week. There is no
duplicity of control, as Sage (EDP program) does not keep the track of material
consumption. Nevertheless, production is often paused or interrupted by orders of
inventory that is not on stock and needs to be manufactured as soon as possible. Then
the machines must be converted to the desired setup and then back to the original
setup again. This is very costly because during the conversion machine generates no
profit.
Production is planned in compliance with the sales records, availability of staff and
capacity utilization of production machines. The ratio between MTO and MTS
products is approximately 30:70 whereas 70% of all products are being sold directly
to the ultimate customer.
There is no common ordering system for the whole company, which is an issue. Each
department orders materials and products only for their own needs. Sourcing of
Typhoon in general is global since regular supplies are sourced from Asia, Europe
and North America.
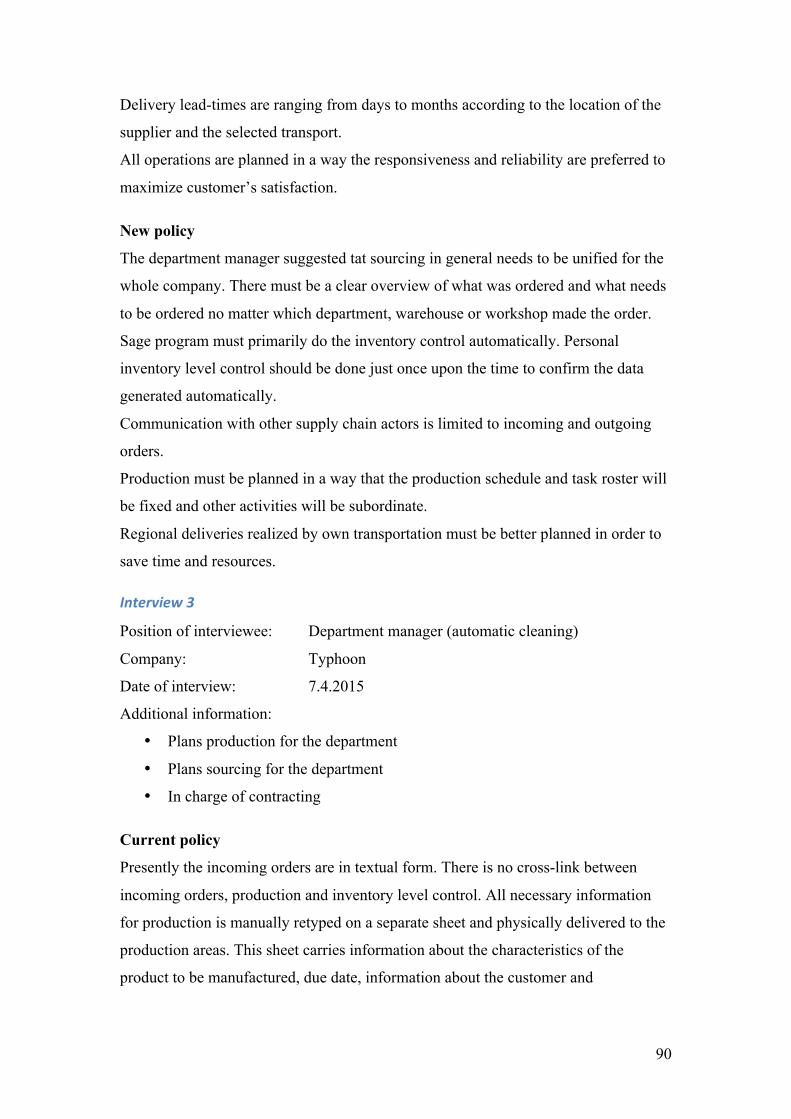
90
Delivery lead-times are ranging from days to months according to the location of the
supplier and the selected transport.
All operations are planned in a way the responsiveness and reliability are preferred to
maximize customer’s satisfaction.
New policy
The department manager suggested tat sourcing in general needs to be unified for the
whole company. There must be a clear overview of what was ordered and what needs
to be ordered no matter which department, warehouse or workshop made the order.
Sage program must primarily do the inventory control automatically. Personal
inventory level control should be done just once upon the time to confirm the data
generated automatically.
Communication with other supply chain actors is limited to incoming and outgoing
orders.
Production must be planned in a way that the production schedule and task roster will
be fixed and other activities will be subordinate.
Regional deliveries realized by own transportation must be better planned in order to
save time and resources.
Interview 3
Position of interviewee: Department manager (automatic cleaning)
Company: Typhoon
Date of interview: 7.4.2015
Additional information:
• Plans production for the department
• Plans sourcing for the department
• In charge of contracting
Current policy
Presently the incoming orders are in textual form. There is no cross-link between
incoming orders, production and inventory level control. All necessary information
for production is manually retyped on a separate sheet and physically delivered to the
production areas. This sheet carries information about the characteristics of the
product to be manufactured, due date, information about the customer and
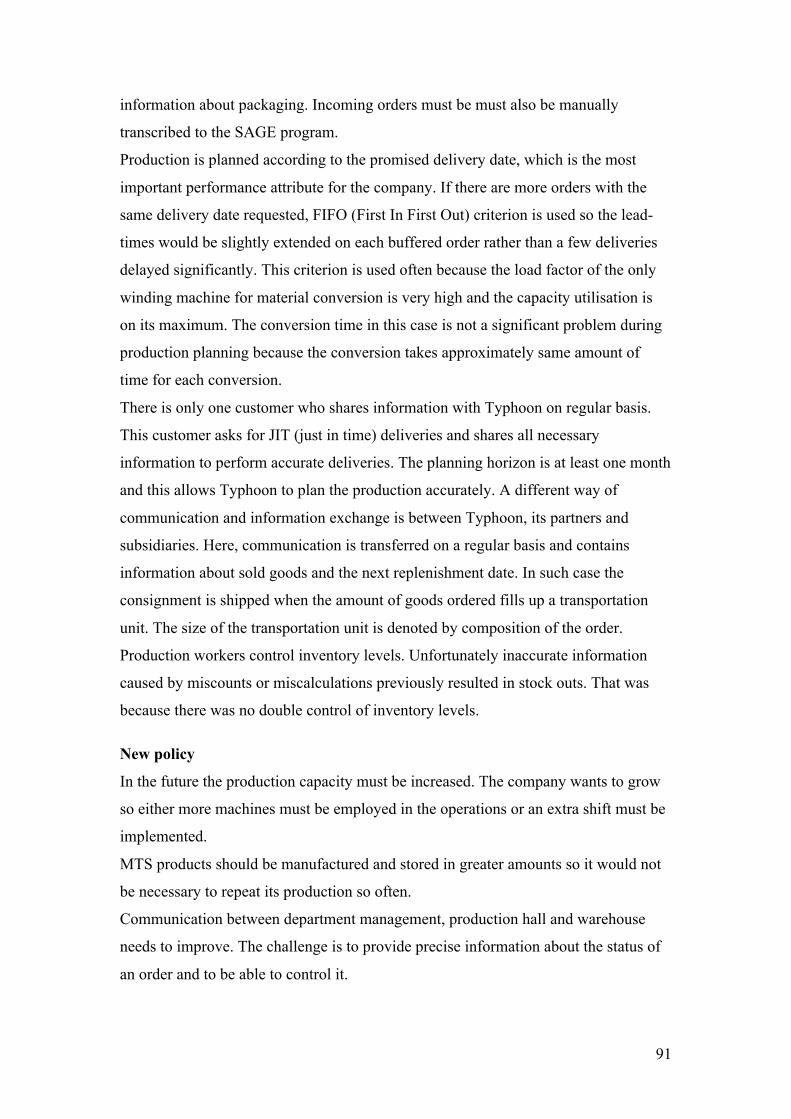
91
information about packaging. Incoming orders must be must also be manually
transcribed to the SAGE program.
Production is planned according to the promised delivery date, which is the most
important performance attribute for the company. If there are more orders with the
same delivery date requested, FIFO (First In First Out) criterion is used so the lead-
times would be slightly extended on each buffered order rather than a few deliveries
delayed significantly. This criterion is used often because the load factor of the only
winding machine for material conversion is very high and the capacity utilisation is
on its maximum. The conversion time in this case is not a significant problem during
production planning because the conversion takes approximately same amount of
time for each conversion.
There is only one customer who shares information with Typhoon on regular basis.
This customer asks for JIT (just in time) deliveries and shares all necessary
information to perform accurate deliveries. The planning horizon is at least one month
and this allows Typhoon to plan the production accurately. A different way of
communication and information exchange is between Typhoon, its partners and
subsidiaries. Here, communication is transferred on a regular basis and contains
information about sold goods and the next replenishment date. In such case the
consignment is shipped when the amount of goods ordered fills up a transportation
unit. The size of the transportation unit is denoted by composition of the order.
Production workers control inventory levels. Unfortunately inaccurate information
caused by miscounts or miscalculations previously resulted in stock outs. That was
because there was no double control of inventory levels.
New policy
In the future the production capacity must be increased. The company wants to grow
so either more machines must be employed in the operations or an extra shift must be
implemented.
MTS products should be manufactured and stored in greater amounts so it would not
be necessary to repeat its production so often.
Communication between department management, production hall and warehouse
needs to improve. The challenge is to provide precise information about the status of
an order and to be able to control it.

92
Interview 4
Position of interviewee: Managing director
Company: CSP
Date of interview: 9.4.2015
Additional information:
• Located in Switzerland
• Plans sourcing from Typhoon HQ
• Plans deliveries addressed to Switzerland
Current policy
CSP is located in Switzerland where all administration and paperwork is originated.
Nevertheless production takes place in Typhoon HQ in Germany. The role of CSP is
to cover the market segment that is out of the span of Typhoon.
Sourcing is adapted to the actual sales. Information about the sales is available to
production planners of Typhoon who consider this information and adjust the
production plans accordingly.
Customers located in Switzerland receive the ordered MTS goods from the warehouse
located in Switzerland. Goods ordered by customers located outside of Switzerland
are dispatched from Typhoon HQ but documentation is generated in Switzerland.
Order promising is dependent on the availability of the product and eventually on the
location of the product. MTO products are shipped from Typhoon HQ only since the
subsidiary in Switzerland is not equipped with production machinery. Order lead-
times of companies located in Switzerland are therefore in general longer than in case
of Typhoon HQ.
CSP has access to the operation system of Typhoon. This makes information
exchange between Typhoon and CSP easier because the information can be
immediately used for planning, production and deliveries.
New policy
Managing director of CSP mentioned, that due to long distances and length of the
MTO order lead-times more information about the order status should be provided.
This information should be then further passed to the customers. Another issue to
work on is forecasting of demand because there is often dwelling inventory in Swiss
warehouses.
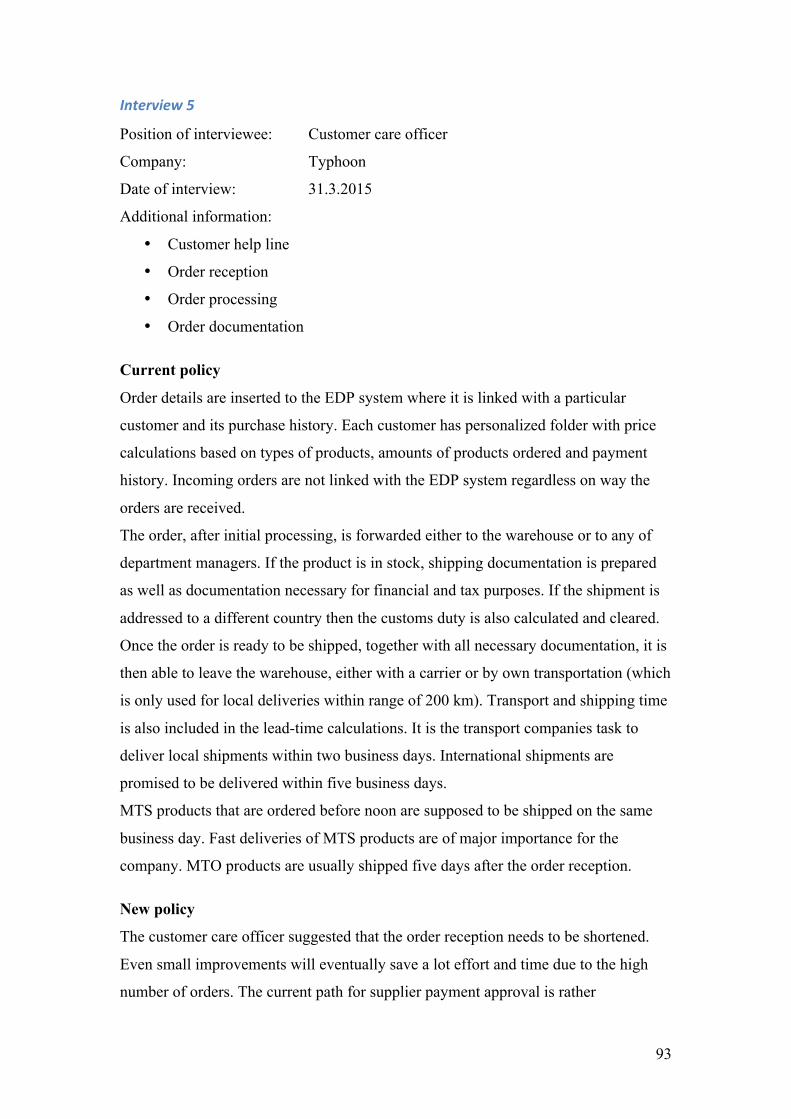
93
Interview 5
Position of interviewee: Customer care officer
Company: Typhoon
Date of interview: 31.3.2015
Additional information:
• Customer help line
• Order reception
• Order processing
• Order documentation
Current policy
Order details are inserted to the EDP system where it is linked with a particular
customer and its purchase history. Each customer has personalized folder with price
calculations based on types of products, amounts of products ordered and payment
history. Incoming orders are not linked with the EDP system regardless on way the
orders are received.
The order, after initial processing, is forwarded either to the warehouse or to any of
department managers. If the product is in stock, shipping documentation is prepared
as well as documentation necessary for financial and tax purposes. If the shipment is
addressed to a different country then the customs duty is also calculated and cleared.
Once the order is ready to be shipped, together with all necessary documentation, it is
then able to leave the warehouse, either with a carrier or by own transportation (which
is only used for local deliveries within range of 200 km). Transport and shipping time
is also included in the lead-time calculations. It is the transport companies task to
deliver local shipments within two business days. International shipments are
promised to be delivered within five business days.
MTS products that are ordered before noon are supposed to be shipped on the same
business day. Fast deliveries of MTS products are of major importance for the
company. MTO products are usually shipped five days after the order reception.
New policy
The customer care officer suggested that the order reception needs to be shortened.
Even small improvements will eventually save a lot effort and time due to the high
number of orders. The current path for supplier payment approval is rather

94
complicated as there are many people involved in the process and if one of them is
busy the whole procedure is delayed by days. It would be more beneficial and less
time consuming if this process was completed electronically.
Interview 6
Position of interviewee: Production officer
Company: Typhoon
Date of interview: 30.3.2015
Additional information:
• Production of MTS and MTO
• Quality control of the production
Current policy
Production is mostly influenced by the size and due date of an order. MTO products
are preferred in production queue. MTS products are manufactured if a gap between
MTO productions occurs. Unfortunately, sometimes it is necessary to interrupt MTS
production and convert the machine for MTO production because that can not be
postponed otherwise it might be late on the promised delivery date.
Inventory necessary for production can be taken from the warehouse without any
special permission. Inventory does not need to be booked for production. The only
record about the material consumption is determined by the outcome of the
production. Though technological material waste generated during machine
conversion is not included in total material consumption.
The inventory levels are controlled either by the manager of manual cleaning
department who plans the replenishment and production or by production workers in
the automatic cleaning production hall.
Department managers plan production of manual and automatic product separately.
New policy
Communication during production planning must be strengthened because resources
are common for the whole company. Moreover, there are only a limited number of
workers and common production planning will make their employment more
effective.
95
Interview 7
Position of interviewee: Warehouse officer
Company: Typhoon
Date of interview: 8.4.2015
Additional information:
• Control of incoming goods
• Responsible for dispatch of shipments by all transport means
• Receives and inspects sourced products and materials
Current policy
Quality, quantity and conditions of incoming shipments are checked at the gate. If the
shipment is not damaged and the delivered products are in alignment with provided
documentation then the products are immediately stored in the warehouse on
dedicated lots. The office is afterwards informed about the order reception and its
details.
Outbound shipments are dispatched from two different stations according to the size
of the shipment and required handling. Special attention is paid to airfreight that
demands special handling by certified employees only. Such shipments are stored in
special lots that are locked and under permanent video surveillance. This certified
safety procedure allows shipments to be accepted directly to air transportation without
security checks that would prolong the lead-times.
Duration of transportation is taken into account by order reception and order
processing and customers are informed about the speed of the particular mode of
transport.
For single shipments there are two long-term contract carriers. Both carriers provide
their own software to Typhoon that helps to treat the record and handle the
information about all shipments. Other carriers that are not serving the company on
daily basis are contracted for one time only due to price fluctuations (container
shipments and air freight). Deliveries in local region are secured by own
transportation.
A list of shipments is delivered on hard copy to the warehouse together with bills of
lading.
Nevertheless, in effort to dispatch late received orders as soon as possible, shipment
details between customer care employees and warehouse employees are

96
communicated via telephone. In such case the documentation is not ready yet but the
product is being prepared according to verbal description in advance despite missing
hard copy of order specifications and documentation, which often tends to end up in
misinterpretation of information.
New policy
Warehouse officer pointed out, that communication between offices and warehouse
must be improved. Information about orders and their status need to be available to all
concerned persons at all time throughout the order cycle.

97
Appendix 6 – Focus group The focus group met 9.4.2015 at Typhoon’s HQ. The list of participants is presented
in Table 0-6. Each participant was selected based on its position and span of control
over order cycle processes. Nr. 1 is in the lead of Typhoon HQ and co-leader of
Typhoon’s business partners and subsidiaries. Therefore his contribution is the insight
into the operation of all Typhoon’s businesses. Nr. 2 and nr. 3 are both department
managers (manual cleaning department and automatic cleaning department) of
Typhoon HQ and have knowledge about planning, sourcing, production and
contracting new customers. Member nr. 4 manages CSP and its contribution is
knowledge about the part of the order cycle that does not take place in Typhoon HQ.
Member nr.5 is an IT expert with insight to the current possibilities and use of EDP
system. His participation helps to find out what is the role of the current setup of EDP
in order cycle and communication. Nr. 6 is in direct contact with customers and its
input to the focus group helps to understand the character of task necessary to conduct
in order to meet customer requirements. Finally, nr.7 is in charge of internal
communication between departments and employees as well as in charge of external
communication between Typhoon HQ and its suppliers, customers, potential
customers and other SC actors. The focus group composition was selected so as to
cover all aspects and issues of order cycle. The disadvantage of this composition is
absence of production and warehouse officers, but due to their workload they could
not take part in this focus group.
The topics raised during the meeting were derived from the answers obtained during
the individual interviews. The duration of the meeting was 80 minutes and obtained
information was used to form the results.
Nr. Position/Function Company Duration 1 Managing director Typhoon 2 Department manager (Manual cleaning) Typhoon 3 Department manager (Automatic cleaning) Typhoon 4 Managing director CSP 5 IT & EDP administrator Typhoon 6 Customer care representative Typhoon 7 Marketing manager Typhoon
80 minutes
Table 0-6 Focus group members

98
Appendix 7 - Recommendation Figure 0.6 displays modules of ERP system presented by Fawcet et al.(2007). This
ERP system fits the operations of Typhoon and meets the terms of SCOR model. The
only module that is not beneficial for Typhoon is Engineering as this is not part of
Typhoons business. This figure is associated with section 5.2 and serves as ERP
components overview.
Figure 0.6 ERP system components (adopted from Fawcet, Ellram, & Ogden, 2007)