Embed Size (px)
Citation preview

Customer : Contract No : WP No :
ESRIN 4000109848/13/I-NB 50
Document Ref :
Issue Date :
Issue :
SST_CCI-PVIR-UOL-201
14 December 2015
1
Project : SST_CCI-Phase II
Title : SST CCI Product Validation and Intercomparison Report
Abstract : This document summarises the validation of the EXP1.2 experimental SST data produced and used by the ESA SST_CCI project.
Author : Gary Corlett University of Leicester
Checked : Ruth Wilson
Project Manager Space Connexions Limited
Accepted : Craig Donlon ESA
Distribution : SST_cci team members
Craig Donlon (ESA)
EUROPEAN SPACE AGENCY CONTRACT REPORT
The work described in this report was done under ESA contract. Responsibility for the contents resides in the author or organisation
that prepared it.
SST_CCI-Phase II SST_CCI-PVIR-UOL-201
SST CCI Product Validation and Intercomparison Report Issue 1
Page 2
AMENDMENT RECORD
This document shall be amended by releasing a new edition of the document in its entirety. The Amendment Record Sheet below records the history and issue status of this document.
AMENDMENT RECORD SHEET
ISSUE DATE REASON FOR CHANGE
Draft B 16 September 2015 First issue (draft) for internal comment
Draft C 6 November 2015 Updated following comments from project team
Issue 1 14 December 2015 Issued to ESA
RECORD OF CHANGES IN THIS ISSUE
Issue Page/Sec. Reason Change

SST_CCI-Phase II SST_CCI-PVIR-UOL-201
SST CCI Product Validation and Intercomparison Report Issue 1
Page 3
TABLE OF CONTENTS
1. INTRODUCTION ...................................................................................................................... 4 1.1 Purpose and scope ............................................................................................................. 4 1.2 References .......................................................................................................................... 4 1.3 Acronyms ............................................................................................................................ 7 1.4 Document structure ............................................................................................................. 7 2. EXECUTIVE SUMMARY ......................................................................................................... 9 3. DEFINITIONS ........................................................................................................................ 10 4. SUMMARY OF ACTIVITIES .................................................................................................. 12 4.1 Multi-sensor match-up database ....................................................................................... 12 4.2 ESA SST_CCI Products .................................................................................................... 13 4.3 Uncertainties ..................................................................................................................... 13 4.4 Independence of validation activities ................................................................................. 14 4.5 Endorsements ................................................................................................................... 14 4.6 Release of Products .......................................................................................................... 14 5. PRODUCT VALIDATION....................................................................................................... 15 5.1 Introduction........................................................................................................................ 15 5.2 Reference dataset ............................................................................................................. 16 5.3 Uncertainty validation ........................................................................................................ 19 6. VALIDATION RESULTS........................................................................................................ 21 6.1 Mission level ...................................................................................................................... 21 6.2 Sensor level....................................................................................................................... 24 7. STABILITY ASSESSMENT ................................................................................................... 37 7.1 Methodology ...................................................................................................................... 38 7.2 Results .............................................................................................................................. 39

SST_CCI-Phase II SST_CCI-PVIR-UOL-201
SST CCI Product Validation and Intercomparison Report Issue 1
Page 4
1. INTRODUCTION
The ESA SST_CCI project is part of the European Space Agency (ESA) Climate Change Initiative (CCI), and aims to produce and validate Sea Surface Temperature (SST) products, produced by combining retrievals of SST from different satellite sensors, which will contribute to the SST essential climate variable (ECV).
The ESA CCI programme has now entered its second phase (referred to hereafter as P-II) and the ESA SST_CCI project has started reprocessing data produced in the first phase (referred to hereafter as P-I). A key objective of each and every reprocessing is continual validation, intercomparison and climate assessment of all products. In P-II, product validation is independent in that (1) the validation is undertaken by personnel that are independent of the algorithm development team, and (2) fully independent in-situ validation data have been used as much as possible.
The 1st reprocessing of P-II is an experimental release of data, referred to hereafter as
EXP1.2, as the main aim of this first P-II reprocessing was to implement the main production chain, together with automated generation of validation, Intercomparison and climate assessment reports, at the Climate, Environment and Monitoring from Space (CEMS) facility at Harwell, UK. In P-I, production and data serving were, by necessity, distributed across four locations. The subsequent creation of the CEMS facility offers a more sustainable, integrated solution. EXP1.2 therefore relates to the first full run after porting production.
1.1 Purpose and scope
This document details product validation of the EXP1.2 reprocessing of the ESA SST_CCI Long-Term (LT) products. Two products are assessed, namely L2P format data from (1) the ATSR at ~1-km gridded resolution and (2) the AVHRR, at ~4-km Global Area Coverage (GAC) resolution, series of instruments. There is no LT analysis (“level 4”) product available for the EXP1.2 release as the integration of the analysis system onto CEMS is still ongoing (as planned).
The document is made up of a main body and several appendices. Most of the images in the main body of the document (in particular those in Section 6 and Section 7) were generated automatically and populated into a MS Word Template provided by Space ConneXions Limited (SCL) using a Python script and the python-docx library. The accompanying text and interpretation of results were added afterwards. All of the appendices were generated by a Python script, including the text; this is a new capability created so that future increment reprocessing runs can be rapidly assessed and compared for the impact of algorithm modifications.
1.2 References
The following documents are referenced in this document:
SST_CCI-Phase II SST_CCI-PVIR-UOL-201
SST CCI Product Validation and Intercomparison Report Issue 1
Page 5
Table 1-1: Reference Documents
ID Title
RD.150 Systematic Observation Requirements for Satellite-based Products for Cli-mate: Supplemental Details to the satellite-based component of the “Imple-mentation Plan for the Global Observing System for Climate in support of the UNFCCC (GCOS-92)”, GCOS-107, September 2006 (WMO/TD No.1338)
RD.191 Bureau International des Poids et Mesures, Guide to the Expression of Un-certainty in Measurement (GUM), JCGM 100:2008, 2008. Available online at http://www.bipm.org/en/publications/guides/gum.html
RD.380 SST_CCI Climate Assessment Report (CAR), SST_CCI-CAR-UKMO-201
RD.382 SST_CCI Data Access Requirements Document (DARD), SST_CCI-DARD-UOL-201
RD.375 SST_cci Phase-II MMS Implementation Plan v1-u2
RD.376 SST_CCI Phase-II Multi-sensor Match-up Dataset Specification, SST_CCI-TN-UoL-201
RD.383 SST_CCI Product Specification Document (PSD), SST_CCI-PSD-UKMO-201
RD.384 SST CCI Uncertainty Characterisation Report (UCR), SST_CCI-UCR-UOR-201
RD.173 SST_CCI Product Validation Plan, SST_CCI-PVP-UoL-001
RD.369 ESA Climate Change Initiative Phase 2 Statement of Work, prepared by ESA Climate Office, Ref. CCI-PRGM-EOPS-SW-12-0012, Issue 1, Revision 2, June 7th, 2013
RD.184 Embury, O., C. J. Merchant and G. K. Corlett (2012), A Reprocessing for Climate of Sea Surface Temperature from the Along-Track Scanning Radi-ometers: Initial validation, accounting for skin and diurnal variability, Rem. Sens. Env., pp62 - 78. DOI:10.1016/j.rse.2011.02.028
RD.273 Merchant C J, Algorithm Theoretical Basis Document 0, 2012, SST-CCI-ATBDv0-UOE-004-Issue 1 (Accept-Signed).pdf
RD.377 Donlon., C. J., P. J. Minnett, C. Gentemann, T. J. Nightingale, I. J. Barton, B. Ward, and M. J. Murray, 2002: Toward Improved Validation of Satellite Sea Surface Skin Temperature Measurements for Climate Research. J. Climate, 15, 353–369.
RD.378 Atkinson, C.P., N.A. Rayner, J.J. Kennedy, S.A. Good, 2014: An Integrated Database of Ocean Temperature and Salinity Observations. JGR-Oceans, 119, 7139-7163, doi:10.1002/2014JC010053.
RD.379 Donlon, C.J., Minnett, P.J., Jessup, A., Barton, I., Emery, W., Hook, S., Wimmer, W., Nightingale, T.J., Zappa, C (2014). Ship-borne thermal infrared radiometer systems. Experimental Methods in the Physical Sciences, 47, pp. 305-404, doi:10.1016/B978-0-12-417011-7.00011-8
RD.050 Barton, I.J., Minnett, P.J., Maillet, K.A., Donlon, C.J., Hook, S.J., Jessup, A.T., Nightingale, T.J., (2004). The Miami2001 Infrared Radiometer Calibra-tion and Intercomparison. Part II: Shipboard Results, Journal of Atmospheric and Oceanic Technology, 21, 268-283.
RD.355 Oka, E. and Ando, K. (2004). Stability of Temperature and Conductivity Sen-sors of Argo Profiling Floats. Journal of Oceanography, 60, 2, 253-258.
SST_CCI-Phase II SST_CCI-PVIR-UOL-201
SST CCI Product Validation and Intercomparison Report Issue 1
Page 6
ID Title
RD.243 Kennedy, J.J., R.O. Smith and N.A. Rayner, 2012: Using AATSR data to as-sess the quality of in situ sea-surface temperature observations for climate studies, Remote Sensing of the Environment, 116, 79-92.
RD.246 O’Carroll, A.G., J.R. Eyre and R.W. Saunders, 2008: Three-way error analy-sis between AATSR, AMSR-E, and in situ sea surface temperature observa-tions, J. Atmos. Ocean. Tech., 25, 1197-1207, doi: 10.1175/2007JTECHO542.1
RD.339 Ohring, G., Wielicki, B., Spencer, R., Emery, B. & Datla, R. (2005). Satellite Instrument Calibration for Measuring Global Climate Change: Report of a Workshop. Bulletin of the American Meteorological Society, 86, 1303-1313
RD.296 Merchant, C. J., O. Embury, N. A. Rayner, D. I. Berry, G. Corlett, K. Lean, K. L. Veal, E. C. Kent, D. Llewellyn-Jones, J. J. Remedios, and R. Saunders (2012), A twenty-year independent record of sea surface temperature for cli-mate from Along Track Scanning Radiometers, J. Geophys. Res., 117, C12013, doi:10.1029/2012JC008400.
RD.337 Wimmer, W., Robinson, I. S. & Donlon, C. J. (2012). Long-term validation of AATSR SST data products using shipborne radiometry in the Bay of Biscay and English Channel. Remote Sensing of Environment, 116, 17-31.
RD.338 Minnett, P. J. & Corlett, G. K. (2012). A pathway to generating Climate Data Records of sea-surface temperature from satellite measurements. Deep Sea Research Part II: Topical Studies in Oceanography, 77–80, 44-51.
RD.317 Merchant, C. J., Mittaz, J. and Corlett, G. K. (2014), Climate data evaluation framework, GHRSST document reference CDR-TAG_CDEF/Version 1.5

SST_CCI-Phase II SST_CCI-PVIR-UOL-201
SST CCI Product Validation and Intercomparison Report Issue 1
Page 7
1.3 Acronyms
The following SST-specific acronyms are used in this report:
Table 1-2: Acronyms
Acronym Definition
ATSR Along-Track Scanning Radiometer
AVHRR Advanced Very High Resolution Radiometer
CCI Climate Change Initiative
CDR Climate Data Record
ECV Essential Climate Variable
ESA European Space Agency
GDS GHRSST Data Processing Specification
GHRSST Group for High-Resolution SST
GMPE GHRSST Multi Product Ensemble
GTMBA Global Tropical Moored Buoy Array
ICOADS International Comprehensive Ocean-Atmosphere Data Set
L2P Level 2 Pre-processed data
L3U Level 3 Uncollated data
L4 Level 4 data
PI Principal Investigator
PIRATA Prediction and Research Moored Array in the Atlantic
RAMA Research Moored Array for Monsoon Analysis and Prediction
SST Sea Surface Temperature
TAO/TRITON Tropical Atmosphere Ocean/Triangle Trans-Ocean Buoy Network project
1.4 Document structure
The remainder of this document has the structure summarised below.
Section 2 Executive Summary
Section 3 Definitions of key terms used throughout this document
Section 4 An overview of all validation, intercomparison and climate assessment activities
Section 5 An overview of validation activities

SST_CCI-Phase II SST_CCI-PVIR-UOL-201
SST CCI Product Validation and Intercomparison Report Issue 1
Page 8
Section 6 Key results from the product validation
Section 7 An overview of the stability assessment
Appendix A Detailed validation results compared to drifters
Appendix B Detailed validation results compared to the GTMBA
Appendix C Detailed validation results compared to Argo floats
Appendix D Detailed validation results compared to ship-borne radiometers
SST_CCI-Phase II SST_CCI-PVIR-UOL-201
SST CCI Product Validation and Intercomparison Report Issue 1
Page 9
2. EXECUTIVE SUMMARY
Two ESA SST_CCI Long-Term version EXP1.2 products from the 1st reprocessing of
Phase-II have been validated using reference data from drifting buoys, the GTMBA, Argo floats and ship-borne radiometers.
The two products validated were:
1. ATSR: The LT record of SST from the ATSR series from 1991 through 2012 in L2P format at ~1 km resolution, and
2. AVHRR: The LT record of SST from the AVHRR series from 1991 through 2013 in L2P format at GAC (~4 km) resolution.
A unique aspect of the validation process in Phase-II, compared to Phase-I, is the automatic generation of results in MS Word format to facilitate their interpretation. Key figures contained within this main document in Section 6.1 and Section 7, as well as the complete set of appendices, were generated automatically.
No adjustments have been made to account for expected difference in depth and time between the satellite and reference measurements, as the main aims of this EXP1.2 validation was to assess results of the first reprocessing using a production system inte-grated at CEMS and to demonstrate the automatic validation procedures. These addi-tional adjustments will be applied in future releases of the PVIR.
As part of the routine product validation, the stability of each time series relative to the GTMBA was assessed using the method described in the GHRSST CDAF, and is re-ported here (and not in the CAR, which was the case in Phase I).
The following conclusions are drawn from the results presented throughout this docu-ment:
Both the ATSR and AVHRR EXP1.2 products are improved compared to their Phase I release versions (v1.1 and v1.0, respectively).
Tighter 95% confidence limits on stability are calculated although there is differ-ence in the sign of the residual trends between the ATSR and AVHRR products.
Both the ATSR and AVHRR products show improved consistency between day and night bias results.
Results for individual AVHRR sensors are clustered according to local overpass time.
The following recommendation is made:
The addition of night time 2-channel retrievals to the products for all sensors at all times would facilitate the interpretation of validation results.

SST_CCI-Phase II SST_CCI-PVIR-UOL-201
SST CCI Product Validation and Intercomparison Report Issue 1
Page 10
3. DEFINITIONS
The following definitions are used throughout this document:
Error: result of a measurement minus a true value of the measurand. Generally, the “true” value of the error is not known.
Uncertainty: Is a parameter, associated with the result of a measurement that character-
ises the dispersion of the values that could reasonably be attributed to the measurand (given the measurement, in the light of our understanding of the sources of error in the measurement). Here, the parameter is the standard deviation of the dispersion, which is a confidence of 68% or (k=1).
Discrepancy: The difference between the result and the validation value.
(Relative) Bias: The mean value of the discrepancy.
Accuracy: For the term “accuracy” there seems to be two definitions in common circula-
tion. In RD.150, the Global Climate Observing System (GCOS) considers accuracy to be measured by “the bias or systematic error of the data, i.e., the difference between the short-term average measured value of a variable and the truth” where the average re-ferred to has been sufficient to render the random uncertainty in the measured value neg-ligible. In contrast, the definition from the Guide to Uncertainty of Measurement (GUM; RD.191) is also used, whereby accuracy is “the closeness of agreement between the re-sult of a measurement and a true value of a measurand” and therefore a measurement can be inaccurate either by virtue of a large systematic error or because it has a large random uncertainty. We find it useful to have a term available that distinguishes system-atic and random uncertainty, and therefore in SST_CCI documents accuracy refers to the estimated magnitude of the systematic error (true bias).
Precision: The difference between one result and the mean of several results obtained by the same method, i.e. reproducibility (includes non-systematic errors only).
Calibration: The process of quantitatively defining the system response to known, con-
trolled system inputs.
Validation: The process of assessing by independent means the quality of the data prod-ucts (the results) derived from the system outputs.
Skin Sea Surface Temperature (SSTskin): The temperature measured by an infrared ra-
diometer typically operating at wavelengths 3.7-12 µm (chosen for consistency with the majority of infrared satellite measurements) that represents the temperature within the conductive diffusion-dominated sub-layer at a depth of ~10-20 µm.
Sub-Skin Sea Surface Temperature (SSTsubskin): The subskin temperature represents the temperature at the base of the conductive laminar sub-layer of the ocean surface.

SST_CCI-Phase II SST_CCI-PVIR-UOL-201
SST CCI Product Validation and Intercomparison Report Issue 1
Page 11
Depth Sea Surface Temperature (SST-depth): Measurements of water temperature be-
neath the SSTsubskin, measured using a wide variety of platforms and sensors such as drifting buoys, vertical profiling floats, or deep thermistor chains at depths ranging from
102 - 10
3 m. Here, the depth will usually be that associated with a drifting buoy (of order
20 cm) or a moored buoy (of order 1 m).
This document is written on the basis of these definitions.

SST_CCI-Phase II SST_CCI-PVIR-UOL-201
SST CCI Product Validation and Intercomparison Report Issue 1
Page 12
4. SUMMARY OF ACTIVITIES
The activities described in this document cover:
Validation of ESA SST_CCI ATSR and AVHRR EXP1.2 products, which was performed using independent high-quality SST measurements made in-situ from a number of sources
The plan for these activities ensures rigour at all points, including independence of algo-rithm development from validation/assessment for both data and people. It is inevitably rather complex, given several activities and multiple satellite and in-situ data streams. A summary of the process of entire algorithm development, product validation, intercom-parison and climate assessment is shown schematically in Figure 4-1.
Figure 4-1: Flowchart indicating logical flow of algorithm development, product validation inter-comparison and climate assessment for the SST_CCI project. Activities and data sets specified in this document are in dark-grey boxes. The top box represents the multi-sensor match-up system which is a key source for data throughout. The arrows down from it represent the extraction of distinct subsets of data used for the activities that follow as indicated in the remainder of the diagram. The intercomparison activities within the GMPE were not carried out for the EXP1.2 reprocessing as no analysis product was available.
The process starts (top of figure) with the generation of the multi-sensor matchup data-base, which was the source of data used for both algorithm development and product validation (Section 4.1). The EXP1.2 products will undergo a climate assessment as summarised in the EXP1.2 Climate Assessment Report (CAR; RD.380). We will also be releasing a subset of the reference data used for validation as the ESA SST_CCI Inde-pendent Reference Dataset (SIRDS) after the third reprocessing run of P-II.
4.1 Multi-sensor match-up database
A Multi-sensor Match-up Dataset (MMD) is a set of temporal and spatial coincidences be-tween multiple satellite datasets of both brightness temperatures and SST retrievals and

SST_CCI-Phase II SST_CCI-PVIR-UOL-201
SST CCI Product Validation and Intercomparison Report Issue 1
Page 13
time series of SST from in-situ sensors. For the SST_CCI project we have pre-matched all required reference data to the set of satellite datasets required for the two different categories of output products (see Section 4.2).
The in-situ data comprises data from drifting buoys, the Global Tropical Moored Buoy Ar-ray (GTMBA), Argo floats and ship-borne radiometers. Further details on each in-situ data type can be found in Section 5.2 and details on the source, coverage and availability of all datasets used within the SST_CCI project are given in the SST_CCI P-II Data Access Requirements Document (DARD; RD.382).
The selected algorithms in P-II have not undergone a new round-robin selection process and so, unlike in P-I, no segregation of data has been done in P-II. A set of MMD files have been generated for a variety of applications in P-II, which include satellite-to-satellite match-ups as well as satellite to the reference dataset. A list of all available MMD files and their purpose is given in RD 375 and their content is described in RD 376.
4.2 ESA SST_CCI Products
The products in the ESA SST_CCI EXP1.2 release are reprocessings of the LT ECV products generated in P-I, where the priorities are for a long, stable climate record formed from two series of sensors. Further details on the content and format of each product are given in the Product Specification Document (PSD; RD.383).
In total there are 10 products validated and evaluated in this report, the LT ATSR L2P
(three sensors) and AVHRR L2P (seven sensors) (Table 4-1).
Table 4-1: Summary of ESA SST_CCI EXP1.2 products
Category of product and description
Satellite sensors & data to be used
Long term ECV
A long term, stable data record formed from data
from the ATSR and AVHRR series of instru-ments. Will cover the pe-
riod Aug 1991 to Dec 2010.
ATSR series (ATSR-1, ATSR-2, AATSR); Envisat
format
L2P (~1 km)
AVHRR series global area coverage (GAC) data
L2P (variable, ~4 km at centre of swath)
The EXP1.2 release also includes L3U ATSR data but this has not been independently validated as instead we have validated the L2P on which it is based.
4.3 Uncertainties
A key development within the SST_CCI project is the provision of enhanced uncertainty information for each pixel or cell in every SST_CCI product. The enhanced uncertainty in-formation will include estimates of uncertainty components that are uncorrelated between observations, correlated on synoptic spatio-temporal scales, and correlated on large scales. This facilitates a more realistic propagation of uncertainty from L2/L3 products to derivative products with coarser averaging. Details of the approach are available in the SST_CCI Uncertainty Characterisation Report (UCR; RD.384). As the uncertainty infor-

SST_CCI-Phase II SST_CCI-PVIR-UOL-201
SST CCI Product Validation and Intercomparison Report Issue 1
Page 14
mation attached to SSTs constitutes part of the product it must be validated in its own right. Details of the uncertainty validation are included in Section 5.3.
4.4 Independence of validation activities
It is important to note that the project has been scoped such that nearly all personnel in-volved with algorithm selection were not involved in product validation, inter-comparison or the climate assessment, and vice versa. A summary of key personnel and their roles in the project relating to implementation, validation and assessment of the EXP1.2 SST_CCI products is given in Table 4-2.
Table 4-2: Summary of personnel and their roles in SST_CCI product implementa-tion, validation and assessment
Personnel Algorithm
Development Product Validation
Climate
Assessment
Merchant and team (UoR)
Corlett (UoL)
Rayner and team (MOHC)
4.5 Endorsements
This document has been written using the knowledge and experience of the SST_CCI project team, and on the basis of the best available methods and approaches from the scientific literature. In P-I we sought endorsement of our methods through external peer review of the PVP (RD.173). Within the CCI programme the PVP was reviewed by the CCI Climate Modelling Users Group (CMUG) and by external review outside of the CCI programme by the GHRSST Satellite SST Validation Technical Advisory Group (ST-VAL). A subset of PVP (RD.173) metrics has subsequently been adopted by the GHRSST Cli-mate Data Record Validation Technical Advisory Group (CDR-TAG) for the Climate Data Assessment Framework (CDAF).
4.6 Release of Products
The SST_CCI products shall be openly released (subject to any CCI data policy) as soon as this document (the PVIR) and the CAR (RD.380) are accepted by ESA.
In all cases, we encourage users to exploit the uncertainty information provided within the SST_CCI products and their assessment provided within this report
for their particular data application.

SST_CCI-Phase II SST_CCI-PVIR-UOL-201
SST CCI Product Validation and Intercomparison Report Issue 1
Page 15
5. PRODUCT VALIDATION
The ESA SST_CCI EXP1.2 products have been validated against validation data that are fully independent comprising Argo floats, the GTMBA, ship-borne radiometers (see Sec-tion 5.2 for further details of each dataset). Uncertainties in the ESA SST_CCI EXP1.2 products have been taken account of, along with known uncertainties in the independent reference data.
A key requirement in the Statement of Work (SoW; RD.369) was for the final product and user assessment to be done by science team members who are not involved in the ECV production. Consequently, key staff from the lead groups involved in the validation and user assessment have had no involvement in algorithm development and selection, achieving the independence required (as summarised in Section 0).
5.1 Introduction
5.1.1 Definitions
We have adopted the CEOS definitions of validation and verification. Validation is de-fined by CEOS as the process of assessing, by independent means, the quality of the data products derived from the system outputs, and assess the fitness-for-purpose of the data products. Verification is defined by CEOS as the provision of objective evi-dence that a given data product fulfils specified requirements.
A list of the key definitions is provided in Section 2.
5.1.2 Reference data
The product validation uses reference data set constituting drifting buoys, the GTMBA, Argo floats and ship-borne radiometers. Details of the reference dataset for ESA SST_CCI EXP1.2 product validation and its quality control procedures are given in Sec-tion 5.2.
5.1.3 Rules and responsibilities for objective independent product validation
To ensure objective independent validation the following rules were adopted within the project:
The overall validation was led by UoL (Corlett)
MOHC (Rayner and team) provided the reference dataset
No other team members participated in product validation aside from the development of tools (Brockmann Consult)

SST_CCI-Phase II SST_CCI-PVIR-UOL-201
SST CCI Product Validation and Intercomparison Report Issue 1
Page 16
5.1.4 Validation criteria
The ideal scenario for validation is for the reference measurement to be taken precisely at the time of the satellite overpass. Within the ESA SST_CCI project we have adopted limits such that the reference data are ideally within the satellite pixel within 4 hours of the satellite overpass as a minimum criterion. These limits are based on the current best estimates from the literature for the temporal resolution for SSTskin validation as demon-strated by Embury et al., 2012 (RD.184) and the need to validate the uncertainty on a single satellite pixel for the spatial resolution. In addition to single pixel validation we also use a 5 x 5 pixel average of the satellite SST centred on the reference measure-ment location. In principle, we should see little, if any, difference in the results as the re-trieval algorithm uses a form of atmospheric correction smoothing to reduce the impact of radiometric noise on the retrieved SST (see the Algorithm Theoretical Basis Docu-ment, ATBD; RD.273).
5.1.5 Depth/time adjustments
To minimise uncertainties due to temporal matching of a combined diurnal/skin-effect model it is desirable to adjust the depth and time of the reference measurement to that of the satellite measurement. In the mean, this will reduce the uncertainty to << 0.1 K for a statistically significant sample. For this first experimental reprocessing we have not yet applied any additional adjustments and instead will rely on expected skin-depth differ-ences (e.g. see Donlon et al., 2002; RD.377) to aid our interpretation of the results.
5.1.6 Analysis procedures
All ESA SST_CCI EXP1.2 products have been validated using both independent and pseudo independent validation data, detailed in Section 5.2, noting the degree of inde-pendence detailed in Table 5-1. Discrepancies and uncertainties were derived using ro-bust and non-robust statistical methods for each type of reference data, and where suf-ficient match-ups allow a non-linear least square fit of a standard Gaussian probability distribution function. Uncertainties are provided for a confidence level of 68% (the “one-sigma” level). All validation was done using the total uncertainty as there are no uncer-tainty budgets for any of the reference data to allow a more detailed breakdown of the uncertainties. Time series of discrepancies and uncertainties are provided for each ESA SST_CCI dataset, as well as any dependence on auxiliary data in the MMD (e.g. wind speed, total column water vapour and solar zenith angle). In addition, spatial variations are plotted for day and night at 2 x 2 degree global resolution and time/longitude Hovmoller plots are also plotted. The fitted Gaussians and the resulting statistics are plotted as well as validation of the product uncertainties.
5.2 Reference dataset
5.2.1 Introduction
Validation is the “assessment by independent means of the quality and fitness for pur-pose” of the ESA SST_CCI products. This means, amongst other things, that the refer-ence data should be independent of the ESA SST_CCI products, where possible. Where this is not possible, the following hierarchy of possible reference data will be adopted:

SST_CCI-Phase II SST_CCI-PVIR-UOL-201
SST CCI Product Validation and Intercomparison Report Issue 1
Page 17
1. Independent in-situ data
2. Other in-situ data
3. Large scale comparisons with other satellite data
4. Large scale comparisons with historic data sets and/or climatologies
This section defines the reference data set to be used for validation of the ESA SST_CCI products, giving an overview of the data and an assessment of their quality, followed by an explanation of the rationale behind the choice of reference data.
When considering possible reference sources, consideration must be given to the na-ture of the SST being assessed. For satellite SST retrievals produced from infrared ra-diances, the SST is equivalent to the temperature at a depth of ~10 µm and is referred to as the skin SST; for satellite SSTs produced from microwave radiances, the SST is equivalent to the temperature at a depth of >100 µm and is a weighted average of the temperatures through the skin layer and into the sub-skin region beneath. The deviation between skin and sub-skin reduces to a mean bias of -0.17 K when the surface wind speed is > ~6 ms
-1, and so surface wind speed data is an essential component of any
reference data set for satellite SST uncertainty determination and is provided in the MMD.
Ideally, the reference source for assessing the quality of the satellite data should be a measurement at a depth that is as close as possible to that provided by the satellite. In-deed, where possible, it should be the same as that provided by the satellite, which is currently achievable for infrared sensors using ship-borne radiometers, and potentially for microwave sensors using aircraft mounted radiometers (see for example http://www.prosensing.com/Hurricane%20Wind%20Speed%20Radiometer.htm as used by the NOAA National Hurricane Centre).
The current reference data set used by GHRSST is that provided by surface drifting buoys. Although the uncertainty of this dataset is not traceable to the SI temperature standard, it has been chosen due to its significantly improved global coverage compared to other potential reference datasets. Other potential reference data include ship-based radiometers, moored buoys, and conventional ship measurements from engine room in-takes or hull-mounted sensors; the GTMBA is usually considered separately from other moored buoys because they are in the open ocean and far from the coastal regions which often present particular difficulties for the accurate measurements of SST from space, and where most other moored buoys are deployed.
5.2.2 Overview of data sources
Each reference data source is detailed in turn, with an assessment of their quality, sourced either from the literature or unpublished analysis by the project’s Climate Re-search team.
Much of the P-II reference data is extracted from HadIOD.1.0.0.0 (Atkinson et al., 2014; RD.378). HadIOD is the Met Office Hadley Centre Integrated Ocean Database, which brings together ocean temperature and salinity observations made by surface and sub-surface-profiling instruments. The current source data for HadIOD is ICOADS for sur-face observations and EN4 for profile observations. HadIOD includes quality flags and, where possible, assigns bias corrections and uncertainty estimates for different instru-ment types. Reference data currently cover 1981-2014 and include observations from drifters, voluntary observing ships, bottles, CTDs, MBTs, XBTs, Argo floats and instru-

SST_CCI-Phase II SST_CCI-PVIR-UOL-201
SST CCI Product Validation and Intercomparison Report Issue 1
Page 18
mented-animals; only drifters and Argo floats were used for the ESA SST_CCI EXP1.2 product validation.
The ship and drifting buoy data in HadIOD are from ICOADS release 2.5.1 supple-mented with Met Office Hadley Centre QC flags. The QC flags have been produced by the HadISST2 QC system which includes plausibility checks, a positional track check, and climatology and buddy checks. The HadISST2 QC flags have been supplemented as follows: (1) Drifter SST observations from ICOADS deck 715 are blacklisted; (2) A ‘tracking-QC’ flag is set for drifter and ship observations generated by tracking the qual-ity of SST observations made by individual platforms over time using OSTIA as a refer-ence (currently 1986-2010, will be extended to 1986-2014 as part of phase 2). This is used to detect biases/instrument failures etc.
The profile data in HadIOD are from the Met Office Hadley Centre ENsembles dataset version 4 (EN4), which provides quality controlled subsurface ocean temperature and salinity profiles and objective analyses. The shallowest temperature observations pass-ing EN4 quality control in depth range 3-5m are extracted for the profiling instrument types listed above.
The reference data include a set of bias corrections for ships and XBTs/MBTs. These help to remove spurious drifts in the data over time associated with systematic changes in the observing system. Bias corrections at the level of individual platforms are not yet provided, but for individual ships (and drifters) an estimate of the uncertainty introduced by systematic and random errors is included.
In addition to the drifter and Argo data, GTMBA data, provided by NOAA’s Pacific Ma-rine Environmental Laboratory (PMEL), were downloaded from the web (http://www.pmel.noaa.gov/tao/disdel/disdel.html) and new Matchup Dataset (MD) files were created. The high-temporal resolution GTMBA data had a sampling resolution of either 5, 10 or 60 minutes and the highest available temporal resolution was always used if multiple resolutions were available.
Present generation ATLAS ocean temperature measuring instruments (used in RAMA and PIRATA; used in TAO, but being phased out by NDBC) are either calibrated at Sea Bird Electronics (SBE), or are calibrated at PMEL using calibration standards manufac-tured and calibrated by SBE (model 3). PMEL's calibration procedures are documented at http://www.pmel.noaa.gov/pubs/PDF/frei2817/frei2817.pdf. Newer GTMBA systems (TAO/NDBC, TRITON/JAMSTEC, and being tested by PMEL in RAMA and PIRATA) measure ocean temperature using SBE models 37 and 39. SBE's use of ITS-90 is documented at http://www.seabird.com/application_notes/AN42.htm. No additional QC was done to the data prior to ingestion into the MMS.
Finally, we include ship-borne radiometer data sourced directly from a number of in-strument PIs. As for the GTMBA, no additional QC is done to the radiometer data before ingestion into the MMS. For details of the ship-borne radiometers used please see Don-lon et al., 2014 (RD.379).
5.2.3 Content of Reference Dataset for Product Validation
The content of the reference dataset for product validation is given in Table 5-1. Esti-mates of uncertainty for each dataset are provided.

SST_CCI-Phase II SST_CCI-PVIR-UOL-201
SST CCI Product Validation and Intercomparison Report Issue 1
Page 19
Table 5-1: Content of SST_CCI reference dataset for product validation
Data type Time pe-riod
Coverage Comment Uncertainty Reference
Ship-borne IR radiome-ters
1996 – 2013
Caribbean Sea; Bay of Biscay; various tracks
Independent
SSTskin 0.1 °C
Barton et al., (2004; RD.050)
Argo floats 2000 – 2013
Global#
Independent
SSTdepth 0.005 °C
Oka and Ando et al. (2004; RD.355)
GTMBA 1991 – 2013
Tropics Independent
SSTdepth 0.1 °C
Kennedy et al (2012; RD.243)
Drifting buoys
1991-2013
Global#
Pseudo-independent
SSTdepth 0.2 °C
O’Carroll et al (2008; RD.246)
# Data are not truly “global” but cover majority of Earth’s oceans.
5.3 Uncertainty validation
The principal approach to validation of uncertainties is to examine the distribution of satel-lite-reference SST differences as a function of uncertainty. In an ideal case, the standard deviation of the differences between the satellite SST and a reference SST would equal the satellite uncertainty, i.e.
satrefsat
However, the reference data has its own uncertainties to consider, as estimated in Table 5-1. Consequently, the standard deviation of the differences between the satellite SST and a reference SST is really a combination of both the uncertainty in the satellite SST and the uncertainty in the reference SST, i.e.
22
refsatrefsat
There are of course the other terms to consider relating to:
The difference in spatial sampling (a point reference measurement versus a
satellite pixel);
The difference in depth of the measurements;
The difference in time of the measurements.
Such an approach naturally considers the uncertainty due to environmental effects related to the homogeneity of a region/process. For example, validation in a region dominated by
SST_CCI-Phase II SST_CCI-PVIR-UOL-201
SST CCI Product Validation and Intercomparison Report Issue 1
Page 20
strong SST fronts at low wind speed will mean the first term (spatial sampling) will be sys-tematic for any one single match-up. However, as the number of match-ups increases the uncertainty will reduce by 1/√N as you sample the variability at multiple locations (unless you always sample on one side of a front, say). Consequently, the effect is considered to be a pseudo-random term across a set of validation data and not systematic. Likewise, in an area of strong solar radiation and low wind speed the second term (difference in depth) would be systematic for any one match-up. Therefore, these other terms can be reduced to << 0.1 K in the mean through the use of a depth/time adjustment, large num-ber of match-ups (to reduce pseudo-random terms) and through like versus like (SSTskin versus SSTskin or SSTdepth versus SSTdepth) comparisons.
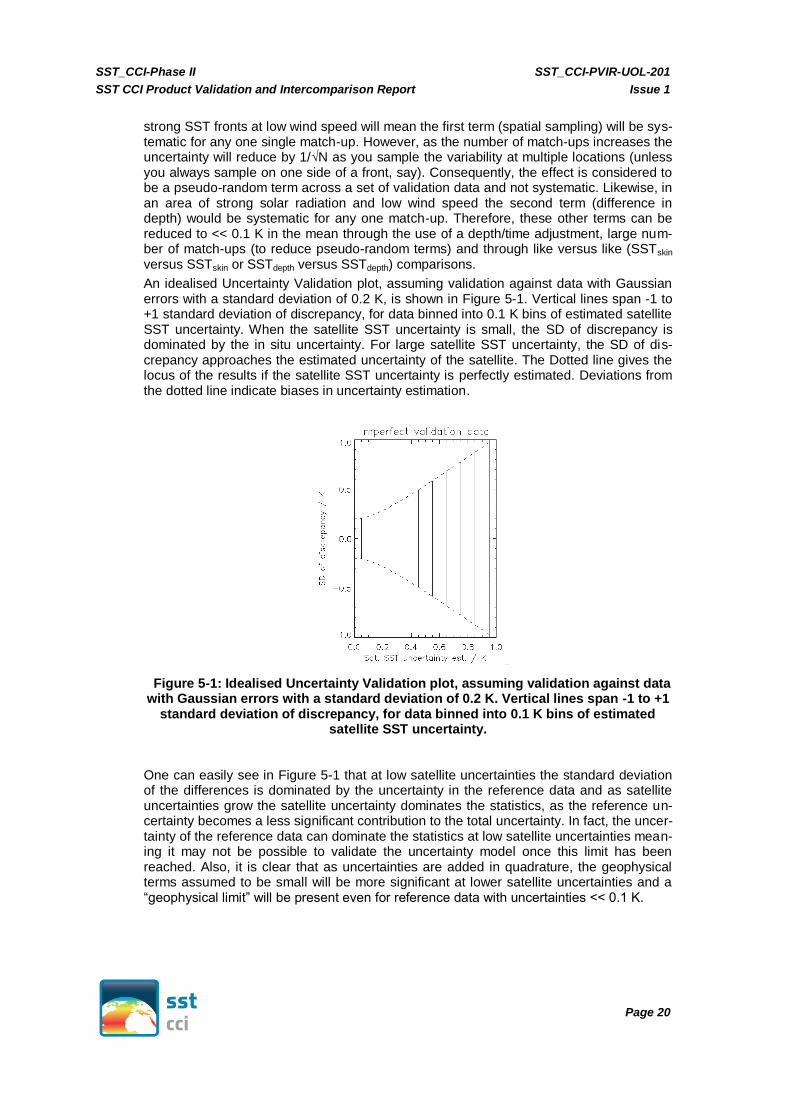
An idealised Uncertainty Validation plot, assuming validation against data with Gaussian errors with a standard deviation of 0.2 K, is shown in Figure 5-1. Vertical lines span -1 to +1 standard deviation of discrepancy, for data binned into 0.1 K bins of estimated satellite SST uncertainty. When the satellite SST uncertainty is small, the SD of discrepancy is dominated by the in situ uncertainty. For large satellite SST uncertainty, the SD of dis-crepancy approaches the estimated uncertainty of the satellite. The Dotted line gives the locus of the results if the satellite SST uncertainty is perfectly estimated. Deviations from the dotted line indicate biases in uncertainty estimation.
Figure 5-1: Idealised Uncertainty Validation plot, assuming validation against data with Gaussian errors with a standard deviation of 0.2 K. Vertical lines span -1 to +1
standard deviation of discrepancy, for data binned into 0.1 K bins of estimated satellite SST uncertainty.
One can easily see in Figure 5-1 that at low satellite uncertainties the standard deviation of the differences is dominated by the uncertainty in the reference data and as satellite uncertainties grow the satellite uncertainty dominates the statistics, as the reference un-certainty becomes a less significant contribution to the total uncertainty. In fact, the uncer-tainty of the reference data can dominate the statistics at low satellite uncertainties mean-ing it may not be possible to validate the uncertainty model once this limit has been reached. Also, it is clear that as uncertainties are added in quadrature, the geophysical terms assumed to be small will be more significant at lower satellite uncertainties and a “geophysical limit” will be present even for reference data with uncertainties << 0.1 K.

SST_CCI-Phase II SST_CCI-PVIR-UOL-201
SST CCI Product Validation and Intercomparison Report Issue 1
Page 21
6. VALIDATION RESULTS
6.1 Mission level
In this section we look at the results of validating each series of sensors, ATSR or AVHRR, as a single mission. All validation results were obtained from the MMS by ex-tracting the full set of L2P fields for each match-up record. The data for each sensor was then combined into a single MMD file for subsequent evaluation.
A time series of all ESA SST_CCI ATSR EXP1.2 datasets compared to the pseudo-independent drifting buoy dataset as well as the independent Argo dataset (for the period it is available) is shown in Figure 6-1.
Figure 6-1: (Left) Time series of (lower) median discrepancy and (upper) robust standard deviation (RSD) for the ESA SST_CCI ATSR EXP1.2 mission compared to drifting buoys. Results are shown for daytime 2-channel (red), nighttime 2-channel
(cyan) and nighttime 3-channel (green) match-ups. Also, shown (right) is the equivalent time series for ESA SST_CCI ATSR EXP1.2 compared to Argo.
We note two main differences in Figure 6-1 for the EXP1.2 products compared to the equivalent plot for the v1.1 product, namely (1) the removal of a small seasonal cycle from the daytime match-ups and (2) better agreement between daytime and nighttime RSD values throughout the mission. We note a daytime ‘bump’ in the daytime timeseries between 1998 and 2001, which we cannot attribute to known changes in the satellite data over this period; the first instability we would expect (after the ATSR-2 scan mirror re-sumed normal operations) is the loss of the final ERS-2 gyro, which occurs in January 2001 and this is seen in both the median and RSD time series; both time series recover to pre-failure levels once an updated yaw-steering mode is implemented using data from the ERS-2 scatterometer. We therefore hypothesize that the 1998-2001 2-Ch instability re-lates to features of the day-time drifter record and requires further investigation.
A time series of all ESA SST_CCI AVHRR EXP1.2 datasets compared to the pseudo-independent drifting buoy dataset as well as the independent Argo dataset (for the period it is available) is shown in Figure 6-2.

SST_CCI-Phase II SST_CCI-PVIR-UOL-201
SST CCI Product Validation and Intercomparison Report Issue 1
Page 22
Figure 6-2: (Left) Time series of (lower) median discrepancy and (upper) robust standard deviation (RSD) for the ESA SST_CCI AVHRR EXP1.2 mission compared to drifting buoys. Results are shown for daytime 2-channel (red) and night time 3-channel (green) match-ups. Also, shown (right) is the equivalent time series for
ESA SST_CCI AVHRR EXP1.2 compared to Argo.
The timeseries in Figure 6-2 is comparable to Figure 6-1 but is much noisier in nature in both the median and RSD time series. There is some evidence of the daytime ‘bump’ between 1998 and 2001, although this could also be “noise”. We also see large varia-tions in bias at the start of the record that correspond to the period of operation of the AVHRR on the NOAA-12 spacecraft (as expected because of known calibration issues, yet to be resolved). One particular point of note is that there is no notable change in bias following the failure of AATSR in April 2012, after which the AVHRR products are no longer bias corrected to the ATSR series. A small (~0.1 K) drift is seen in the drifter comparison time series, but this starts before the failure of AATSR, and is not present against Argo (which we consider the more stable in situ system).
The spatial distribution of the discrepancies for the ESA SST_CCI ATSR EXP1.2 mis-sion is shown in Figure 6-3, which includes the latitude/longitude variation and time/latitude variation for both daytime and nighttime.
SST_CCI-Phase II SST_CCI-PVIR-UOL-201
SST CCI Product Validation and Intercomparison Report Issue 1
Page 23
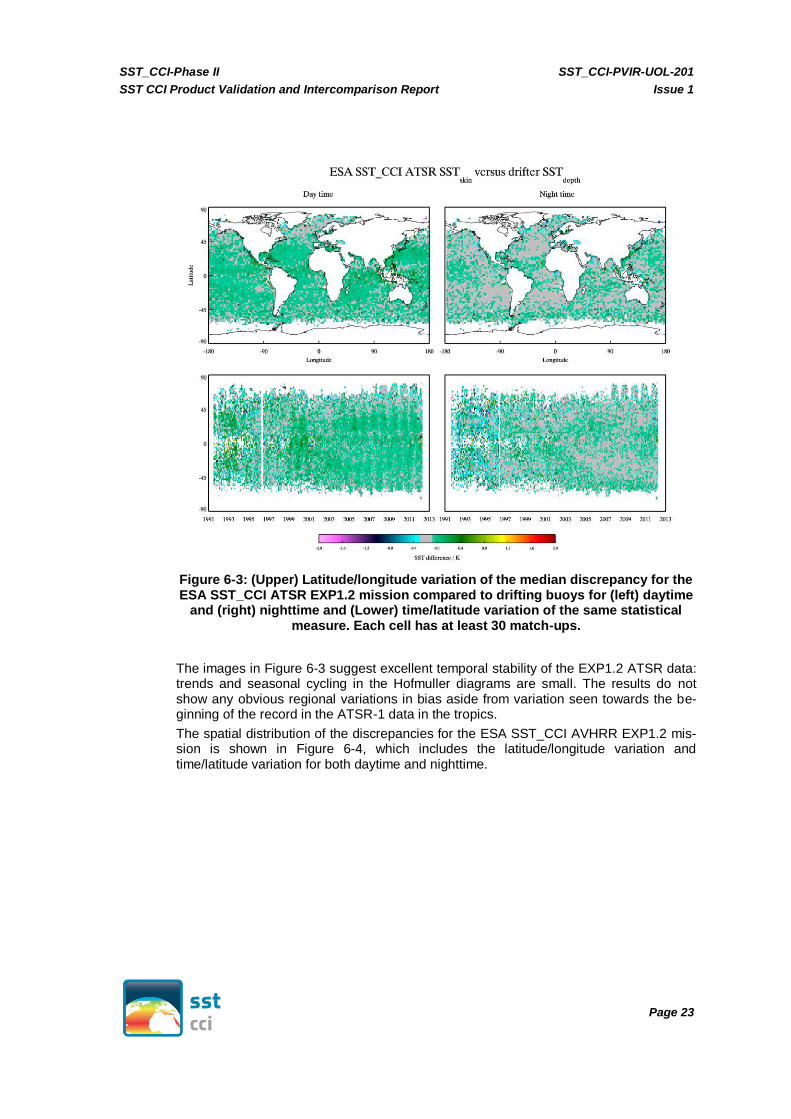
Figure 6-3: (Upper) Latitude/longitude variation of the median discrepancy for the ESA SST_CCI ATSR EXP1.2 mission compared to drifting buoys for (left) daytime
and (right) nighttime and (Lower) time/latitude variation of the same statistical measure. Each cell has at least 30 match-ups.
The images in Figure 6-3 suggest excellent temporal stability of the EXP1.2 ATSR data: trends and seasonal cycling in the Hofmuller diagrams are small. The results do not show any obvious regional variations in bias aside from variation seen towards the be-ginning of the record in the ATSR-1 data in the tropics.
The spatial distribution of the discrepancies for the ESA SST_CCI AVHRR EXP1.2 mis-sion is shown in Figure 6-4, which includes the latitude/longitude variation and time/latitude variation for both daytime and nighttime.
SST_CCI-Phase II SST_CCI-PVIR-UOL-201
SST CCI Product Validation and Intercomparison Report Issue 1
Page 24
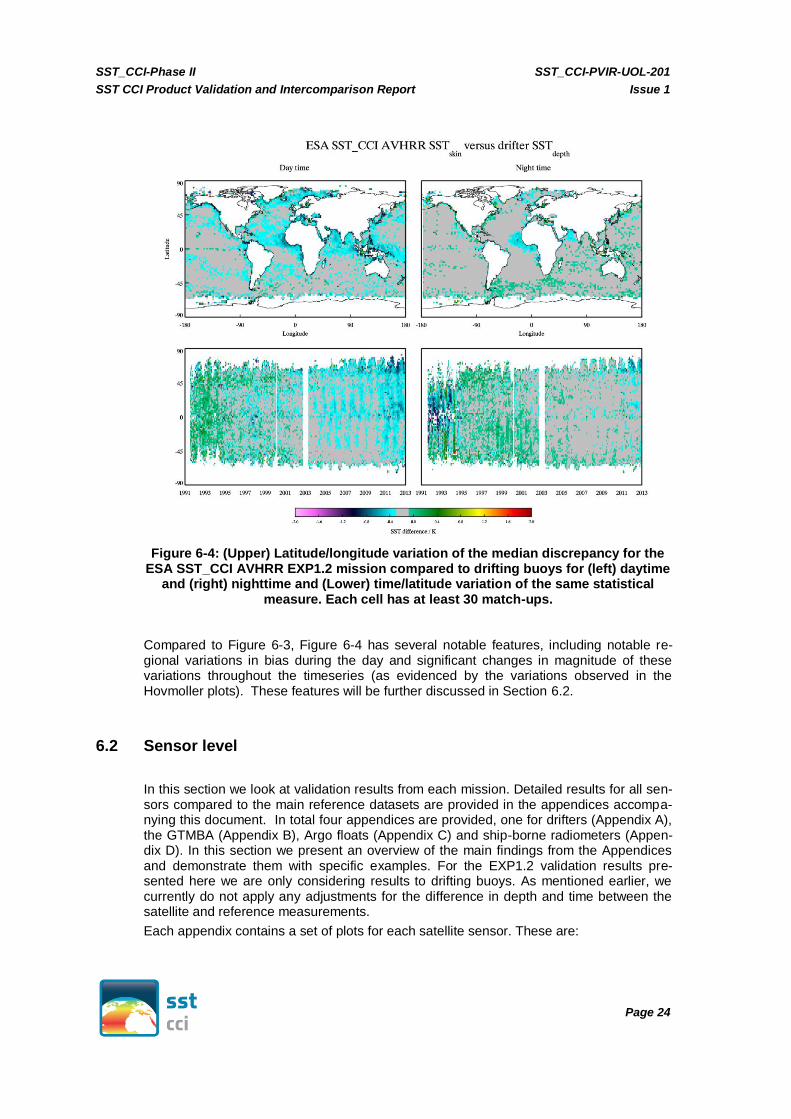
Figure 6-4: (Upper) Latitude/longitude variation of the median discrepancy for the ESA SST_CCI AVHRR EXP1.2 mission compared to drifting buoys for (left) daytime
and (right) nighttime and (Lower) time/latitude variation of the same statistical measure. Each cell has at least 30 match-ups.
Compared to Figure 6-3, Figure 6-4 has several notable features, including notable re-gional variations in bias during the day and significant changes in magnitude of these variations throughout the timeseries (as evidenced by the variations observed in the Hovmoller plots). These features will be further discussed in Section 6.2.
6.2 Sensor level
In this section we look at validation results from each mission. Detailed results for all sen-sors compared to the main reference datasets are provided in the appendices accompa-nying this document. In total four appendices are provided, one for drifters (Appendix A), the GTMBA (Appendix B), Argo floats (Appendix C) and ship-borne radiometers (Appen-dix D). In this section we present an overview of the main findings from the Appendices and demonstrate them with specific examples. For the EXP1.2 validation results pre-sented here we are only considering results to drifting buoys. As mentioned earlier, we currently do not apply any adjustments for the difference in depth and time between the satellite and reference measurements.
Each appendix contains a set of plots for each satellite sensor. These are:
SST_CCI-Phase II SST_CCI-PVIR-UOL-201
SST CCI Product Validation and Intercomparison Report Issue 1
Page 25
AATSR: Data from the AATSR sensor on the ENVISAT platform covering the period from 2002 to 2010.
ATSR-2: Data from the ATSR sensor on the ERS-2 platform covering the period from 1995 to 2003.
ATSR-1: Data from the ATSR sensor on the ERS-1 platform covering the period from 1991 to 1997.
AVHRR-MTA: Data from the AVHRR sensor on the METOP-A platform covering the period from 2007 to 2013.
AVHRR-18: Data from the AVHRR sensor on the NOAA 18 platform covering the period from 2005 to 2013.
AVHRR-17: Data from the AVHRR sensor on the NOAA 17 platform covering the period from 2002 to 2013.
AVHRR-16: Data from the AVHRR sensor on the NOAA 16 platform covering the period from 2001 to 2006.
AVHRR-15: Data from the AVHRR sensor on the NOAA 15 platform covering the period from 1999 to 2003.
AVHRR-14: Data from the AVHRR sensor on the NOAA 14 platform covering the period from 1995 to 2001.
AVHRR-12: Data from the AVHRR sensor on the NOAA 12 platform covering the period from 1991 to 1999.
For ATSR-1, we present results for both the 2-channel and 3-channel nighttime retrievals. This results in a maximum of eleven plots for each plot type. Plot types included are:
Dependence on latitude, wind speed, total column water vapour (TCWV), solar ze-nith angle (SZA), time difference, date and across-swath position
Spatial distribution globally and as a time/longitude Hovmoller format
Histograms and various statistical analyses (normal statistics, robust statistics and non-linear Gaussian fit)
Uncertainty validation
Results are presented separately for daytime and nighttime matchups.
6.2.1 Key findings from ATSR sensor validation
For the ESA SST_CCI EXP1.2 ATSR sensor results presented in Appendix A, we are comparing ATSR SSTskin to drifter SST0.2. As such we focus our initial attention on the dependence on wind speed. From Donlon et al., 2002 (RD.377) we would expect to see the median difference in good agreement with their model (plotted as the orange solid line) for nighttime data; for daytime data we would only expect to see this agreement at wind speeds above 6 ms
-1, with evidence of diurnal warming afflicting matchups at lower
wind speed.
An example plot of the dependence on wind speed, for ATSR-3, is shown in Figure 6-5; In ESA SST_CCI nomenclature ATSR-3 is AATSR.

SST_CCI-Phase II SST_CCI-PVIR-UOL-201
SST CCI Product Validation and Intercomparison Report Issue 1
Page 26
Figure 6-5: Dependence of the median and robust standard deviation between ESA SST_CCI EXP1.2 ATSR-3 L2P SSTskin and drifter SST0.2 discrepancies as a function of wind speed. Day time results are shown in red, night time 3-channel
results are shown in blue and night time 2-channel results are shown in green. No adjustment has been made to account for the difference in depth and time between
the satellite and drifter measurements. The orange line represents the model prediction for nighttime conditions of Donlon et al., 2002 (RD.377)
In Figure 6-5 we can see a residual dependence on wind speed for nighttime matchups and evidenced by the difference between the green (data) and orange (model) lines. However, compared to P-I results, we have much improved agreement between daytime and nighttime biases at high wind speeds; these results are also valid for ATSR-2. There is no clear evidence from any of the other plot types as to the main cause of this residual dependence on wind speed.
For ATSR-1 the results for EXP1.2 are generally comparable to those from v1.1, although we note a strong residual dependence on TCWV for 3-channel retrievals at the start of the mission (see Appendix A, page 3).
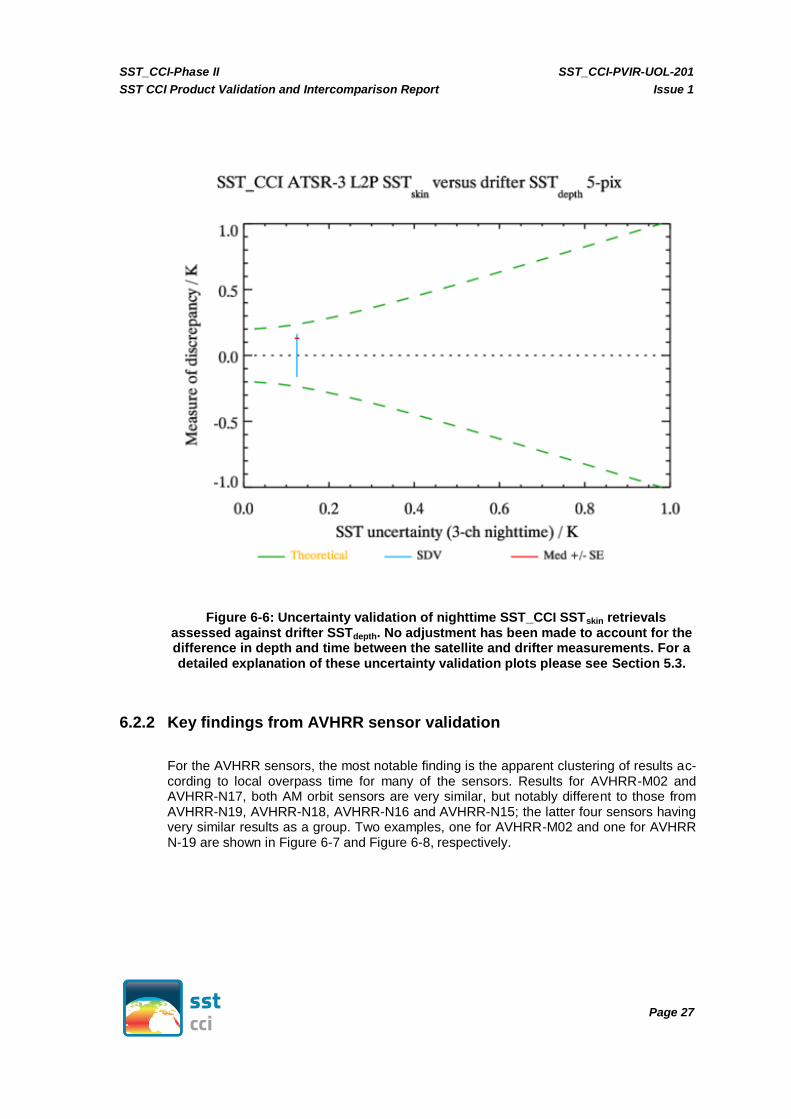
Uncertainties are improved in magnitude. Compared to the v1.1 validation report, we note a much smaller range of total uncertainty values in the EXP1.2 validation plots (e.g., Fig-ure 6-6, where the total uncertainty in the satellite product is binned into only one bin). This arises because: (i) here the uncertainty of single pixels is validated, rather than for the L3U product of v1.1, which means that there is no variation from the number of pixels in a sample; (ii) coefficient-based retrievals were used for ATSRs for EXP1.2 rather than optimal estimation, which tends to give rise to a more geographically uniform uncertainty estimate for 3-channel retrievals in particular.
SST_CCI-Phase II SST_CCI-PVIR-UOL-201
SST CCI Product Validation and Intercomparison Report Issue 1
Page 27
Figure 6-6: Uncertainty validation of nighttime SST_CCI SSTskin retrievals assessed against drifter SSTdepth. No adjustment has been made to account for the difference in depth and time between the satellite and drifter measurements. For a detailed explanation of these uncertainty validation plots please see Section 5.3.
6.2.2 Key findings from AVHRR sensor validation
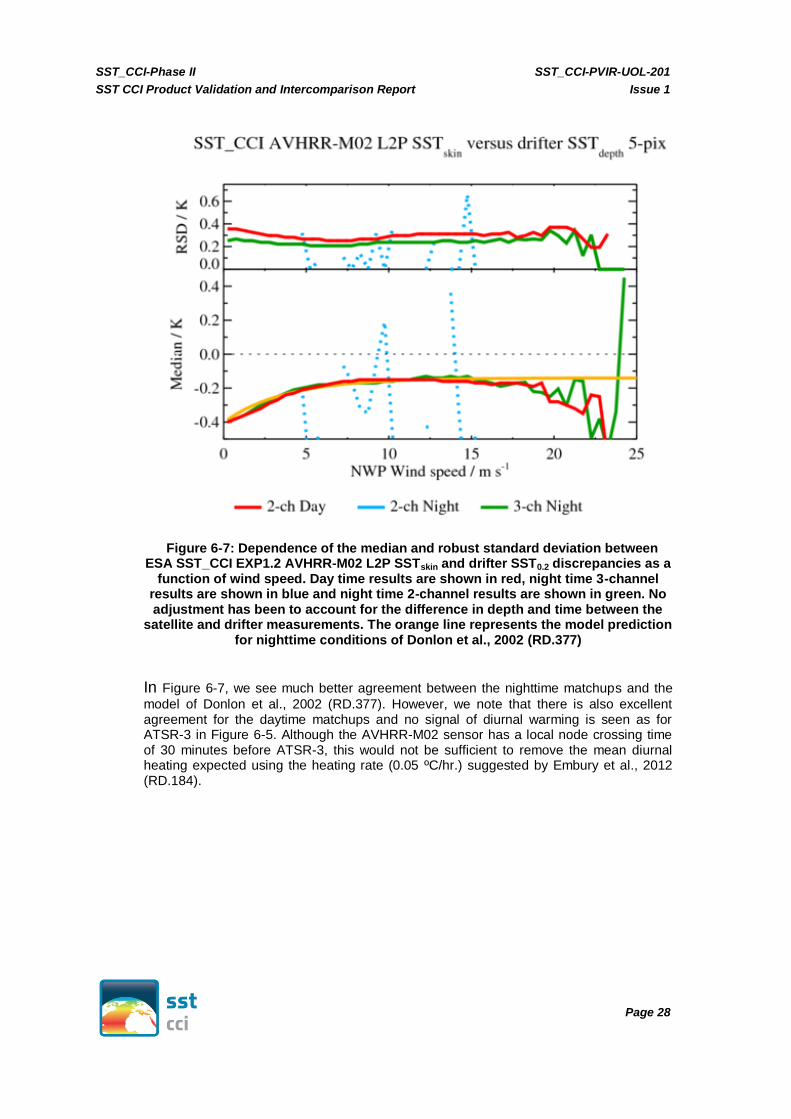
For the AVHRR sensors, the most notable finding is the apparent clustering of results ac-cording to local overpass time for many of the sensors. Results for AVHRR-M02 and AVHRR-N17, both AM orbit sensors are very similar, but notably different to those from AVHRR-N19, AVHRR-N18, AVHRR-N16 and AVHRR-N15; the latter four sensors having very similar results as a group. Two examples, one for AVHRR-M02 and one for AVHRR N-19 are shown in Figure 6-7 and Figure 6-8, respectively.
SST_CCI-Phase II SST_CCI-PVIR-UOL-201
SST CCI Product Validation and Intercomparison Report Issue 1
Page 28
Figure 6-7: Dependence of the median and robust standard deviation between ESA SST_CCI EXP1.2 AVHRR-M02 L2P SSTskin and drifter SST0.2 discrepancies as a
function of wind speed. Day time results are shown in red, night time 3-channel results are shown in blue and night time 2-channel results are shown in green. No adjustment has been to account for the difference in depth and time between the
satellite and drifter measurements. The orange line represents the model prediction for nighttime conditions of Donlon et al., 2002 (RD.377)
In Figure 6-7, we see much better agreement between the nighttime matchups and the
model of Donlon et al., 2002 (RD.377). However, we note that there is also excellent agreement for the daytime matchups and no signal of diurnal warming is seen as for ATSR-3 in Figure 6-5. Although the AVHRR-M02 sensor has a local node crossing time of 30 minutes before ATSR-3, this would not be sufficient to remove the mean diurnal heating expected using the heating rate (0.05 ºC/hr.) suggested by Embury et al., 2012 (RD.184).

SST_CCI-Phase II SST_CCI-PVIR-UOL-201
SST CCI Product Validation and Intercomparison Report Issue 1
Page 29
Figure 6-8: Dependence of the median and robust standard deviation between ESA SST_CCI EXP1.2 AVHRR N-19 L2P SSTskin and drifter SST0.2 discrepancies as a
function of wind speed. Day time results are shown in red, night time 3-channel results are shown in blue and night time 2-channel results are shown in green. No
adjustment has been made to account for the difference in depth and time between the satellite and drifter measurements. The orange line represents the model
prediction for nighttime conditions of Donlon et al., 2002 (RD.377).
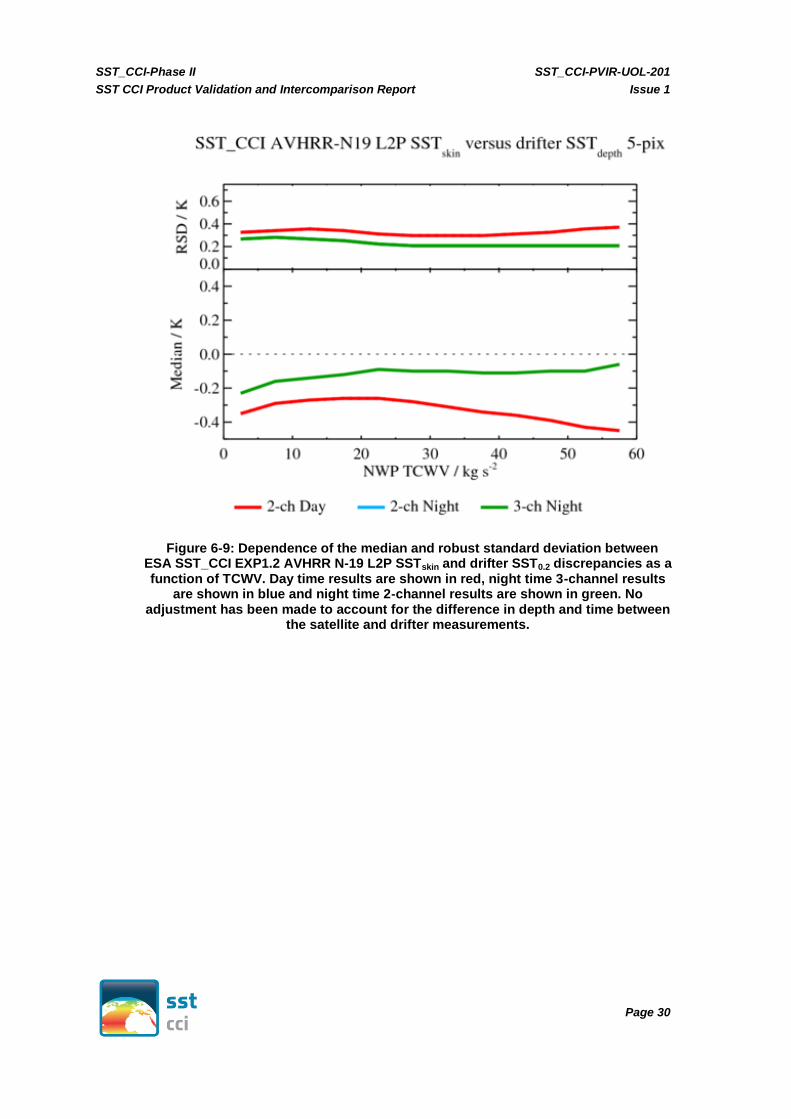
However, in Figure 6-8, for the PM orbit sensors, we see different results entirely, with a strong residual dependence on wind speed for nighttime matchups. Also in Figure 6-8 is a notable negative bias in the daytime results, particularly for low wind conditions. This sur-prising result is presently not fully explained, and is the subject of ongoing investigation. This negative bias may be linked to a dependence on TCWV as seen in Figure 6-9, to the extent that there is a correlation of wind and TCWV.
SST_CCI-Phase II SST_CCI-PVIR-UOL-201
SST CCI Product Validation and Intercomparison Report Issue 1
Page 30
Figure 6-9: Dependence of the median and robust standard deviation between ESA SST_CCI EXP1.2 AVHRR N-19 L2P SSTskin and drifter SST0.2 discrepancies as a function of TCWV. Day time results are shown in red, night time 3-channel results
are shown in blue and night time 2-channel results are shown in green. No adjustment has been made to account for the difference in depth and time between
the satellite and drifter measurements.

SST_CCI-Phase II SST_CCI-PVIR-UOL-201
SST CCI Product Validation and Intercomparison Report Issue 1
Page 31
We also see evidence of the likely dependence on TCWV in the spatial distribution of match-ups, where the largest negative biases are in regions of high water vapour loading in the atmosphere (e.g., around Indonesia). An example, for AVHRR N-19, is shown in Figure 6-10.
Figure 6-10: Spatial distribution of the median discrepancy between ESA SST_CCI EXP1.2 AVHRR N-19 L2P SSTskin and drifter SSTdepth for daytime matchups. No
adjustment has been made to account for the difference in depth and time between the satellite and drifter measurements.

SST_CCI-Phase II SST_CCI-PVIR-UOL-201
SST CCI Product Validation and Intercomparison Report Issue 1
Page 32
Several AVHRR sensors exhibit a notable change in bias over time towards the end of life. In particular, strong annual cycling in is evident in nighttime AVHRR-N15 results, as shown in Figure 6-11.
Figure 6-11: Dependence of the median and robust standard deviation between ESA SST_CCI EXP1.2 AVHRR N-15 L2P SSTskin and drifter SSTdepth discrepancies as a function of date for all sensors. Day time results are shown in red, night time 3-channel results are shown in blue and night time 2-channel results are shown in
green. No adjustment has been made to account for the difference in depth and time between the satellite and drifter measurements.

SST_CCI-Phase II SST_CCI-PVIR-UOL-201
SST CCI Product Validation and Intercomparison Report Issue 1
Page 33
Many AVHRRs exhibit strong seasonal variations in bias in daytime matchups (see sea-sonal ‘behaviour’ in Hovmoller plots). An example is shown in Figure 6-12 below where seasonal biases are seen particularly towards high latitudes.
Figure 6-12: Hovmoller distribution of the median discrepancy between ESA SST_CCI EXP1.2 AVHRR N-18 SSTskin and drifter SSTdepth for daytime matchups for all sensors. No adjustment has been made to account for the difference in
depth and time between the satellite and drifter measurements.

SST_CCI-Phase II SST_CCI-PVIR-UOL-201
SST CCI Product Validation and Intercomparison Report Issue 1
Page 34
The timeseries of match-ups shows variations in match-up locations compared to P-I, the most noticeable case being AVHRR-N15, shown in Figure 6-13 where the latitudinal range of the matchup locations varies annually. This is mostly likely to relate to cloud screening in twilight conditions (AVHRR-15 drifted around a ~6 a.m. local overpass time from 2004 onwards), and we note that future reprocessings of AVHRR will switch Bayesian cloud detection (as for ATSRs) from the legacy CLAVR-X cloud detection used in EXP1.2.
Figure 6-13: Hovmoller distribution of the median discrepancy between ESA SST_CCI EXP1.2 AVHRR N-15 SSTskin and drifter SSTdepth for daytime matchups for all sensors. No adjustment has been made to account for the difference in
depth and time between the satellite and drifter measurements.

SST_CCI-Phase II SST_CCI-PVIR-UOL-201
SST CCI Product Validation and Intercomparison Report Issue 1
Page 35
Daytime histograms show evidence of cloud contamination (evidenced by a skewed dis-tribution on negative difference side) of comparable magnitude to that seen in P-I. An example distribution is shown in Figure 6-14.
Figure 6-14: Histogram of the median discrepancy between ESA SST_CCI EXP1.2 AVHRR N-19 SSTskin and drifter SSTdepth for daytime matchups for all sensors. No
adjustment has been made to account for the difference in depth and time between the satellite and drifter measurements.

SST_CCI-Phase II SST_CCI-PVIR-UOL-201
SST CCI Product Validation and Intercomparison Report Issue 1
Page 36
Finally, the uncertainties, as for ATSR, are improved in magnitude and again have less range than for v1.0, as shown in Figure 6-15, due to small changes in the formulation of the prior used in the SST optimal estimation algorithm.
Figure 6-15: Uncertainty validation of nighttime ESA SST_CCI EXP1.2 AVHRR M02 SSTskin retrievals assessed against drifter SSTdepth. No adjustment has been made
to account for the difference in depth and time between the satellite and drifter measurements. For a detailed explanation of these uncertainty validation plots
please see Section 5.3.

SST_CCI-Phase II SST_CCI-PVIR-UOL-201
SST CCI Product Validation and Intercomparison Report Issue 1
Page 37
7. STABILITY ASSESSMENT
Stability is defined within the ESA SST_CCI project as the degree of invariance over time of the mean error from systematic effects in SST. Ideally for a stability assessment of the ESA SST_CCI EXP1.2 products we require a long time series of reference measure-ments with known stability. For the ESA SST_CCI datasets we are targeting the Global Climate Observing System (GCOS) requirement of “<0.03 K over 100 km scales” (The time dimension is missing from this statement, but later text shows that absence of trend artefacts greater than 0.03 K per decade (i.e. 3mK/year) is the intended requirement (Ohring et al., 2005, RD.339).).
So far only one assessment of stability capable of being informative at the level of the GCOS requirement has been published (Merchant et al., 2012, RD.296). In Merchant et al. (2012, RD.296) the stability of the long-term ATSR Reprocessing for Climate (ARC) record was assessed relative to components of the Global Tropical Moored Buoy Array (GTMBA) over a 20-year period. Merchant et al. (2012) concluded that over the period 1994 to 2010 that collocated ARC and GTMBA SSTs are stable, with better than 95% confidence, to within 0.005 K yr
-1. As ARC and GTMBA are two independent datasets it is
reasonable to assume that the stability of 0.005 K yr-1
determined by Merchant et al. (2012; RD.296) is an upper limit on the stability of the datasets individually for at least 1994 to 2010. As such, we have high confidence in the stability of the GTMBA for as-sessment of the ESA SST_CCI datasets across this period. We attribute the high stability of the GTMBA buoys to their routine maintenance, and, crucially, their pre- and post-deployment calibration. However, as noted by Merchant et al. (2012; RD.296) stability can only be directly assessed for equatorial latitudes using the GTMBA.
Other options in the reference dataset such as the drifting buoy network are not known to be stable to this level (there are no published assessments) and do not have spatial dis-tributions that are stable in time. As such, drifting buoys cannot be used with confidence at the level of the GCOS stability requirement – although time-series of satellite-buoy dif-ferences should still be calculated in order to preclude major instability in the satellite re-cord outside of tropical latitudes.
The Argo network of profiling floats has sensors stated to be of very high accuracy and stability (Oka and Ando, 2004, RD.355), but covers too brief a period to allow a rigorous assessment of decadal stability: the earliest the network is adequately complete is 2004, and the techniques for and potential of the Argo network for stability assessment requires further study owing to (a) its relatively short lifetime and (b) its poor coverage over time at each location (so the data cannot be deseasonalised for example). Indeed, Argo is likely to provide the first global assessment of SST stability and consequently research into how to maximise the benefit of Argo data for stability will become more urgent in the coming years. ESA have exercised a proposed option in P-II to address this, which it has just started and is being led by the University of Southampton.
The utility of ship-borne radiometers (1998 onwards) in areas of repeat ship tracks for stability assessment has not yet been established (Wimmer et al., 2012, RD.337; Minnett and Corlett, 2012, RD.338) and is another area for on-going research. Radiometers may have a unique advantage above other reference datasets for stability assessment as un-certainties should be available per measurement thus avoiding the need for large num-bers to reduce some of the uncertainty of the comparison between a point measurement and a satellite footprint. The issue of limited coverage is extremely acute with radiome-ters.
The GTMBA moorings provide consistent SSTs across the whole time period of the ESA SST CCI datasets (August 1991- December 2013), although the number of observations available over this period varies with time (see Figure 7-1) due to (a) changes in reporting

SST_CCI-Phase II SST_CCI-PVIR-UOL-201
SST CCI Product Validation and Intercomparison Report Issue 1
Page 38
frequency (e.g. every hour to every minute) and (b) changes to the make-up of the array (e.g. addition of the PIRATA and RAMA arrays; funding cuts). The analysis reported here uses GTMBA locations that are present for >75% of the full record (i.e. a single LT record from 1991 to 2013) so the number of locations does not greatly change over time (see Figure 7-1). Such moorings are mainly situated in the tropical Pacific in the TAO/TRITON arrays as these offer the longest records.
Figure 7-1: Monthly total number of GTMBA observations (1990 – 2013). The analysis presented here only uses mooring locations that provide data for > 75% of
the SST_CCI period (1991 – 2013) and so the real number of match-ups analysed per month is reasonably consistent over time.
7.1 Methodology
The stability of the ESA SST_CCI EXP1.2 products has been assessed through compari-sons to GTMBA moorings at 1 m depth using the approach and methodology provided in the GHRSST Climate Data Assembly Framework (CDAF, Merchant et al., 2013, RD.317).
Briefly, the two ESA SST_CCI EXP1.2 datasets (ATSR and AVHRR) were matched to GTMBA data for the full time period (1991 – 2013). For this assessment, a maximum time difference of 30 minutes was used as a threshold. No further quality control or filtering was applied to the data prior to analysis.
The methodology for creating the stability assessment defined in the CDAF is given be-low. This methodology has been internationally agreed for implementation within the con-text of GHRSST at the present time, and may be subject to future revision.
Following the initial match-up process, the monthly median ESA SST_CCI EXP1.2 minus GTMBA difference for each GTMBA location was calculated. This consid-
SST_CCI-Phase II SST_CCI-PVIR-UOL-201
SST CCI Product Validation and Intercomparison Report Issue 1
Page 39
ers each GTMBA location independently and avoids aliasing by periods with lar-ger number of match-ups or changes in GTMBA reporting.
Then for each month of the year and location, the multi-year average of the monthly median ESA SST_CCI EXP1.2 minus GTMBA differences was calculated. This considers each location independently and allows us to create an SST anomaly at each location.
For each month the data were then deseasonalised by subtracting the multi-year average for the appropriate month of the year from each month of the time series. For the two ESA SST_CCI EXP1.2 datasets, separate multi-year averages were used for daytime and nighttime matchups. The data are deseasonalised to mini-mise any potential aliasing of an annual cycle in residual time series following the approach of Merchant et al. (2012, RD.296).
Subsequently, the matchups were further reduced by retaining only locations where buoy data were available for >75% of the period to be assessed, i.e. >16 years within the 1991-2013 period. This allows us to use a consistent number of match-ups per month throughout the time series and avoids aliasing through additional GTMBA locations.
The monthly mean difference across all locations was determined to end up with a single ESA SST_CCI EXP1.2 minus GTMBA SST time series for each ESA SST_CCI EXP1.2 dataset (as shown in Figure 7-2 for ATSR and AVHRR, re-spectively).
A least squares linear fit to each time series of monthly mean differences was cal-culated to determine any trend in the data and 95% confidence intervals were es-timated for the final analysis.
7.2 Results
The results from the stability assessment are shown in Figure 7-2 for all ESA SST_CCI EXP1.2 datasets, ATSR (top) and AVHRR (bottom). Results are presented separately for day time (red) and night time (blue) matchups. Over plotted in Figure 7-2 are a linear least square fit (solid line) and its associated 95% confidence bands (dashed lines) for each time series; note the 95% confidence bands for the period from 1995 onwards are not visible on the scale used for the y-axis on either timeseries. Calculated trends for the pe-riod June 1995 to December 2013 at the 95% confidence level are given on the right hand side of the plot.
An objective of this analysis is to identify step changes over times that are most likely due to issues with the data quality. Although step-detection techniques were not used, a clear step-change is apparent from 1995 onwards in both time series, which is most likely due to the change between ATSR-1 and ATSR-2 as the two sensors were not harmonised and different retrieval methods were used for each instrument; the ATSR is used to bias correct the AVHRR.
The main reason for not using step-detection techniques is that these could not be in-cluded as baseline activities in either P-I or P-II. A consequence of not using step-detection techniques is that step changes (such as the change between ATSR-1 and ATSR-2 evident in Figure 7-2) have to be identified visually/subjectively, with a corre-sponding chance of both steps being missed and steps being falsely imputed.

SST_CCI-Phase II SST_CCI-PVIR-UOL-201
SST CCI Product Validation and Intercomparison Report Issue 1
Page 40
Figure 7-2: Time series of deseasonalised composite monthly mean differences (K) between the SST CCI products and the GTMBA. Separate day and night time series are provided for the SST CCI AVHRR and SST CCI ATSR datasets. Also
plotted are the results of a least squares linear fit (solid lines) for the August 1991 to May 1995 and June 1995 to December 2013 periods and their 95% confidence
bands (dashed lines). The calculated trends for the latter period only are presented on the right hand side of the image. Please see text for further
discussion.
As the ATSRs were used to bias correct the radiances for the AVHRRs the feature is also apparent in the AVHRR time. Consequently, the 95% confidence interval on the slope of the fit was calculated for two separate periods, 1991 to May 1995 covering the ATSR-1 period and June 1995 to 2010 covering the ATSR-2/AATSR period.
For the SST CCI ATSR product, the night time trend in the differences to the GTMBA measurements for the 1995-2010 period is comparable to that calculated by Merchant et al. (2012, RD.296) and has tighter 95% confidence limits compared to the P-I V1.1 re-lease (2.62/4.52 for EXP1.2; -1.44/6.44 for v1.1). The day time stability confidence inter-val is also improved relative to v1.1 (0.24/2.06 for EXP1.2; 0.65/3.26 for v1.1) and relative to RD.296 is still less stable; nonetheless, the true stability is still likely to be within the GCOS requirement. For the ATSR-1 period, both the day and night trends (not reported here) remain outside the GCOS requirements.
For AVHRR product there is no comparable analysis in the literature for pre-cursor data-sets such as Pathfinder, i.e. long-term SST records generated from the AVHRRs. How-ever, we note tighter confidence bands for the EXP1.2 data compared to the v1.0 data for both the daytime (-5.35/-2.64 for EXP1.2; -12.34/-7.43 for v1.0) and nighttime (-3.76/1.23 for EXP1.2; (-1.97/2.08 for v1.1) timeseries.
We note that, as for the ATSR product, the day time stability is slightly poorer than for night time. This may reflect the greater amplification of error in two-channel relative to three-channel SST retrieval that is common to all infra-red sensors and retrieval methods. Since this is a timeseries from multiple instruments, each with their own calibration is-sues, differential quality of the CLAVR-x cloud masking and pattern of orbit drift, a trend at this subtle level is likely to be a complex mix of these factors.
SST_CCI-Phase II SST_CCI-PVIR-UOL-201
SST CCI Product Validation and Intercomparison Report Issue 1
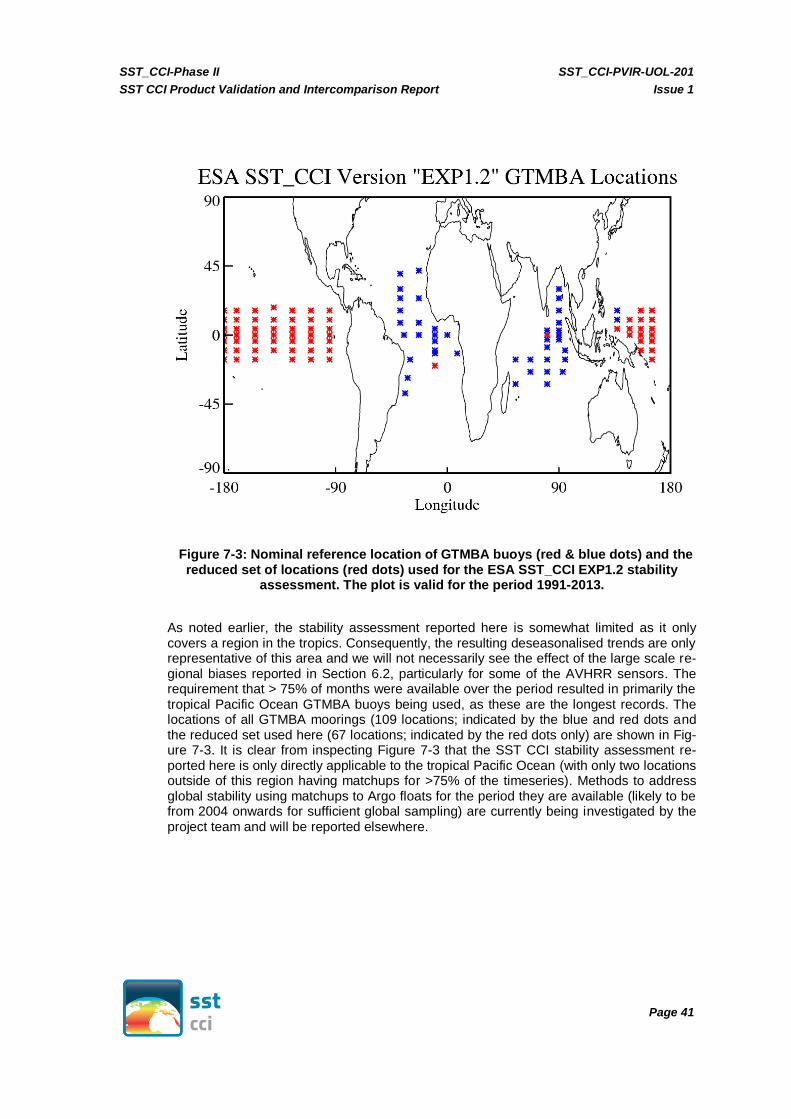
Page 41
Figure 7-3: Nominal reference location of GTMBA buoys (red & blue dots) and the reduced set of locations (red dots) used for the ESA SST_CCI EXP1.2 stability
assessment. The plot is valid for the period 1991-2013.
As noted earlier, the stability assessment reported here is somewhat limited as it only covers a region in the tropics. Consequently, the resulting deseasonalised trends are only representative of this area and we will not necessarily see the effect of the large scale re-gional biases reported in Section 6.2, particularly for some of the AVHRR sensors. The requirement that > 75% of months were available over the period resulted in primarily the tropical Pacific Ocean GTMBA buoys being used, as these are the longest records. The locations of all GTMBA moorings (109 locations; indicated by the blue and red dots and the reduced set used here (67 locations; indicated by the red dots only) are shown in Fig-ure 7-3. It is clear from inspecting Figure 7-3 that the SST CCI stability assessment re-ported here is only directly applicable to the tropical Pacific Ocean (with only two locations outside of this region having matchups for >75% of the timeseries). Methods to address global stability using matchups to Argo floats for the period they are available (likely to be from 2004 onwards for sufficient global sampling) are currently being investigated by the project team and will be reported elsewhere.