Embed Size (px)
Citation preview
1
Customer Discovery for Startups Developing New Products for New Markets A Case Study Exploring Challenges and Workarounds and the Use of Images Master of Science Thesis in the Management and Economics of Innovation Programme MAX HJALMARSSON AXEL WILANDH Department of Technology Management and Economics Division of Innovation Engineering and Management CHALMERS UNIVERSITY OF TECHNOLOGY Göteborg, Sweden, 2013 Report No. E 2013:013

2
3
MASTER’S THESIS E 2013:013
Customer Discovery for Startups Developing New Products for New Markets
A Case Study Exploring Challenges and Workarounds and the Use of Images
MAX HJALMARSSON AXEL WILANDH
Marcus Linder, Chalmers: Supervisor Sofia Börjesson, Chalmers: Examiner
Department of Technology Management and Economics Division of Innovation Engineering and Management
CHALMERS UNIVERSITY OF TECHNOLOGY Göteborg, Sweden 2013
4
Customer Discovery for Startups Developing New Products for New Markets A Case Study Exploring Challenges and Workarounds and the Use of Images © Max Hjalmarsson, 2013 © Axel Wilandh, 2013 Master’s Thesis E 2013:013 Department of Technology Management and Economics Division of Innovation Engineering and Management Chalmers University of Technology SE-412 96 Göteborg, Sweden Telephone: + 46 (0)31-772 1000 Chalmers Reproservice Göteborg, Sweden 2013
5
Abstract
Lean Startup Methodology is a new field of literature about decision-making for entrepreneurs
with the main goal of increasing the success rate of startups by decreasing market risk. The
development of new products for new markets is associated with increased challenges for
acquiring customer feedback, due to the fact that new markets are undefined and the customer
problem is unknown. This paper evaluates the challenges and possible workarounds for
implementing the first part of the, by Blank & Dorf (2012) developed, framework for Customer
Development, called Customer Discovery. Customer Discovery is implemented on a startup that
develops an electric powered multi-rotor helicopter to be introduced in the United States and
create a new market. Introducing a new product that creates a new market involves many
uncertainties and provides an interesting case for evaluation of the method. This paper further
conducts a Split test to evaluate the effects of showing images during the customer interaction
of the Customer Discovery method. This thesis argues that images, in accordance to what can
be expected, increase the interviewees’ enthusiasm and facilitates customer interaction.
Facilitated communication with customers and increased legitimacy of the interviews were two
other identified benefits of using images. This paper identifies some challenges for implementing
the Customer Discovery method and presents them with suggestions for workarounds. A broad
understanding of the customer problem is preferable and showing interviewees a suggested
solution facilitates asking questions about the problem but narrows their focus. A narrow focus
hinders both the entrepreneur and the customers from stepping back to contemplate the
problem from a wider perspective. This is identified as the main challenge and connects to the
issue of showing images of the product for potential customers. Solving this challenge is a
balancing act of how detailed the solution should be when presented during Customer
Discovery.
Keywords: Customer Development, Customer Discovery, Lean Startup, Startup, Entrepreneurship, New Market
6
Preface Born with an entrepreneurial mindset, the authors have experience of starting companies, both
successful and some less successful. Creating New Business was a course in our Master’s
program Management and Economics of Innovation that brought our attention to a new field of
literature, referred to as Lean Startup Methodology, which aims to help startups decrease
market risk and thereby increase their success rate. The challenge of creating a new market is a
reality that strikes some startups, as it is associated with multiple uncertainties. The Lean
Startup Methodology literature deals with how to overcome these uncertainties, why this area
seemed very interesting to explore further. To make this even more interesting we chose to
focus on the greater challenges associated with developing new products for new markets.
7
Acknowledgements This thesis was written as the final part of our Master’s program at Chalmers University of
Technology. It has been a challenge conducting and analyzing the theory of the entrepreneurial
literature and especially Customer Development. We are grateful for all the things we have
learnt from conducting this project.
First, we would like to thank our supervisor of this thesis, Marcus Linder, for his great support
during the whole project. Without his knowledge and guidance this report would not have been
possible. Secondly, we would like to thank the founders of EnCorp, especially, Thomas Ruf and
Stephen Wolf, for giving us the opportunity to implement a Customer Discovery project on their
company. NPNM startups are rare and hard to find at their early phase. Without EnCorp’s
approval, this thesis would not have been possible to accomplish. We would also like to thank
Steve Blank for taking the time to talk to us at his ranch in California.
Finally, we would like to thank all the participating interviewees, experts and also our friends,
which all also have provided us with useful information to this project. Thank you all for your
time, effort and information.
Max Hjalmarsson & Axel Wilandh
Gothenburg, March 2013

8
Word list & Acronyms
CD Customer Discovery; the first part of the Customer Development
framework, developed by Blank & Dorf (2012), that support startups
with decision-making and focus on minimizing the market risk.
Conspicuous- Refers to “the ostentatious display of wealth for the purpose or
Consumption acquiring or maintaining status or prestige”. (Page, 1992)
LSM Lean Startup Methodology - this report borrows the by Eric Ries
(2008) coined concept of Lean startup to refer to a wider concept that
embraces ideas of similar literature, in this case; Blank & Dorf, 2012;
Furr & Ahlstrom, 2011; Ries, 2011. See page 10 for more
information.
NPNM New Product for a New Market – a method for startups with a vision
to develop a new product what will create a new market. See page
23 for more information.
NPNM-startup A special term referring to startups with a NPNM strategy.
New Market A new market is defined as; “A social arrangement in which buyers
and sellers exchange money for a new category of products that
differentiates itself clearly from all other product categories” (Tollin &
Carú’s, 2008)
Startup A startup is a “temporary organization in search of a scalable,
repeatable, profitable business model.” (Blank & Dorf, 2012, p.xvii).
Eric Ries defines a startup to be; “A startup is a human institution
designed to deliver a new product or service under conditions of
extreme uncertainty.” (Ries, 2011)

1
Table of Content 1. Introduction ...................................................................................................................................................... 1 1.1 Background ................................................................................................................................................ 1 1.2 Purpose of the Research ........................................................................................................................ 3 1.3 Scope and Delimitations ........................................................................................................................ 4 1.4 Disposition of the Research .................................................................................................................. 4
2 Theory .................................................................................................................................................................. 6 2.1 The Lean Startup Methodology ........................................................................................................... 6 2.1.1 The Background of LSM ..................................................................................................................................... 6 2.1.2 Before LSM .............................................................................................................................................................. 8 2.1.3 Developments and Concepts of LSM ............................................................................................................ 9 2.1.4 Key principles of LSM ...................................................................................................................................... 10
2.2 The Customer Discovery framework .............................................................................................. 11 2.2.1 Customer Development Methodology ..................................................................................................... 11 2.2.2 An Introduction to Customer Discovery ................................................................................................. 13 2.2.3 Phase One of Customer Discovery -‐ State the Business Model Hypotheses ............................ 15 2.2.4 Phase Two of the Customer Discovery -‐ Test the Problem ............................................................. 18 2.2.5 Phase Three of Customer Discovery -‐ Test the Solution .................................................................. 21 2.2.6 Phase Four of Customer Discovery -‐ Verify or Pivot .......................................................................... 23
2.3 Additional Concepts ............................................................................................................................. 24 2.3.1 What makes a New Market ........................................................................................................................... 24 2.3.2 Low Fidelity Prototypes ................................................................................................................................. 25 2.3.3 The Kano Model ................................................................................................................................................. 26
3. Method ............................................................................................................................................................. 27 3.1 The Case Study ....................................................................................................................................... 27 3.1.1 Research design ................................................................................................................................................. 27 3.1.2 Data Collection and Data Analysis ............................................................................................................. 28
3.2 The Customer Discovery Project ...................................................................................................... 30 3.2.1 Research Design ................................................................................................................................................. 30 3.2.2 Data Collection .................................................................................................................................................... 30 3.2.3 Data Analysis ....................................................................................................................................................... 32 3.2.4 The Focal Company of the CD Project ...................................................................................................... 32 3.2.5 The Product of the CD project – the e-‐Copter ....................................................................................... 33
3.3 The Split Test .......................................................................................................................................... 35 3.3.1 Background of the Split-‐test ......................................................................................................................... 35 3.3.2 Research Design ................................................................................................................................................. 36 3.3.3 The Hypotheses .................................................................................................................................................. 36 3.3.4 The Interview Template ................................................................................................................................. 37 3.3.5 Data Collection .................................................................................................................................................... 39 3.3.6 Summary of Data ............................................................................................................................................... 41 3.3.7 Data Analysis ....................................................................................................................................................... 41 3.3.8 Validity and Reliability .................................................................................................................................... 42
4. Results .............................................................................................................................................................. 43 4.1 The Implementation of the CD method .......................................................................................... 43 4.1.1 Challenges of Stating the Hypotheses ....................................................................................................... 43 4.1.2 Develop a Reference Story ............................................................................................................................ 45 4.1.3 The Appointment Setting Process .............................................................................................................. 46

2
4.1.4 Testing the Problem versus Testing the Solution ............................................................................... 47 4.2 Results of the Split Test ....................................................................................................................... 48
5. Discussion ....................................................................................................................................................... 51 5.1.1 The Challenges of Stating the Hypotheses .............................................................................................. 51 5.1.2 Develop a Reference Story ........................................................................................................................... 53 5.1.3 The Appointment Setting Process .............................................................................................................. 53 5.1.4 Testing the Problem versus Testing the Solution ............................................................................... 54
5.2 The Split Test .......................................................................................................................................... 56 5.2.1. Hypothesis 1 – Increased Understanding of the Concept ............................................................... 56 5.2.2 Hypothesis 2 – Increased Enthusiasm ..................................................................................................... 57 5.2.3 Hypothesis 3 – The Time of Each Interview .......................................................................................... 58 5.2.4 End Discussion of the Split Test .................................................................................................................. 58
6. Conclusions ..................................................................................................................................................... 60 7. References ...................................................................................................................................................... 61 8. List of figures and tables ............................................................................................................................ 65
1
1. Introduction This chapter starts with an introduction to the research topic, followed by a background to the
field of literature, a description of the research problem and scope of this project. The
introduction aims to give the reader a good overview of the report and ends with describing the
disposition of the report.
1.1 Background The word entrepreneurship originates from the French word “entreprendre” which means, “to
undertake”. It involves the establishment of new organizations as a reaction to perceived
opportunities and as an expression of personal risk-taking in the form of entrepreneurial spirit.
The most common perception of what entrepreneurship entails is that of starting new
businesses, often using new technologies and concepts and turning these innovations to
economic profitability in a marketplace. (Shane, 2003)
The ability to exploit technological opportunities is important for nations to expand their pool of
businesses, stay competitive on a global market and grow the economy, (Fagerberg et al.,
2000). Entrepreneurship is increasingly recognized as a driving force for economic growth,
(Crosby, 2000; Solow, 1956), and the birth of new enterprises can be seen as a key element as
they encourage the creation of jobs and add real value to the economy. Eurostat (2008) writes
that within the EU (then with 15 member states), approximately two million jobs were created by
new enterprises in 2005. A startup is a modern term often associated with the early phases of
entrepreneurship; an organization trying to profit from what they see as market possibilities, but
most of these startups fail, (Ries, 2008).
2
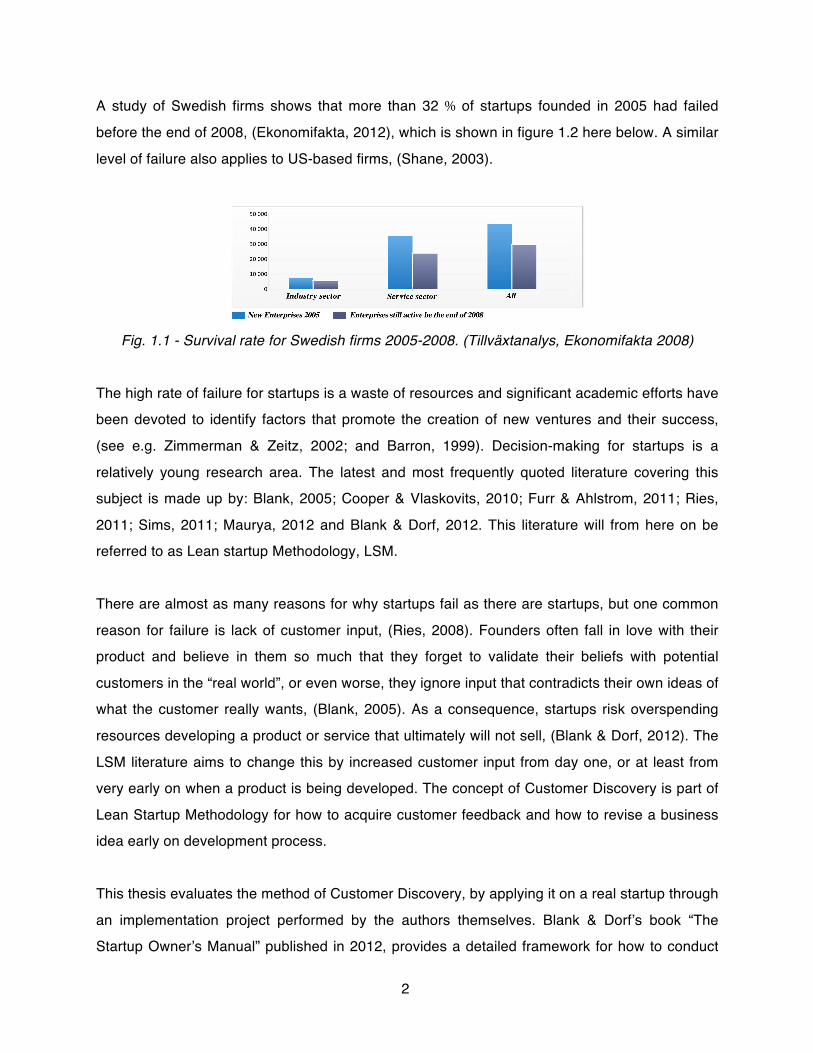
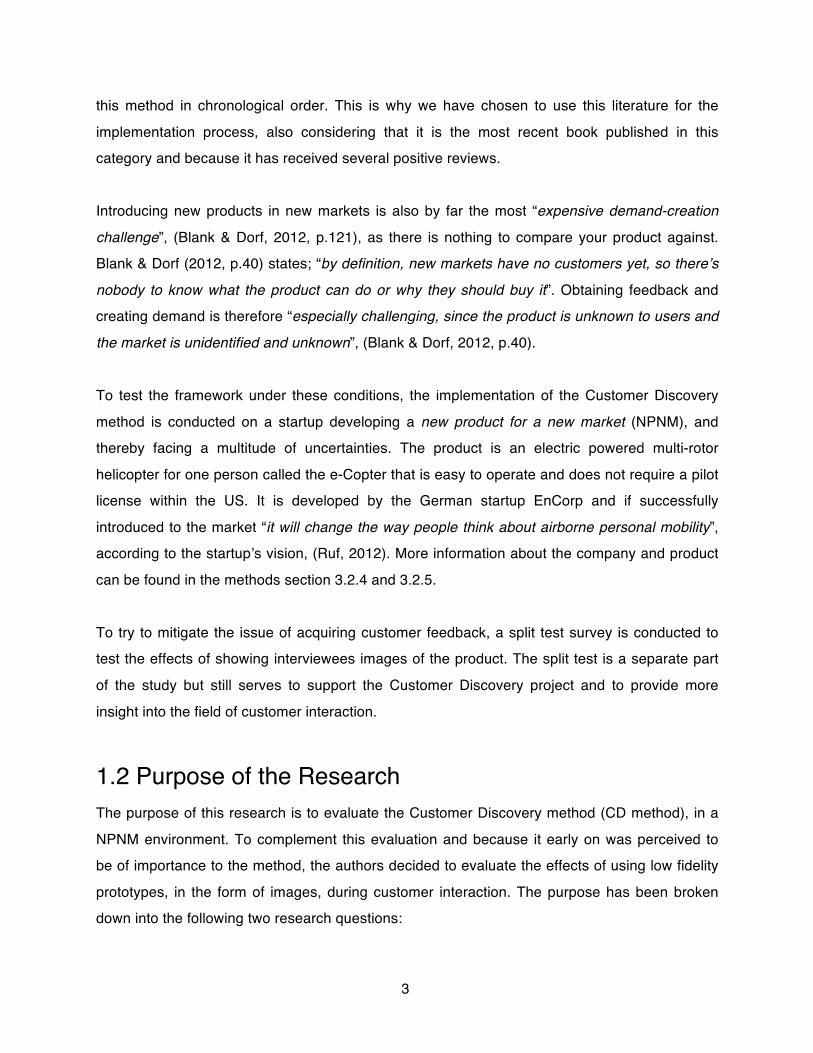
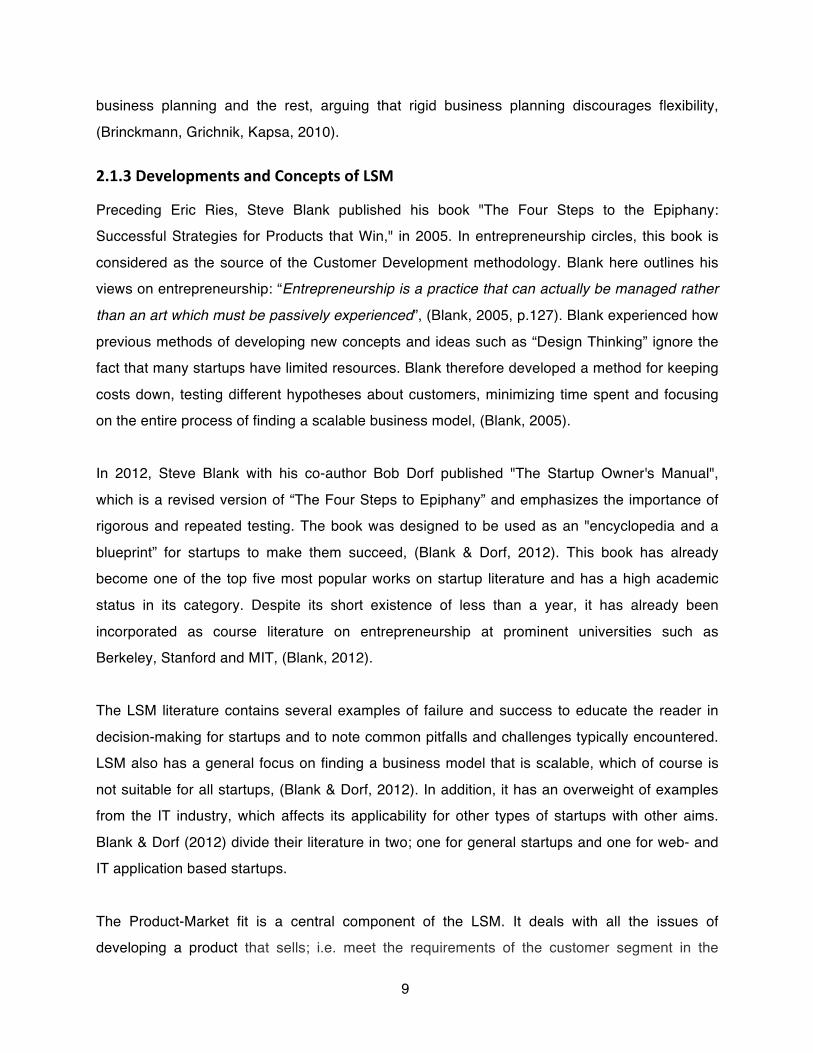
A study of Swedish firms shows that more than 32 % of startups founded in 2005 had failed
before the end of 2008, (Ekonomifakta, 2012), which is shown in figure 1.2 here below. A similar
level of failure also applies to US-based firms, (Shane, 2003).
Fig. 1.1 - Survival rate for Swedish firms 2005-2008. (Tillväxtanalys, Ekonomifakta 2008)
The high rate of failure for startups is a waste of resources and significant academic efforts have
been devoted to identify factors that promote the creation of new ventures and their success,
(see e.g. Zimmerman & Zeitz, 2002; and Barron, 1999). Decision-making for startups is a
relatively young research area. The latest and most frequently quoted literature covering this
subject is made up by: Blank, 2005; Cooper & Vlaskovits, 2010; Furr & Ahlstrom, 2011; Ries,
2011; Sims, 2011; Maurya, 2012 and Blank & Dorf, 2012. This literature will from here on be
referred to as Lean startup Methodology, LSM.
There are almost as many reasons for why startups fail as there are startups, but one common
reason for failure is lack of customer input, (Ries, 2008). Founders often fall in love with their
product and believe in them so much that they forget to validate their beliefs with potential
customers in the “real world”, or even worse, they ignore input that contradicts their own ideas of
what the customer really wants, (Blank, 2005). As a consequence, startups risk overspending
resources developing a product or service that ultimately will not sell, (Blank & Dorf, 2012). The
LSM literature aims to change this by increased customer input from day one, or at least from
very early on when a product is being developed. The concept of Customer Discovery is part of
Lean Startup Methodology for how to acquire customer feedback and how to revise a business
idea early on development process.
This thesis evaluates the method of Customer Discovery, by applying it on a real startup through
an implementation project performed by the authors themselves. Blank & Dorf’s book “The
Startup Owner’s Manual” published in 2012, provides a detailed framework for how to conduct
3
this method in chronological order. This is why we have chosen to use this literature for the
implementation process, also considering that it is the most recent book published in this
category and because it has received several positive reviews.
Introducing new products in new markets is also by far the most “expensive demand-creation
challenge”, (Blank & Dorf, 2012, p.121), as there is nothing to compare your product against.
Blank & Dorf (2012, p.40) states; “by definition, new markets have no customers yet, so there’s
nobody to know what the product can do or why they should buy it”. Obtaining feedback and
creating demand is therefore “especially challenging, since the product is unknown to users and
the market is unidentified and unknown”, (Blank & Dorf, 2012, p.40).
To test the framework under these conditions, the implementation of the Customer Discovery
method is conducted on a startup developing a new product for a new market (NPNM), and
thereby facing a multitude of uncertainties. The product is an electric powered multi-rotor
helicopter for one person called the e-Copter that is easy to operate and does not require a pilot
license within the US. It is developed by the German startup EnCorp and if successfully
introduced to the market “it will change the way people think about airborne personal mobility”,
according to the startup’s vision, (Ruf, 2012). More information about the company and product
can be found in the methods section 3.2.4 and 3.2.5.
To try to mitigate the issue of acquiring customer feedback, a split test survey is conducted to
test the effects of showing interviewees images of the product. The split test is a separate part
of the study but still serves to support the Customer Discovery project and to provide more
insight into the field of customer interaction.
1.2 Purpose of the Research The purpose of this research is to evaluate the Customer Discovery method (CD method), in a
NPNM environment. To complement this evaluation and because it early on was perceived to
be of importance to the method, the authors decided to evaluate the effects of using low fidelity
prototypes, in the form of images, during customer interaction. The purpose has been broken
down into the following two research questions:
4
(1) What are the main challenges with implementing the CD method for a startup with a
NPNM strategy, and what are possible workarounds for these challenges?
(2) How does the use of images, as low fidelity prototypes, affect customer interaction
during Customer Discovery within NPNM?
1.3 Scope and Delimitations The implementation and evaluation of the Customer Development methodology is limited to only
focus on the first step, the Customer Discovery. Hence, Customer Validation and the
subsequent steps of the framework are not studied. The CD method is part of an iterative
process, but due to time constraints, the whole process is only gone through once, but the
individual phases are iterated multiple times. This thesis focuses on a startup that envisions
creating a new market, why startups active in other types of markets are not considered. The
nature of Case Study research design makes this thesis only focusing on one single case, i.e.
the focal company of the implementation project. Besides the main literature of this thesis, Blank
& Dorf (2012), also other LSM literature is considered.
1.4 Disposition of the Research The outline of this thesis is divided into six main parts, all of which are briefly described below:
(1) Introduction
The introduction presents a comprehensive overview of the sections of this thesis and
provides a background to the subject of Customer Discovery, its challenges and why it is
an interesting research topic. If further explains the purpose of the thesis and states the
research questions.
(2) Theory
The theoretical part presents the literature used as reference in the thesis; LSM and
Customer discovery. It further provides an overview of the different concepts used; New
Markets, The Kano Model and a low fidelity prototype overview.
5
(3) Method
The method section gives an outline of how the research was conducted and describes
the relation between the subsequent parts of the study. The method in short, a case study
research design was used to study an empirical implementation project of Customer
Discovery on an NPNM-startup, and a split-test survey was conducted to evaluate the
effects of using images during customer interaction within Customer Discovery. This
section also contains the research methods with descriptions of how the data was
collected and analyzed. This section also brings transparency to the research by
discussing the reliability and validity of the study.
(4) Results
This section of the thesis contains the results obtained during the research. In the first part
the results obtained from the Customer Discovery implementation project are presented.
Four sets of identified challenges are presented together with possible workarounds. In
the second part the results of the split test are analyzed; two hypotheses are supported
and one is rejected.
(5) Discussion
The discussion debates the findings and the results of the research and relates them to
the corresponding literature to formulate arguments so that conclusions can be drawn and
properly supported. The first part discusses the implications of the Customer Discovery
project, the second the split test and the third gives a combined perspective.
(6) Conclusion
This section answers the research questions presented in the introduction. The reader is
given a clear presentation of what can be concluded from the thesis and the implication of
these findings along with the theoretical contribution and possibilities of further research.

6
2 Theory This chapter describes the theory behind the thesis and is used to create the framework needed
to analyze the results. First the Lean Startup Methodology is introduced, followed by a more
detailed section about Customer Development and the Customer Discovery. The third part of
this section contains concepts used in this report that are not part of the LSM; New Markets,
The Kano model and low fidelity prototypes.
2.1 The Lean Startup Methodology This section presents the concept of Lean Startup Methodology and some of the most
prominent literature in this theoretical field.
2.1.1 The Background of LSM
Lean Startup Methodology (LSM) is a mindset and a business approach that aims to change the
way companies are developed and new products are launched, (Ries, 2011, Furr & Ahlstrom,
2011; Blank & Dorf, 2012). The Lean Startup Methodology promotes startups to validate
learning by acquiring a more scientific approach to entrepreneurship by iterative product tests
with customer feedback. This way, startups gain better understanding of how well their product
or service will meet the demand and needs of their customer base without spending too much
resources. It is supposed to be a shorter and safer road to minimizing market risk, (Blank &
Dorf, 2012). The Lean Startup philosophy is more than just about customer interaction, as it also
teaches startups the value of reviewing all parts of a business plan, including sales channel and
business models, to assure the success of the entire Lean Startup process, (Blank & Dorf, 2012;
Ries, 2008).
Eric Ries coined the term “Lean Startup” for the first time in September 2008, on his blog
Startup Lessons Learned. Ries is a Silicon Valley entrepreneur, author and well-known blogger
among technology entrepreneurs all over the world. Ries defines a startup as: “an organization
dedicated to creating something new under conditions of extreme uncertainty”, (Ries, 2008,
p.27).

7
The following quotes from well renowned magazines are added to illustrate how new this field of
literature really is; The Business Journals called 2011, "the year of the Lean startup," and the
business magazine Fast Company reads; "Lean Startup is less about how to make web startups
more successful and entrepreneurs richer than it is a fundamental reexamination of how to work
in our complicated, faster-moving world", (Bernhard, 2011). Furthermore, The New York Times
wrote that the Lean Startup is a "fresh approach to creating companies that has attracted much
attention in the last year or so among Silicon Valley entrepreneurs, technologists and investors",
(Lohr, 2010).
The Lean Startup philosophy is inspired by the ideas and philosophy of Lean Production (also
known as lean manufacturing), (Ries, 2008). The lean manufacturing philosophy considers
waste to be “any expenditure of resources other than for the creation of value for the end
customer”, (Ries, 2008, p.134). For this reason, Lean Manufacturing advocates immediate
quality control checkpoints for instant identification of mistakes or imperfections during assembly
to minimize the time spent developing substandard products. For the same reason lean
management focuses on maintaining close connections with suppliers and other stakeholders in
order to understand their customers’ needs and desires, (Womack et al., 2007).
The LSM was originally developed for high-tech firms, but has since then been expanded to
apply also to individuals, teams, or companies looking to introduce new products or services to
a market. The concept of Lean Startup is now widespread and is nowadays the most read
literature about entrepreneurship worldwide, in large parts thanks to Eric Ries’ bestselling book
“The Lean Startup”, (NYTimes, 2011; Bury, 2011). As a consequence, the concept of Lean
Startup has also spread globally, (Roush, 2011). In 2012, there were Lean Startup meetings in
over 100 cities and 17 countries as well as an online discussion forum with over 5500 members.
The United States Government has also recently begun to employ many of the Lean startup
methodologies, (Ewel, 2012).
In addition to Eric Ries’s “The Lean Startup” (2011), this report uses Blank & Dorf’s “The startup
Owner’s Manual” (2012) and Furr & Ahlstrom’s “Nail it, Then Scale it” (2011). Consequently, the
term “Lean Startup Methodology” (LSM) will be used to refer to an aggregated methodology of
this literature.
8
2.1.2 Before LSM
The discussion of how to create and profit from bringing a new product or service to market has
been going on for several decades. The traditional model for product development is that an
entrepreneur identifies an opportunity, creates a product or service based on this opportunity
and puts it on the market, (Blank, 2005; Furr & Ahlstrom, 2011). Several amendments were
done to this model by authors like Cooper (1986) and Schilling & Hill (1998), but the foundation
of the model has remained the same.
According to Furr & Ahlstrom (2011) the general process of which entrepreneurs start their
businesses has features similar to the traditional product development process. Likewise, it
starts with the identification of an opportunity, followed by development of the product, the
acquirement of capital, improvements to the initial product, and finally placement of the product
on the market. Besides initial market sizing activities and perhaps early customer interviews,
customers are seldom involved in the development process until the very end of the process,
when a considerable amount of capital has already been invested, (Blank, 2005; Furr &
Ahlstrom, 2011, Ries, 2011).
This process of product development may make sense for established firms that have more
capital to spend, but it is unfavorable for startups with limited financial resources, (Furr &
Ahlstrom, 2011). Startups are characterized by a high degree of uncertainty, and a critical
mission for entrepreneurs is therefore to effectively manage the uncertainty associated with the
founding of a new company, (Blank & Dorf, 2012).
Traditionally and still today, a common advice for entrepreneurs has been to write a solid
business plan, e.g. to consider Osterwalder’s business model canvas before starting off and
spending capital, (Furr & Ahlstrom, 2011). However, the advantages and benefits of writing
business plans for startups have become criticized and largely questioned in recent years,
(Ries, 2011; Blank, 2005). The only favorable reason for writing a business plan is that it is often
required to raise venture capital, but the business plan itself is not considered a key element for
success, (Lange et al., 2007; Zacharakis & Meyer, 2000). The discussion about the suitability
for startups to write business plans can be categorized into two groups; the supporters of
9
business planning and the rest, arguing that rigid business planning discourages flexibility,
(Brinckmann, Grichnik, Kapsa, 2010).
2.1.3 Developments and Concepts of LSM
Preceding Eric Ries, Steve Blank published his book "The Four Steps to the Epiphany:
Successful Strategies for Products that Win," in 2005. In entrepreneurship circles, this book is
considered as the source of the Customer Development methodology. Blank here outlines his
views on entrepreneurship: “Entrepreneurship is a practice that can actually be managed rather
than an art which must be passively experienced”, (Blank, 2005, p.127). Blank experienced how
previous methods of developing new concepts and ideas such as “Design Thinking” ignore the
fact that many startups have limited resources. Blank therefore developed a method for keeping
costs down, testing different hypotheses about customers, minimizing time spent and focusing
on the entire process of finding a scalable business model, (Blank, 2005).
In 2012, Steve Blank with his co-author Bob Dorf published "The Startup Owner's Manual",
which is a revised version of “The Four Steps to Epiphany” and emphasizes the importance of
rigorous and repeated testing. The book was designed to be used as an "encyclopedia and a
blueprint” for startups to make them succeed, (Blank & Dorf, 2012). This book has already
become one of the top five most popular works on startup literature and has a high academic
status in its category. Despite its short existence of less than a year, it has already been
incorporated as course literature on entrepreneurship at prominent universities such as
Berkeley, Stanford and MIT, (Blank, 2012).
The LSM literature contains several examples of failure and success to educate the reader in
decision-making for startups and to note common pitfalls and challenges typically encountered.
LSM also has a general focus on finding a business model that is scalable, which of course is
not suitable for all startups, (Blank & Dorf, 2012). In addition, it has an overweight of examples
from the IT industry, which affects its applicability for other types of startups with other aims.
Blank & Dorf (2012) divide their literature in two; one for general startups and one for web- and
IT application based startups.
The Product-Market fit is a central component of the LSM. It deals with all the issues of
developing a product that sells; i.e. meet the requirements of the customer segment in the
10
targeted market. A product-market fit is defined as “being in a good market with a product that
can satisfy that market”, (Andersson, 2007). Blank & Dorf (2005, p.97) has a more narrow
definition of a product-market fit, which is; “whether the startup has found a repeatable and
scalable sales model or not”. According to LSM, a startup must first identify a product-market fit
with a scalable sales model before it proceeds to start scaling the business, (Blank & Dorf 2012;
Furr & Ahlstrom, 2011).
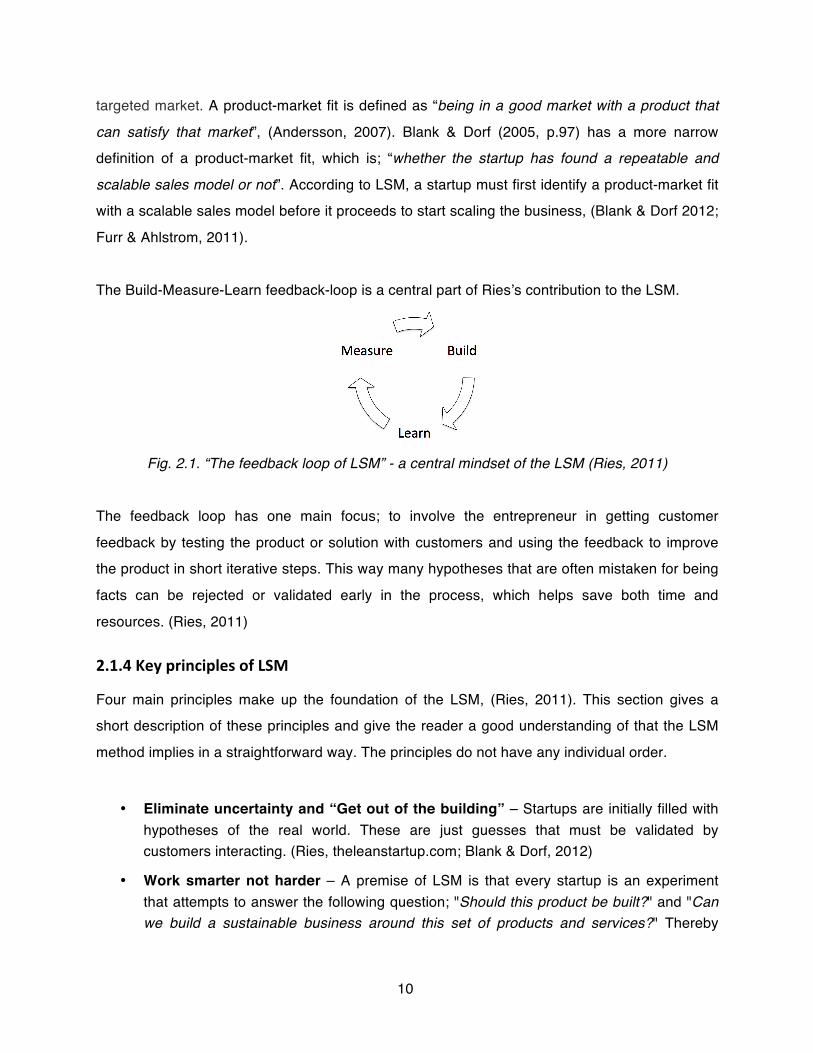
The Build-Measure-Learn feedback-loop is a central part of Ries’s contribution to the LSM.
Fig. 2.1. “The feedback loop of LSM” - a central mindset of the LSM (Ries, 2011)
The feedback loop has one main focus; to involve the entrepreneur in getting customer
feedback by testing the product or solution with customers and using the feedback to improve
the product in short iterative steps. This way many hypotheses that are often mistaken for being
facts can be rejected or validated early in the process, which helps save both time and
resources. (Ries, 2011)
2.1.4 Key principles of LSM
Four main principles make up the foundation of the LSM, (Ries, 2011). This section gives a
short description of these principles and give the reader a good understanding of that the LSM
method implies in a straightforward way. The principles do not have any individual order.
• Eliminate uncertainty and “Get out of the building” – Startups are initially filled with hypotheses of the real world. These are just guesses that must be validated by customers interacting. (Ries, theleanstartup.com; Blank & Dorf, 2012)
• Work smarter not harder – A premise of LSM is that every startup is an experiment that attempts to answer the following question; "Should this product be built?" and "Can we build a sustainable business around this set of products and services?" Thereby

11
working smarter and with less market risk. “By the time that product is ready to be distributed widely, it will already have established customers.” (Ries, theleanstartup.com)
• Develop an MVP – the build-measure-learn feedback loop is a central roll of LSM. The first step is to figure out the problem that needs to be solved and then develop a minimum viable product (MVP) to begin the process of learning as quickly as possible. (Ries, theleanstartup.com)
• Validated learning – startups want to learn how to build a successful business model why entrepreneurs should validate all facts with empirical data generated from customers. Especially Ries (2011) advocates entrepreneurs to keep a systematic and experimental mindset and test all hypotheses. “The unit of progress for Lean Startups is validated learning - a rigorous method for demonstrating progress when one is embedded in the soil of extreme uncertainty”, (Ries, theleanstartup.com).
2.2 The Customer Discovery framework This section gives a more detailed review of the Customer Discovery framework. First the whole
concept of Customer Development is explained, of which Customer Discovery constitutes the
first part, followed by a closer explanation of Customer Discovery and the four phases
framework that make up this method. Concepts of LSM are woven into this chapter to illustrate
how the literature and concepts relate to each other.
2.2.1 Customer Development Methodology
Steve Blank developed the Customer Development Methodology in the mid 1990s. It is a
method that gives a systematic framework for startups and entrepreneurs of how to develop
products more successfully and with less market risk by developing better understanding of
customers. The Customer Development process is conducted parallel to the Product
Development process, to create a balanced relationship between developing the product and
understanding customers’ needs. (Blank & Dorf, 2012)
There are cases where using the Customer Development methodology is inappropriate.
According to Blank & Dorf, 2012, there are two main types of risks that affect early-stage
ventures: invention risk and customer/market risk or a combination of the two. Invention risk is
where it is uncertain if the product can even be developed at all, which cannot be solved by this
12
methodology. When the issues are customer acceptance and market adoption, this
methodology shows the path and startups wanting to solve customer and market risk should
follow this path to do so, (Blank & Dorf, 2012).
The Customer Development framework consists of four blocks: Customer Discovery, Customer
Validation, Customer Creation and Company Building. Customer Discovery focuses on testing
hypotheses and understanding customer problems by forcing the founders to get in touch with
customers. Customer Validation focuses more on the uncertainty of developing a suitable sales
model that can be replicated and scaled, (Blank & Dorf, 2012). Blank & Dorf (2012) describes
these two steps as the most powerful search steps and the specific phases associated with
these are described in subsequent chapters, the other two, Customer Creation and Company
Building are only briefly discussed.
The book is divided into two parallel tracks, one relating to physical products and channels and
the other to web/mobile products and channels. It is advised that the reader looks through both
sections before turning to “their” track. The reason for not writing two books is that both tracks
have common vantage points and aim at solving the same problem although operating at
different speeds, as web companies can often search and test much faster than startups
developing physical products, (Blank, 2012). This thesis focuses on the physical track for the
Customer Discovery part of the method.
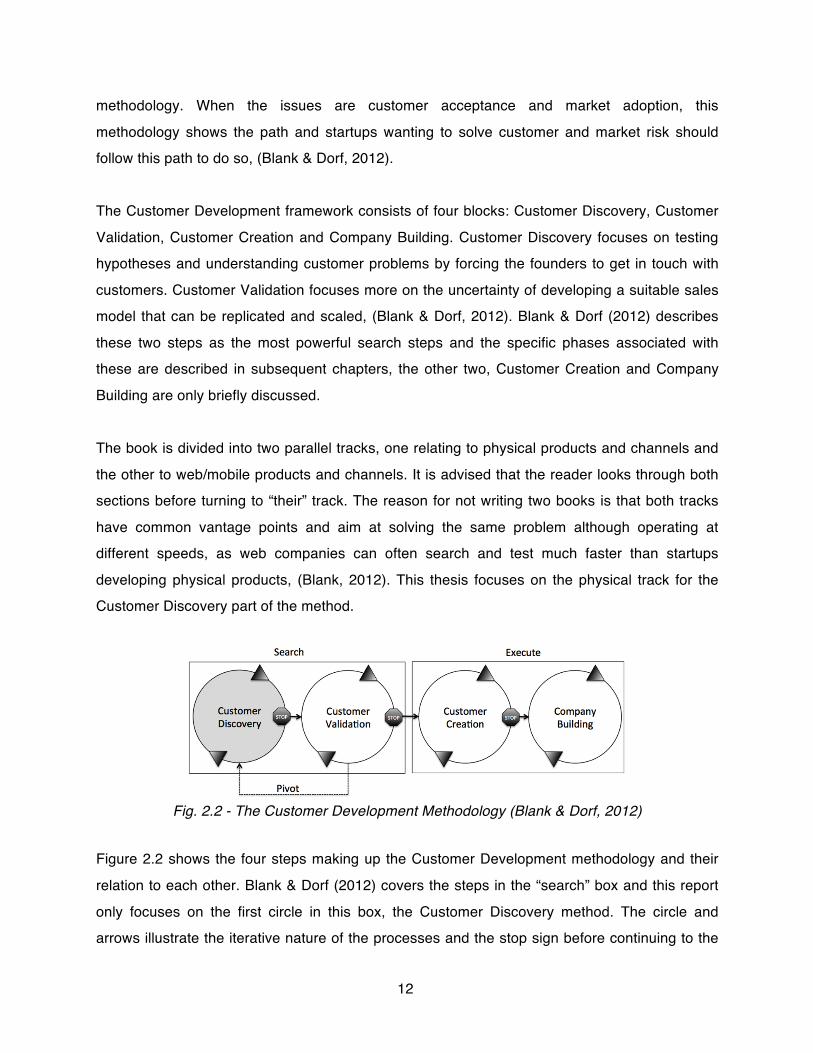
Fig. 2.2 - The Customer Development Methodology (Blank & Dorf, 2012)
Figure 2.2 shows the four steps making up the Customer Development methodology and their
relation to each other. Blank & Dorf (2012) covers the steps in the “search” box and this report
only focuses on the first circle in this box, the Customer Discovery method. The circle and
arrows illustrate the iterative nature of the processes and the stop sign before continuing to the

13
next step illustrates pivoting or proceeding, pivoting back to Customer Discovery may be
necessary depending on the results of the Customer Validation.
2.2.2 An Introduction to Customer Discovery
The Customer Discovery method consists of four steps illustrated in the figure 2.3.
Fig. 2.3. - Outline of the Customer Discovery process
In the first step, the founders are guided to state several hypotheses about its future business
model. In step two, the founders must “get out of the building”, (Blank & Dorf, 2012, p.51), and
start talking to real customers and test their hypotheses. The hypotheses are inaccurate initially;
“No startup business plan survives first contact with customers”, Blank & Dorf, (2012, p.53). In
the third step, “test the solution”, founders interact with customers once again, this time
presenting the solution. In the fourth step, the updated hypotheses are once again tested and
validated with customers and, depending on the outcome, it is necessary to either pivot or
proceed, (Blank & Dorf, 2012).
During Customer Discovery founders should not try to please all customers but instead focus on
developing; “a product for the few, not the many”, (Blank & Dorf, 2012, p.47). During the
Customer Discovery process the startup is searching for a problem-solution fit, i.e. a product-
market fit, that makes the startup’s value proposition match the customer segment the startup
envisions reaching. The reason for concentrating on a limited number of customers is that it to
design the vision into a Minimum Viable Product (MVP) to catch the interest of a small group of
initial customers called “Earlyvangelists”. These are visionary customers who buy unfinished
and untested products and every industry has a small subset of these visionaries willing to take

14
a leap of faith on an early product. Earlyvangelists are used to test the entire buying process. If
they aren’t willing to pay for the product, they aren't Earlyvangelists and you have to continue
your search.
Fig. 2.4. - Earlyvangelist Characteristics (Blank & Dorf, 2012, p.59)
The founders have first hand experience of every part of the business model and therefore, the
customer development should be run by them, (Blank & Dorf, 2012). “Only a founder can
embrace the feedback, react to it, and adeptly make the decisions necessary to change or pivot
key business model components”, (Blank & Dorf, 2012, p.32).
Failure is an integral part when searching for a solution. As a tool for learning the founders must
not be afraid of making continuous iterations and eventually pivot. However, this is easier said
than done, especially with huge amounts of sunk costs. Blank & Dorf (2012) advises Customer
Discovery to be paired with, and done parallel to, agile engineering/development of the physical
product.
It is also important to settle with the type of market the founders’ envision approaching. The
traditional product introduction model works when introducing a product into an existing market
with a known business model. For a majority of startups, the markets they are approaching are
unknown, why also the customers are unknown. Blank & Dorf, (2012, p.39), sums it up: “market
type influences everything a company does” and “different market types require dramatically
different discovery methods, MVPs, and sales and marketing strategies”.
15
In a new market the company creates something that never existed before that lets customers
do things they could not do before. New markets have by definition no customers yet, so there is
no one to know what the product should look like or what it should do or why customers should
buy it. Getting feedback from users and creating demand is particularly challenging with an
unknown product and undefined market. As the market is costly to develop it is important to
avoid classic errors like fast spending on sales and marketing, before the product is validated
with customers. Companies should understand that the way to win is not competing with other
companies but instead to locate a large enough set of customers and convince these that the
new company’s market vision is real and solves a real problem in a different way. (Blank & Dorf,
2012)
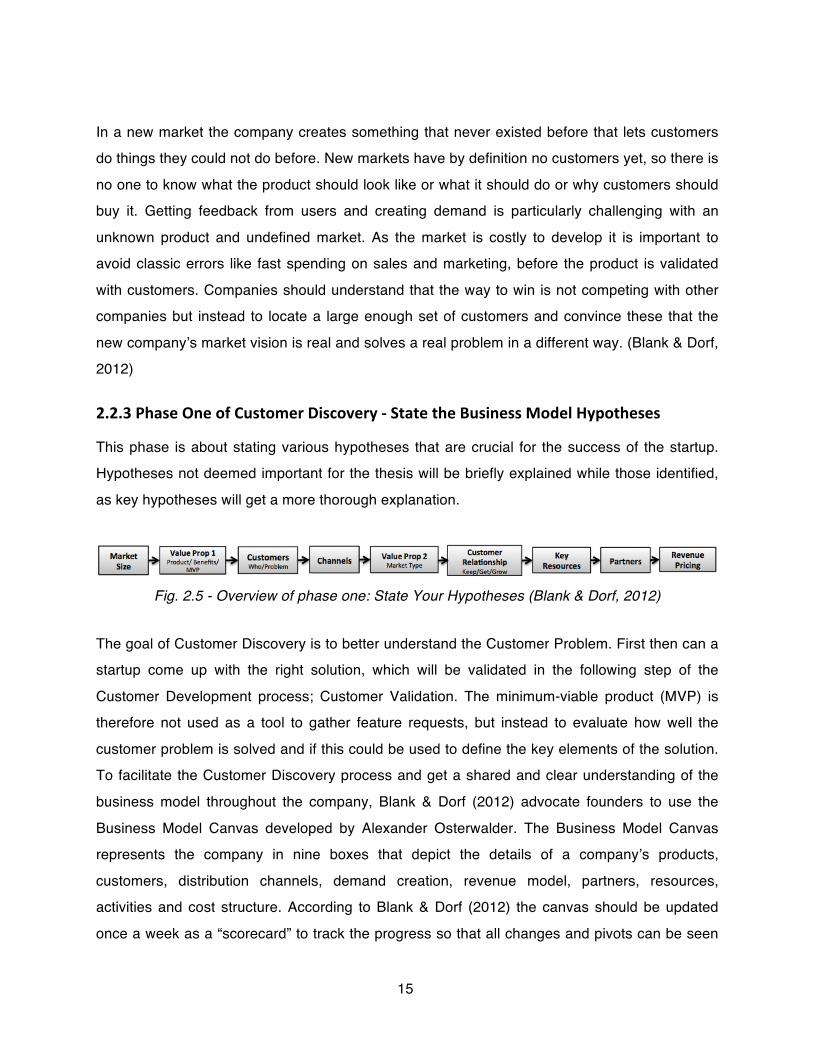
2.2.3 Phase One of Customer Discovery -‐ State the Business Model Hypotheses
This phase is about stating various hypotheses that are crucial for the success of the startup.
Hypotheses not deemed important for the thesis will be briefly explained while those identified,
as key hypotheses will get a more thorough explanation.
Fig. 2.5 - Overview of phase one: State Your Hypotheses (Blank & Dorf, 2012)
The goal of Customer Discovery is to better understand the Customer Problem. First then can a
startup come up with the right solution, which will be validated in the following step of the
Customer Development process; Customer Validation. The minimum-viable product (MVP) is
therefore not used as a tool to gather feature requests, but instead to evaluate how well the
customer problem is solved and if this could be used to define the key elements of the solution.
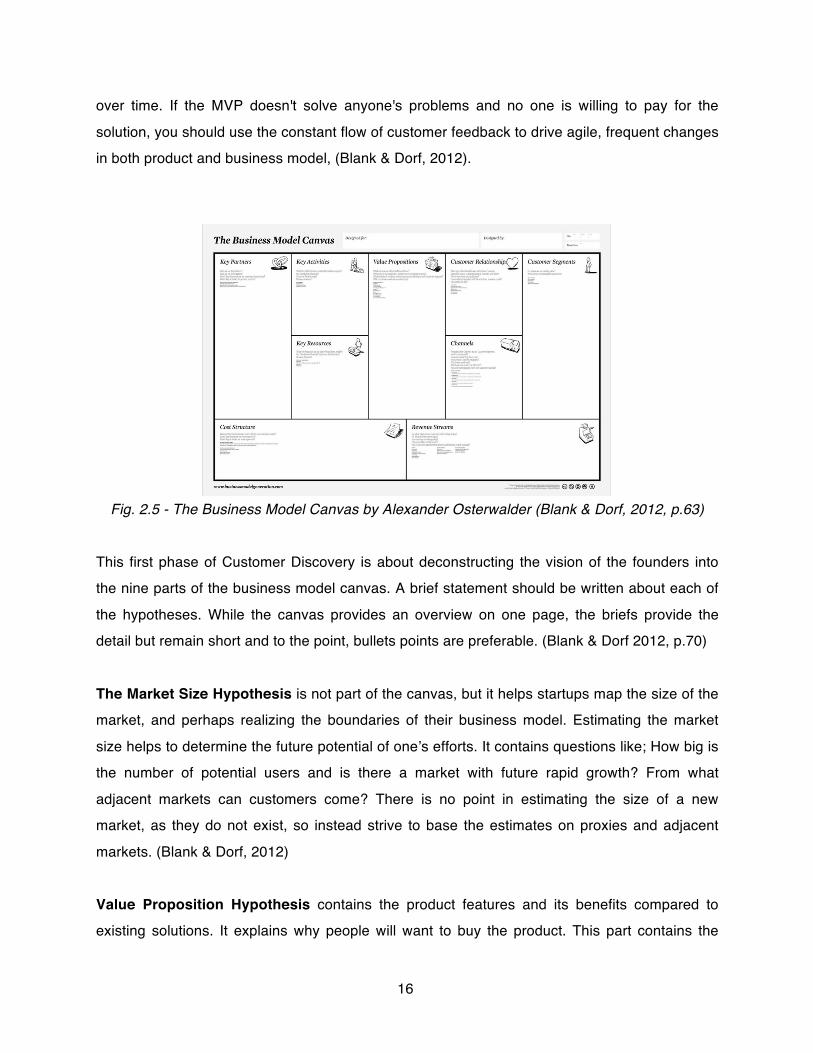
To facilitate the Customer Discovery process and get a shared and clear understanding of the
business model throughout the company, Blank & Dorf (2012) advocate founders to use the
Business Model Canvas developed by Alexander Osterwalder. The Business Model Canvas
represents the company in nine boxes that depict the details of a company’s products,
customers, distribution channels, demand creation, revenue model, partners, resources,
activities and cost structure. According to Blank & Dorf (2012) the canvas should be updated
once a week as a “scorecard” to track the progress so that all changes and pivots can be seen
16
over time. If the MVP doesn't solve anyone's problems and no one is willing to pay for the
solution, you should use the constant flow of customer feedback to drive agile, frequent changes
in both product and business model, (Blank & Dorf, 2012).
Fig. 2.5 - The Business Model Canvas by Alexander Osterwalder (Blank & Dorf, 2012, p.63)
This first phase of Customer Discovery is about deconstructing the vision of the founders into
the nine parts of the business model canvas. A brief statement should be written about each of
the hypotheses. While the canvas provides an overview on one page, the briefs provide the
detail but remain short and to the point, bullets points are preferable. (Blank & Dorf 2012, p.70)
The Market Size Hypothesis is not part of the canvas, but it helps startups map the size of the
market, and perhaps realizing the boundaries of their business model. Estimating the market
size helps to determine the future potential of one’s efforts. It contains questions like; How big is
the number of potential users and is there a market with future rapid growth? From what
adjacent markets can customers come? There is no point in estimating the size of a new
market, as they do not exist, so instead strive to base the estimates on proxies and adjacent
markets. (Blank & Dorf, 2012)
Value Proposition Hypothesis contains the product features and its benefits compared to
existing solutions. It explains why people will want to buy the product. This part contains the
17
hypothesis of what a Minimum Viable Product will look like; i.e. what is the smallest set of
features that will work and still drive sells? (Blank & Dorf, 2012)
The Customer Segment: Who/Problem Hypothesis is where the customers are described
together with the problems, needs or passions they have. Not every product solves problems.
Products can also provide entertainment or serve to express luxury. The hypothesis can also be
stated about the customer’s emotional wants and desires. Blank & Dorf, (2012, p.86), writes
“describe how to convince these customers that the product can deliver an emotional payoff:
glamour, beauty, wealth, prestige, a hot date or lost pounds”. It is important to figure out what
type of customer you are approaching. Is the type of customer an end user and a decision
maker etc. To understand your customers you can for example learn about how they work and
imagine “a day in the life of a customer”, Blank & Dorf, (2012, p.90). As customers usually do
not work by themselves you should also write down an organization/influence maps, describing
connections and interactions between them, (Blank & Dorf, 2012).
The Channels Hypothesis describes how the product will get from the company to the
customers. Consider whether the product fits with the channel, if you are going to use direct
sales or retailers etc. The company should complete customer validation before investing too
heavily on a particular sales channel. (Blank & Dorf, 2012)
The Value Proposition 2: Market-Type and Competitive Hypothesis describes which type of
market that the startup chooses to approach. According to Blank & Dorf (2012) there are four
types of markets; existing market, re-segmented market, new market or clone market. The right
entering strategy and strategy for how to handle competitors is critical, why the consequences of
deciding on the wrong market type are severe. The problem for a company entering a new
market is not market share battles but instead that there are no existing customers yet and that
the market therefore has to be “created”. Blank & Dorf, (2012) p.121, writes that “new-market
entries are by far the most expensive demand-creation challenges”, particularly since there
exists no comparable references for the customers. Questions to consider when entering a new
market are; from what adjacent markets can customers and competitors come from? Why will
lots of people care about your product? How will demand be created? What will keep powerful
competitors out once the product is launched? It is tempting to think that a new market means
no competition, but there will always be substitutes, (Blank & Dorf, 2012).
18
The Customer Relationship Hypothesis describes how you get customers into your sales
channel, how to keep them as customers and how to grow additional revenue from them over
time. (Blank & Dorf, 2012)
The Key Resources Hypothesis identifies both external resources critical to the company’s
success and how the company will assure that these resources are available. Resources can be
of physical and financial nature but also intangible as experts or intellectual property. (Blank &
Dorf, 2012)
The Partner Hypothesis names the key-partners that provide capabilities, products, or
services that the startup either cannot or would prefer not to develop itself. (Blank & Dorf, 2012)
The Revenue and Pricing Hypothesis may be the toughest hypothesis but is critically
important and asks four questions;
• How many will we sell?
• What is the revenue model?
• How much will we charge?
• Does this add up to a business that is worth doing?
When all the hypotheses are finished, all team members should meet and read through the
summaries and agree on the final version for each of them and update the business model
accordingly. It is now time to get out of the building. (Blank & Dorf, 2012)
The equivalent of the “Stating hypotheses-part” of the Customer Discovery in Furr & Ahlstrom’s
book “Nail it then Scale It, (2011), is referred to as “Write down your Monetizable Pain
Hyptohesis”, (Furr & Ahlstrom, 2011, p. 67). This approach is broader than Blank & Dorf’s
approach and Furr & Ahlstrom (2011) advocates that this first broad hypothesis “the Big Idea
Hypothesis” should be tested before the hypotheses about the MVP are stated.
2.2.4 Phase Two of the Customer Discovery -‐ Test the Problem
During this second phase of the Customer Discovery, Testing the Problem, the startup team
should “The first thing you should do is get the hell out of the building”, (Furr & Ahlstrom, 2011,
p.37) and test if their hypotheses are correct and if people recognize and care enough about the
19
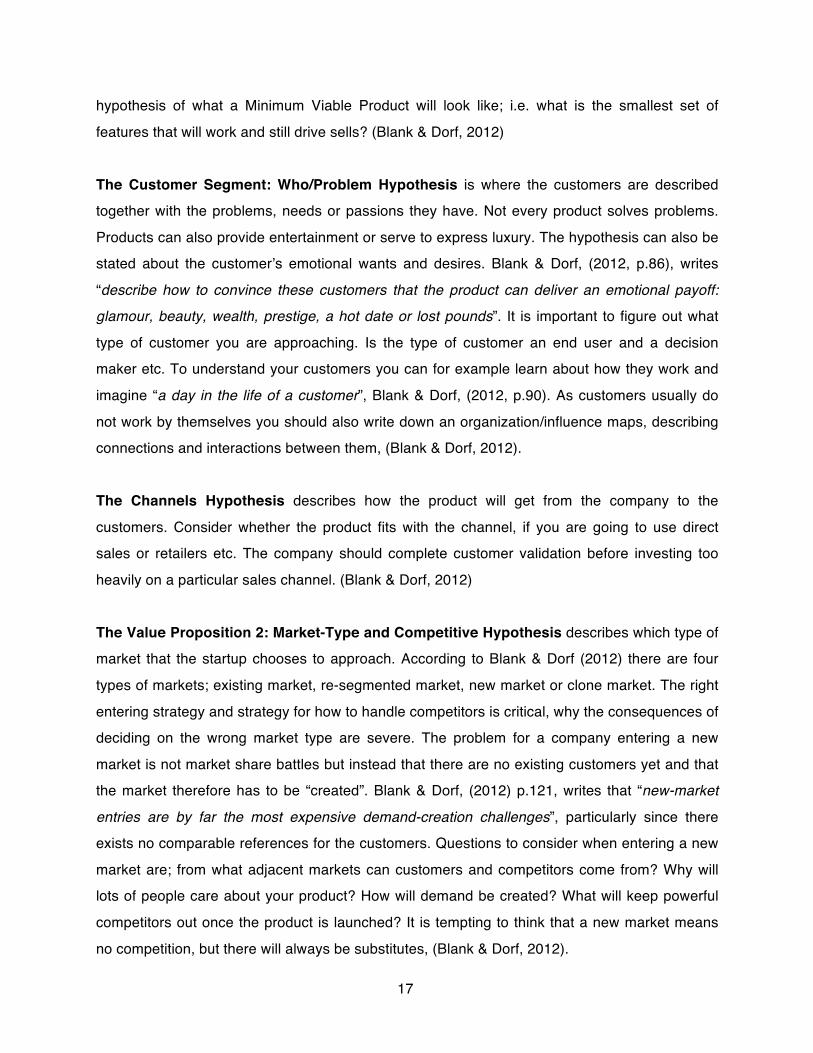
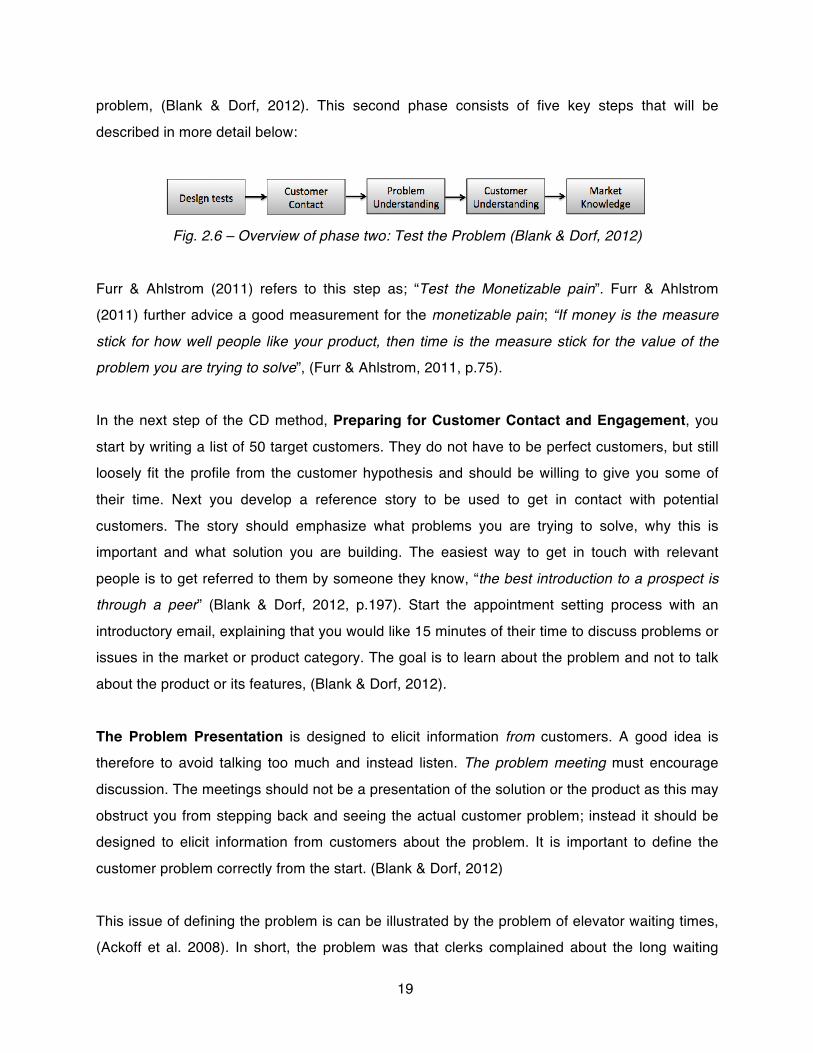
problem, (Blank & Dorf, 2012). This second phase consists of five key steps that will be
described in more detail below:
Fig. 2.6 – Overview of phase two: Test the Problem (Blank & Dorf, 2012)
Furr & Ahlstrom (2011) refers to this step as; “Test the Monetizable pain”. Furr & Ahlstrom
(2011) further advice a good measurement for the monetizable pain; “If money is the measure
stick for how well people like your product, then time is the measure stick for the value of the
problem you are trying to solve”, (Furr & Ahlstrom, 2011, p.75).
In the next step of the CD method, Preparing for Customer Contact and Engagement, you
start by writing a list of 50 target customers. They do not have to be perfect customers, but still
loosely fit the profile from the customer hypothesis and should be willing to give you some of
their time. Next you develop a reference story to be used to get in contact with potential
customers. The story should emphasize what problems you are trying to solve, why this is
important and what solution you are building. The easiest way to get in touch with relevant
people is to get referred to them by someone they know, “the best introduction to a prospect is
through a peer” (Blank & Dorf, 2012, p.197). Start the appointment setting process with an
introductory email, explaining that you would like 15 minutes of their time to discuss problems or
issues in the market or product category. The goal is to learn about the problem and not to talk
about the product or its features, (Blank & Dorf, 2012).
The Problem Presentation is designed to elicit information from customers. A good idea is
therefore to avoid talking too much and instead listen. The problem meeting must encourage
discussion. The meetings should not be a presentation of the solution or the product as this may
obstruct you from stepping back and seeing the actual customer problem; instead it should be
designed to elicit information from customers about the problem. It is important to define the
customer problem correctly from the start. (Blank & Dorf, 2012)
This issue of defining the problem is can be illustrated by the problem of elevator waiting times,
(Ackoff et al. 2008). In short, the problem was that clerks complained about the long waiting
20
times for the elevator in an office building. Instead of investing in a faster elevator, the manager
installed mirrors in front of the elevators that “entertained” the clerks so they perceived the
waiting times to decrease; problem solved. If you had surveyed the problem by simply asking
about the problem, you would most likely not have come up with that solution, (Ackoff et al.
2008). Further more, if you give or show your solution before asking about the problem it will be
difficult to step back and see the customer problem from a wider perspective, (Furr & Ahlstrom,
2011; Blank & Dorf, 2012).
The first goal of the problem meeting is to map the customers’ problems and how customers
evaluate these problems. A second goal is trying to understand how these problems are solved
today. A final product, or what is perceived as a final product, many times make you focus on
the solution, which can be deceiving and obstruct you from understanding the actual customer
problem, (Blank & Dorf, 2012). Furr & Ahstrom (2011, p.70) says; “As soon as you build
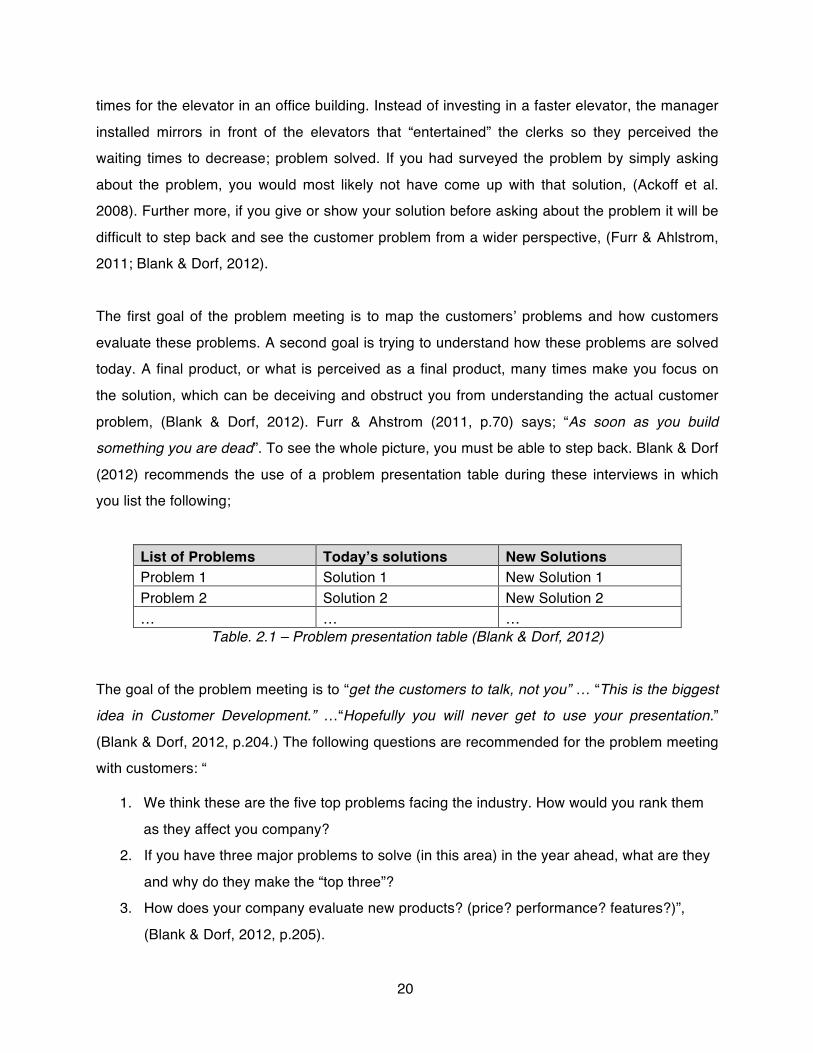
something you are dead”. To see the whole picture, you must be able to step back. Blank & Dorf
(2012) recommends the use of a problem presentation table during these interviews in which
you list the following;
List of Problems Today’s solutions New Solutions Problem 1 Solution 1 New Solution 1 Problem 2 Solution 2 New Solution 2 … … …
Table. 2.1 – Problem presentation table (Blank & Dorf, 2012)
The goal of the problem meeting is to “get the customers to talk, not you” … “This is the biggest
idea in Customer Development.” …“Hopefully you will never get to use your presentation.”
(Blank & Dorf, 2012, p.204.) The following questions are recommended for the problem meeting
with customers: “
1. We think these are the five top problems facing the industry. How would you rank them
as they affect you company?
2. If you have three major problems to solve (in this area) in the year ahead, what are they
and why do they make the “top three”?
3. How does your company evaluate new products? (price? performance? features?)”,
(Blank & Dorf, 2012, p.205).
21
You should end the problem meetings with presenting your solution for how you plan to solve
the problem. Pause and watch the consumers’ reaction. Do they understand it? Do you have to
spend 20 minutes to explain the solution? Why? In a new market there is no context and no
problem and people may not recognize they have the problem of your hypothesis. It is therefore
difficult to use a problem presentation. For NPNM, Blank & Dorf (2012) recommends the use of
a “problem–and–solution presentation“ during the problem meeting to describe the startup’s
vision, without specifying features, and thereby try to extract information about the customer
problem. The problem and solution presentation is assumed to be a combination of the problem
and the solution presentation, but is not explained in the literature.
Customer feedback should provide “additional insight, not numerical data”, (Blank & Dorf, 2012,
p.205). One commonly used example of this is “the likelihood that if Henry Ford had asked
customers what they wanted, they would have said: a faster horse”, (Blank & Dorf, 2012, p.207).
It is a serious warning sign if you can’t find any Earlyvangelists who share your vision. After the
first customer interaction the customer data should be amalgamated and “scored” to help gauge
if enough Earlyvangelist candidates were identified. After enough interviews the founders should
be able to determine what the customer problem is and update the hypothesis accordingly,
(Blank & Dorf, 2012).
Market knowledge should also be captured by reading reports on the markets, adjacent markets
and through listening to competitors and other market actors. Quantitative data should be
gathered and evaluated to learn about the market, other products and competitor. Industry
conferences and trade shows are invaluable and essential for spotting trends and competitive
and adjacent products. (Blank & Dorf, 2012)
2.2.5 Phase Three of Customer Discovery -‐ Test the Solution
The previous phase tested the customer problem and this phase tests whether the solution, or
the value proposition, gets customers enthusiastic enough about buying the product. This phase
consists of five key steps that will be described in more detail below:
22
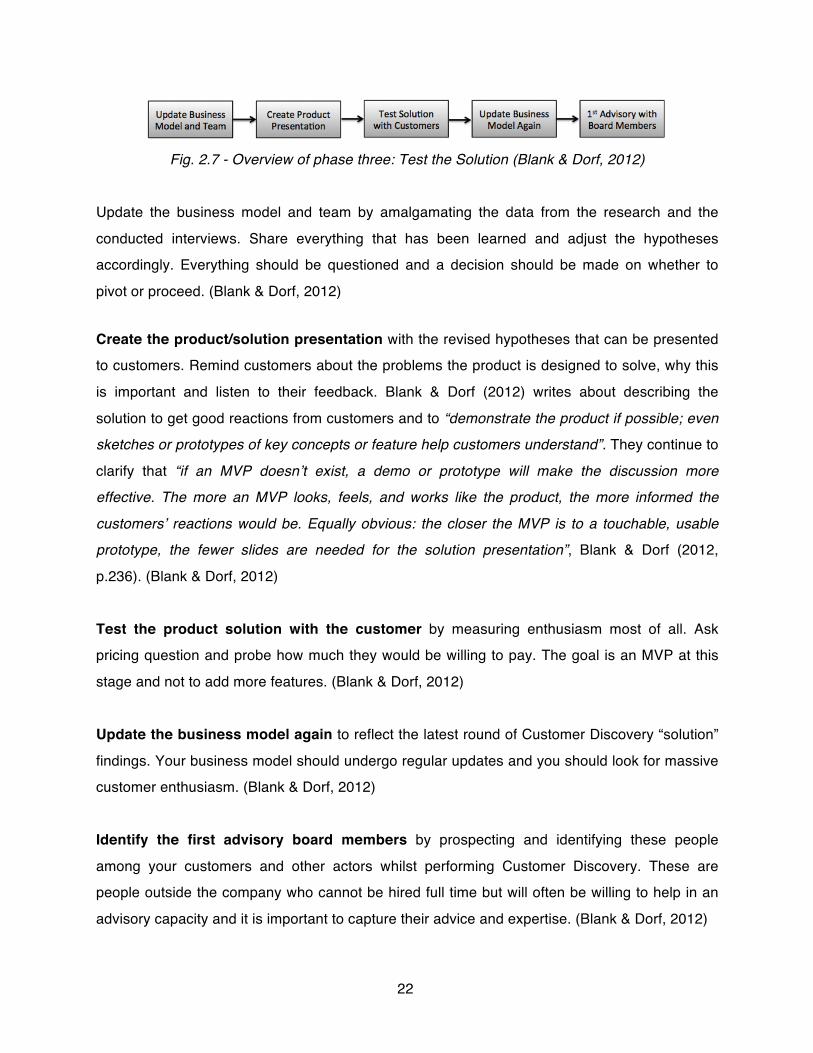
Fig. 2.7 - Overview of phase three: Test the Solution (Blank & Dorf, 2012)
Update the business model and team by amalgamating the data from the research and the
conducted interviews. Share everything that has been learned and adjust the hypotheses
accordingly. Everything should be questioned and a decision should be made on whether to
pivot or proceed. (Blank & Dorf, 2012)
Create the product/solution presentation with the revised hypotheses that can be presented
to customers. Remind customers about the problems the product is designed to solve, why this
is important and listen to their feedback. Blank & Dorf (2012) writes about describing the
solution to get good reactions from customers and to “demonstrate the product if possible; even
sketches or prototypes of key concepts or feature help customers understand”. They continue to
clarify that “if an MVP doesn’t exist, a demo or prototype will make the discussion more
effective. The more an MVP looks, feels, and works like the product, the more informed the
customers’ reactions would be. Equally obvious: the closer the MVP is to a touchable, usable
prototype, the fewer slides are needed for the solution presentation”, Blank & Dorf (2012,
p.236). (Blank & Dorf, 2012)
Test the product solution with the customer by measuring enthusiasm most of all. Ask
pricing question and probe how much they would be willing to pay. The goal is an MVP at this
stage and not to add more features. (Blank & Dorf, 2012)
Update the business model again to reflect the latest round of Customer Discovery “solution”
findings. Your business model should undergo regular updates and you should look for massive
customer enthusiasm. (Blank & Dorf, 2012)
Identify the first advisory board members by prospecting and identifying these people
among your customers and other actors whilst performing Customer Discovery. These are
people outside the company who cannot be hired full time but will often be willing to help in an
advisory capacity and it is important to capture their advice and expertise. (Blank & Dorf, 2012)
23
2.2.6 Phase Four of Customer Discovery -‐ Verify or Pivot
“Has your Customer Discovery effort turned your hypotheses into hard facts? Do you believe it
is time to proceed to customer validation and is your business model ready to be scaled?”
(Blank & Dorf, 2012) There are three critical questions to answer, each containing several sub
questions:
• Have we found a product/market fit? Is there sizable demand for solving the problem,
i.e. are there enough customers to create a sizable business opportunity? Are you
attacking a serious problem or filling a compelling need and does your product solve the
problem or fill the need for your customers? (Blank & Dorf, 2012). Furr & Ahstrom (2011)
address this as; is the “monetizable pain” large enough?
• Who are our customers and how do we reach them? Do we know the archetypes of
our key target customers and understand enough about their behavior to know how to
find them cost-effectively? Can you draw a customer archetype for each of your key
customer segments? Can you draw a day in the life of a customer so you know how to
pitch the product to him? Do you know what trade shows they attend or where they turn
to for new product information? Can you draw a channel map of how the products move
from your startup to its end user? (Blank & Dorf, 2012)
• Can we make money and grow the company? Can we grow predictably and become
large enough to make a great company? Assemble revenue model data, sales revenue
expectations over time and estimate the market size etc. Create revenue forecast for at
least a year so that the company can survive the next phase of Customer Validation.
(Blank & Dorf, 2012)
After asking yourself and answering these questions you have to assess if the modified
hypotheses can provide a sound foundation to move forward. Thus you have to decide on
whether to pivot or proceed. If potential customers have validated the product, and a base of
prospects has evolved, you are then ready to proceed to Customer Validation. By now, you
should have identified a serious problem that enough customers would gladly pay for to have
solved by your solution and identified a large enough market to create a scalable business
24
model. You should also be able to draw a day in the life of the customer before and after the
purchase of our product, and an organizational chart of users, buyers and channels. If these
criteria are met and the business model is solid, you should continue to the next step, to
Customer Validation. If the criteria are not met, go back to Customer Discovery or pivot. (Blank
& Dorf, 2012)
2.3 Additional Concepts This section contains concepts that are not part of the LSM but for other reasons meaningful to
the thesis.
2.3.1 What makes a New Market
The concept of New Market is important to define, as it is part of the scope of the thesis. New
Market and Market Creation are concepts often used in management and marketing literature.
The term is usually regarded as self-explaining. Creation of a “totally” new market is seldom to
be found and given that market creation is perceiver specific, there are few examples of a totally
new market creation, i.e. when all stakeholders perceive that a new market has been created.
(Tollin & Carú, 2008)
Blank & Dorf (2012) identifies four different types of markets: Existing Market, New Market
Segmentation, Clone Business Model and New Market. Acquiring useful customer feedback is a
general challenge and in particular when developing a product that differentiates itself enough to
create a New Market, (Blank & Dorf, 2012, pages 39-41).
To define the concept of a New Market it is necessary to first specify what is meant with a
Market. A market can be defined as a “social arrangement that allows buyers and sellers to
exchange information, goods, services, and financial means”, (Tollin & Carú, 2008, p.175). This
definition is based on four elements: buyers, sellers, social arrangements and exchange. The
absence of any of these first three elements obstructs exchange of goods or services and thus
eliminates the existence of a market. Consequently one can argue that changing any of these
elements could be perceived as a creation of a market, i.e. a market that is different from any
before, (Tollin & Carú, 2008, pp. 173-178).
25
This report focuses on market creation by New Exchange Content, driven by product innovation.
But how much different must the exchange content be to be perceived creating a (new) Market?
This report relies on Tollin & Carú’s (2008) clarification of what makes a New Market; as long as
the product is perceived to deviate enough from all other products to create a new market, it
does create a new market, (Tollin & Carú’s, 2008). This report uses the following definition of
what a new market is: “A social arrangement in which buyers and sellers exchange money for a
new category of products that differentiates itself clearly from all other product categories”,
(Tollin & Carú’s, 2008, p.176).
2.3.2 Low Fidelity Prototypes
Low fidelity prototypes have limited function and or limited interaction efforts and they are
constructed to depict concepts, design alternatives, and screen layouts, rather than to model
user interaction with a system. In general, low fidelity prototypes are constructed quickly and
provide limited or no functionality. (Rudd et. al., 1996) In business research, low fidelity
prototypes are usually used as prompts in connection with structured interviewing or
experiments to entice people to talk about what is presented to them. One advantage of using
low fidelity prototypes is that it helps to overcome the interviewees’ discomfort in being
interviewed and it may also encourage them to discuss issues in more detail, (Bryman & Bell,
2011). Considering Roger’s five factors and his work on the diffusion of innovations, an image
should increase the “observability" and perceived simplicity of the product, (Roger, 1995).
From this reasoning, low fidelity prototypes should be beneficial during interviews as they
increase the quality of the feedback and facilitate interaction. According to Blank & Dorf (2012),
simple sketches or mockups should be used as first the prototypes. The same authors continue
to explain that the purpose of these first interviews is to fail fast, in order to learn fast. The
prototypes should therefore be simple and developed without spending too many resources,
(Blank & Dorf, 2012). At the same time, a too rough prototype risks sending dubious and
unserious signals of the concept, (Farnum, 2002). For the same reason it is important that also
low fidelity prototypes look like promising concepts, and not as unfinished, thoughtless
concepts. Furthermore, it is argued that low fidelity prototypes have limited use for researching
some forms of conspicuous consumption, (Farnum, 2002).
26
2.3.3 The Kano Model
The Kano model classifies customers’ preferences into different categories depending on to
what degree they satisfy customers and how well it is implemented. Professor Noriaki Kano
developed the Kano model in the 1980s as a theory of product development and customer
satisfaction. The classification of attributes is useful for guiding design decisions as it shows
how customers perceive the attributes. The Kano model is useful for identifying and
understanding customer needs, determining functional requirements and developing new
concepts. (Ullman, 1996)
The three main categories of the model are:
• Basic or Must-be attributes do not cause any satisfaction when fulfilled but result in
dissatisfaction when missing. Customers are expecting these attributes to be included in
the product and are therefore unlikely to tell the company about them when asked about
quality attributes.
• Attractive or Excitement attributes are the opposite of Basic and cause satisfaction
when fulfilled but do not result in dissatisfaction when missing. As customers are
normally not expecting these attributes they too are unspoken of.
• One-dimensional or Performance attributes cause satisfaction when fulfilled and
dissatisfaction when missing. These attributes are what companies compete for and are
also spoken of and recognized by customers.
There are also two other categories, “Indifferent” and “Reverse”. These categories are rather
self-explanatory; Indifferent means that the customers are indifferent to the attribute, Reverse,
that it is a one-dimensional negative attribute, i.e. it works dissatisfyingly. A competitive product
should meet the basic attributes, maximize the performance attributes, and should include as
many excitement attributes as possible at a reasonable cost. Many product features can be
grouped into more than one category as they may change with different customer segments’
preferences. The Kano Model illustrates these relationships in a straightforward way that would
have been difficult to grasp without a tool that graphically represents them. (Ullman, 1996)

27
3. Method This chapter gives an overview of how the research was set up and conducted. It further
describes how the different parts of the study relate to each other and discusses the validity and
reliability of the study. The section is divided into three parts with the aim to simplify for the
reader. The first part deals with the overall research study referred to as the Case Study, the
second deals with the Customer Discovery project and the third with the split test survey.
3.1 The Case Study This section describes the methodology used to evaluate the implementation of the Customer
Discovery method together with the Split-test and begins with a summary to clarify the structure
of the research.
3.1.1 Research design
The first and major part of this research is the Customer Discovery project (CD project), and is
described in detail in section 3.2. In this qualitative part of the research, the CD method is
implemented on a real startup developing a new product for a new market, (NPNM), with the
purpose of identifying challenges for this method and possible workarounds. The authors of this
thesis implemented the CD method, kept a journal of the process, and the implementation was
analyzed in hindsight by studying this journal.
Customer interaction was early in the process, identified as a challenge for retrieving qualitative
customer input, because of the special nature of NPNM cases; people do not recognize they
have the problem and/or the product is unknown. Success of the CD method is dependent on
customer interaction and that valuable customer feedback is received. In the second part of this
research, a separate quantitative study, in the form of a split test, evaluates how a low fidelity
prototype, in this case a group of four images, affects the interaction with customers during the
implementation of the CD method on this NPNM startup.
This research, both the qualitative and quantitative part, is based on a real NPNM startup makes
this research and the evaluation of the CD method unique and an interesting research topic. To
clarify this research design, the term the Case Study, in this report, refers to the whole research,
28
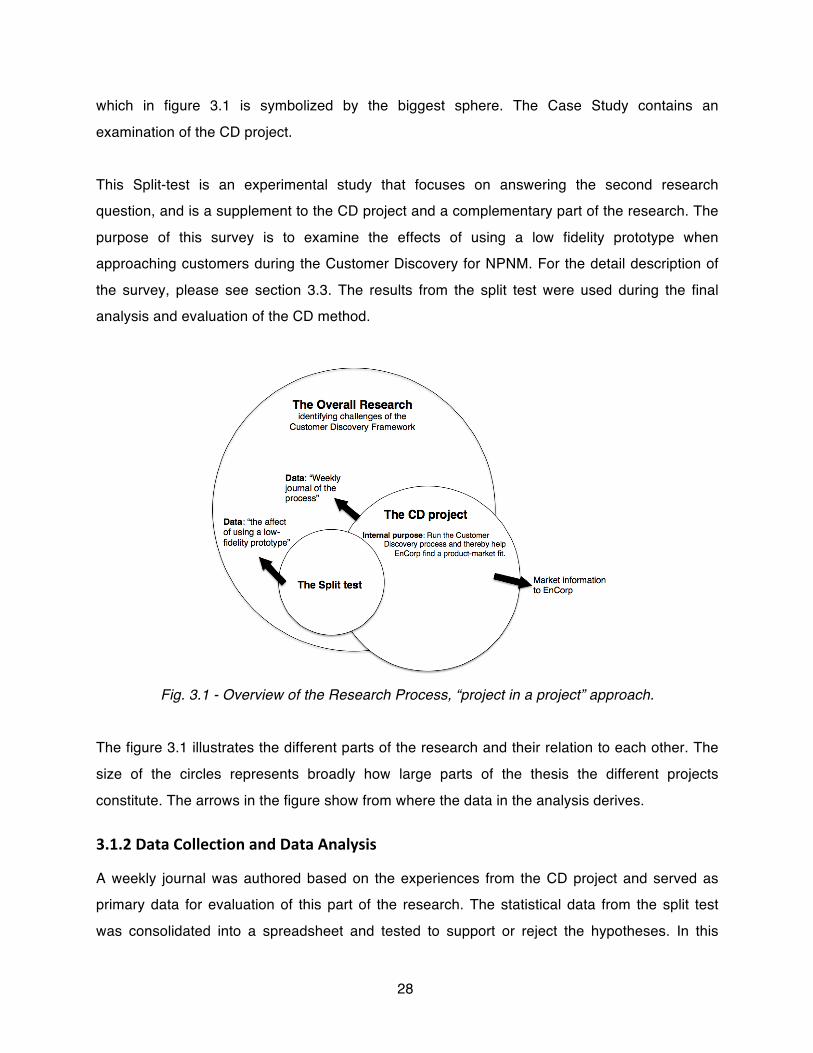
which in figure 3.1 is symbolized by the biggest sphere. The Case Study contains an
examination of the CD project.
This Split-test is an experimental study that focuses on answering the second research
question, and is a supplement to the CD project and a complementary part of the research. The
purpose of this survey is to examine the effects of using a low fidelity prototype when
approaching customers during the Customer Discovery for NPNM. For the detail description of
the survey, please see section 3.3. The results from the split test were used during the final
analysis and evaluation of the CD method.
Fig. 3.1 - Overview of the Research Process, “project in a project” approach.
The figure 3.1 illustrates the different parts of the research and their relation to each other. The
size of the circles represents broadly how large parts of the thesis the different projects
constitute. The arrows in the figure show from where the data in the analysis derives.
3.1.2 Data Collection and Data Analysis
A weekly journal was authored based on the experiences from the CD project and served as
primary data for evaluation of this part of the research. The statistical data from the split test
was consolidated into a spreadsheet and tested to support or reject the hypotheses. In this
29
paper, these two sources of data are used to identify challenges and possible workarounds for
the CD method and are compared to LSM literature. Thus, the Case Study obtains its data from
both the CD project and the split test.
The weekly journal is analyzed and compared to the CD framework. The hypotheses for the split
test are examined and the conclusions are added to the analysis of the overall study. Also
deviations of the implementation process from the CD framework are examined.
A case study research design was chosen for this research to be able to analyze the
implementation process in close detail. By conducting the CD method ourselves, we could get
first hand data that should help the understanding and analysis of the theory. Case studies are
commonly criticized for their lack of transferability and that results are not widely applicable in
real life and cannot be used for any sort of statistical generalizations, (Bryman & Bell, 2011). Yin
(2009) differentiates between statistical and analytical generalization, where analytical
generalization compares the empirical results of the case study against a template of previously
developed theory. The generalization is in this case therefore made to a theory of the
phenomenon being studied, which widens the applicability of the conclusions of the research,
(Yin, 2009).
Since the LSM literature is mainly based on examples from the IT-industry and without focus on
the special challenges associated with NPNM, the findings of this thesis extends the theory of
this area, as the findings could prove relevant also to cases outside the IT industry. The
researchers of this study are independent students and have no bias towards any of the
literature, which is why the credibility of this study, from that point of view, should not be an
issue. However, the CD method as well as LSM are developed and customized for smaller
startups, originally within the IT business. Blank & Dorf (2012) declare that the Customer
Development framework does not fit for the development of large and complex products such as
a Boeing 787, (Blank & Dorf, 2012, p. 236). The product of this case study, the e-Copter, can be
regarded as a rather complex and expensive, why it from that perspective does not make a
perfect fit with the CD method.
30
3.2 The Customer Discovery Project This section describes the CD project, how it was prepared, implemented and documented. This
section also holds a part that describes the focal company and explains why this startup is a
suitable case for this research.
3.2.1 Research Design
An implementation project was set up and conducted to identify challenges and possible
workarounds for implementing the CD method for NPNM startups. The founders of the startup
agreed let us implement the CD method for them as part of a research. The startup’s vision was
carefully scrutinized to evaluate if the firm makes a good example of NPNM, which was
confirmed. The startup is referred to under the pseudonym EnCorp. EnCorp had upon initial
contact done very limited efforts of customer interaction and instead been focusing more on the
technical development of their product. The CD method was implemented parallel to the
startup’s product development process by following the described framework closely. A major
part of this thesis was therefore to implement the CD method and create the empirical basis for
this study.
Because the researchers were able to personally conduct the CD project, deeper insight into the
process and performance of the method was gained. This made it possible for the authors to
keep a detailed journal of the implementation process that otherwise would have been
impossible. This journal was used to review and evaluate the implementation process in
retrospect. During the implementation, the authors conducted most part of the CD method
themselves, acting as external consultants, but trying to have a mindset as if being the founder.
According the Blank & Dorf (2012) it is the founders of the startup that should conduct the CD
method, because they are the ones that should evaluate the customer feedback. Since the
purpose of this thesis is to identify challenges of implementing the CD method, and not to review
the customer feedback, the fact that we as external consultants conduct the process, should not
be an issue for the validity for this research regarding the first research question.
3.2.2 Data Collection
The weekly journal serves as the source of data for this part of the research. It is a
systematically authored document of how the implementation process proceeded and contains
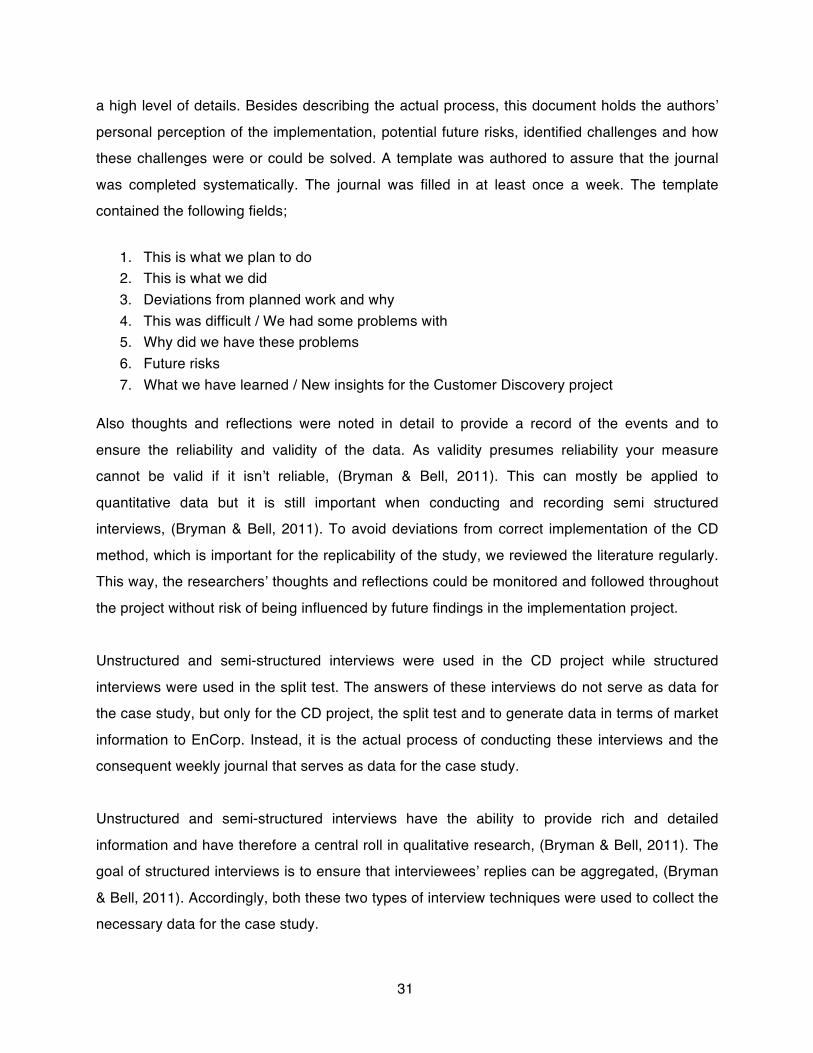
31
a high level of details. Besides describing the actual process, this document holds the authors’
personal perception of the implementation, potential future risks, identified challenges and how
these challenges were or could be solved. A template was authored to assure that the journal
was completed systematically. The journal was filled in at least once a week. The template
contained the following fields;
1. This is what we plan to do 2. This is what we did 3. Deviations from planned work and why 4. This was difficult / We had some problems with 5. Why did we have these problems 6. Future risks 7. What we have learned / New insights for the Customer Discovery project
Also thoughts and reflections were noted in detail to provide a record of the events and to
ensure the reliability and validity of the data. As validity presumes reliability your measure
cannot be valid if it isn’t reliable, (Bryman & Bell, 2011). This can mostly be applied to
quantitative data but it is still important when conducting and recording semi structured
interviews, (Bryman & Bell, 2011). To avoid deviations from correct implementation of the CD
method, which is important for the replicability of the study, we reviewed the literature regularly.
This way, the researchers’ thoughts and reflections could be monitored and followed throughout
the project without risk of being influenced by future findings in the implementation project.
Unstructured and semi-structured interviews were used in the CD project while structured
interviews were used in the split test. The answers of these interviews do not serve as data for
the case study, but only for the CD project, the split test and to generate data in terms of market
information to EnCorp. Instead, it is the actual process of conducting these interviews and the
consequent weekly journal that serves as data for the case study.
Unstructured and semi-structured interviews have the ability to provide rich and detailed
information and have therefore a central roll in qualitative research, (Bryman & Bell, 2011). The
goal of structured interviews is to ensure that interviewees’ replies can be aggregated, (Bryman
& Bell, 2011). Accordingly, both these two types of interview techniques were used to collect the
necessary data for the case study.

32
Sixteen exploratory interviews where conducted over telephone with potential customers,
representatives of authorities and other influencers, in accordance with the CD method. The
information from these interviews was used to create the interview templates for the semi-
structured interviews, which were conducted with the same stakeholders just mentioned. In
total, we conducted twenty-five semi-structured interviews that all were documented and
transcribed for the reliability of the study. We conducted an additional eleven face-to-face semi-
structured interviews with key people in California, all pre-booked from Sweden. The
interviewees gave us between one and two hours of their time, which was more than enough.
3.2.3 Data Analysis
The weekly journal was used as data for the Case Study and analyzed with an inductive
approach. Some parts of the analysis were done continuously during the project and parallel to
the data collection, to ensure that nothing was omitted or lost during the process. Challenges
that arose during the implementation process were documented continuously and commented
on by the researchers. The actual analysis of these challenges, how they arise and the reasons
behind them was done in retrospect after the implementation process was completed and
compared to LSM literature.
3.2.4 The Focal Company of the CD Project
This section aims to give basic information about the focal company of the CD project and why it
is a case of NPNM.
EnCorp is a startup that develops an electrically propelled multi-rotor aircraft named e-Copter.
Their vision is to provide an innovative solution to make personal aviation cheaper, easier, safer
and more accessible to a broader group of people. EnCorp is located in Germany and have
several academic research partners as well as private industry partners. EnCorp was in August
2012 granted €X.000.000 by a German state government and they have also raised additional
funding from private investors. The firm’s proof-of-concept test vehicle flew for the first time in
October 2011, being the first manned flight ever with pure electric powered vertical takeoff and
landing aircraft. The second prototype was tested during the fall and winter of 2012/2013.
Together with its partners, EnCorp aim to have the first e-Copter ready for market launch in late
2014. (Ruf, 2012)

33
Before our contact with EnCorp they had had a strong focus on Product Development, which
can be partly explained by the technical challenges they experienced developing the e-Copter,
and the technical background of the founders. EnCorp had until initial contact in the third quarter
of 2012 undertaken only modes customer and market investigation activities. Activities for
customer input had not been identified or validated. (Ruf, 2012)
EnCorp followed a traditional Product Development path;
Fig. 3.2 – The traditional Product Development path. (The authors’ illustation)
According to LSM, it is a good idea to implement a process of Customer Development parallel to
the Product Development process, thus lowering their market risk. (Blank & Dorf, 2012)
In July 2012, EnCorp participated in the annual AirVenture summit in Oshkosh, Wisconsin in the
US. Only modest customer dialog took place, nothing systematic or documented. The feedback
received from enthusiasts was “only positive” and the idea of the e-Copter was perceived as an
interesting concept. Nothing more can be stated from the up until then customer contact. (Ruf,
2012)
3.2.5 The Product of the CD project – the e-‐Copter
This section is added to explain why the e-Copter qualifies as an example of NPNM, which is an
important point to make, as the research depends on this fact. It is therefore important to
convince the reader that this product differentiates itself enough to create a new market, which
is done by explaining the e-Copter’s functions and how it differs from other products.
The e-Copter is propelled by 18 rotors, each driven by an electric motor powered by a central
unit of lithium ion batteries. Through the use of its many rotors, the e-Copter can take off and
lands vertically like a helicopter. Unlike the rotors of a helicopter, the e-Copter has fixed pitch
rotors, meaning that there are no moving parts other than the ball bearings, which decreases
the need for mechanical maintenance work, and thus reducing cost of operation. (Ruf, 2012)
34
Fig. 3.3 – An early design of the e-Copter (EnCorp, 2012)
An advanced digital gyro system controls the e-Copter by adjusting the throttle of each motor
individually. In contrast to a helicopter, in which the pilot constantly has to balance the aircraft,
the digital gyro here does that task making the flying experience easier, safer and more relaxing.
Furthermore, the e-Copter is built with a high level of redundancy throughout the entire design,
i.e. all systems have at least two backup systems, which makes the reliability and safety of the
aircraft high. In addition, the e-Copter is rather quiet and produces low CO2 emissions thanks to
its pure electric propulsion. (Wolf & Ruf, 2012)
Most of the technological developments of the product remain. Major parts that remain
undeveloped are the pilot interface, the vehicle construction along with safety devices such as
ballistic parachute among other things. Keeping the take-of-weight low is important for two
reasons; one, to save energy and increase time of operation and two, to weigh-in under the
Federal Aircraft Regulation (FAR) Part 103 limit of 254 pounds (~115 kg) to be classified as an
ultralight vehicle in the U.S. (Ruf, 2012)
Most aviation regulations are nation-specific and private aircraft regulations differ fundamentally
between nations. Nation-specific regulations control the airworthiness of aircrafts, meaning that
these institutions have ruling affect on sales and could therefore come to define possible
markets. This makes it imperative to examine a nation’s aircraft regulations before targeting a
certain market. Within the United States it is the Federal Aviation Association (FAA) that sets the
regulatory method of aviation. The FAR (Federal Aviation Regulation) Part 103 controls the rules
35
around ultralight vehicles and allows these air vehicles to be flown without license, age
restriction or registration when complying with the following requirements:
• Maximum empty weight of 254 pounds, ~115 kg, (plus safety gear)
• Limited to 5 US gallons of fuel, ~19L
• A power-off stall speed of no more than 24 knots
• A maximum speed of 55 knots (~ 100km/h)
• Carrying only a single occupant. (FAA, 1984)
The FAR Part 103 therefore creates a unique market opportunity for this product within the US.
Differentiation from a Customer’s Perspective
The e-Copter is a new kind of product based on new technology which shows signs of
undershooting on some performance parameters and overshooting on some other, which are
general signs of a disruptive technology (Christiensen, 2003). The e-Copter will enable a larger
group of people to do something that was not possible for them before. One can therefore argue
that it, from the customer’s perspective, differentiates itself enough to define a new category of
products. It can therefore be regarded as creating a New Market, in accordance with Tollin &
Carú (2008) definition of what makes a New Market. Arguably, the e-Copter will create a new
market for personal aircraft. Segway is an illustrative example of how they similarly created a
new market of a new kind of personal ground transportation.
3.3 The Split Test This section describes the split test, the quantitative part of this research. It starts with
presenting the purpose of the test and the hypotheses, followed by describing how the test was
prepared for, conducted, treatment of data was compiled. The statistical tests of the data from
this survey are found in section 4.2.
3.3.1 Background of the Split-‐test
Collecting quantitative data about the market and its actors is part of the CD method, (Blank &
Dorf, 2012). As there is no market for NPNM cases, it instead proves valuable to obtain
quantitative data on adjacent markets and their actors. The questions of this survey were
36
therefore stated to extract market information for the CD project together with evaluating the
effects of the images.
Experiences gained from the preceding twenty-five exploratory and semi-structured interviews
of the CD project were used to develop a first version of the interview template. Pre-testing of
this template was also conducted to assure that people understood the questions accurately
and that they could be performed fast enough and in a uniform manner. The California Aircraft
Expo at Long Beach Airport in Los Angeles, California, was identified as a place where the
interviews could be conducted with a homogenous group and with few disturbing factors. This
was a large enough event with the right clientele and at a time and date that suited the schedule
for the rest of the research.
3.3.2 Research Design
The split test was designed to examine in what way a low fidelity prototype affects the customer
interaction during the Customer Discovery method for a NPNM startup. For this test, a group of
four images were used as low fidelity prototypes. The sample size was initially set to 60
interviews but 58 structured interviews were conducted. We used a randomized experimental
design for this part of the research as it, according to Hacking (1990), allows for greater
reliability and validity of statistical estimates for the researched effects. It functions by giving the
experimental group the specific treatment and comparing it against a control group, (Bryman &
Bell, 2011). The randomization reduces bias in the test by equalizing other disturbing factors
that have not been explicitly accounted for in the experimental design, according to the law of
large numbers, (Bryman & Bell, 2011). The data was then statistically tested.
3.3.3 The Hypotheses
A deductive theory approach was used for stating the hypotheses of this test. Three hypotheses
were determined and stated before the interview template was developed. The three
hypotheses follow below and state that people presented with the images should:
1. obtain increased understanding of the concept. We believed better understanding of the concept should show by interviewees’ giving more accurate and uniform guesses of the product’s price. The interviewees’ average knowledge about pricing is irrelevant as this survey only measures the relative variance

37
between the two groups. Hence, if a change in variance of guesses would show, this would prove that the prototype had effect. Hence, this measurement should gauge differences between how well the two groups have understood the concept.
2. experience increased enthusiasm towards the product.
The authors perceived that during the qualitative interviews, interviewees expressed more enthusiasm when presented with the images. From this experience we concluded that also the group presented with images for the quantitative interviews should become more enthusiastic. By asking people how much they think they would enjoy flying the e-Copter we wish to measure a difference between the two groups’ perceived enthusiasm. This reasoning is in accordance with Roger’s theory of diffusion of innovation. Low fidelity prototypes of this type should increase perceived observability and reduce perceived complexity, (Rogers, 2003).
3. take longer time to interview.
Due to improved understanding of the concept and increased enthusiasm for the group presented with the images, they should be more eager to discuss and talk about the e-Copter, why also the average time of each interview should be longer. This hypothesis is dependent on Hypotheses 2 increasing the enthusiasm of the interviewees, which makes them give more feedback and hopefully a higher level of details in the answers.
3.3.4 The Interview Template
Seven out of ten questions were authored as closed questions to offer only a limited range of
possible answers, in accordance with Bryman & Bell’s (2011) advice for structured interviews.
The other three questions were open questions, but the answers resulted in only three to six
varieties, e.g. for question three; “where would you like to fly?” most people answered “along the
coast” or “up in the mountains” and “because it is fun”. Similarly, for question five; “What do you
think of the sixty minute airtime?” most answer came out as just “limited”, “good” or “more than
enough”. The same pattern applies to question four. These open questions increased the
possibilities for the interviewees to alter their answers without jeopardizing the conformity of
these structured interviews.
The order of the questions was closely considered to make the survey comprehensive and
avoid questions affecting the answers of subsequent questions. Bryman & Bell (2011)
recommends that general questions should precede specific ones to avoid specific questions
prematurely exposing the same topic. Questions dealing with opinions and attitudes should be
38
asked before questions that have to do with behavior and knowledge, as questions exploring
opinions and attitude are less affected by the question order, (Bryman & Bell, 2011).
Before asking the questions and showing the images each person was read the following
information;
Facts about the e-Copter
• It is a pure electric multi-rotor helicopter for one person. It has 18 rotors with one motor for each rotor.
• It is an ultralight aircraft. It weighs 254 pounds including batteries. It has no need for license and can carry one person and up to 250 pounds.
• It is very easy to fly; two hours of practice is enough for everyone. • It has about sixty minutes flight-time, it takes three hours to charge and it can fly at
65 mph. • It will of course be very safe and reliable and it has a high level of redundancy. • Low need for service and maintenance thanks to the simple construction with few
moving parts, which gives low cost of flying. • It will also be possible to put on a trailer for transport. • Due to current regulations it can only be used for recreational flying, (the FAR rule
103) and not over congested areas. • It has a clean and modern design.
Then, the following questions were asked:
The Interview Questions
1. Would you like to fly one? 2. On a scale from 1 to 10. How much do you think that you would enjoy flying it? 3. Imagine that you had one, where would you like to fly and why? 4. If you had one, where would you like to park it? 5. What do you think about the 60 minutes airtime? 6. Considering what we’ve just talked about, what would be a fair price for this aircraft? 7. Would you be interested to purchase one for that price? 8. Then the clock was stopped and the image was showed also for them, which had
not seen the image. 9. What was your first impression of the design? 10. Is there anything particular you like or dislike about the design?

39
The images for the split test were selected by pre-testing according to the advice by Harper
1986:25, “the most useful images tend to be those that are visually arresting, because they are
more likely to get the respondent’s attention and provoke a response”, (Bryman & Bell, 2011,
p.222). The images consist of computer-generated graphics of the e-Copter superimposed onto
real photographs of environmental settings to make it appear more realistic. Presenting the e-
Copter in various angles enhances visualization and different environmental settings were used
to neutralize for individual preferences. A computer-generated person occupying the e-Copter in
one of the images makes it easier to comprehend the size of the e-Copter. The four images
used are shown in figure 3.4.
Fig. 3.4 – The four images used during the Split-test survey. (Illustration by EnCorp)
3.3.5 Data Collection
The data was collected using structured interviews to ensure conformity and to reduce
interference of the test. The structured interviews were all randomly split into two groups where
image elicitation was used on one of the groups.
40
To determine the sample size of the survey, two main factors were considered; the amount of
interviews needed to statistically validate the hypotheses and how many interviews that could be
performed within the timeframe. From the exploratory interviews preceding the survey, the
average time was calculated to a little less than three minutes. The expo would take place
during one day, why it could be estimated how many interviews that would be possible to
conduct within that time. In addition, we considered a statistical rule of thumb, that a sample size
of sixty is deemed sufficient, (Bryman & Bell, 2011), and set the sample size to this number.
The split test was conducted during the California Aircraft Expo that was a one day event, taking
place at Long Beach Airport in California. The Expo featured aircrafts equipped with one and
two engines in the price range of $150 to $4500 thousand. They were aimed towards the private
market and the visitors were pilots and flight enthusiasts. The survey was conducted by
approaching visitors at random, introducing ourselves as Swedish students doing a survey
about a new type of electrical helicopter and requesting a couple of minutes of their time. All
except three of the approached people agreed to be part of the survey. All participants were
presented with the exact same information, which was read to them, upon which half of the
interviewees were shown the images before presented with the questions. A randomization
application, a “toss the coin app” on a smartphone was used to draw if an interviewee would be
shown the images or not.
The time of each interview was measured between the start of the first question and stopped
after the answer to the last question. The interviewees were unaware that the time of the
interview was noted, to avoid this causing any stress or discomfort. When the interview was
over and the stopwatch had been stopped, those that had not yet seen the images were
presented with them, followed by a short discussion followed that was not part of the survey.
The same interviewer asked the questions for all the interviews while the other interviewer
transcribed the answers and measured time. The technical and physical aspects of measuring
the time of interviews, handling the stopwatch correctly and in front of the interviewees were
unproblematic. For two interviewers working together, conducting the interviews in a uniform
manner, explaining the product, showing the images, asking the questions and noting the
answers were also unproblematic.

41
3.3.6 Summary of Data
The statistical data is too big to be placed in the report and not considered necessary for the
report. A summary of the compiled data of the split test is presented in table 3.1 here below. It
shows the average number for the whole sample and for the two groups, “image” and “no-
image”.
Total # of interviews 58 Average age 43,79 Pilot / not a pilot 46/12 Male / female 51/7 Image / no image 29 / 29 Time
All:02:21 Image: 02:35 No-image: 02:06
Question 1 Not relevant Question 2 All: 8,67
Image: 9,24 No-image: 8,10
Question 3 Not relevant Question 4 Not relevant Question 5 (Scale 1-3)
All: 2,14 Image: 2,24 No-image: 2,03
Question 6 All: 70,26k Image: 72,41k No-image: 68,10k
Question 7 Not relevant Question 8 Not relevant Question 9 Not relevant
Table 3.1 - A summary of the results from the split-test.
3.3.7 Data Analysis
Each interview was documented with pen and paper. As the questions were closed or involving
a limited range of possible answers, the responses were easily recorded. The data was then
compiled and codified and put into a spreadsheet to be statistically analyzed.
To test the first hypothesis, a “Robust tests for equality of variances” (Levene, 1960), was used.
It tests for equality in variance between populations, in this case the guesses of the price for the
two sample groups. To examine the data for the other two hypotheses, two statistical tests were

42
used; a standard student's t-test to test the mean and a Wilcoxon’s rank-sum (Mann-Whitney)
test, (Wilcoxon, 1945), to test the median. The Wilcoxon rank-sum test is regarded as more
accurate considering that the data is rank-data and that the data is arguably non-normally
distributed.
3.3.8 Validity and Reliability
Construct and internal validity are two important forms of validity when handling quantitative
data. Internal validity concerns the strength of the conclusion drawn from the relationship
between two or more variables, (Bryman & Bell, 2011). This will be tested and further elaborated
on in the results section in connection with each hypothesis.
Construct validity or measurement validity refers to the extent to which was intended to be
measured was actually measured. To ensure the construct validity of the experiment, the error
component must be kept at a minimum. A variable will have considerable error if the variation
due to error is large compared to the true variation. Variability can occurs either as intra-
interviewer variability, where questions and answers are not asked or recorded consistently, or
as inter-interviewer variability where different interviewers are asking questions or recording
answers incoherently. These two sources of variability can coexist and make the problem or
variation even worse. This is why some authors call these structured interviews standardized
interviews to emphasize the desired standardization to reduce error by reducing the intra-
interviewer and inter-interviewer variability. Any variation found should thereby be related to the
differences between the interview groups. (Bryman & Bell, 2011)
Strict standardization of the interview template and having only one interviewer consistently
asking the questions, the risks of non-uniformed interviews were mitigated. The interviewers
could thereby concentrate on their individual tasks to ensure the reliability and construct validity
of the experiment. The reliability and external validity can be seen as high when applying the
experiment in a similar context. Ecological validity is ensured for the segments of interest to the
study; people with an interest in aviation and with financial means to uphold this interest. The
setting of the study should not be considered to reflect the real world.

43
4. Results This chapter presents the results obtained from the implementation of the CD method and from
the split test. The first section presents the results of the CD project and the second section
presents the results of the split test. The results are discussed in chapter 5.
4.1 The Implementation of the CD method This section contains the results of the CD project and describes the challenges encountered
during the implementation of the CD method. The presentation of the process is divided into the
challenges identified. For a full description of the implementation process in chronological order,
please see Appendix I.
4.1.1 Challenges of Stating the Hypotheses
The purpose of stating the hypotheses is to consider all of the parts required when creating a
prosperous business. The process further serves to unite the startup team’s ideas and write
them down so that they can be tested during the subsequent phases of the CD method. During
the first meeting with EnCorp’s founders, the authors set up and supervised an exercise with the
founders of EnCorp, with the aim to state all the hypotheses advocated by the CD method. The
founders discussed the various hypotheses and the authors documented them. We then
mapped the hypotheses together onto Osterwalder’s Business Model canvas. The founders
perceived this exercise of stating the hypotheses as excessive, and some of the boxes of the
canvas could not be filled with “relevant hypothesis” because they were perceived as too vague.
We identified some hypotheses to be more challenging than others to specify, due to their
dependency on technical- and statutory uncertainties and to the founders’ internal deviations in
perception of the concept. The high degree of remaining technical development made stating
the hypothesis for revenue pricing especially difficult. The founders felt slight resignation being
“forced” to come up with qualified hypotheses for the revenue pricing. The same holds for the
hypothesis concerning the First Value Proposition, due to the same reasons, plus the
uncertainty regarding possible changes in the aviation regulations governing the use of the
product. The creation of this new market is dependent on certain regulations, which makes the
future of this business model uncertain.
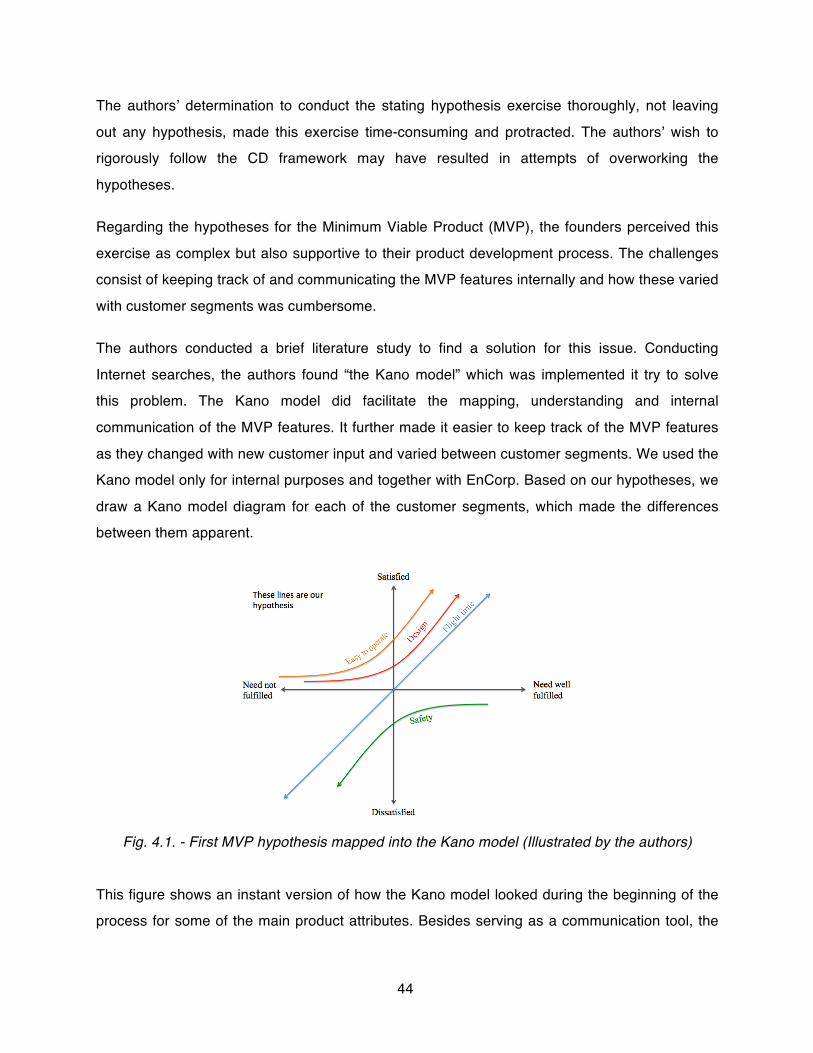
44
The authors’ determination to conduct the stating hypothesis exercise thoroughly, not leaving
out any hypothesis, made this exercise time-consuming and protracted. The authors’ wish to
rigorously follow the CD framework may have resulted in attempts of overworking the
hypotheses.
Regarding the hypotheses for the Minimum Viable Product (MVP), the founders perceived this
exercise as complex but also supportive to their product development process. The challenges
consist of keeping track of and communicating the MVP features internally and how these varied
with customer segments was cumbersome.
The authors conducted a brief literature study to find a solution for this issue. Conducting
Internet searches, the authors found “the Kano model” which was implemented it try to solve
this problem. The Kano model did facilitate the mapping, understanding and internal
communication of the MVP features. It further made it easier to keep track of the MVP features
as they changed with new customer input and varied between customer segments. We used the
Kano model only for internal purposes and together with EnCorp. Based on our hypotheses, we
draw a Kano model diagram for each of the customer segments, which made the differences
between them apparent.
Fig. 4.1. - First MVP hypothesis mapped into the Kano model (Illustrated by the authors)
This figure shows an instant version of how the Kano model looked during the beginning of the
process for some of the main product attributes. Besides serving as a communication tool, the
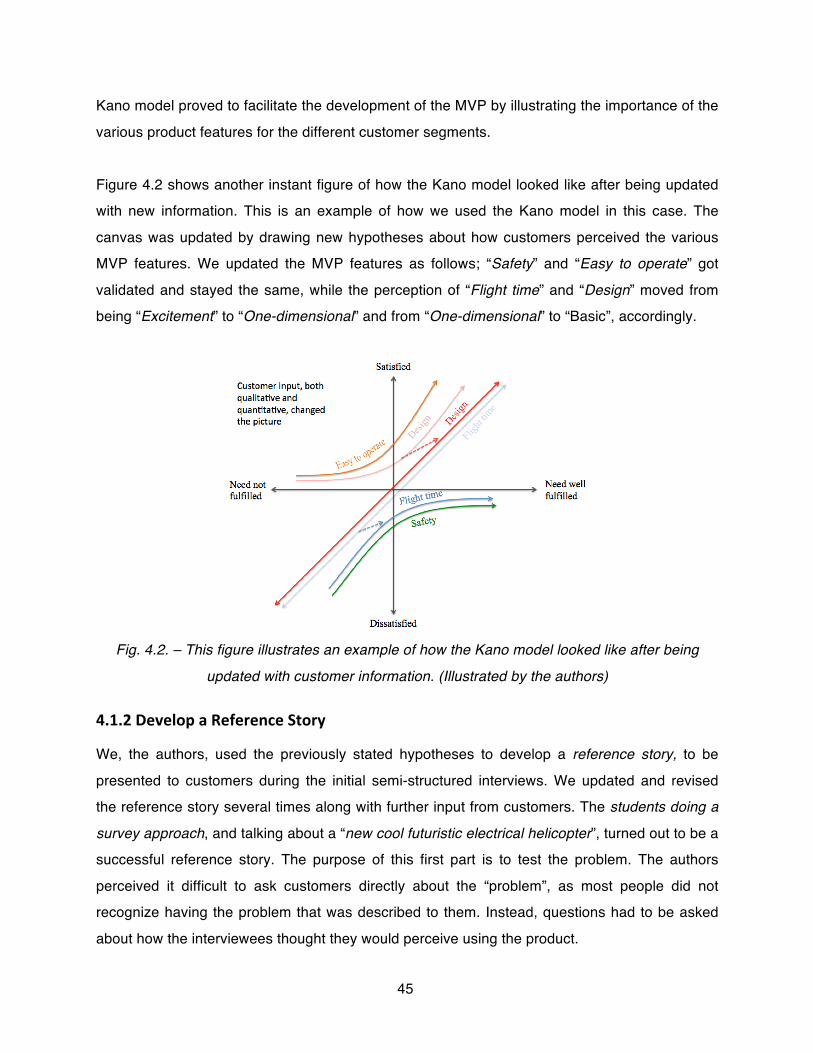
45
Kano model proved to facilitate the development of the MVP by illustrating the importance of the
various product features for the different customer segments.
Figure 4.2 shows another instant figure of how the Kano model looked like after being updated
with new information. This is an example of how we used the Kano model in this case. The
canvas was updated by drawing new hypotheses about how customers perceived the various
MVP features. We updated the MVP features as follows; “Safety” and “Easy to operate” got
validated and stayed the same, while the perception of “Flight time” and “Design” moved from
being “Excitement” to “One-dimensional” and from “One-dimensional” to “Basic”, accordingly.
Fig. 4.2. – This figure illustrates an example of how the Kano model looked like after being
updated with customer information. (Illustrated by the authors)
4.1.2 Develop a Reference Story
We, the authors, used the previously stated hypotheses to develop a reference story, to be
presented to customers during the initial semi-structured interviews. We updated and revised
the reference story several times along with further input from customers. The students doing a
survey approach, and talking about a “new cool futuristic electrical helicopter”, turned out to be a
successful reference story. The purpose of this first part is to test the problem. The authors
perceived it difficult to ask customers directly about the “problem”, as most people did not
recognize having the problem that was described to them. Instead, questions had to be asked
about how the interviewees thought they would perceive using the product.

46
The success of the reference story varied between the different customer segments. The
customer segments requested different degrees of technical details. We therefore authored
another reference story so that each story could be customized for each customer segment.
Some interviewees, mainly pilots, expressed concerns about understanding the concept, as
they would not believe in the statements presented to them without increased level of detail of
the technology behind the product. To evade this issue we asked them to imagine this concept
as something futuristic or to just accept it. The interviewees then lost interest in the interview
and the interviewers were taken less seriously. When instead more details were given, the
interviewees’ interest increased, but the focus of the interviews narrowed down to the specific
concept. The authors noted this as problematic, since the purpose of these early interviews is to
gather information about the customer problem and not a possible solution. Other interviewees
had less technical experience and understanding of aviation why these technical details could
be left out and exchanged for more simple terms.
4.1.3 The Appointment Setting Process
Finding relevant people willing to talk to us was identified as a challenge and it was difficult to
add people to the mailing list. We had a limited number of personal contacts in the field of
aviation and in the US, which limited our number of potential initial interviewees. The challenge
was to reach out to a lot of “strangers” relevant to the study and to find the best, most time
effective way of setting up interviews with these individuals.
By conducting Internet searches, we found several member lists of aviation- and flight clubs
within the US, containing both emails and telephone numbers. We used these lists to send out
emails with the reference story asking for telephone interviews. More than a hundred emails to
specific people were sent out in total, and at first the response rate of these emails was low. No
images were added to these first emails, as there were concerns about the details of the NDA
that had been signed with EnCorp.
When specific images were received from EnCorp and attached to the top of each email, the
response rate increased. To test the effect of attaching an image to the email, sixty emails were
sent out conducting random sampling. From thirty emails sent out with images, nineteen replies
47
were received. From the thirty emails without images, only seven replies were received. A two-
tailed Fisher's exact test corroborated that the top-placed image in the email did increase the
response rate, with a p-value of 0,0038.
We also used images to facilitate communication during the phone interviews; if the interviewee
had not yet seen the images, they were emailed the images during the phone interview. The
authors perceived this to increase interviewees’ understanding of the concept, facilitate
communication and increase the credibility for the interviewers. Before showing the images,
some interviewees considered us just ordinary boring-students-doing-a-survey. After showing
the images, the subjects were perceived as being more enthusiastic and that they regarded the
interview to have a more serious purpose.
We took the first customer contacts with the people easiest to get hold of, mainly personal
contacts of the authors. To avoid exhausting the mailing list, these first contacts were asked
about their contacts, which generated a stream of relevant people. We used the previous
contacts as reference, which facilitated the process by making people more willing to talk to us.
This is referred to as snowball sampling, which resulted in about thirty additional semi-structured
telephone interviews with US citizens. Snowball sampling in combination with images of the
concept facilitated the appointment setting process; people used the images to share with
friends, which sparked enthusiasm and willingness to participate in our research, and facilitated
getting the message across.
During the face-to-face interviews, we noticed some evident positive effects of having the
images present. The images; facilitated communication by being able to point to the images;
increased legitimacy for the interviews by having something to show; and made the interviewers
more relaxed and focused on the subject. The images also made it easier for the interviewee to
put the technical information into context.
4.1.4 Testing the Problem versus Testing the Solution
When interviewees saw the images they became interested in the product as if it was real,
which turned the focus of the interviews towards the features of the product. This caused the
interviewees to ask questions about the specific features of the e-Copter. This was perceived as
a challenge as we followed the CD method and thus tried to keep the focus on the problem,

48
need or passion that customers might experience. To solve this we turned the questions around
and asked them what features they would like to have, trying to keep the focus on the overall
concept. These qualitative interviews resulted in increased insight about customer’s
preferences, competitors and sales channels etc.
Several of the interviewees expressed the following reason for why they would be interested in
purchasing the e-Copter; because it is “new, cool, valuable and because their neighbors don’t
have one”. These are typical attributes of conspicuous consumption. The authors perceive the
images to not present the e-Copter in way favorable for evaluating the aspects of conspicuous
consumption: the illustration of the e-Copter looked too crude.
4.2 Results of the Split Test This section holds the results of the split test. A detailed description of this survey, its aim and
execution is found in section 3.3. The results for each hypothesis of this test are displayed in
this section and are further discussed in section 5.2. The statistical data is too big to be placed
in the report and is not considered necessary. Table 3.1 in section 3.3.6 is a summary of the
data from this survey relevant to the hypotheses.
4.2.1 Results of Hypothesis 1 – Improved Understanding
The hypothesis states that people presented with the low fidelity prototype should obtain
increased understanding of the concept by having a lower variance in their price guesses.
The test does not support the hypothesis that the group seeing the images obtained increased
understanding of the concept. The average price estimate for all interviewees was $70.3
thousand. For those presented with the images this number was $72.4 thousand and for those
not shown the images, $68.1 thousand. The variances of the guesses were 1130 and 1090
respectively, thus a little higher for the group presented with the image. Levene’s test gave an F
value of 0.41 and a significance level of 0.837, which indicates that there is no significant
difference between the groups (0.837 > 0.05).
4.2.2 Results of hypothesis 2 – Increased Enthusiasm

49
The hypothesis stated that people presented with the low fidelity prototype should express
increased enthusiasm for the product.
The measurement used was that interviewees gave a number on a scale from 1 to 10
depending on how much they would like to try the concept presented to them. Most interviewees
were enthusiastic about flying the e-Copter and the average score was 8.67. For those that
were shown the images the score was 9.24 and for those not shown any images the score was
8.10.
The standard Student's t-test for equality of means, assuming unequal sample variances and
independent samples, showed that there was a significant difference in the scores for images,
mean of 9.24, standard deviation of 1.049. For those not seeing the images, the mean was 8.10
and the standard deviation of 1.93. The standard of error (t) was 2.79, the degree of freedom
43.23 and the two-tailed p-value 0.0078. To test the median a two-sample Wilcoxon rank-sum
(Mann-Whitney) non-parametric test was performed. The median score in the two groups
“images” and “no images” were 10 and 8.5 and differed significantly; (U= 276, sample sizes 29,
and two tailed significance level p = 0.0251).
Both the mean and the median were higher than for the group not viewing the images, which
was statistically validated by the two tests. Hence, both tests do support the hypothesis that the
group shown the images did experience increased enthusiasm.
4.2.3 Results of Hypothesis 3 – Longer Interview
The third hypothesis states that interviews should be longer when people are shown images,
due to increased enthusiasm and therefore be more eager to talk about the product.
The average time of all of interviews was 2 minutes and 21 seconds. The average time of the
interviews presenting the images was longer, 2 minutes and 35 seconds, while the average time
of the interviews not showing the images were shorter, 2 minutes and 6 seconds.
A standard Student's t-test for equality of means assuming unequal sample variances and
independent samples showed that here was a significant difference in the scores for images
(mean 155s, stdev. 38s) and no images (mean 126s, stdev. 37s). The standard of error (t) was

50
2.92, the degree of freedom 55.93 and the two-tailed p-value 0.0050. To test the median instead
of the mean a two-sample Wilcoxon rank-sum (Mann-Whitney) non-parametric test was
performed. The median interview time for the groups “images” and “no images” were 154 sec.
and 121 sec. and differed significantly; (U= 228, sample sizes 29, and two tailed significance
level p = 0.0028).
Both tests support the hypothesis that interviews using images take longer time, both the mean
and the median was tested. This hypothesis further supports the theory that images lead to
increased enthusiasm, as there is a general correlation between enthusiasm and willingness to
discuss an issue.
51
5. Discussion This section contains the analysis of the research and is divided into two sections, the first
discussing the CD project and its implementation, the second the Split-test.
5.1 The Customer Discovery Project This section analyses the challenges of the CD project identified and described in section 4.1.
The analysis is built up by first discussing how the findings relate to previous literature, mainly
LSM, followed by a discussion of its validity and generalizability along with possible sources of
error. The challenges identified are divided into groups and analyzed together.
5.1.1 The Challenges of Stating the Hypotheses
At some stage of the process, the authors perceived invention risks to be present, obstructing
the stating hypotheses phase. The CD method should not be applied when invention risks are
present, (Blank & Dorf, 2012). The founders of EnCorp assured that invention risks could be
overlooked, why the authors do not consider the technical challenges as an issue in this case.
The main challenges of stating the hypotheses are related to high degrees of uncertainties
surrounding the hypotheses, especially market- and institutional uncertainties. The excessive
level of uncertainty of NPNM cases is well known and explained in the literature by the nature of
these cases; the fact that both the concept and the problem are many times unknown to both
customers and market, (Blank & Dorf, 2012). Other LSM literature (Ries, 2011; Furr & Ahlstrom,
2011) prescribe a similarly but less excessive method for stating hypotheses compared to Blank
& Dorf, (2012). It is therefore natural that these two books do not address this challenge of
stating the hypotheses.
Blank & Dorf (2012) devotes a large part of the book to explain the stating hypotheses phase of
the CD framework. Blank & Dorf (2012) further writes that one should not be afraid to leave
some boxes blank and fill them in later, which we believe could help to avoid the classic
entrepreneurship trap of developing a too rigid business plan and believing in your product too
much. This identified challenge of the CD project can be partly explained by the authors’ (of this

52
thesis) wish to conduct this process rigorously, which may have resulted in attempts to overwork
the hypotheses.
Stating the hypotheses is connected to the issue of developing a too rigid business plan, which
may hinder the founders from seeing and taking advantage of opportunities that arise, (Blank &
Dorf, 2012, Furr & Ahlstrom, 2011). During the case study, the authors perceived this issue to
apply to the MVP part of the business plan. If parts of the business model were to be less
thoroughly stated in an attempt to keep a more open mindset, it risks leaving these parts loose,
which may cause the hypotheses difficult to test. It may also result in that some parts of the
business being forgotten. Stating the hypothesis is therefore a balance of how descriptive the
hypotheses should be. This issue relates to the important open-mind aspect of LSM. The issue
should apply to all startups but is regarded to be a bigger issue for NPNM startups, as these
seek to develop a business model surrounded by more uncertainties and therefore have a
higher need to stay open for new ideas.
The identified high degree of institutional uncertainties relates to the use of the product and that
it interferes with statutory institutions, in this case aviation regulations. We believe that the issue
of increased institutional uncertainties applies more often to NPNM cases, as the creation of
new markets more often than established markets fell victim to interfering with statutory
institutions. Even so, increased level of institutional uncertainties does not automatically apply to
all NPNM cases. Blank & Dorf (2012) and other LSM literature, do not address the issue of
increased institutional uncertainties. We therefore regard it necessary to stress that NPNM
startups should scrutinize, or ask for guidance for, how their vision of a new market may violate
with current regulations.
During the CD project we noticed that a tool for handling and communicating the MVP features
is needed. The Kano model, or equivalent, is not mentioned by the LSM literature (Blank & Dorf,
2012; Furr & Ahlstrom, 2011; Ries, 2011), instead the MVP features are assumed be
summarized on a list and continually updated, (Blank & Dorf, 2012). Blank commented on the
use of the Kano model as a supporting tool for MVP features as “a good thing to use”, (Blank,
2012). The Kano model should be equally useful for all startups, independent of the type of
product or market. We believe that the Kano model, if added to the CD framework, can help
53
founders to obtain a better view of how customers perceive their products and facilitate internal
communication and mapping of MVP features.
5.1.2 Develop a Reference Story
The CD framework states that the reference story should be adjusted for the specific customer
segments, but does not advocate the authoring of multiple reference stories, (Blank & Dorf,
2012). For this reason only one reference story was initially authored during the CD project.
Other LSM literature has different approaches to reference stories and do not cover this section
similarly as Blank & Dorf (2012). Blank & Dorf’s stating hypothesis phase is more specific and
detailed than Furr & Ahlstrom’s (2011) “big idea hypotheses”. This problem applies only when
exploring multiple customer segments in parallel, which was done during the CD project, which
are dependent on the founders’ previously stated hypotheses. It is a case specific problem that
we regard as common. The authors therefore conclude it wise to stress the advantage of
authoring more than one references story for such cases; at least one for each customer
segment.
5.1.3 The Appointment Setting Process
An undefined market is normal for all NPNM startups and makes the appointment setting
process challenging, (Blank & Dorf, 2012). The main challenge of this process is to get in touch
with the right people and get them to want to talk to you. According to Blank & Dorf (2012),
“there is no perfect process for how to run the appointment setting process”. It is therefore
necessary to come up with new ideas of your own that fit your specific case, for how to reach,
interact and get in touch with the necessary people.
The best way to get into contact with people, according to Blank & Dorf (2012), is through a
peer. According to the CD method, it is advisable to start contacting people that also loosely fit
within the hypotheses of the customer segments, instead of searching for exactly the right
people. According to the findings of the CD project, these two pieces of advice, together with
snowball sampling, were successful in supporting the search for valuable and relevant contacts.
The authors regard these pieces of advice to be generalizable and thus work also for other
startups.
54
Blank & Dorf (2012) recommends the response rate be used as a measure for how relevant and
interesting the customer problem is to the customers. But if you never get your message across,
a low response rate does not signify people’s ignorance of your concept and can therefore be a
deceiving measure. The low response rate of the sent out emails was at first considered an
issue for the appointment setting process, but was solved when an image was placed at the top
of each email. The authors would like to stress the advantages of attaching an image to the
emails for all targeted customer segments and especially when dealing with complex products.
During the appointment setting process it is important to make the interviews mutually
interesting to increase the quality and feedback from the interviewees, (Blank & Dorf, 2012). For
the CD project and for the customer segment of flight enthusiasts this was achieved by showing
images of a, for them, interesting concept, in this case a “cool and futuristic electric multi-rotor
helicopter”. One common obstacle of the appointment setting process, not only for NPMN, is the
founders’ concern of revealing too much information about their concept, which could come to
affect intellectual property rights etc. This concern threatens to make the interviews less
interesting. In this case study, this was noticeable but not considered as a major challenge.
5.1.4 Testing the Problem versus Testing the Solution
The main challenge of testing the problem versus testing the solution can be summarized by the
example of “the ill-defined elevator problem”, described in the theory section 2.2, (Ackoff et al.
2008). The aim of the problem meeting is not to get feedback on a specific solution, but to step
back and ask questions to gain understanding of the customer problem. Because people in new
markets many times do not recognize having the problem presented to them, it becomes
especially challenging to ask questions about it, (Blank & Dorf, 2012). It is therefore
recommended that the problem and solution meetings are merged for NPNM cases so that the
problem and solution are presented together. This should facilitate for the interview process to
get feedback on the possible solution and get a discussion going, Blank & Dorf, (2012).
However, showing the interviewees a suggestion of a solution impede the possibilities of
stepping back and reviewing the customer problem from a wider perspective, both for the
founder and the interviewee, (Furr & Ahlstrom, 2011). It is therefore advised that technical
details and features about the concept are left out as much as possible during the problem-and-
solution meetings, to help retain focus on the problem instead of the solution, and thereby open
55
up for a broader discussion, (Blank & Dorf, 2012). This implies that images and prototypes
should omit as much detail as possible, still being interesting.
But what makes an optimal level of detail? It can be reasoned that a prototype should have just
enough detail to get the message across and still spark interest, but without influencing
interviewees with unnecessary features. The level of detail of the prototype, as well as when to
show the prototype, is therefore a balancing act between facilitating for interaction with customer
and narrowing the focus of the interview. Neither Blank & Dorf, (2012), nor other LSM literature
address this issue.
According to LSM, applying a solution onto the market is not recommended but instead to do
the other way around; first identify the customer problem and then develop the solution. Furr &
Ahlstrom (2011, p.70) explains this issue by a quote of Paul Kedrowsky; “As soon as you build
something you are dead”. This quote relates to the issue of “the entrepreneur’s curse”, meaning
that when a possible solution has been developed it becomes challenging for the founders to
absorb alternative ideas given through feedback by the interviewees, (Furr & Ahlstrom, 2011).
To get around this issue and to observe the problem from a broader perspective, Blank & Dorf,
(2012, p.207), recommends at the end of the problem meeting to “always ask, what should I
have asked?”. This makes the interviewees reflect on the specific customer problem and give
further feedback. However, we experienced that after showing the images to the interviewees,
their thoughts were stuck to this concept, also when asking wider questions. The fact that an
image or prototype reduces the possibilities to step back and ask questions about the problem
is a well-known issue, (Ackoff et al., 2008, Furr & Ahlstrom, 2011).
Both Ries (2011) and Furr & Ahlstrom (2011) separate the processes of testing the problem and
testing the solution more clearly than Blank & Dorf (2012) does. This can be partly explained by
Blank & Dorf (2012) being the only reviewed literature that has a separate section especially for
NPNM startups. Ries (2011) and Furr & Ahlstrom (2011) have more general methods for how to
research the customer problem and independently of what type of market the startup intends to
enter. However, it can be argued that Ries (2011) and Furr & Ahlstrom (2011) mainly address
startups that envision creating new markets and that they therefore have chosen a wider
approach for how to discover the customer problem. Why they therefore have more emphasize
on first probing for the problem and then developing a solution.

56
The authors conclude that using images or low fidelity prototypes with limited level of details
should ease the issue of how to explore the customer problem. However, a too rough low fidelity
prototype risks sending dubious and unserious signals of the concept, (Farnum, 2002).
Therefore, it should be stressed that also rough low fidelity prototypes should, independent of
their purpose, look like “promising concepts” and not as unfinished, thoughtless concepts,
(Farnum, 2002). The authors continue to conclude that development of low fidelity prototypes is
important and their use facilitates for the CD method. The development of the prototype should
still be done fast and cheap, but with concerns to how it will be perceived by customers. Testing
the problem and testing the solution was considered the main challenge encountered during the
implementation of the CD method and was closely tied to the issue of images and low fidelity
prototypes. This phenomenon is applicable to the field of research and can be generalized to
the theory of how to develop new products for new markets.
The weekly journal is a diverse source of data based on several interviews and a record of the
implementation process itself. It would have been difficult to run the implementation process on
several different startups for several reasons such as time and because these cases are non
ubiquitous. The lack of multiple sources of data and analyzing methods for answering the first
research question limits the possibilities of generalization, i.e. these challenges cannot be
argued to automatically apply to other similar cases of NPNM. However, this field of literature is
in general based on several examples and we believe that the e-Copter make an interesting
case from which lessons can be learned. How learning from more examples can further amend
the process of Customer Discovery for NPNM is therefore an interesting field for further
research.
5.2 The Split Test This section discusses the results of the split test. The findings are discussed from the
perspective of the hypotheses of the test and related to literature.
5.2.1. Hypothesis 1 – Increased Understanding of the Concept
It can be expected that seeing an image of a product should improve general understanding of
it, compared to not seeing an image. To test this effect, people were asked to guess the price of
57
the product being shown to them. A lower variance in their price guesses was thought to prove
an increased perception and understanding of the product.
There was no difference in variance of the price-guesses between the two groups that could be
statistically corroborated, i.e. the data does not support this hypothesis. It is questionable if and
how strong the connection is between more uniform perception of the concept and more uniform
guesses of the price, why the construct validity of this test is considered low. To test the
understanding of the product it would probably have been better to ask more technical questions
about the product. At the same time, it was deemed inappropriate for the CD project to at this
stage ask about technical details about the concept. Increased understanding could also show
by better answers and feedback from the interviewees.
5.2.2 Hypothesis 2 – Increased Enthusiasm
We thought that people more eager to try to fly the e-Copter should, on average, be more
interested in participating in the survey and more happy to talk about the problem and the
solution. They are therefore believed to care more about their answers, which is positive for the
customer feedback. This precondition made it relevant to measure how a low fidelity prototype
affected the enthusiasm of the interviewees. By asking about the desire and eagerness of
people to try the product, we wanted to test if images increased enthusiasm towards the
concept. The mean and average score of each group was compared and a higher average
score would signify an increase in enthusiasm for that group.
The group that saw the images obtained higher scores in the desire to try the product, which
was statistically corroborated. The conclusion builds upon the relationship that increased
willingness to try the product derives from an increase in people’s enthusiasm towards the
product. An argument supporting this relationship is that people without interest in the product
would not want to try it to the same extent as people with a genuine interest for it.
The split test showed of a positive effect on people’s enthusiasm and this hypothesis is found to
be valid. Despite this, images do not necessarily have to cause an increase in enthusiasm. If a
product concept is disliked or perceived as unattractive, images could have reverse effect.
Before conducting the experiment, the enthusiasm towards the e-Copter was perceived to be
high. This led to the conclusion that images of the e-Copter should boost enthusiasm. It is likely

58
that quality of the images also affects enthusiasm for the product in both ways, and decreased
quality and poorer rendering of the images should result in the product being perceived worse;
the fallacy of using awfully looking prototypes, (Farnum, 2002).
5.2.3 Hypothesis 3 – The Time of Each Interview
Images make interviewees more comfortable and encourage them to discuss issues in more
detail, (Bryman & Bell, 2011). Images have proven to increase the interviewees’ enthusiasm,
which should increase their willingness to talk about the concept, which in turn should result in
longer interviews. The hypothesis was therefore that increased enthusiasm should show by an
increase in the average time of the interviews utilizing the images when subtracting for the time
it took to show the images.
The hypothesis was statistically corroborated. The literature states that showing images should
result in more detailed answers, but it cannot be concluded that more details correlate with
longer interviews. The relationship between the duration of the interviews and level of detail in
the answers is deemed weak and would have to be qualitatively verified. However, the
relationship between interviewees’ enthusiasm and longer interviews is considered high.
It can be reasoned that interviewees taking extra time to visually processing the images cause
the interviews to take longer time. It can also be argued that the persons that do not see the
images, should need more time to consider the concept and therefore need more time to reflect
on their answers. This part of the split test was conducted to further support the hypothesis that
images lead to increased enthusiasm, thereby spending more time interacting with the
interviewers, which is considered positive for the research.
5.2.4 End Discussion of the Split Test
The split test confirms the hypothesis that images of the concept have a positive effect on
interviewees’ enthusiasm towards the concept, presupposed that the concept is of interest to the
interviewees. We perceived that images better illustrate concepts than texts do, thus they
should facilitate the understanding of new concepts but this theory was not supported by the
test. The hypothesis is still valid, and the negative results of the test are blamed on the faulty
measurement and the low internal validity of the test.
59
Results from both the split test and the CD project show that images increase interviewees’
enthusiasm, improve customer feedback, increased the perceived legitimacy and seriousness of
the interview and facilitated communication. The benefits of using images as low fidelity
prototypes during Customer Discovery within NPNM create the conclusion that using images
facilitate and improve this method significantly. We therefore advocate that these positive
aspects of using images in the cases of Customer Discovery for NPNM should be further
stressed by LSM literature. However, it is still necessary to keep in mind that the use of images
for exploring the customer problem is a balancing act between facilitating for customer
interaction and revealing too much details and thereby narrowing the focus on the interview.
How to conduct the problem and solution presentation and the level of detail in the images used
to get the message across are interesting topics for further research. The reason for only using
images was because of limited time and there are other forms of prototypes that could be used
and the effects of using these further explored. The differences in using low fidelity prototypes
and high fidelity prototypes is also considered an interesting topic for further research. This
thesis identified the main challenges and the underlying reasons to why they occurred and the
role of images when dealing with these challenges, but lacked the time frame of exploring these
issues further.

60
6. Conclusions This section presents the conclusions of this thesis. The two research questions are first
repeated, followed by a concise summary of the findings.
Research Question 1
What are the main challenges with implementing the CD method for a startup with an NPNM
strategy, and what are possible workarounds for these challenges?
Overworking the hypotheses in the stating hypotheses phase risks causing unnecessary delays
of the CD method. It may also result in a too rigorous business plan, functioning as blinders on
the founders, preventing them from identifying other business opportunities. A solution to this
issue is to further stress that this is an iterative process and that one may leave some
hypotheses to be filled in later.
The internal communication of MVP hypotheses can be cumbersome. The Kano model
facilitates this by illustrating the different MVP features graphically and in a straightforward way.
It also facilitates the mapping, understanding and communication of the MVP features.
It is difficult to develop a single reference story that suites different customer segments, due to
the differences between them. Therefore, we recommend the authoring of a separate reference
story for each customer segment, adjusted to their particular background. Approaching
customer segments with individual reference stories increases response rate and facilitates
communication.
Low response rate of contacted people and the difficulties of making people want to participate
in interviews caused the appointment setting process to be challenging. Adding an image to the
top of each email increased the response rate significantly. Starting the contacting process with
personal contacts and contact lists of customers in adjacent markets, together with snowball
sampling, showed to be a successful strategy. The use of images to illustrate the concept
makes interviewees more interested and facilitate the customer interaction in several ways;
images may serve as “icebreakers” and facilitate initial contact, increase the perceived
61
legitimacy and seriousness of the interviews, facilitate communication and increase peoples’
enthusiasm.
Performing interviews concerning the customer problem from a wide perspective is challenging
for NPNM cases, due to people not recognizing the problem presented to them. Therefore,
images of a possible solution may be used to facilitate the customer interaction, but it also
narrows the perspective of the customer problem. The appropriateness of testing the solution
and the problem together is questioned by some LSM literature and they recommend not to
show the solution when exploring the problem. For NPNM cases we anyway believe it a good
idea to combine the two phases of testing the problem and testing the solution, but that one
should be aware of the risks this implies. It is a delicate line between revealing details of the
concept without influencing the customers with the solution and making the interviews
interesting to get good feedback.
Research Question 2
How does the use of low fidelity prototypes affect customer interaction during Customer
Discovery within NPNM?
As the images reinforced the positive perception of the product, people’s enthusiasm towards
the concept increase when presented with images. The showing of images also results in longer
interviews and is perceived as another way to demonstrate increased enthusiasm, as when
interviewees discuss the issue in more detail, they thereby make the interviews last longer. The
images could not be statistically proven to increase understanding of the concept. However, the
internal validity of this test is considered low and a better understanding of the concept should
rather be evaluated qualitatively.
This research concludes that the CD method, despite the identified challenges, works well and
gives good support to NPNM startups to lower market risk. Showing images was an important
part of the findings and connects to the main challenge of testing the problem without revealing
too much of the solution.

62
7. References
Printed Sources
Ackoff L. Russell, Greenberg, Daniel; 2008; “Turning Learning Right Side Up - Putting Education Back on Track”; ISBN: 0132887632
Blank, Steve; Dorf, Bob; 2012; “The startup Owner's Manual” ISBN: 0984999302
Blank, Steve; 2005; “The Four Steps to the Epiphany: Successful Strategies for Products that Win” ISBN; 0976470705
Christensen, Clayton M.; Michael E. Raynor; 2003; “The Innovator's Solution, Creating and Sustaining Successful Growth”; ISBN: 1578518524 Cooper G. Robert; 1986; “Winning at new products”, Addison-Wesley Pub. Co., ISBN: 0201136651
Fagerberg, Jan; Guerrieri, Paolo; Verspagen, Bart; 2000; “The Economic Challenge for Europe, Adapting to Innovation Based Growth”, Edward Elgar Publishing Ltd, ISBN 1840645903 Furr, Nathan; Ahlstrom, Paul; 2011; “Nail It then Scale It: The Entrepreneur's Guide to Creating and Managing Breakthrough Innovation”; ISBN: 0983723605
Hacking, Ian; 1990; "A Universe of Chance", The Taming of Chance, Skinner, Quentin (red.); Cambridge U. Pr. ISBN: 0521388849
Levene, H; 1960; “Robust tests for equality of variances; In Contributions to Probability and Statistics”: Essays in Honor of Harold Hotelling, ed. I. Olkin, S. G. Ghurye, W. Hoeffding, W. G. Madow, and H. B. Mann, 278-292. Menlo Park, CA: Stanford University Press.
Nagy, G; 1992; “A prototype document image analysis system for technical journals”; Viswanathan, M, Volume: 25, Issue: 7; Page(s): 10-22
Page, Christine; 1992; "A History of Conspicuous Consumption", in SV - Meaning, Measure, and Morality of Materialism, eds. Floyd W. Rudmin and Marsha Richins, Provo, UT : Association for Consumer Research, Pages: 82-87.
Ries, Eric; 2011; “The Lean startup: How Today's Entrepreneurs Use Continuous Innovation to Create Radically Successful Businesses”, Crown Publishing. p. 103. ISBN 0307887917
Rogers, M, Everett; 2003; “Diffusion of Innovations”; Simon & Schuster International; ISBN: 9780743222099
Womack P. James; Jones T. Daniel; Roos, Daniel; 2007; “The Machine that Changed the World, The Story of Lean Production”; Free Press; ISBN: 0743299795
63
Roush, Wade; 2011; “Eric Ries, the Face of the Lean startup Movement, on How a Once-Insane Idea Went Mainstream”, Xconomy
Shane, Scott; 2003; “A General Theory of Entrepreneurship: The Individual-Opportunity Nexus”, International small business journal, ISBN: 1843769964.
Schilling, Melissa; Hill, Charles; 1998; ”Managing the new product development process: Strategic imperatives”, The Academy of Management Executive [AME], 12(3), 67 - 81.
Söllnera, Albrecht; Resel, Mario; “Market segmentation and the structure of competition: applicability of the strategic group concept for an improved market segmentation on industrial markets”, Journal of Business Research, Volume 51, Issue 1, January 2001, Pages 25–36
Tollin; 2008, “Mindsets in Marketing for Product Innovation: An Explorative Analysis of Chief Marketing Executives' Ideas and Beliefs about How to Increase Their Firms' Innovation Capability”, Published by: Journal of strategic marketing
Ullman, David G; 1996; “The Mechanical Design Process”, McGraw-Hill Companies, U.S.A., ISBN: 0070657564
Wilcoxon, F; 1945; ”Individual Comparisons by Ranking Methods”, Biometrics Bulletin, Vol. 1, No. 6 (Dec., 1945), pp. 80-83. Published by: International Biometric Society
Zimmerman, M; Zeitz, G; 2002; “Beyond Survival: Achieving New Venture Growth by Building Legitimacy” The Academy of Management Review; Vol. 27, No. 3, Jul., 2002
Papers & Internet Sources
Andersson, Marc; 2007; “The Pmarca Guide to Startups, part 4: The only thing that matters;“ Post from; blog.pmarca.com; (http://web.archive.org/web/20070701074943/ http://blog.pmarca.com/2007/06/the-pmarca-gu-2.html , retrieved, 2013-03-06)
Bernhard, Kent, 2011, “The Biggest Idea of 2011 - Think Lean”, Published at Portfolio.com. (http://upstart.bizjournals.com/news/wire/2011/12/30/eric-ries-lean-startup-approach-catches-fire-in-2011.html) Retrieved 2012-11-29
Bury, Erin; 2011; “How Eric Ries Changed the Method for startup Success”. Sprouter.com (http://sprouter.com/blog/how-eric-ries-changed-the-method-for-startup-success/) Retrieved 2012-12-21
Eurostat, 2008; “Business demography in Europe: employers and job creation”, http://epp.eurostat.ec.europa.eu/cache/ITY_OFFPUB/KS-SF-08-100/EN/KS-SF-08-100-EN.PDF Retrieved 2012-11-14
Ekonomifakta, 2012, “Verket för tillväxtanalys”, http://www.ekonomifakta.se/sv/Fakta/Foretagande/Entreprenorskap/Foretagens-overlevnadsgrad/ Retrieved 2012-11-03
64
Ewel, Jim; 2012; “Why Marketing Must Also be Lean”, Agile Marketing, http://www.agilemarketing.net/lean/, retrieved 2013-02-06
FAA; Federal Aviation Association rule 103 - AC 103-7 – “The Ultralight Vehicle”; (http://www. faa.gov/regulations_policies/advisory_circulars/index.cfm/go/document.information/documentID/22640) retrieved 2013-02-06
Farnum, Chris; 2002; “Should Know About Prototypes for User Testing”, Retrieved 2013-02-21; (http://boxesandarrows.com/what-you-should-know-about-prototypes-for-user-testing/)
Lohr, Steve; April 24, 2010; “The Rise of the Fleet-Footed Start-Up”, The New York Times. http://www.nytimes.com/2010/04/25/business/25unboxed.html Retrieved; 2013-03-09
NYTimes; “Best Sellers”; 2011; The New York Times. (http://www.nytimes.com/best-sellers-books/2011-10-02/hardcover-advice/list.html) Retrieved 2012-12-16
Ries; 2011; Blog: “The Lean Startup Methodology” (http://theleanstartup.com/principles) (Retrieved; 2013-03-06)
Rudd, J.; Stern, K.R. Isensee,S.; 1996; ”Low vs. high-fidelity prototyping debate” Magazine interactions, Volume 3 Issue 1, Jan. 1996 Pages 76 - 85.
Interviews
Ruf, Thomas, Interview at e-Volo’s Office in Karlsruhe, Germany; date 2012-10-09
Wolf, Stephan, Interview at e-Volo’s Office in Karlsruhe, Germany; date 2012-10-09
Blank, Steve, Interview at K&S Ranch, Pescadero, H1, California, US; date 2012-12-07
Söderberg, Örjan; Interview at Chalmers University, Gothenburg, Sweden; date 2012-11-23
Dagman, Jessica; Interview at Chalmers University, Gothenburg, Sweden; date 2012-11-23

65
8. List of figures and tables
Figures 1.1 Survival rate for Swedish firms 2005-2008 p. 2 2.1 The feedback loop of LSM p. 10 2.2 The Customer Development Methodology p. 12 2.3 Outline of the Customer Discovery process p. 13 2.4 Earlyvangelist Characteristics p. 14 2.5 Overview of phase one: State Your Hypotheses p. 15 2.5 Osterwalder’s Business Model Canvas p. 16 2.6 Overview of phase two: Test the Problem p. 19 2.7 Overview of phase three: Test the Solution p. 22 3.1 Overview of the Research Process p. 28 3.2 The traditional Product Development path p. 33 3.3 An early design of the e-Copter p. 34 3.4 The four images used during the Split-test survey. p. 39 4.1 The Kano model, first example p. 44 4.2 The Kano model, second example p. 45 Tables 2.1 Problem presentation table p. 20
3.1 A summary of the results from the split test p. 41