Embed Size (px)
Citation preview
Vol: 1/Issue :4 (October, 2012) www.theijm.com 1
THE INTERNATIONAL JOURNAL OF MANAGEMENT
Customer-Based Brand Equity in the Fast Moving Consumer Goods
Industry in India
This study identifies the significant antecedents of brand equity for the fast moving
consumer goods (FMCG) industry in India (hereafter referred as FMCG in the
paper). The study is based on the conceptualization of brand equity by Aaker (1991).
Data was collected from 826 FMCG consumers in five major cities in India.
Correlation and regression analysis were used for arriving at inferences. Findings
indicated that consumer based brand equity for FMCG consists of four dimensions –
brand association, brand loyalty, perceived quality and brand awareness. Brand
association was by far the most important source of brand equity and the brand
awareness had the least effect. While many studies have identified the importance of
brand equity dimensions for individual products and services, few have tested the
model with FMCG companies. Findings provide implications for brand managers to
manage the brand equity of the Indian FMCG brands.
Key words: brand equity, brand loyalty, brand association, perceived quality and
brand awareness
Abstract
Bijuna C Mohan
Assistant Professor, Department of Humanities
Social Sciences and Management
National Institute of Technology Karnataka,
Mangalore, India
Dr. A H Sequeira
Professor, Department of Humanities
Social Sciences and Management
National Institute of Technology Karnataka,
Mangalore, India
ISSN 2277-5846
ISSN 2277 – 5846I
ISSN 2277 - 5846
2277 - 5846
THE INTERNATIONAL JOURNAL OF MANAGEMENT
Vol: 1/ Issue : 4 (October, 2012) www.theijm.com 2
1. Introduction
Brands are considered to be the valuable assets of business. Branding and brand equity has been the
topic of interest for the researchers in the area of Marketing. Because of the significant intangible
value of brands, building and managing brand equity had become a priority for companies of all
sizes in a wide variety of industries and markets (Lehmann, Keller, & Farley, 2008). Brands are at
the heart of marketing and business strategy (Doyle, 1998). The strategic importance of branding is
duly recognized in the literature by several researchers (Aaker, 1991,1992; deChernatony &
McDonald, 1998; Kapferer, 1994).
Fast Moving Consumer Goods are also known as Consumer Packaged Goods (CPG). FMCGs are
products that have a quick turnover, and relatively low cost. FMCG products are those that get
replaced within a year and they constitute a major part of consumers‟ budget in many countries. The
FMCG sector primarily operates on low margin and therefore success very much depends on the
volume of sales (Sarangapani & Mamatha 2008).
Marketing of FMCGs plays a pivotal role in the growth and development of a country irrespective of
the size and population. It is a fact that the development of FMCG marketing has always kept pace
with the economic growth of India. Although the literature identifies several dimensions of brand
equity from different other industries, existing research on brand equity in the FMCG industry is still
spare. Despite the growing importance of the Indian FMCG industry, the topic of how the different
FMCG products builds brand equity appears to be under-researched. The end results of this research
also lead to a deeper understanding of a FMCG brand equity concept as well as some implications
for practitioners working in the FMCG industry.
Apart from the implications in the FMCG industry, the content and meaning of brand equity have been
debated in different ways and for a number of different purposes, so far no common viewpoint has been
emerged (Vazquez , Rio & Iglesias, 2002; Keller, 2003). Although several authors have elaborated on
the definition and content of brand equity, the number of studies which empirically test its proposed
constructs is limited Despite the richness in conceptual and operational definitions and models for brand
equity, there is a marked scarcity of quantitative research examining its constructs based on solid
empirical data (Atilgan, Aksoy, & Akinci, 2005). Although a great amount of research has been
conducted regarding the concept of customer-based brand equity, few researchers have developed
specific items measuring four brand equity constructs. Moreover certain researchers suggested the brand
equity model to be a three factor one and not a four factor model depending on the type of the industry.
THE INTERNATIONAL JOURNAL OF MANAGEMENT
Vol: 1/ Issue : 4 (October, 2012) www.theijm.com 3
The objective of this paper is to test the most popularly adopted brand equity dimensions of Aaker
(1991). This study aims to empirically test and operationalize the customer based brand equity
components and how they interact within the context of FMCG industry in India.
2. Literature Review
2.1 Brand Equity
Brand equity has been viewed from a variety of perspectives by different researchers. Farquhar
(1989) viewed brand equity from three perspectives: firm perspective, trade perspective and
consumer perspective. Srivastava and Shocker‟s (1991) definition could be categorized in the group
of definitions in which brand equity represents both financial and consumer perspective. According
to them, brand equity consists of brand strength and brand value. According to Keller (1993), there
are two motivations for studying brand equity. First one being the financial based motivation to
estimate the value of the brand more precisely for accounting purposes or for merger, acquisitions or
divestiture purposes. Although a financial approach may provide a more precise insight into the
valuation of brand, it may not be useful for brand managers to establish marketing strategies because
financial approach is only limited to a brand‟s value estimation. The second motivation arises from a
strategy based motivation to improve marketing productivity.
The two perspectives of brand equity discussed by Lassar, Mittal and Sharma (1995) are financial
based (Simon & Sullivan 1993) and customer based. Proponents of financial perspective consider
brand equity as the total value of a brand which is a separable asset when it is sold or included in a
balance sheet (Feldwick, 1996). According to Simon & Sullivan (1993) brand equity is defined as
the incremental cash flows which accrue to branded products over unbranded products. The customer
based brand equity emphasizes customer‟s mindset. Further few researchers have suggested two
types of brand equity: organizational brand equity and customer brand equity (Capon, Berthon,
Hulbert & Pitt, 2001).
The consensus is that brand equity can be examined from two important perspectives-financial and
customer based. The financial approach measures brand value by isolating the net additional cash
flows created by the brand. These additional cash flows are the result of customer‟s willingness to
buy one brand more than its competitors, even when another brand is cheaper. Customers pay more
because of the beliefs and brands that are created overtime in their minds through the marketing of
the brand. Customer equity is the preamble of financial equity.
THE INTERNATIONAL JOURNAL OF MANAGEMENT
Vol: 1/ Issue : 4 (October, 2012) www.theijm.com 4
A firm‟s most valuable asset for improving marketing productivity is the knowledge that has been
created about the brand in consumer‟s minds from the firm‟s investment in previous marketing
programs. Here brand equity is conceptualized from the perspective of the customer. Hence this
study focus on the customer based perspective and concentrates on measures that is related to the
consumer mindset like the associations, evaluations and relationships customers have towards the
brand.
2.2 Customer Based Brand Equity
For a brand to have value it must be valued by the customer. The power of the brand lies in what
customers have learned, felt, seen and heard about the brand as a result of their experiences over time
(Keller, 2003). If the brand has no meaning to the customer, none of the other perspectives of brand
equity is meaningful (Keller, 1993; Cobb-Walgren & Ruble 1995; Rio et al. 2001). There will be
value to the investor, the manufacturer and the retailer only if there is value to the consumer (Cobb-
Walgren et al. 1995).
Conceptualizing brand equity from customer perspective is useful because it suggests both specific
guidelines for marketing strategies and tactics and areas where research can be useful in assisting
managerial decision making. The source of brand equity is customer perceptions (Keller 1993) hence
it is important for managers to measure and track brand equity at the customer level (Lassar, Mittal,
& Sharma, 1995). The customer based brand equity approach is more practical as the information
offers a strategic vision of customer behavior and managers can develop strategies accordingly(Jin-
Sun, 2008). Brands exist in the minds of their potential consumers and what those consumers think
of a particular brand determines the value it has to its owner. A brand‟s foundations are, therefore,
composed of people‟s intangible mental associations about it. In placing a value on a brand, the
strength and resilience of those associations is considered the most (Dyson et al. 1996). Based on the
detailed reviews the study focuses on the customer based brand equity.
2.3 Dimensions of Customer Based Brand Equity
In the brand equity literature there are two main frameworks that conceptualize customer based
brand equity. Keller (1993) considers brand equity as being the “differential effect of brand
knowledge on consumer response to the marketing of the brand”. To understand how customer
based brand equity can be built, measured and managed; Keller (1998) described a detailed
conceptualization of brand knowledge. Brand knowledge is defined in terms of two components,
brand awareness and brand image. The brand image is defined as the perceptions about a brand as
reflected by the brand associations held in consumer‟s memory (Keller 1993). Another framework
THE INTERNATIONAL JOURNAL OF MANAGEMENT
Vol: 1/ Issue : 4 (October, 2012) www.theijm.com 5
was proposed by Aaker (1991) which is one of the most generally accepted and comprehensive
definitions of the brand equity (Buil, Chernatony, & Martínez, 2008). Aaker (1991, 1996) considers
brand equity as “a set of brand assets and liabilities linked to a brand, its name and symbol that add
to or subtract from the value provided by a product or service to a firm and / or to that firm‟s
customers”. The set of assets / liabilities are grouped into five categories: brand loyalty, brand name
awareness, perceived brand quality, brand associations and other proprietary brand assets. Other
proprietary brand assets include patents, trademarks and channel relationships. The fifth component
other proprietary brand assets is not relevant to consumer perception. Hence only the first four
dimensions should be regarded as customer based brand equity (Yoo & Donthu 2001).
The concept of customer based brand equity can be operationalised from two angles. Those
involving consumer perceptions (cognitive approach) and those involving consumer behavior
(behavioral approach) (Silverman, Sprott, & Pascal, 1998). The consumer perceptions include brand
awareness, brand associations and perceived quality. Yoo et al. (2000) represents the behavioral
approach and Keller (1993, 1998) represents the cognitive approach of brand equity. Brand equity is
viewed as perceived brand quality of both the brand‟s tangible and intangible components. Customer
based brand equity occurs when the consumer is familiar with the brand and holds some favorable,
strong and unique brand associations in the memory (Kamakura & Russell 1991). Based on the
definition by Kamakura and Russell (1991), there are five important considerations to defining brand
equity. First, brand equity refers to consumer perceptions rather than any objective indicators.
Second, brand equity refers to a global value associated with a brand. Third, the global value
associated with the brand stems from the brand name and not only from physical aspects of the
brand. Fourth, brand equity is not absolute but relative to competition. Finally, brand equity
positively influences financial performance. The customer-based brand equity scale is based on the
five underlying dimensions of brand equity: performance, value, social image, trustworthiness and
commitment.
Brand equity was considered as a two dimensional construct consisting of brand strength and brand
value (Srivastava & Shocker, 1991). Brand strength includes brand association (Lassar et al., 1995)
and brand value is the gains that accrue on the brand. Brand strength constitutes the brand
associations held by customers. Brand value is the financial outcome of the management‟s ability to
leverage brand strength via strategic actions to provide superior current and future profits. Brand
equity dimensions according to Lassar et al. (1995) include performance, value, social image,
trustworthiness and commitment.
THE INTERNATIONAL JOURNAL OF MANAGEMENT
Vol: 1/ Issue : 4 (October, 2012) www.theijm.com 6
In the study conducted by K. Kim et al. (2008), five factors were identified that influence the
creation of brand equity through successful customer relationships: trust, customer satisfaction,
relationship commitment, brand loyalty and brand awareness. An empirical test of the relationships
among these factors suggests that hospitals can be successful in creating image and positive brand
equity if they can manage their customer relationships well. Brand loyalty and brand value
associations directly create brand equity for online companies (Rios & Riquelme, 2008).
Form studying the various dimensions of brand equity proposed by different researchers, it can be
observed all the model are finally culminating on the model proposed by Aaker(1991). To strengthen
the model the concept of brand association is measured based on three constructs- perceived value,
brand personality and organizational association. Hence this study conceptualized brand equity based
on the model proposed by Aaker (1991) as this is the most generally accepted and the most
comprehensive definition (Motameni & Shahroki 1998). Aaker‟s model complements the customer
based brand equity quite well, because it takes the perceived quality aspect into account (Ovidiu
2005). Other researchers who accepted the findings of Aaker include Low and Lamb (2000).
This study considers brand loyalty, brand awareness, perceived quality along with brand associations
as the important dimensions of brand equity. Although many researchers agree on the conceptual
model of the four components of brand equity, empirical results have not been supportive. In the
previous studies by Yoo and Donthu (2001) and Washburn and Plank (2002), they had used student
samples to validate the consumer based brand equity scale. This research aims to improve the
measurement of brand equity for FMCG products by using a sample of actual FMCG consumers. To
address the gap, an effort is made in this research to focus on measuring brand equity of FMCG
brands, and to identify the important contributors of brand equity in the FMCG industry in India
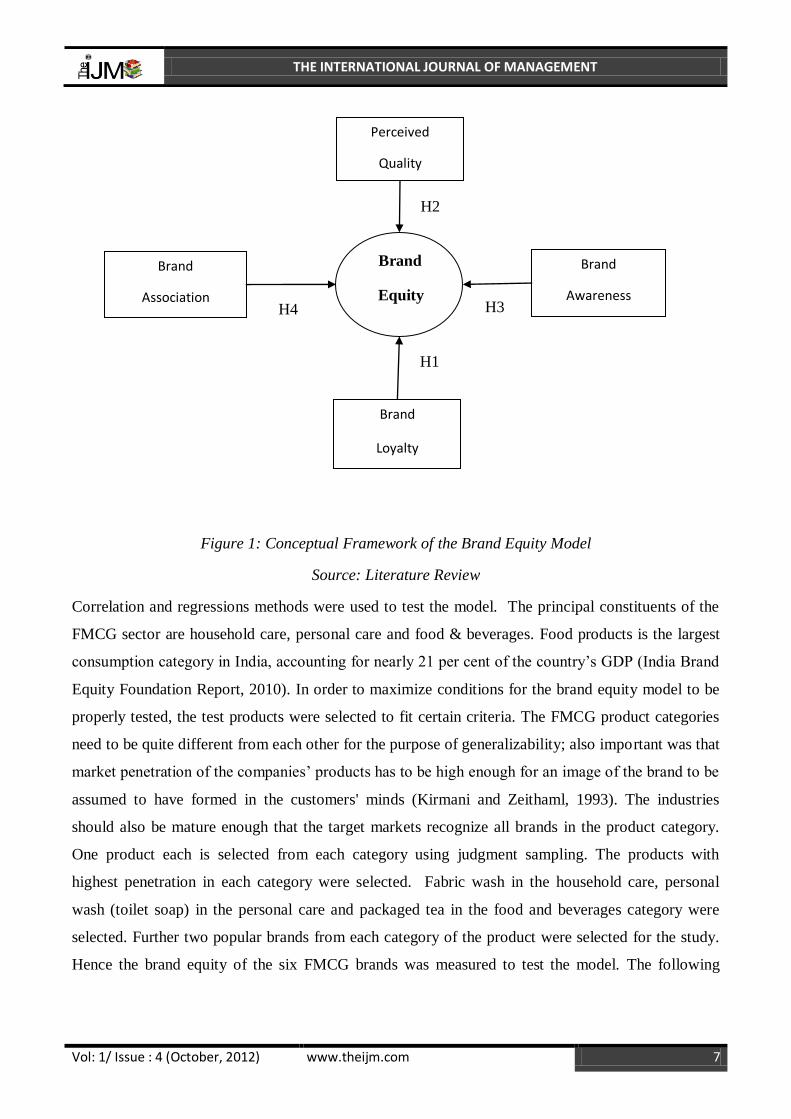
3. Conceptual Framework and Research Hypotheses
A conceptual framework was developed based on the literature review, pilot study and the
experience of the researchers. The framework presented here draws on a brand equity model
proposed by Aaker (Figure 1). The model indicates that brand awareness, brand loyalty, perceived
quality and brand associations create brand equity. The important contributors of brand association
are also included.
THE INTERNATIONAL JOURNAL OF MANAGEMENT
Vol: 1/ Issue : 4 (October, 2012) www.theijm.com 7
Figure 1: Conceptual Framework of the Brand Equity Model
Source: Literature Review
Correlation and regressions methods were used to test the model. The principal constituents of the
FMCG sector are household care, personal care and food & beverages. Food products is the largest
consumption category in India, accounting for nearly 21 per cent of the country‟s GDP (India Brand
Equity Foundation Report, 2010). In order to maximize conditions for the brand equity model to be
properly tested, the test products were selected to fit certain criteria. The FMCG product categories
need to be quite different from each other for the purpose of generalizability; also important was that
market penetration of the companies‟ products has to be high enough for an image of the brand to be
assumed to have formed in the customers' minds (Kirmani and Zeithaml, 1993). The industries
should also be mature enough that the target markets recognize all brands in the product category.
One product each is selected from each category using judgment sampling. The products with
highest penetration in each category were selected. Fabric wash in the household care, personal
wash (toilet soap) in the personal care and packaged tea in the food and beverages category were
selected. Further two popular brands from each category of the product were selected for the study.
Hence the brand equity of the six FMCG brands was measured to test the model. The following
Brand
Equity
H1
H3 H4
H2
Brand
Awareness
Perceived
Quality
Brand
Association
Brand
Loyalty
THE INTERNATIONAL JOURNAL OF MANAGEMENT
Vol: 1/ Issue : 4 (October, 2012) www.theijm.com 8
section outlines the justification of the traditional brand equity sources and the selection of the
constructs to model of brand equity for FMCG companies.
3.1 Brand Loyalty
Brand loyalty had a positive and direct role in affecting brand equity. The other three
constructs like perceived quality, brand association and brand awareness had a very low influence
on brand equity (Atilgan et al., 2005). It was also noted in the above study that there is a correlation
between brand loyalty, brand awareness and perceived quality. In the study done by Atilgan, Aksoy
and Akinci (2005) in the beverage industry, brand loyalty was found to have a dominant effect on
brand equity. On examining the practicality and applications of Aaker‟s customer-based brand
equity model in the Chinese sportswear market it was found that brand association and brand
loyalty are influential dimensions of brand equity. Weak support was found for the perceived
quality and brand awareness dimensions (Tong & Hawley 2009). Since the importance of brand
loyalty varies with different sector, it was necessary to identify its influence on brand equity. The
following hypothesis derives from the above:
Hypothesis 1: Brand loyalty has a significant positive effect on brand equity in the FMCG industry.
3.2 Perceived Quality
Even though perceived quality was considered as a important dimension of brand equity, the
importance of perceived quality for FMCG need to be probed. The main reason that perceived
quality is a primary dimension in brand equity models is that it has a strategic effect on brand equity,
by reducing the perceived risk (Aaker 1991; Erdem et al. 2004; Keller 1993). Perceived risks are
high in the case of services than products. Moreover FMCGs are products that are considered as low
involvement products. Hence the relevance of perceived quality of FMCG products in building brand
equity had to be identified. The following hypothesis is proposed:
Hypothesis 2: Perceived quality has a significant positive effect on brand equity in the FMCG
industry.
3.3 Brand Awareness and Brand Association
Does awareness of the brand by consumers play an important role in building brand equity of
FMCGs? Is brand awareness a different construct for brand equity of FMCGs or should it be
combined with brand association? Brand awareness is the ability of a potential buyer to recognize or
recall that a brand is a member of a certain product category. Here, a link between product class and
brand is involved. Rossiter and Percy (1987) defined brand awareness as the consumer‟s ability to
THE INTERNATIONAL JOURNAL OF MANAGEMENT
Vol: 1/ Issue : 4 (October, 2012) www.theijm.com 9
identify or recognize the brand. Brand association is anything “linked” in memory to a brand. Brand
association includes the variables of perceived value, brand personality and organizational
association.
Yoo et al. (2000) treated brand equity as a three dimensional construct, combining brand awareness
and brand association into one dimension. Brand awareness was not considered as a significant
factor of brand equity in the hotel industry (Kayaman & Arasli, 2007).The findings of the study
supported the three dimensional model of customer based brand equity in hotel industry. In a study
conducted in the product category of cars and televisions the consumer based brand equity was
proved as a four dimensional construct (Pappu, Quester, & Cooksey, 2005). In the study by (Atilgan
et al., 2005) brand awareness and brand associations were also found to be correlated. In the
multidimensional brand equity scale developed by Yoo and Donthu (2001), brand awareness and
brand association were not separated into two distinctive dimensions. Hence the authors suggested a
three-factor brand equity model by combining brand awareness and brand association into one
dimension. Washburn and Plank (2002) supported Yoo and Donthu‟s (2001) finding, demonstrating
the strongest and cleanest fit of the three-factor structure. According to them researchers should
focus on the distinction between the dimensions of brand awareness and brand associations.
According to Kim, Jin-Sun and Kim (2008), in the lodging industry (service industry) the competing
model linking outcome variables with three factors of brand equity demonstrated a better fit than the
proposed model with four factors of brand equity. Hence in this study the researchers had tried to
examine the relationship of brand awareness and brand association with brand equity independently.
From the previous justification the following hypotheses were proposed:
Hypothesis 3: There is a relationship between brand awareness and brand equity in the
FMCG industry.
Hypothesis 4: There is a relationship between brand association and brand equity in the
FMCG industry.
4. Methodology
The study is based on the descriptive approach which involved the description of phenomena or
characteristics associated with a subject population (FMCG consumers) and for discovery of
associations among different brand equity and its variables. A clear theoretical position was
developed prior to the collection of data; hence the research is based on the deductive approach.
THE INTERNATIONAL JOURNAL OF MANAGEMENT
Vol: 1/ Issue : 4 (October, 2012) www.theijm.com 10
4.1 Measures
The instrument (a self-administered questionnaire) contained 22 items that measured the four sources
and outcomes of brand equity. The items were assessed on a five-point Likert scale where 1 stands
for “strongly disagree” and 5 for “strongly agree”. The measures for several constructs in the
framework were derived from existing scales or studies in the literature. Two items were designed to
measure brand awareness and were adapted from Aaker 1996; Yoo et al. 2000; Yoo & Donthu 2001;
Netemeyer et al. 2004. Six items measured brand loyalty (Aaker 1996; Yoo et al. 2000; Yoo &
Donthu 2001) and four items measure perceived quality (Yoo et al. 2000). The six-item scale for
brand loyalty was adapted from measures developed by Aaker, Odin et al., 2001 and Yoo & Donthu,
2001. The dimension of brand association which included perceived value, brand personality and
organizational association were derived from Aaker (1996) and Pappu et al. (2005). Ten items were
used to measure brand association. Four brand equity items were designed to capture the overall
brand equity. The questionnaires were pretested on 10 respondents to identify and eliminate
potential problems on question content and wording. Based on the pretest necessary changes have
been incorporated.
4.3 Validity and Reliability of Measures
In order to test the reliability of the overall brand equity scale and each of the brand equity
dimensions Cronbach‟s alpha was calculated. The alpha meets the recommended levels of 0.70 for
all the measures (Nunnally 1978). The Cronbach‟s alpha coefficient for brand equity dimensions
ranked from 0.754 to 0.933, indicating good internal consistency and reliability among the items
within each dimension. The Cronbach‟s alpha was also calculated for perceived value, brand
personality and organizational association which constitute the different dimension of brand
association. The construct validity of the instrument is justified because the measures were
developed from a theoretical framework that was derived from an extensive literature review.
4.3 Questionnaire
On the basis of the items used in the literature and the definition established in the study, a pool of
measures was generated. Three product categories were chosen where two brands were evaluated
within each category of FMCG products. Survey corresponding to the three product categories and
six brands were drafted. The questionnaire consists of two parts. Part I included the general
information which collects the demographic details like gender, age, education, marital status,
THE INTERNATIONAL JOURNAL OF MANAGEMENT
Vol: 1/ Issue : 4 (October, 2012) www.theijm.com 11
profession, income and place of residence. Part II consists of questions specific to different product
category and brands.
4.4 Sampling
Among the various sampling method, probability sampling was used for this research. In order to
achieve the objectives of the study the individuals who use FMCG products were considered as the
target population for the study. Under probability sampling, proportionate stratified random sampling
method is adopted for the study. Here the population is segregated into three strata-low, medium and
high- based on the per capita FMCG spend. Data was collected from a sample size of 826, FMCG
consumers.
5. Results
5.1 Sample Characteristics
The proportion of the male respondents (51 percent) in the sample was slightly higher than that of
female (49 percent). This demographic of the sample were compared to that of the national
population and it was very similar to the national proportion reflecting the proportionate mix of
males and females as FMCG consumers. The sample was skewed towards the younger population
with 51.3 percent of the respondents aged between 20-29 years. About 16 percent belonged to the
age group of 30-39 years, 13.6 percent belonged to the age group 40-49 years and 5.4 percent
belonged to the age group 50-59 years. This was deemed to represent the greater likelihood of
younger population which forms the majority of the Indian population to engage in the purchase and
use of FMCGs. It was also found that 52.1 percent of the FMCG consumers were graduates and 34.3
percent were post graduates indicating the younger people are educated. Among the respondents 54.5
percent were employees in various organizations and 27.7 percent were students from different
colleges. Nearly, 11.4 percent represent women who are housewives. The data indicates that majority
of the respondents were employed. The academic background was reflected in their employment
status.
5.2 Descriptive Statistics
Descriptive statistics providing information regarding mean and standard deviation for the FMCG
products were analysed. The results show that there was no strong response bias for any of the
variables. The degree of variations was not very high taking into account the three different types of
FMCG products-toilet soap, washing powder and packaged tea-considered for the study. The study
THE INTERNATIONAL JOURNAL OF MANAGEMENT
Vol: 1/ Issue : 4 (October, 2012) www.theijm.com 12
was also spread across five different States of India. Descriptive information regarding the means
and standard deviations indicated the respondents high response towards brand recognition, brand
appearance, satisfaction level, consistent quality, quality in appearance, value for money, reasonable
price, organizational trust, organizational credibility, admire the organization and brand
characteristics. Low response were shown towards, regular purchase, intention to buy, first choice,
recommend the brand, not buy other brands, high quality, comparative quality, reason to buy,
interesting brand and clear image. In terms of the mean scores, the „brand recognition‟ dimension
had the highest mean score (3.79), while the „Not buy other brands‟ had the lowest mean score
(3.10).
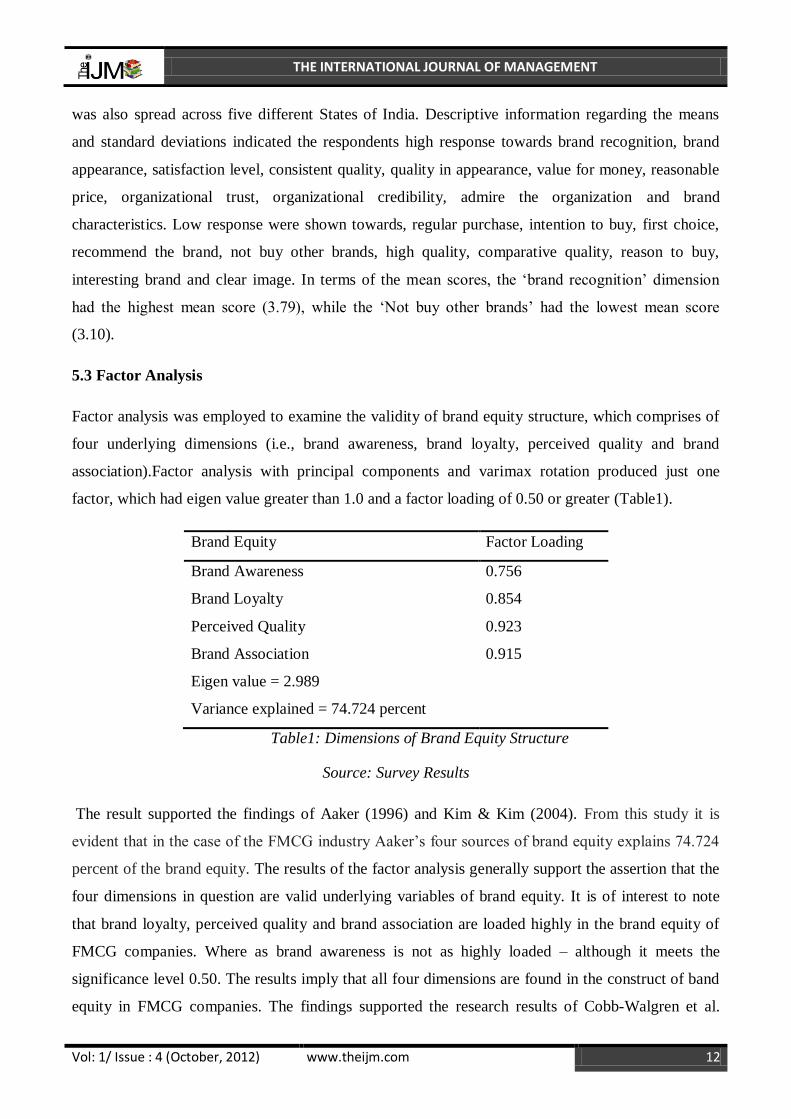
5.3 Factor Analysis
Factor analysis was employed to examine the validity of brand equity structure, which comprises of
four underlying dimensions (i.e., brand awareness, brand loyalty, perceived quality and brand
association).Factor analysis with principal components and varimax rotation produced just one
factor, which had eigen value greater than 1.0 and a factor loading of 0.50 or greater (Table1).
Brand Equity Factor Loading
Brand Awareness 0.756
Brand Loyalty 0.854
Perceived Quality 0.923
Brand Association 0.915
Eigen value = 2.989
Variance explained = 74.724 percent
Table1: Dimensions of Brand Equity Structure
Source: Survey Results
The result supported the findings of Aaker (1996) and Kim & Kim (2004). From this study it is
evident that in the case of the FMCG industry Aaker‟s four sources of brand equity explains 74.724
percent of the brand equity. The results of the factor analysis generally support the assertion that the
four dimensions in question are valid underlying variables of brand equity. It is of interest to note
that brand loyalty, perceived quality and brand association are loaded highly in the brand equity of
FMCG companies. Where as brand awareness is not as highly loaded – although it meets the
significance level 0.50. The results imply that all four dimensions are found in the construct of band
equity in FMCG companies. The findings supported the research results of Cobb-Walgren et al.
THE INTERNATIONAL JOURNAL OF MANAGEMENT
Vol: 1/ Issue : 4 (October, 2012) www.theijm.com 13
(1995) and Pappu et al. (2005) who had established that consumer-based brand equity is a four
dimensional construct, consistent with the conceptualization of Aaker (1991).
5.5 Testing of Hypotheses
The hypothesis test included Pearson correlation coefficient (r), standardized regression coefficients
(β) and coefficient of determination (adjusted R square).
High, significant and positive correlation was found between „brand loyalty‟ (r = 0.717, p<0.001)
and overall brand equity in the FMCG industry. Even though brand loyalty was considered as one of
the most important determinants of brand equity (Aaker 1991; Yoo et al. 2000
Significantly high correlation was also found between „perceived quality‟(r = 0.704, p<0.001) and
overall brand equity. In the customer-based brand equity frameworks proposed by different
researchers (Aaker 1996; Dyson et al. 1996; Farquhar 1989; Keller 1993), perceived quality is
considered a primary dimension. For FMCG products it can be concluded that perceived quality
creates a basis for brand differentiation and extension (Aaker 1991), and offers a pr ice premium
advantage for firms (Keller 1993; Netemeyer et al. 2004).
„Brand association‟ (r = 0.750, p<0.001) also was highly and significantly correlated with overall
brand equity. The findings justify the statement of Keller (1993), who stated “customer-based brand
equity occurs when the consumer is aware of the brand and holds some favorable, strong, and unique
brand associations in memory”.
Only moderate correlation was found between „brand awareness‟ (r = 0.407, p<0.001) and overall
brand equity. This leads to the conclusion that brand awareness alone cannot lead to improved brand
equity. Brand awareness might be important if the product is a new product. For an existing product
brand awareness cannot guarantee brand equity. The findings are similar to the studies of Yoo et al.
(2000) and Yoo & Donthu (2001), where the dimension of brand awareness was incorporated into
their empirical models but the findings did not detected any direct effect on brand equity. The
correlation ranked highest for brand association, second for brand loyalty, third for perceived quality
and fourth for brand awareness. These findings are consistent with the findings of Aaker (1991) and
Pappu et al. (2005) who also reported the links between brand equity and its four dimensions. This
finding indicates that each of the four dimensions is appropriately conceived as a determinant of
brand equity in the FMCG industry. Brand awareness and brand associations in the study have also
emerged as a distinct dimension as originally conceptualized in Aaker‟s (1991) model, eventhough it
THE INTERNATIONAL JOURNAL OF MANAGEMENT
Vol: 1/ Issue : 4 (October, 2012) www.theijm.com 14
was combined with brand awareness into a single dimension in some other studies (Yoo & Donthu,
2001; Yoo et al., 2000).
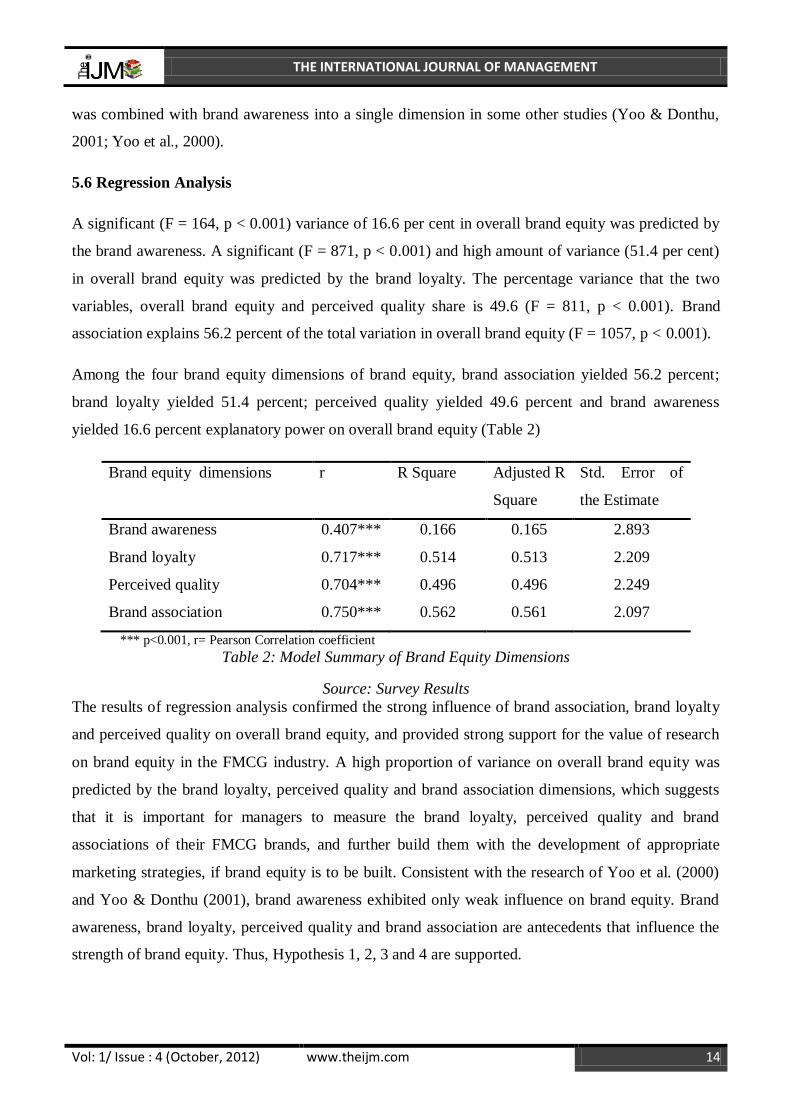
5.6 Regression Analysis
A significant (F = 164, p < 0.001) variance of 16.6 per cent in overall brand equity was predicted by
the brand awareness. A significant (F = 871, p < 0.001) and high amount of variance (51.4 per cent)
in overall brand equity was predicted by the brand loyalty. The percentage variance that the two
variables, overall brand equity and perceived quality share is 49.6 (F = 811, p < 0.001). Brand
association explains 56.2 percent of the total variation in overall brand equity (F = 1057, p < 0.001).
Among the four brand equity dimensions of brand equity, brand association yielded 56.2 percent;
brand loyalty yielded 51.4 percent; perceived quality yielded 49.6 percent and brand awareness
yielded 16.6 percent explanatory power on overall brand equity (Table 2)
Brand equity dimensions r R Square Adjusted R
Square
Std. Error of
the Estimate
Brand awareness 0.407*** 0.166 0.165 2.893
Brand loyalty 0.717*** 0.514 0.513 2.209
Perceived quality 0.704*** 0.496 0.496 2.249
Brand association 0.750*** 0.562 0.561 2.097
*** p<0.001, r= Pearson Correlation coefficient
Table 2: Model Summary of Brand Equity Dimensions
Source: Survey Results
The results of regression analysis confirmed the strong influence of brand association, brand loyalty
and perceived quality on overall brand equity, and provided strong support for the value of research
on brand equity in the FMCG industry. A high proportion of variance on overall brand equity was
predicted by the brand loyalty, perceived quality and brand association dimensions, which suggests
that it is important for managers to measure the brand loyalty, perceived quality and brand
associations of their FMCG brands, and further build them with the development of appropriate
marketing strategies, if brand equity is to be built. Consistent with the research of Yoo et al. (2000)
and Yoo & Donthu (2001), brand awareness exhibited only weak influence on brand equity. Brand
awareness, brand loyalty, perceived quality and brand association are antecedents that influence the
strength of brand equity. Thus, Hypothesis 1, 2, 3 and 4 are supported.
THE INTERNATIONAL JOURNAL OF MANAGEMENT
Vol: 1/ Issue : 4 (October, 2012) www.theijm.com 15
The findings showed that brand loyalty had significant influence on overall brand equity (H1: t =
29.517, p < 0.001). Similarly perceived quality (H2: t = 28.488, p < 0.001); brand awareness (H3: t =
12.804, p < 0.001) and brand association (H4: t = 32.516, p < 0.001) had a significantly positive
influence on overall brand equity.
As mentioned earlier, the collinearity between brand awareness and brand association for further
probed. Therefore, it was decided to test for multi-collinearity by investigating the Tolerance and
Variance Inflation Factor (VIF). Tolerance which indicated the percent of variance in the predictor
that cannot be accounted for by other predictors was more than 0.25 in all the cases. VIF was less
than 3.9. All the VIF values less than 10, which indicate the multi-collinearity assumption was not
violated (Hair et al. 2006). Eigen value was less than 5 (critical value>10.0); and the Condition Index
is less than 28.7 (critical value >30.0). Thus, none of the values indicate high and dangerous multi-
collinearity. Based on the findings, we conclude that no significant multi-collinearity problems were
confronted in this study there by indicating no strong relationship between brand awareness and
association.
Hence the brand equity model for the FMCG industry will be four factor one, with brand awareness,
brand loyalty, perceived quality and brand association as the four dimensions.
6. Discussion and Managerial implications
Building brand equity is crucial for FMCG products where consumers heavily depend on the brand
for the product category in a highly competitive and brand conscious market. Researchers found that
brand awareness, brand loyalty, perceived quality and brand associations had a significant effect on
band equity. Brand association demonstrated the strongest impact, indicating the essential role of
developing feels and thoughts with the brand in building brand equity in the Indian FMCG industry.
This means that, consistent with previous studies, strong associations that support a competitively
attractive and distinct brand position could create a favorable feeling and behavior toward the FMCG
brands. The results also portrayed the significant influence of brand loyalty to the development of
brand equity. The empirical data and statistical tests in the study provided support for the positive
and direct relationship between perceived quality and brand equity. Surprisingly, brand awareness
emerged as a not so important factor indicating that having a brand name alone is not a guarantee of
a successful brand in the FMCG industry. Since marketing and brand managers often have limited
resources in terms of money, time, and manpower to implement branding strategies, these findings
can help them prioritize and allocate resources across the dimensions.
THE INTERNATIONAL JOURNAL OF MANAGEMENT
Vol: 1/ Issue : 4 (October, 2012) www.theijm.com 16
References
1. Aaker, D.A (1992). Managing the most important asset: brand equity, Planning Review,
20(5),56-58.
2. Aaker. D. A. (1991). Managing Brand Equity, The Free Press, New York.
3. Aaker, D.A. (1996). Building strong brands, The Free Press, New York.
4. Atilgan, E., Aksoy. S.K., & Akinci, S. (2005). Determinants of the brand equity- a
verification approach in the beverage industry in Turkey, Marketing Intelligence & Planning,
23(3), 237-248.
5. Brown, T.J. and Dacin, P.A. (1997). The company and the product: corporation associations
and consumer product responses, Journal of Marketing, 61, 68-84.
6. Buil.I., Chernatony de L. & Martı´nez., E.(2008). A cross-national validation of the
consumer- based brand equity scale, Journal of Product & Brand Management, 17(6),384–
392.
7. Capon, N., Berthon, P., Hulbert, J. M., & Pitt, L. (2001). Brand custodianship: A new primer
for senior managers, European Management Journal, 19(3), 215-227.
8. Chen, A.C-H. (2001).Using free association to examine the relationship between the
characteristics of brand associations and brand equity”, Journal of Product & Brand
Management, 10(7),439-451.
9. Cobb-Walgren, C.J., Ruble, C.A. & Donthu, N. (1995). Brand equity, brand preference, and
purchase intent, Journal of Advertising, 24(3),25-40.
10. Cooper.,D,& Schindler. (2008), Business Research Methods 9th
Edn., Tata McGrawHill
publishing company Ltd : New Delhi.
11. de Chernatony, L. and McDonald, M. (1998). Creating Powerful Brands in Consumer,
Service and Industrial Markets, 2nd ed., Butterworth-Heinemann, Woburn, MA.
12. Dyson, P., Farr, A., & Hollis, N. S. (1996) Understanding, measuring, and using brand
equity, Journal of Advertising Research, 36(6), 9–22.
13. Erdem T., Zhao, Y., & Valenzuela, A. (2004). Performance of store brands: A cross-country
analysis of consumer store brand preferences, perceptions, and risk. Journal of Marketing
Research, 41(1), 86–100.
14. Farquhar, P. H. (1989). Managing brand equity, Marketing Research, 1(3), 24-33.
THE INTERNATIONAL JOURNAL OF MANAGEMENT
Vol: 1/ Issue : 4 (October, 2012) www.theijm.com 17
15. Farquhar,P.H & Herr,P.M(1993). The dual structure of brand association, Brand Equity and
Advertising, 263-77.
16. Feldwick, P. (1996).Do we really need brand equity? The Journal of Brand Management,
4(1),9-28.
17. Kamakura, W.A. & Russell, G.J. (1991). Measuring Consumer Perceptions of Brand Quality
with Scanner Data: Implications for Brand Equity, Report Number 91-122, Marketing
Science Institute, Cambridge, MA.
18. Kapferer, J. N (1994). Strategic Brand Management: New Approaches to Creating and
Evaluating Brand Equity, The Free Press, New York, NY.
19. Kayaman R., & Arasli H.(2007). Customer based brand equity: evidence from the hotel
industry, Managing Service Quality, 17(1),92-109.
20. Keller, K.L & Lehmann, D.R.(2003), How do brands create value?, Marketing Management,
12(3),26.
21. Keller, K.L. (1993). Conceptualizing, measuring, and managing customer-based brand
equity‟, Journal of Marketing, 57(1),1-22.
22. Keller, K.L. (1998). Strategic brand management, building, measuring and managing brand
equity, Prentice Hall, Upper Saddle River, NJ.
23. Kim, K. H., Kim, K. S., Kim, Y. D., Kim, J.H., & Kang, S.H. (2008). Brand equity in
hospital marketing, Journal of Business Research, 61, 75-82.
24. Kim, W.G. & Kim, H. - B. (2004), “Measuring customer based restaurant brand equity-
investigating the relationship between brand equity and firms‟ performance”, Cornell Hotel
and Restaurant Administration Quarterly, 45(2), 115-131.
25. Kim, W.G. & Sun, B.J. & Kim, J.H.,(2008). Multidimensional customer-based brand equity
and its consequences in mid-priced hotels, Journal of Hospitality & Tourism Research, 32(2),
235-254.
26. Kirmani, A. and Zeithaml, V.A. (1993), Advertising, perceived quality, and brand image, in
Aaker, D.A. and Biel, A.L. (Eds), Brand Equity & Advertising: Advertising's Role in Building
Strong Brands, Lawrence Erlbaum Associates, Hilldale, NJ, pp. 143-62.
27. Lassar, W., Mittal, B. & Sharma, A. (1995). Measuring customer-based brand equity, Journal
of Consumer Marketing, 12(4), 11-19.
28. Lehmann,D.R.,Keller,K.L &Farley,J.U.(2008). The structure of survey-based brand metrics,
Journal of International Marketing, 16(4), 29-56.
THE INTERNATIONAL JOURNAL OF MANAGEMENT
Vol: 1/ Issue : 4 (October, 2012) www.theijm.com 18
29. Low, G. S. & Lamb, C.W. (2000). The measurement and dimensionality of brand
associations, Journal of Product & Brand Management, 9(6), 350-368.
30. Motameni R & Shahrokhi M (1998). Brand equity valuation: a global perspective, Journal of
Product and Brand Management, 7(4), 275-290.
31. Nunnally, J. 1978, Psychometric Theory, McGraw-Hill, New York, NY.
32. Odin Yorick , Nathalie Odin, and Pierre Vallette-Florence, “Conceptual and Operational
Aspects of Brand Loyalty: An Empirical Investigation,” Journal of Business Research, vol.
53, no. 2 (2001), pp. 75–84.
33. Ovidiu I. Moisescu, The Concept of Brand Equity - A Comparative Approach, The
Proceedings of the International Conference, The Impact of European Integration on the
National Economy”, Risoprint, Cluj-Napoca, 2005
34. Pappu Ravi, Queste Pascale and Cooksey, Ray W. 2005,‟ Consumer-based brand equity:
improving the measurement – empirical evidence‟, Journal of Product & Brand
Management, vol.14, no.3, pp.143-154.
35. Price Waterhouse Coopers. (2010). Fast Moving Consumer Goods, A report by Price
Waterhouse Coopers for IBEF.
36. Rio, A., Vazquez, R. and Iglesias, V. (2001). The role of the brand name in obtaining
differential advantages, Journal of Product & Brand Management, 10(7), 452-65.
37. Rios, R.E. & Riquelme, H.E. (2008). Brand equity for online companies, Marketing
Intelligence & Planning , 26( 7), 719-742
38. Rossiter, J.R & Percy, L. (1987) Advertising and Promotion Management, New
York:McGraw-Hill.
39. Sarangapani, A & Mamatha, T.(2008). Rural consumer behaviour with regard to selected
FMCGs consumption patterns and brand usage: a study, The Icfai University Journal of
Brand Management, 5(3), 22-61.
40. Silverman,S.N.,Sprott,D.E &Pascal,V.J.(1999). Relating consumer-based sources of
brand equity to market outcomes, Advances in Consumer Research, 26, 352-358.
41. Simon, C.J & M.W Sullivan. (1993). The measurement and determinants of brand equity: a
financial approach, Marketing Science, 12(1),28–52.
42. Srivastava, R.K. & Shocker, A.D.(1991). Brand equity: A perspective on its meaning and
measurement report, No. 91-124, Working Paper Series, Marketing Science Institute
Cambridge, MA.
THE INTERNATIONAL JOURNAL OF MANAGEMENT
Vol: 1/ Issue : 4 (October, 2012) www.theijm.com 19
43. Tong, X. & Hawley, J. M. (2009). Measuring customer-based brand equity: empirical
evidence from the sportswear market in China, Journal of Product & Brand Management,
18(4), 262–271.
44. Vazquez, R., Del Rio, A.B. and Iglesias, V. (2002). Consumer-based brand equity:
development and validation of a measurement instrument, Journal of Marketing
Management, 18( ½), 27-49.
45. Washburn, J.H. & Plank. R.E (2002). Measuring brand equity: an evaluation of a consumer-
based brand equity scale, Journal of Marketing Theory and Practice, 10(1),46-62.
46. Yoo, Boonghee & Lee S (2000), An Examination of Selected Marketing Mix Elements and
Brand Equity,” Academy of Marketing Science, 28 (20), 195–211.
47. Yoo, B. & Donthu, N.(2001). Developing and validating multidimensional consumer-based
48. brand equity scale, Journal of Business Research, 52(1), 1-14.