Embed Size (px)
Citation preview
Curvature Ductility Of Reinforced Concrete Beam (Monita Olivia, Parthasarathi Mandal)
1
CURVATURE DUCTILITY OF REINFORCED CONCRETE BEAM
Monita Olivia, Parthasarathi Mandal
ABSTRACT
The aim of this paper is to examine the influence of three variables on curvature ductility of reinforced concrete beams. A computer program was developed to predict moment-curvature and available curvature ductility of reinforced concrete beams with or without axial loads. Ten beams with different variables were analysed using the program. The variables measured are concrete strength, amount of longitudinal reinforcement and spacing of transverse reinforcement. The input consists of beam geometry, material properties and loading. A confined stress-strain curve for concrete proposed by Saatcioglu and Razvi (1992) is applied in the program, while, steel stress-strain model is adopted from BS 8110 (British Standard Institution 1985). Computer analysis indicates that the curvature ductility increases with the increase of longitudinal reinforcement and concrete strength. On the other hand, the spacing of transverse reinforcement does not have any significant influence on the curvature ductility.
Key words : computer analysis, curvature ductility, moment-curvature, reinforced concrete
beams
1. INTRODUCTION
Ductility of reinforced structures is a desirable property where resistance to brittle failure during flexure is required to ensure structural integrity. Ductile behaviour in a structure can be achieved through the use of plastic hinges positioned at appropriate locations throughout the structural frame. These are designed to provide sufficient ductility to resist structural collapse after the yield strength of the material has been achieved. The available ductility of plastic hinges in reinforced concrete is determined based on the shape of the moment-curvature relations.
Ductility may be defined as the ability to undergo deformations without a substantial reduction in the flexural capacity of the member (Park & Ruitong 1988). According to Xie et al, (1994), this deformability is influenced by some factors such as the tensile reinforcement ratio, the amount of longitudinal compressive reinforcement, the amount of lateral tie and the strength of concrete. The ductility of reinforced concrete section could be expressed in the form of the curvature ductility (µφ):
y
u
φφµφ =
where φu is the curvature at ultimate when the concrete compression strain reaches a specified limiting value, φy is the curvature when the tension reinforcement first reaches the yield strength. The definition of φy shows the influence of the yield strength of reinforcement steel
Volume 6 No. 1, Oktober 2005 : 1 - 13
2
on the calculation of µφ, while the definition of φu reflects the effect of ultimate strain of concrete in compression.
Park & Paulay (1975) have suggested that the yield curvature of a reinforced concrete section is taken when the tension steel first yields. Assuming an under-reinforced section, first yield will occur in the steel, then the moment and curvature are:
My = Asfyd''
dkE
f
dk s
ysyy )1()1( −
=−
=ε
φ
where k = √{(ρ + ρ')2n2 + 2 [ρ + (ρ'd/d)]n} - (ρ + ρ')n, ρ = As/bd is the tensile reinforcement ratio, ρ' = As
’/bd is the compression steel ratio, n = Es/Ec = modular ratio, Es, Ec is the modulus elasticity of the steel and the concrete, d'' is the distance from centroid of compressive forces in the steel and concrete to the centroid of tension.
The ultimate curvature of reinforced concrete section is defined as the maximum value of concrete strain at the extreme compressive fibre. It can be written as:
Mu = 0.85 f'c ab(d-a/2) + A's fy (d-d')
accc
u1βεεφ ==
where bf
sfAAsfa
c
yy
'85.0
'−=
where fy is the steel yield strength, f'c is the concrete compressive strength, β1 is the depth of the equivalent rectangular stress block. ACI 318-71 (Park & Paulay 1975) conservatively recommends a value of 0.003. In Eurocode 8 ENV 1994-1-3 (European Committee for Standardization 1994) the nominal value of ultimate concrete strain (εcu) for unconfined concrete needed to calculate Conventional Curvature Ductility Factor (CCDF) is 0.0035, while implicitly for confined concrete it is larger than 0.0035.
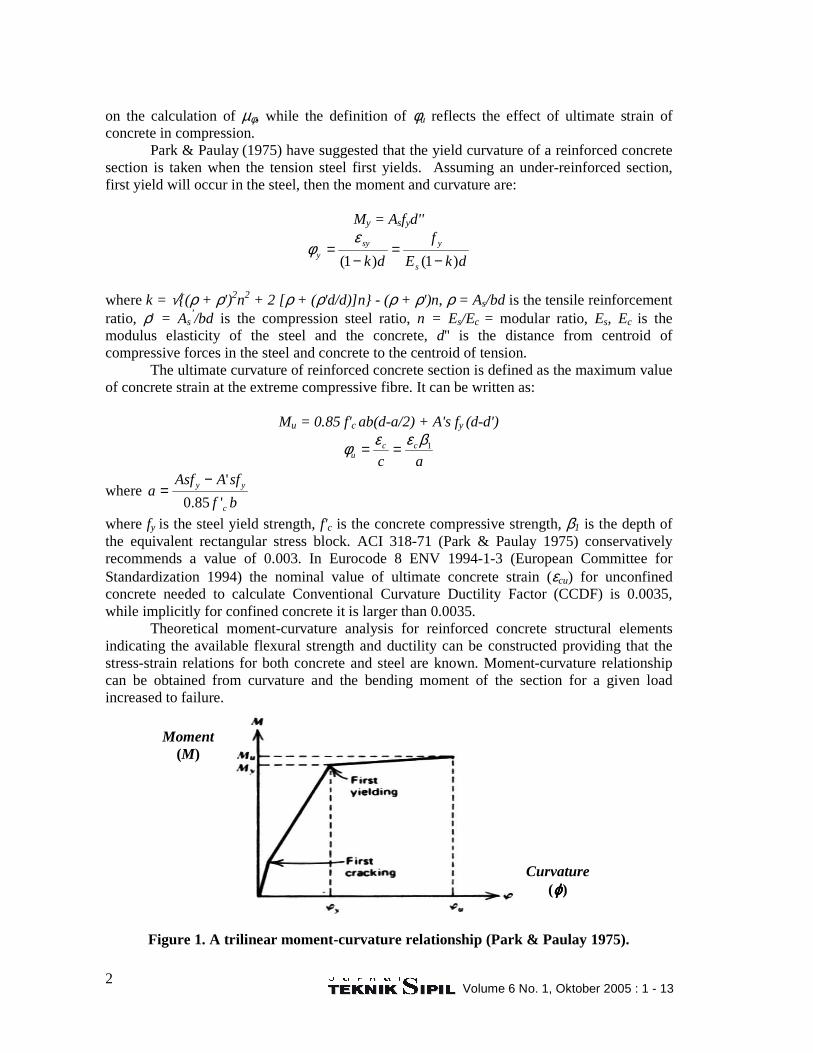
Theoretical moment-curvature analysis for reinforced concrete structural elements indicating the available flexural strength and ductility can be constructed providing that the stress-strain relations for both concrete and steel are known. Moment-curvature relationship can be obtained from curvature and the bending moment of the section for a given load increased to failure.
Figure 1. A trilinear moment-curvature relationship (Park & Paulay 1975).
First yielding
First cracking
Moment (M)
Curvature (ϕϕϕϕ)
Curvature Ductility Of Reinforced Concrete Beam (Monita Olivia, Parthasarathi Mandal)
3
A trilinear moment-curvature relationship shown in Figure 1 is defined by the points of cracking and yielding. Uncracked, cracked and yielded behaviors are depicted by straight lines. Park & Paulay (1975) found that the curve is linear in its initial stage, and the relationship between moment M and curvature is given by the classical elastic equation:
EI = MR = M/ϕ
where EI is the flexural rigidity of the section. Based on the procedures proposed by Park & Ruitong (1988), the moment,
corresponding to the chosen value (εcm) and axial load (P) is obtained by taking moments of the internal forces.
where fci is the concrete stress in the i-th layer, fsj is the steel stress in the j-th layer, Aci is the area of concrete in the i-th layer, Asj is the steel stress in the j-th layer, di and dj are the the distance of the centroid of i-th layer for concrete and of j-th lamina for steel, from reference axis for moment calculation, n is the number of layer of concrete, m is the number of layer for steel. The curvature is given by:
ccmεϕ =
where εcm is the concrete strain in the extreme compression fibre, c is the neutral axis depth. The variables affecting curvature ductility may be classified under three groups (after
Derecho 1989), namely 1) loading variable such as the level of axial load; 2) geometric variables such as the amount of tension and compression reinforcement, amount of transverse reinforcement and the shape of the section; and 3) material variables such as the yield strength of reinforcement and characteristic strength of concrete.
The objective of this study is to analyse curvature ductility of 10 beams with three different variables. A computer program was developed to establish ductility analysis for those reinforced concrete beams. The software, referred to CD Analysis, provides moment-curvature analysis and curvature ductility analysis.
2. METHODOLOGY
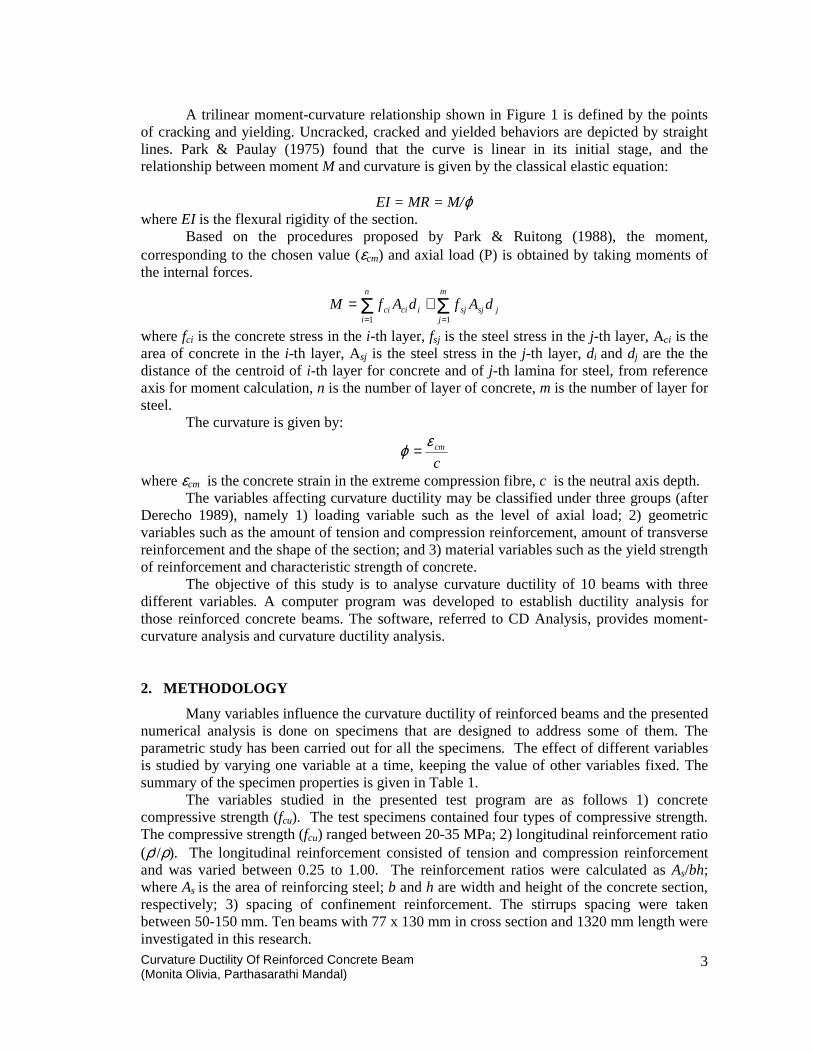
Many variables influence the curvature ductility of reinforced beams and the presented numerical analysis is done on specimens that are designed to address some of them. The parametric study has been carried out for all the specimens. The effect of different variables is studied by varying one variable at a time, keeping the value of other variables fixed. The summary of the specimen properties is given in Table 1.
The variables studied in the presented test program are as follows 1) concrete compressive strength (fcu). The test specimens contained four types of compressive strength. The compressive strength (fcu) ranged between 20-35 MPa; 2) longitudinal reinforcement ratio (ρ'/ρ). The longitudinal reinforcement consisted of tension and compression reinforcement and was varied between 0.25 to 1.00. The reinforcement ratios were calculated as As/bh; where As is the area of reinforcing steel; b and h are width and height of the concrete section, respectively; 3) spacing of confinement reinforcement. The stirrups spacing were taken between 50-150 mm. Ten beams with 77 x 130 mm in cross section and 1320 mm length were investigated in this research.
jsjsj
m
jicici
n
i
dAfdAfM ΣΣ==
+=11
Volume 6 No. 1, Oktober 2005 : 1 - 13
4
ε085
Confined Unconfine
f'cc
0.85f'c
f'co
0.85f'c
0.20f'c
ε01 ε1 ε85 ε20
Stress (f )
Strain εεεε
Table 1. Specimen properties
Beam No.
fcu (MPa)
Diameter of tensile reinforce-
ment (mm)
ρρρρ
Diameter of compression
reinforce- ment (mm)
ρρρρ' ρρρρ'/ρρρρ
Diameter of
stirrups (mm)
Spacing of
stirrups (mm)
1 25 2#6 0.00704 2#6 0.00704 1.0 3 75
2 25 2#8 0.01263 2#6 0.00710 0.55 3 75
3 25 2#10 0.01993 2#6 0.00717 0.36 3 75
4 25 2#12 0.02898 2#6 0.00725 0.25 3 75
5 20 2#10 0.01993 2#6 0.00717 0.36 3 75
6 30 2#10 0.01993 2#6 0.00717 0.36 3 75
7 35 2#10 0.01993 2#6 0.00717 0.36 3 75
8 25 2#10 0.01993 2#6 0.00717 0.36 3 50
9 25 2#10 0.01993 2#6 0.00717 0.36 3 100
10 25 2#10 0.01993 2#6 0.00717 0.36 3 150
A computer program was run to estimate moment-curvature relationship and curvature
ductility of reinforced concrete section. The program incorporates effect of concrete confinement. In this research, stress-strain curve of confined concrete was adopted from Saatcioglu and Razvi (Saatciouglu & Razvi 1992). The assumed stress-strain curve of steel reinforcement from BS 8110 (British Standard Institution 1985) is modified to simplify the analysis.
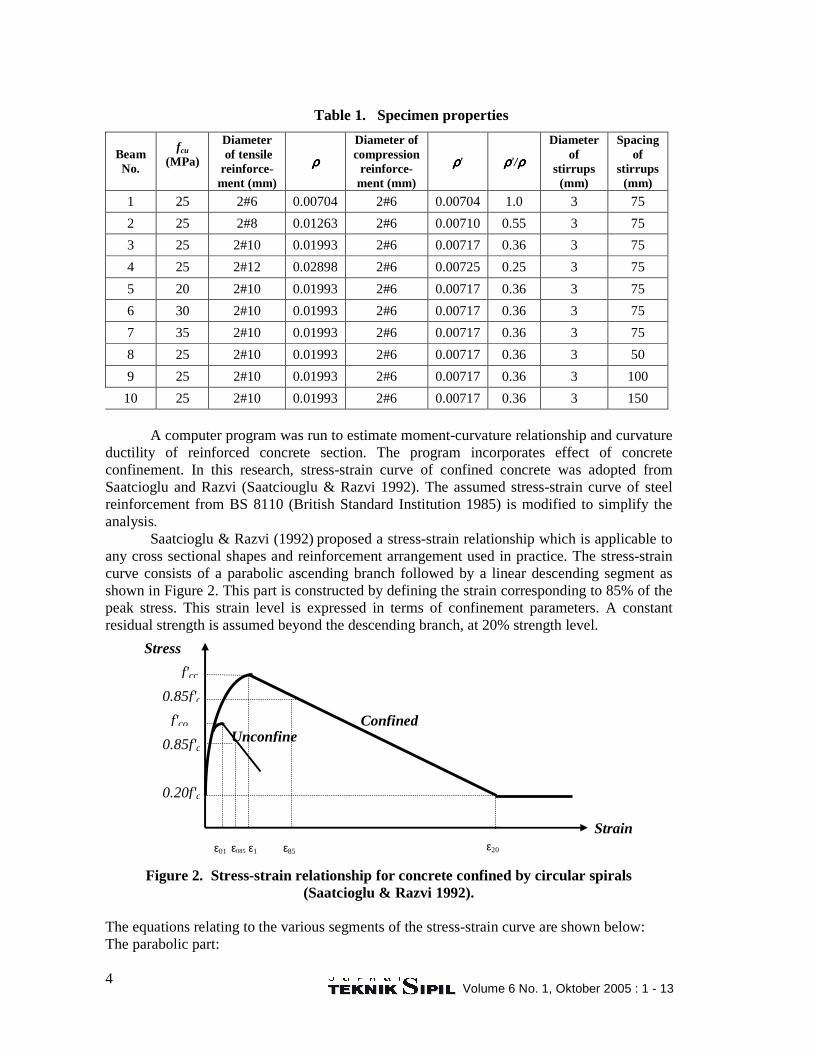
Saatcioglu & Razvi (1992) proposed a stress-strain relationship which is applicable to any cross sectional shapes and reinforcement arrangement used in practice. The stress-strain curve consists of a parabolic ascending branch followed by a linear descending segment as shown in Figure 2. This part is constructed by defining the strain corresponding to 85% of the peak stress. This strain level is expressed in terms of confinement parameters. A constant residual strength is assumed beyond the descending branch, at 20% strength level.
Figure 2. Stress-strain relationship for concrete confined by circular spirals (Saatcioglu & Razvi 1992).
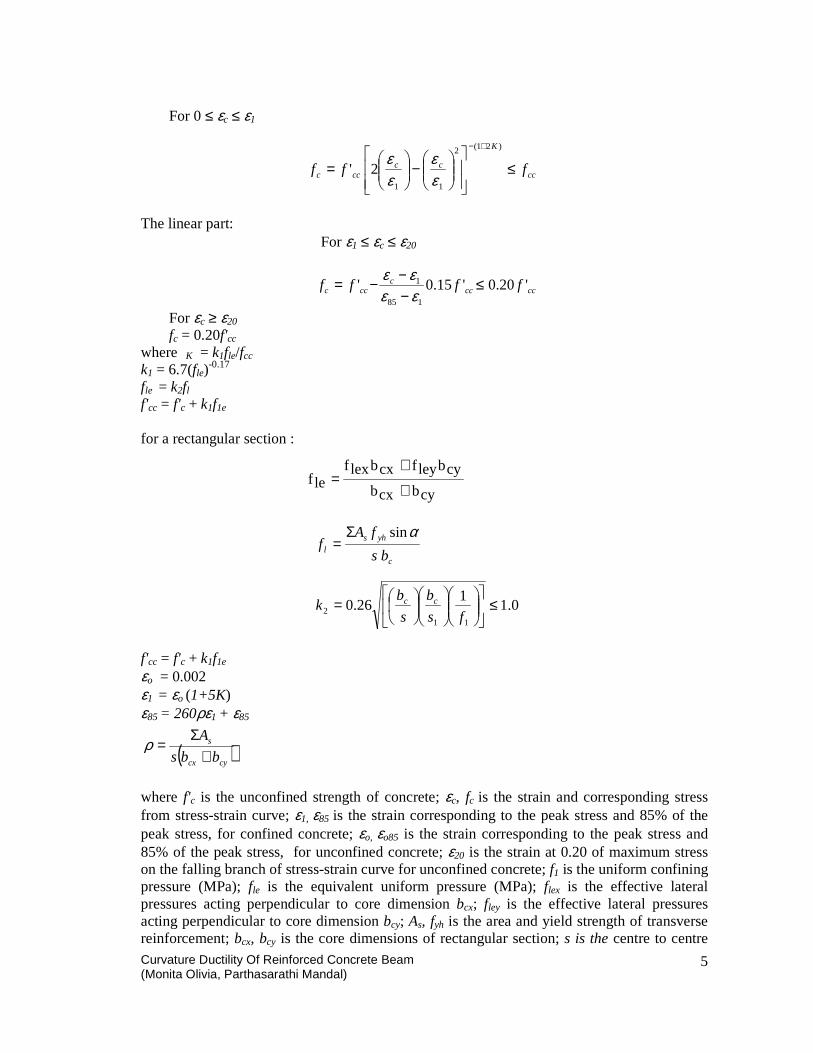
The equations relating to the various segments of the stress-strain curve are shown below: The parabolic part:
Curvature Ductility Of Reinforced Concrete Beam (Monita Olivia, Parthasarathi Mandal)
5
For 0 ≤ εc ≤ ε1
The linear part:
For ε1 ≤ εc ≤ ε20
For εc ≥ ε20 fc = 0.20f'cc
where K = k1fle/fcc k1 = 6.7(fle)
-0.17 fle = k2fl f'cc = f'c + k1f1e
for a rectangular section :
f'cc = f'c + k1f1e
εo = 0.002 ε1 = εo (1+5K) ε85 = 260ρε1 + ε85
where f'c is the unconfined strength of concrete; εc, fc is the strain and corresponding stress from stress-strain curve; ε1, ε85 is the strain corresponding to the peak stress and 85% of the peak stress, for confined concrete; εo, εo85 is the strain corresponding to the peak stress and 85% of the peak stress, for unconfined concrete; ε20 is the strain at 0.20 of maximum stress on the falling branch of stress-strain curve for unconfined concrete; f1 is the uniform confining pressure (MPa); fle is the equivalent uniform pressure (MPa); flex is the effective lateral pressures acting perpendicular to core dimension bcx; fley is the effective lateral pressures acting perpendicular to core dimension bcy; As, fyh is the area and yield strength of transverse reinforcement; bcx, bcy is the core dimensions of rectangular section; s is the centre to centre
cc
K
ccccc fff ≤
−
=
+− )21(2
11
2'εε
εε
ccccc
ccc ffff '20.0'15.0'185
1 ≤−−−=
εεεε
( )cycx
s
bbs
A
+Σ
=ρ
cybcxb
cybleyfcxblexflef
+
+=
c
yhsl bs
fAf
αsinΣ=
0.11
26.011
2 ≤
=fs
b
s
bk cc
Volume 6 No. 1, Oktober 2005 : 1 - 13
6
distance of tie spacing; s is the spacing between laterally supported longitudinal reinforcement.
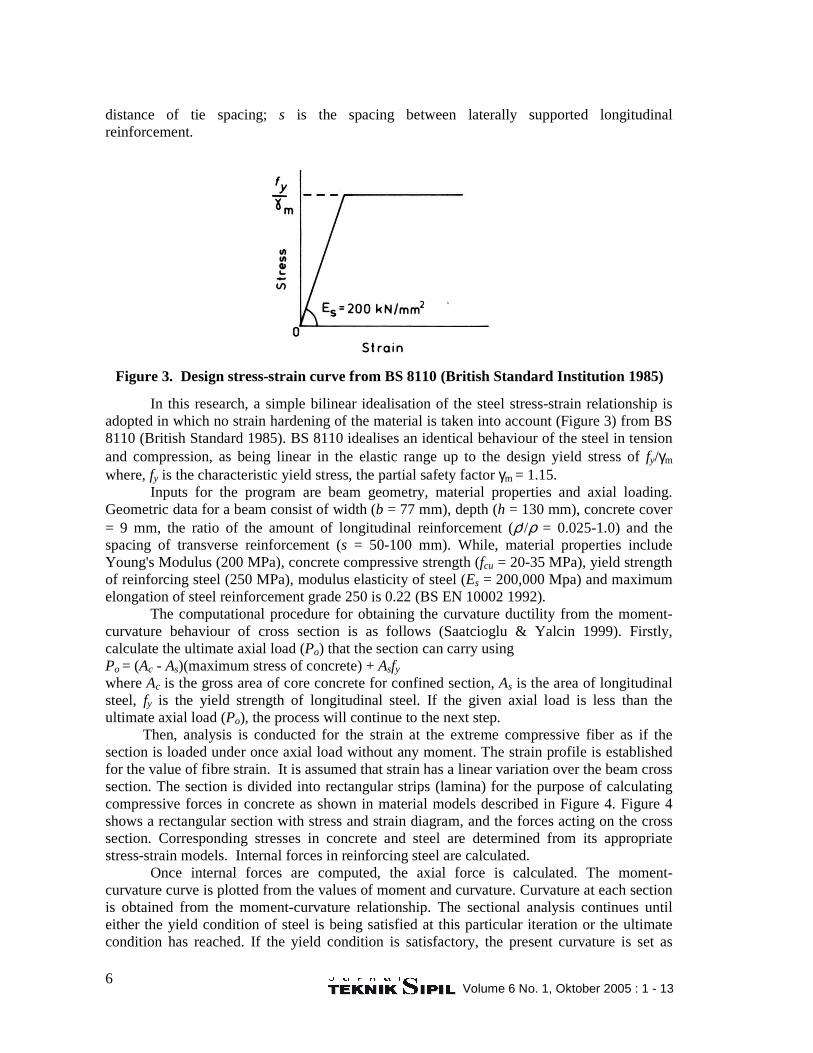
In this research, a simple bilinear idealisation of the steel stress-strain relationship is adopted in which no strain hardening of the material is taken into account (Figure 3) from BS 8110 (British Standard 1985). BS 8110 idealises an identical behaviour of the steel in tension and compression, as being linear in the elastic range up to the design yield stress of fy/γm where, fy is the characteristic yield stress, the partial safety factor γm = 1.15.
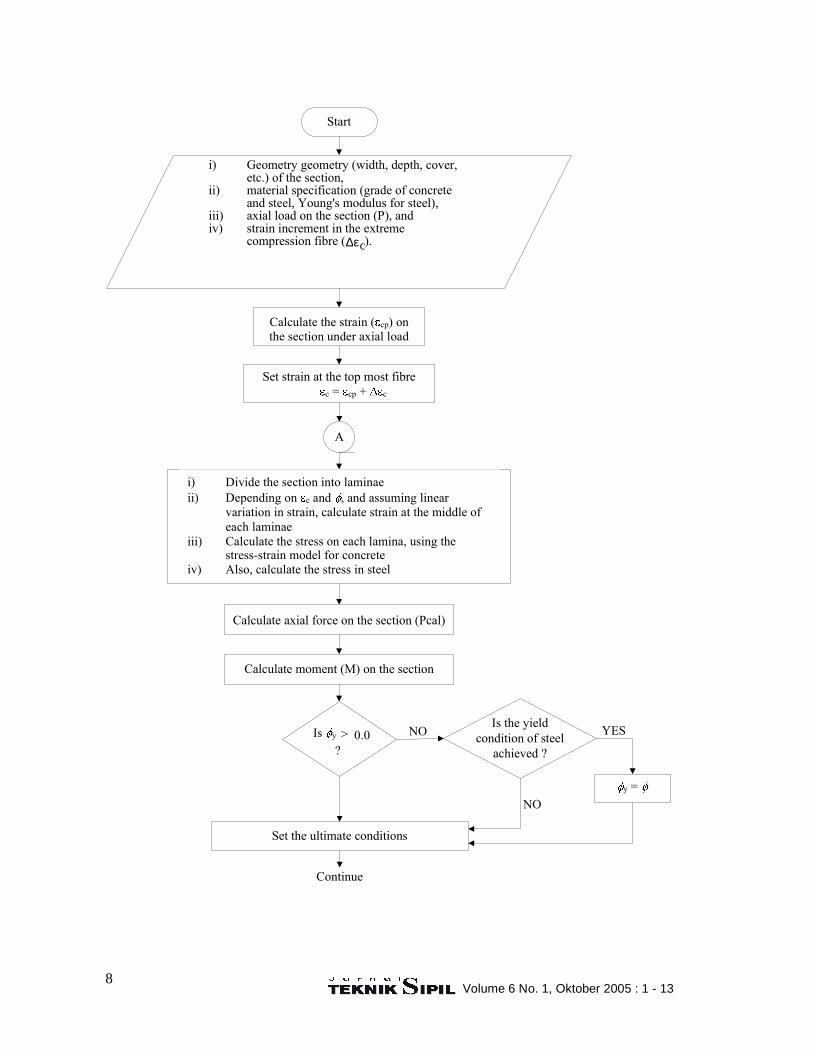
Inputs for the program are beam geometry, material properties and axial loading. Geometric data for a beam consist of width (b = 77 mm), depth (h = 130 mm), concrete cover = 9 mm, the ratio of the amount of longitudinal reinforcement (ρ'/ρ = 0.025-1.0) and the spacing of transverse reinforcement (s = 50-100 mm). While, material properties include Young's Modulus (200 MPa), concrete compressive strength (fcu = 20-35 MPa), yield strength of reinforcing steel (250 MPa), modulus elasticity of steel (Es = 200,000 Mpa) and maximum elongation of steel reinforcement grade 250 is 0.22 (BS EN 10002 1992). The computational procedure for obtaining the curvature ductility from the moment-curvature behaviour of cross section is as follows (Saatcioglu & Yalcin 1999). Firstly, calculate the ultimate axial load (Po) that the section can carry using Po = (Ac - As)(maximum stress of concrete) + Asfy where Ac is the gross area of core concrete for confined section, As is the area of longitudinal steel, fy is the yield strength of longitudinal steel. If the given axial load is less than the ultimate axial load (Po), the process will continue to the next step.
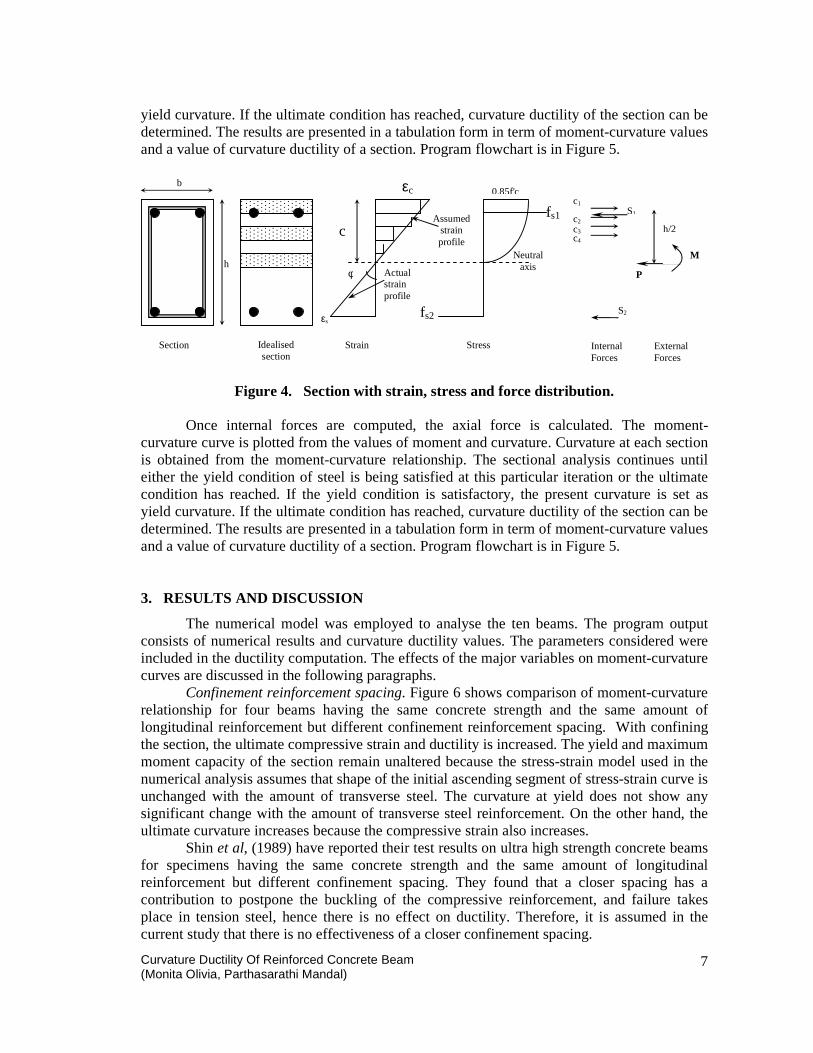
Then, analysis is conducted for the strain at the extreme compressive fiber as if the section is loaded under once axial load without any moment. The strain profile is established for the value of fibre strain. It is assumed that strain has a linear variation over the beam cross section. The section is divided into rectangular strips (lamina) for the purpose of calculating compressive forces in concrete as shown in material models described in Figure 4. Figure 4 shows a rectangular section with stress and strain diagram, and the forces acting on the cross section. Corresponding stresses in concrete and steel are determined from its appropriate stress-strain models. Internal forces in reinforcing steel are calculated.
Once internal forces are computed, the axial force is calculated. The moment-curvature curve is plotted from the values of moment and curvature. Curvature at each section is obtained from the moment-curvature relationship. The sectional analysis continues until either the yield condition of steel is being satisfied at this particular iteration or the ultimate condition has reached. If the yield condition is satisfactory, the present curvature is set as
Figure 3. Design stress-strain curve from BS 8110 (British Standard Institution 1985)
Curvature Ductility Of Reinforced Concrete Beam (Monita Olivia, Parthasarathi Mandal)
7
yield curvature. If the ultimate condition has reached, curvature ductility of the section can be determined. The results are presented in a tabulation form in term of moment-curvature values and a value of curvature ductility of a section. Program flowchart is in Figure 5.
Figure 4. Section with strain, stress and force distribution.
Once internal forces are computed, the axial force is calculated. The moment-
curvature curve is plotted from the values of moment and curvature. Curvature at each section is obtained from the moment-curvature relationship. The sectional analysis continues until either the yield condition of steel is being satisfied at this particular iteration or the ultimate condition has reached. If the yield condition is satisfactory, the present curvature is set as yield curvature. If the ultimate condition has reached, curvature ductility of the section can be determined. The results are presented in a tabulation form in term of moment-curvature values and a value of curvature ductility of a section. Program flowchart is in Figure 5. 3. RESULTS AND DISCUSSION
The numerical model was employed to analyse the ten beams. The program output consists of numerical results and curvature ductility values. The parameters considered were included in the ductility computation. The effects of the major variables on moment-curvature curves are discussed in the following paragraphs.
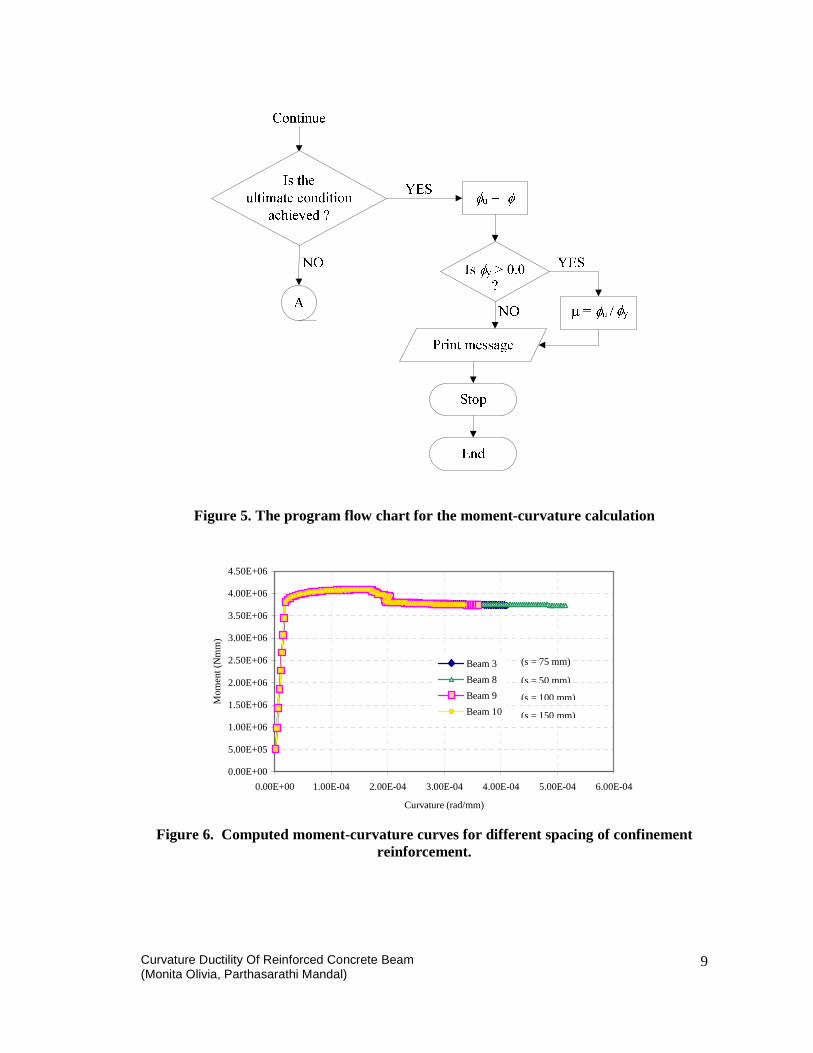
Confinement reinforcement spacing. Figure 6 shows comparison of moment-curvature relationship for four beams having the same concrete strength and the same amount of longitudinal reinforcement but different confinement reinforcement spacing. With confining the section, the ultimate compressive strain and ductility is increased. The yield and maximum moment capacity of the section remain unaltered because the stress-strain model used in the numerical analysis assumes that shape of the initial ascending segment of stress-strain curve is unchanged with the amount of transverse steel. The curvature at yield does not show any significant change with the amount of transverse steel reinforcement. On the other hand, the ultimate curvature increases because the compressive strain also increases.
Shin et al, (1989) have reported their test results on ultra high strength concrete beams for specimens having the same concrete strength and the same amount of longitudinal reinforcement but different confinement spacing. They found that a closer spacing has a contribution to postpone the buckling of the compressive reinforcement, and failure takes place in tension steel, hence there is no effect on ductility. Therefore, it is assumed in the current study that there is no effectiveness of a closer confinement spacing.
0.85f'c
h
b
Section Idealised section
εc
Neutral axis
fs1
fs2
c Assumed
strain profile
Actual strain profile
φ
εs
Strain Stress
c1
c2
c3 c4
S1
S2
M
P
h/2
Internal Forces
External Forces
M
Volume 6 No. 1, Oktober 2005 : 1 - 13
8
Start
i) Geometry geometry (width, depth, cover,etc.) of the section,
ii) material specification (grade of concreteand steel, Young's modulus for steel),
iii) axial load on the section (P), andiv) strain increment in the extreme
compression fibre ( ).cε∆
Calculate the strain ( cp) on
the section under axial load
Set strain at the top most fibre
c = cp + c
A
i) Divide the section into laminae
ii) Depending on c and , and assuming linear
variation in strain, calculate strain at the middle of
each laminae
iii) Calculate the stress on each lamina, using thestress-strain model for concrete
iv) Also, calculate the stress in steel
Calculate axial force on the section (Pcal)
Calculate moment (M) on the section
Is y > 0.0
?
NOIs the yield
condition of steel
achieved ?
y =
YES
Set the ultimate conditions
NO
Continue
Curvature Ductility Of Reinforced Concrete Beam (Monita Olivia, Parthasarathi Mandal)
9
Figure 5. The program flow chart for the moment-curvature calculation
Figure 6. Computed moment-curvature curves for different spacing of confinement
reinforcement.
0.00E+00
5.00E+05
1.00E+06
1.50E+06
2.00E+06
2.50E+06
3.00E+06
3.50E+06
4.00E+06
4.50E+06
0.00E+00 1.00E-04 2.00E-04 3.00E-04 4.00E-04 5.00E-04 6.00E-04
Curvature (rad/mm)
Mom
ent
(N
mm
)
Beam 3
Beam 8
Beam 9
Beam 10
(s = 75 mm)
(s = 50 mm)
(s = 100 mm)
(s = 150 mm)
Volume 6 No. 1, Oktober 2005 : 1 - 13
10
0.00E+00
5.00E+05
1.00E+06
1.50E+06
2.00E+06
2.50E+06
3.00E+06
3.50E+06
4.00E+06
4.50E+06
0.00E+00 1.00E-04 2.00E-04 3.00E-04 4.00E-04 5.00E-04 6.00E-04
Curvature (rad/mm)
Mom
ent
(N
mm
)
Beam 3
Beam 5
Beam 6
Beam 7
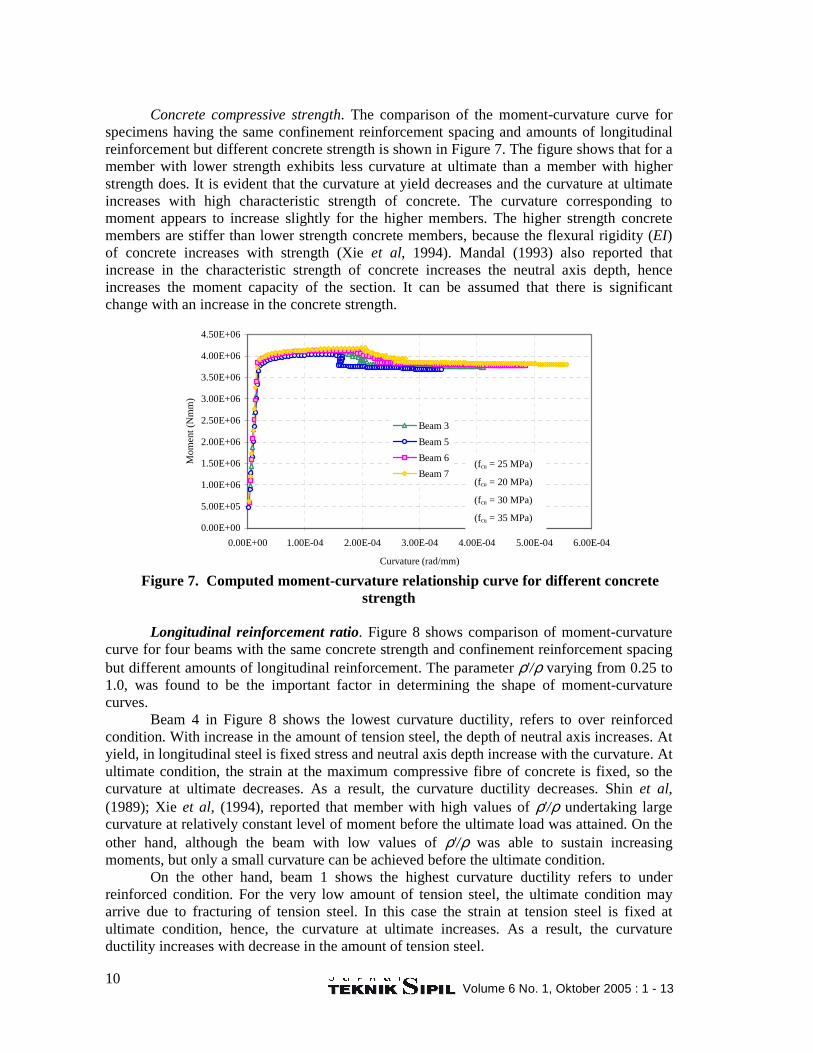
Concrete compressive strength. The comparison of the moment-curvature curve for specimens having the same confinement reinforcement spacing and amounts of longitudinal reinforcement but different concrete strength is shown in Figure 7. The figure shows that for a member with lower strength exhibits less curvature at ultimate than a member with higher strength does. It is evident that the curvature at yield decreases and the curvature at ultimate increases with high characteristic strength of concrete. The curvature corresponding to moment appears to increase slightly for the higher members. The higher strength concrete members are stiffer than lower strength concrete members, because the flexural rigidity (EI) of concrete increases with strength (Xie et al, 1994). Mandal (1993) also reported that increase in the characteristic strength of concrete increases the neutral axis depth, hence increases the moment capacity of the section. It can be assumed that there is significant change with an increase in the concrete strength.
Figure 7. Computed moment-curvature relationship curve for different concrete strength
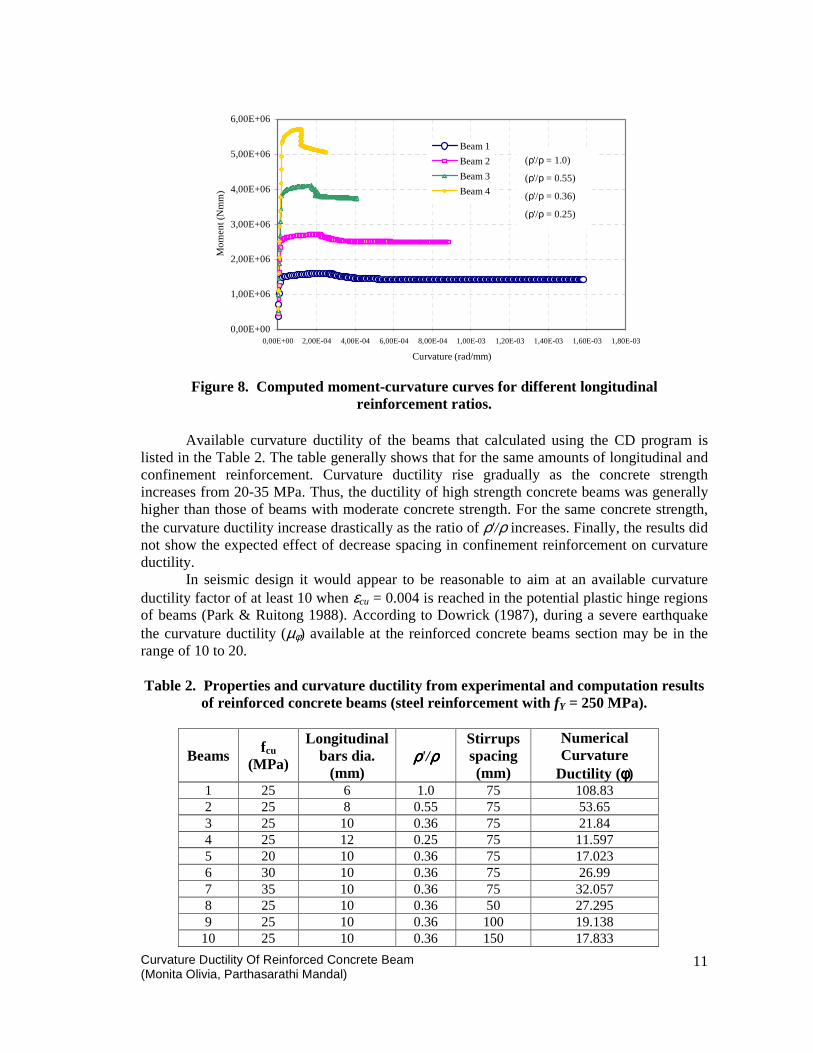
Longitudinal reinforcement ratio. Figure 8 shows comparison of moment-curvature
curve for four beams with the same concrete strength and confinement reinforcement spacing but different amounts of longitudinal reinforcement. The parameter ρ'/ρ varying from 0.25 to 1.0, was found to be the important factor in determining the shape of moment-curvature curves.
Beam 4 in Figure 8 shows the lowest curvature ductility, refers to over reinforced condition. With increase in the amount of tension steel, the depth of neutral axis increases. At yield, in longitudinal steel is fixed stress and neutral axis depth increase with the curvature. At ultimate condition, the strain at the maximum compressive fibre of concrete is fixed, so the curvature at ultimate decreases. As a result, the curvature ductility decreases. Shin et al, (1989); Xie et al, (1994), reported that member with high values of ρ'/ρ undertaking large curvature at relatively constant level of moment before the ultimate load was attained. On the other hand, although the beam with low values of ρ'/ρ was able to sustain increasing moments, but only a small curvature can be achieved before the ultimate condition.
On the other hand, beam 1 shows the highest curvature ductility refers to under reinforced condition. For the very low amount of tension steel, the ultimate condition may arrive due to fracturing of tension steel. In this case the strain at tension steel is fixed at ultimate condition, hence, the curvature at ultimate increases. As a result, the curvature ductility increases with decrease in the amount of tension steel.
(fcu = 25 MPa)
(fcu = 20 MPa)
(fcu = 30 MPa)
(fcu = 35 MPa)
Curvature Ductility Of Reinforced Concrete Beam (Monita Olivia, Parthasarathi Mandal)
11
0,00E+00
1,00E+06
2,00E+06
3,00E+06
4,00E+06
5,00E+06
6,00E+06
0,00E+00 2,00E-04 4,00E-04 6,00E-04 8,00E-04 1,00E-03 1,20E-03 1,40E-03 1,60E-03 1,80E-03
Curvature (rad/mm)
Mo
me
nt (
Nm
m)
Beam 1
Beam 2
Beam 3
Beam 4
Figure 8. Computed moment-curvature curves for different longitudinal reinforcement ratios.
Available curvature ductility of the beams that calculated using the CD program is listed in the Table 2. The table generally shows that for the same amounts of longitudinal and confinement reinforcement. Curvature ductility rise gradually as the concrete strength increases from 20-35 MPa. Thus, the ductility of high strength concrete beams was generally higher than those of beams with moderate concrete strength. For the same concrete strength, the curvature ductility increase drastically as the ratio of ρ'/ρ increases. Finally, the results did not show the expected effect of decrease spacing in confinement reinforcement on curvature ductility.
In seismic design it would appear to be reasonable to aim at an available curvature ductility factor of at least 10 when εcu = 0.004 is reached in the potential plastic hinge regions of beams (Park & Ruitong 1988). According to Dowrick (1987), during a severe earthquake the curvature ductility (µφ) available at the reinforced concrete beams section may be in the range of 10 to 20. Table 2. Properties and curvature ductility from experimental and computation results
of reinforced concrete beams (steel reinforcement with fY = 250 MPa).
Beams fcu
(MPa)
Longitudinal bars dia.
(mm) ρρρρ'/ρρρρ
Stirrups spacing (mm)
Numerical Curvature
Ductility (φφφφ) 1 25 6 1.0 75 108.83 2 25 8 0.55 75 53.65 3 25 10 0.36 75 21.84 4 25 12 0.25 75 11.597 5 20 10 0.36 75 17.023 6 30 10 0.36 75 26.99 7 35 10 0.36 75 32.057 8 25 10 0.36 50 27.295 9 25 10 0.36 100 19.138 10 25 10 0.36 150 17.833
(ρ'/ρ = 1.0)
(ρ'/ρ = 0.55)
(ρ'/ρ = 0.36)
(ρ'/ρ = 0.25)
Volume 6 No. 1, Oktober 2005 : 1 - 13
12
Beams have a higher curvature value compared to columns because they are designed to fail in a ductile manner with yielding of the tension steel. Although some codes of practice require the available ductility for beams in seismic design, the values will generally be exceeded during a severe earthquake (Park & Paulay 1975). The available curvature ductility values arising from CD Analysis are ranging from 11-108. It is evident that the available curvature ductility from CD analysis fits the ranges of ductility values according to some findings from previous research.
4. CONCLUSION
The effect of geometric and material variables on the available curvature ductility of reinforced concrete beam can be readily assessed using Curvature Ductility Program. As expected it was found that, with other variables held constant, the available curvature ductility factor is increased if the longitudinal reinforcement ratio is increased and the concrete compressive strength is increased. While, there is no significant increase if the confined reinforcement spacing is decreased.
REFERENCES British Standard Institution, BS 8110: Part 1: 1985. Structural Use of Concrete, London: BSI.
1985. Dowrick, D.J., 1987. Earthquake Resistant Design, Great Britain: John Wiley & Sons. European Committee for Standardization, Eurocode 8: 1994.Design provisions for earthquake
resistance of structures Part 3: Specific rules for various materials and elements. Mandal, P., 1993. Curvature ductility of reinforced concrete sections with and without
confinement, Master Thesis Department of Civil Engineering, Kanpur: Indian Institute of Technology Kanpur.
Park, R. & Paulay, T., 1975. Reinforced Concrete Structures, Canada: John Wiley & Sons. Park, R. & Ruitong, D., 1988. Ductility of doubly reinforced concrete beam section, ACI
Structural Journal 85: 217-225. Saatcioglu, M. & Razvi, S.R., 1992. Strength and ductility of confine concrete columns, ASCE
Journal Structural 106: 1079-1102. Saatcioglu, M. & Yalcin, C., 2000, Inelastic analysis of reinforced concrete columns,
Computer and Structures 77 [online], London: Elsevier Science Ltd. Available at: <http://www.sciencedirect.com/science/journal/00457949> [Accessed 29 August
2000]. Shin, S., Ghosh, S.K. & Moreno, J., 1989. Flexural ductility of ultra high strength concrete
members, ACI Structural Journal 86: 394-400. Xie, Y., Ahmad, S., Yu, T., Hino, S. & Chung, W., 1994. Shear ductility of reinforced
concrete beams of normal and high strength concrete, ACI Structural Journal 91: 140-149.
ACKNOWLEDGEMENTS
This article is a part of MSc Dissertation of Structural Engineering. The author wish to acknowledge the financial support given by Engineering Education Development Project ADB-INO 1432. Special thanks are due to the technical staff of the Structural Laboratory of
Curvature Ductility Of Reinforced Concrete Beam (Monita Olivia, Parthasarathi Mandal)
13
Civil & Structural Department, UMIST, Manchester, i.e. John Mason, Steve Edwards, Paul Nedwell, and John Wall for their kind assistance throughout the project. RIWAYAT PENULIS
Monita Olivia MSc, adalah staf pengajar pada Jurusan Teknik Sipil Fakultas Teknik Universitas Riau, Pekanbaru.
Parthasarathi Mandal PhD adalah staf pengajar pada Civil & Structural Engineering Department, UMIST, Manchester, United Kingdom.