Embed Size (px)
Citation preview
Current Trends & Projection Methodology
October 27, 2021
Blue Valley Schools | Finance & Operations
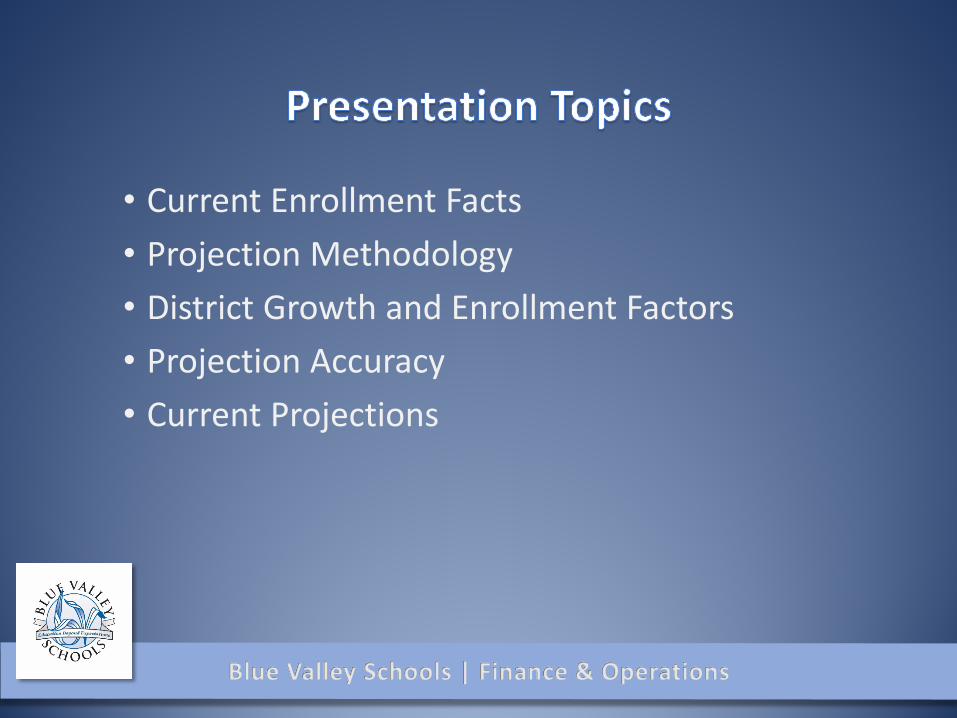
• Current Enrollment Facts• Projection Methodology• District Growth and Enrollment Factors• Projection Accuracy• Current Projections
Blue Valley Schools | Finance & Operations
Blue Valley Schools | Finance & Operations
0
5,000
10,000
15,000
20,000
25,000
199
0-91
199
1-92
1992
-93
1993
-94
1994
-95
1995
-96
1996
-97
1997
-98
1998
-99
1999
-00
2000
-01
2001
-02
2002
-03
2003
-04
2004
-05
2005
-06
2006
-07
2007
-08
2008
-09
2009
-10
2010
-11
2011
-12
2012
-13
2013
-14
2014
-15
2015
-16
2016
-17
2017
-18
2018
-19
2019
-20
2020
-21
2021
-22
Stud
ents
School Year
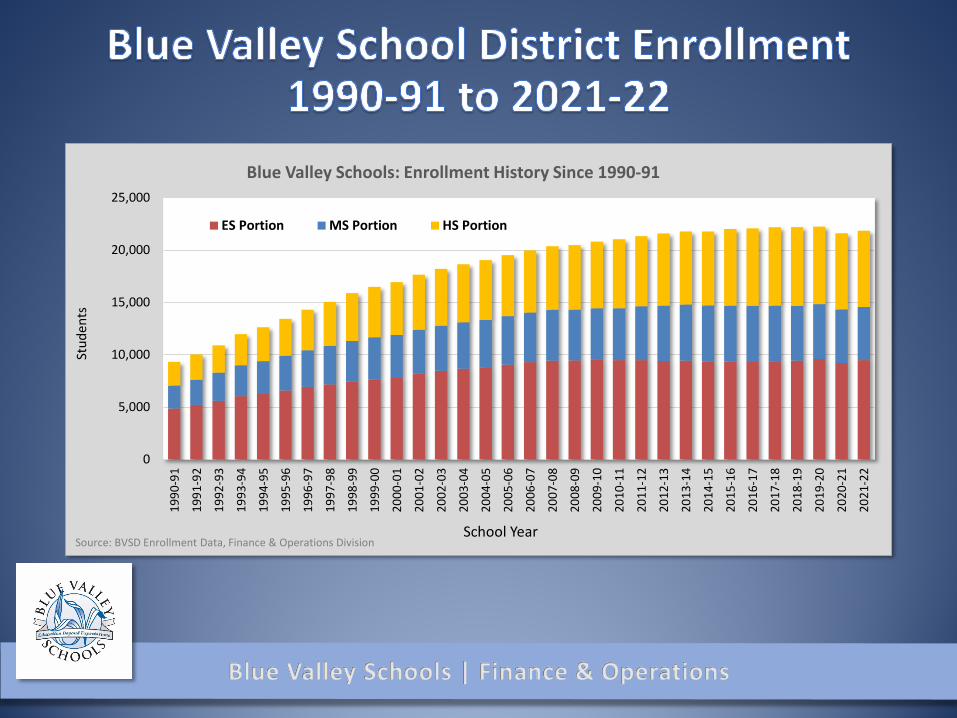
Blue Valley Schools: Enrollment History Since 1990-91
ES Portion MS Portion HS Portion
Source: BVSD Enrollment Data, Finance & Operations Division
Blue Valley Schools | Finance & Operations
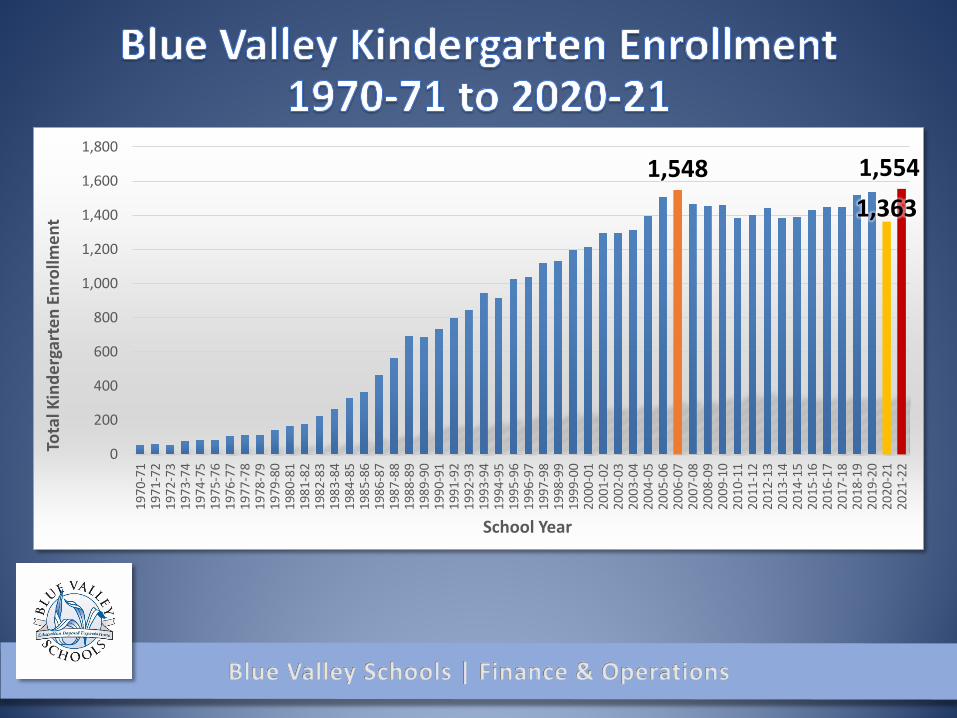
1,5481,3631,554
0
200
400
600
800
1,000
1,200
1,400
1,600
1,800 1
970-
71 1
971-
72 1
972-
73 1
973-
74 1
974-
75 1
975-
76 1
976-
77 1
977-
78 1
978-
79 1
979-
80 1
980-
81 1
981-
82 1
982-
83 1
983-
84 1
984-
85 1
985-
86 1
986-
87 1
987-
88 1
988-
89 1
989-
90 1
990-
91 1
991-
9219
92-9
319
93-9
419
94-9
519
95-9
619
96-9
719
97-9
819
98-9
919
99-0
020
00-0
120
01-0
220
02-0
320
03-0
420
04-0
520
05-0
620
06-0
720
07-0
820
08-0
920
09-1
020
10-1
120
11-1
220
12-1
320
13-1
420
14-1
520
15-1
620
16-1
720
17-1
820
18-1
920
19-2
020
20-2
120
21-2
2
Tota
l Kin
derg
arte
n En
rollm
ent
School Year
Blue Valley Schools | Finance & Operations
-1200
-1000
-800
-600
-400
-200
0
200
400
STU
DEN
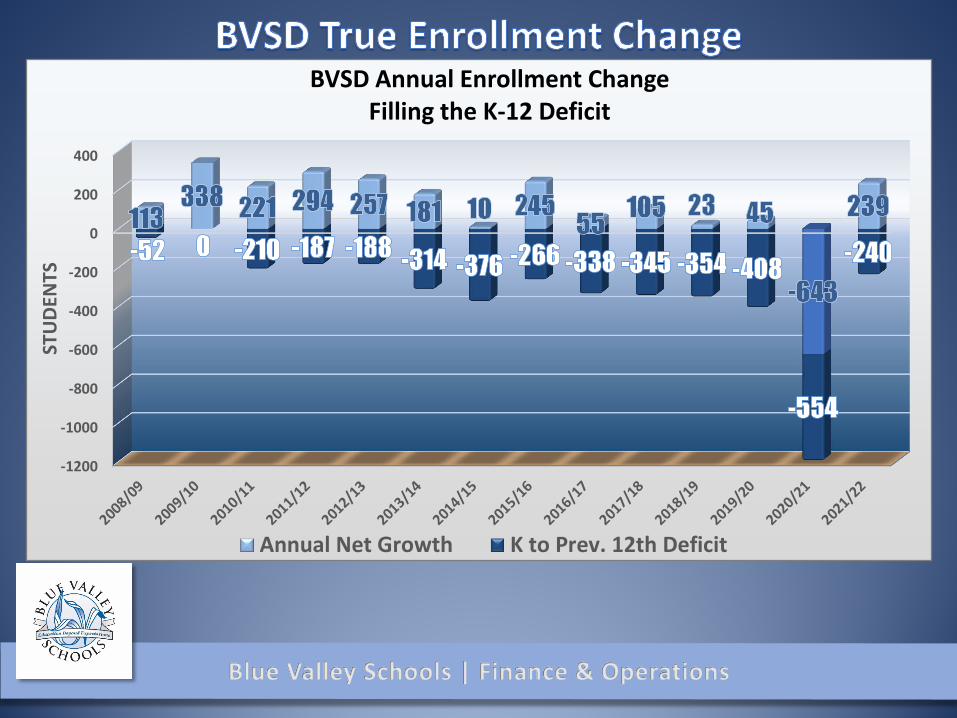
TSBVSD Annual Enrollment Change
Filling the K-12 Deficit
Annual Net Growth K to Prev. 12th Deficit
Blue Valley Schools | Finance & Operations
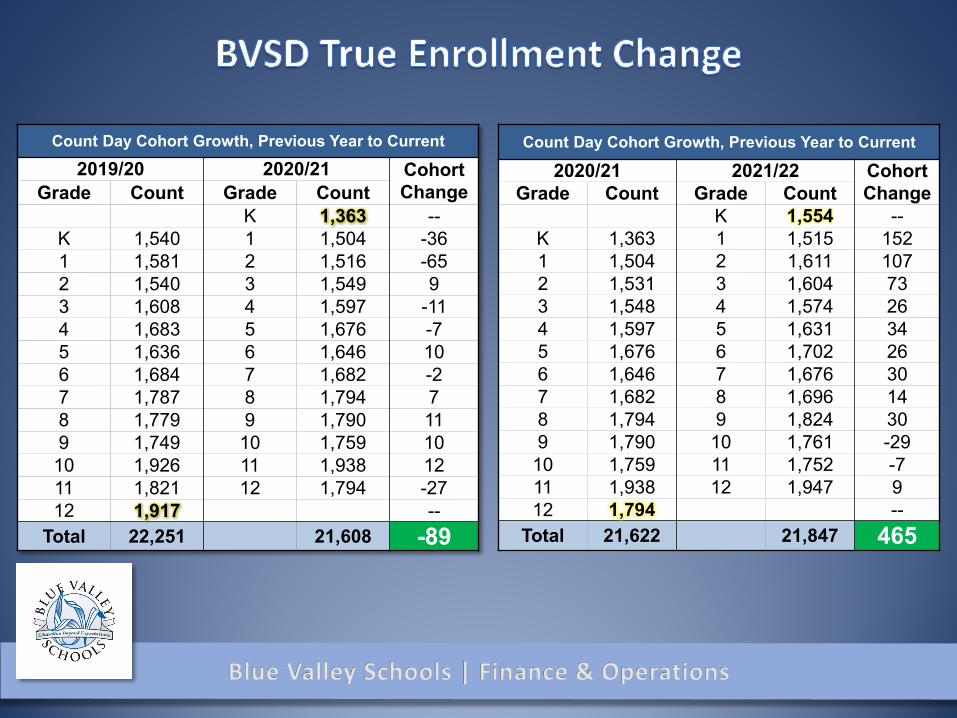
Count Day Cohort Growth, Previous Year to Current
2019/20 2020/21 Cohort ChangeGrade Count Grade Count
K 1,363 --K 1,540 1 1,504 -361 1,581 2 1,516 -652 1,540 3 1,549 93 1,608 4 1,597 -114 1,683 5 1,676 -75 1,636 6 1,646 106 1,684 7 1,682 -27 1,787 8 1,794 78 1,779 9 1,790 119 1,749 10 1,759 1010 1,926 11 1,938 1211 1,821 12 1,794 -2712 1,917 --
Total 22,251 21,608 -89
Count Day Cohort Growth, Previous Year to Current
2020/21 2021/22 Cohort ChangeGrade Count Grade Count
K 1,554 --K 1,363 1 1,515 1521 1,504 2 1,611 1072 1,531 3 1,604 733 1,548 4 1,574 264 1,597 5 1,631 345 1,676 6 1,702 266 1,646 7 1,676 307 1,682 8 1,696 148 1,794 9 1,824 309 1,790 10 1,761 -29
10 1,759 11 1,752 -711 1,938 12 1,947 912 1,794 --
Total 21,622 21,847 465
Blue Valley Schools | Finance & Operations
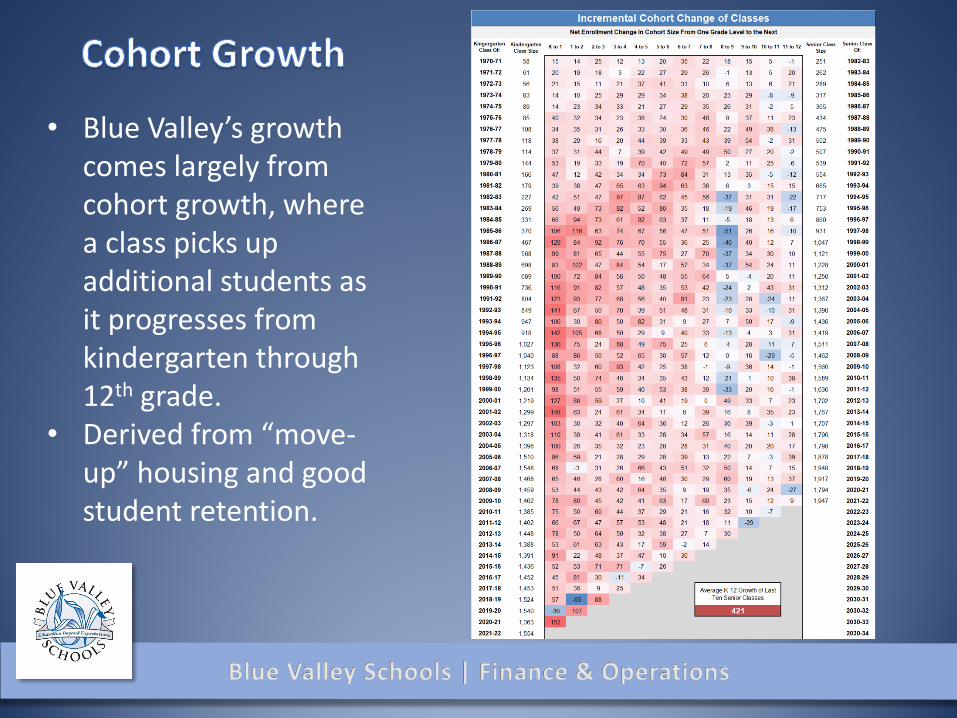
• Blue Valley’s growth comes largely from cohort growth, where a class picks up additional students as it progresses from kindergarten through 12th grade.
• Derived from “move-up” housing and good student retention.
Blue Valley Schools | Finance & Operations
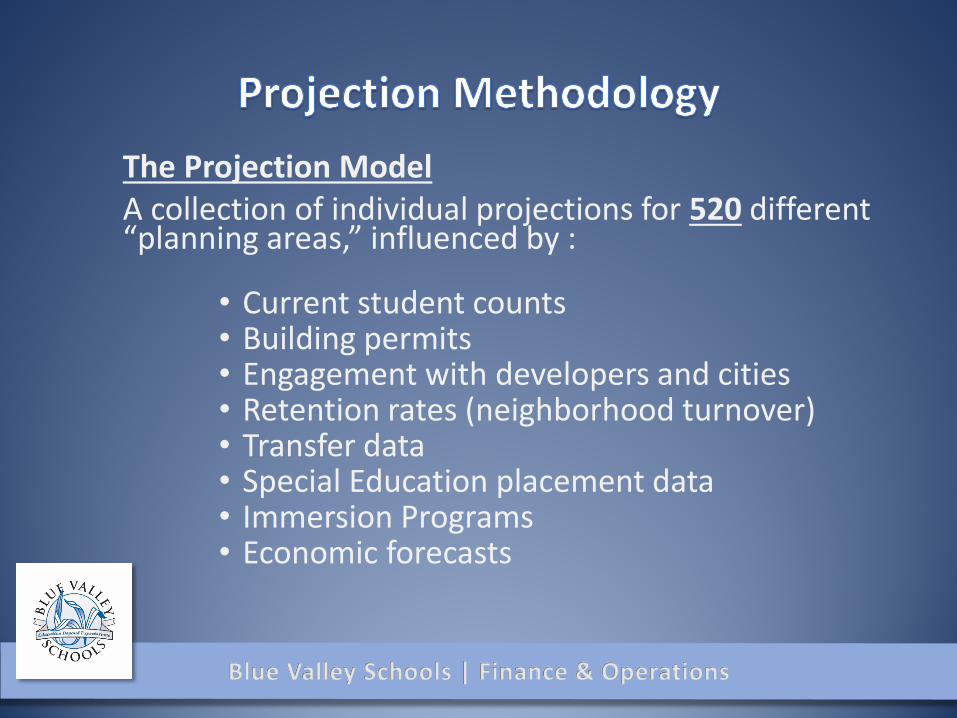
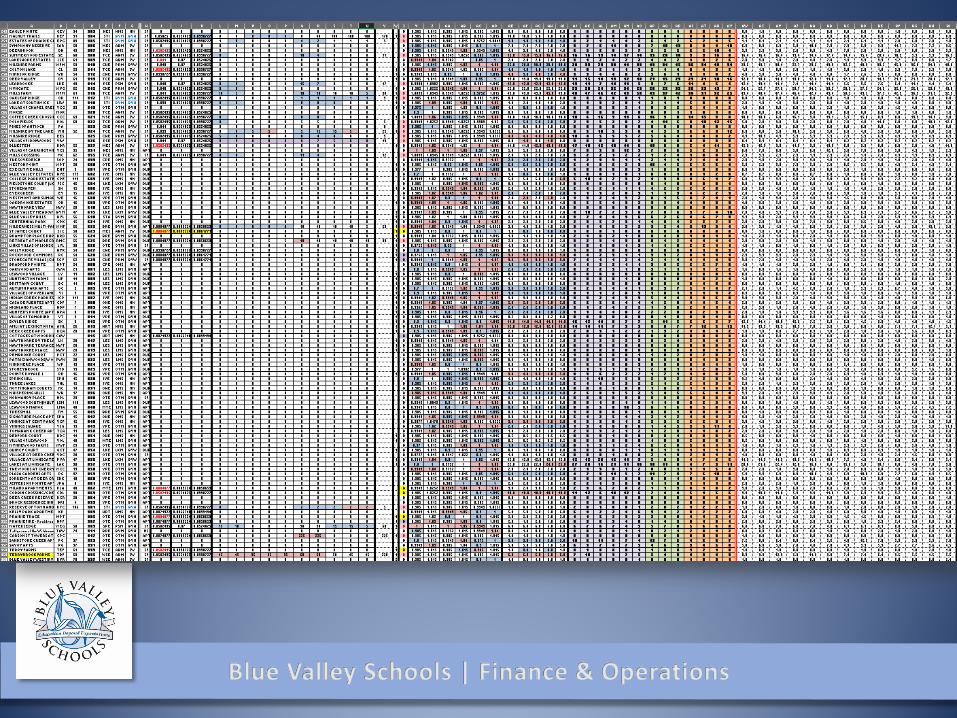
The Projection ModelA collection of individual projections for 520 different “planning areas,” influenced by :
• Current student counts• Building permits• Engagement with developers and cities• Retention rates (neighborhood turnover)• Transfer data• Special Education placement data• Immersion Programs• Economic forecasts
Blue Valley Schools | Finance & Operations
Blue Valley Schools | Finance & Operations
Blue Valley Schools | Finance & Operations
Blue Valley Schools | Finance & Operations
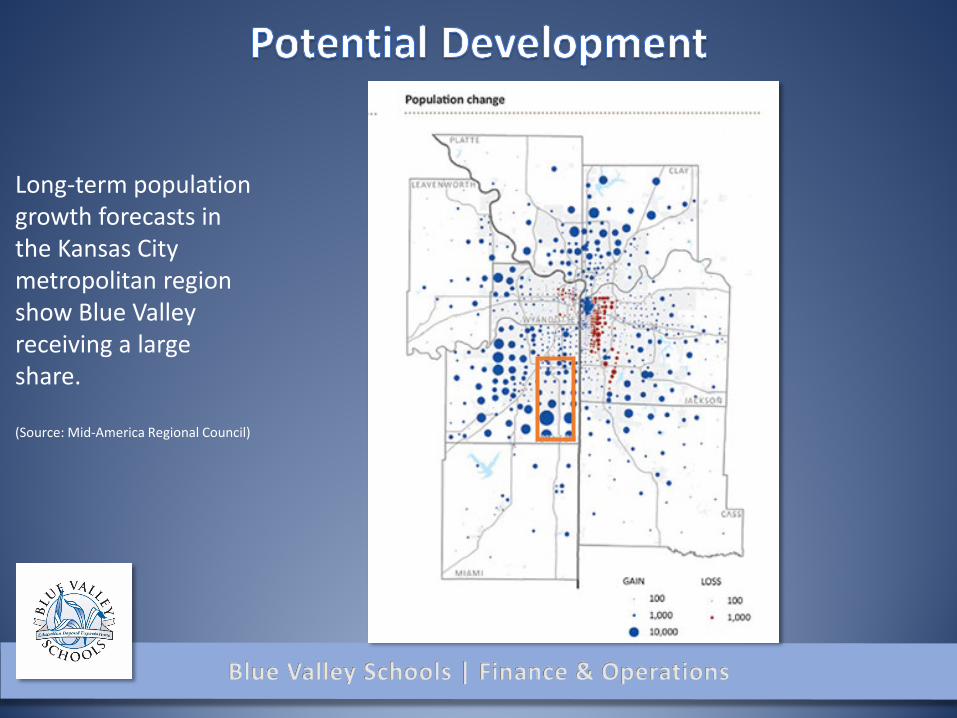
Long-term population growth forecasts in the Kansas City metropolitan region show Blue Valley receiving a large share.
(Source: Mid-America Regional Council)
Blue Valley Schools | Finance & Operations
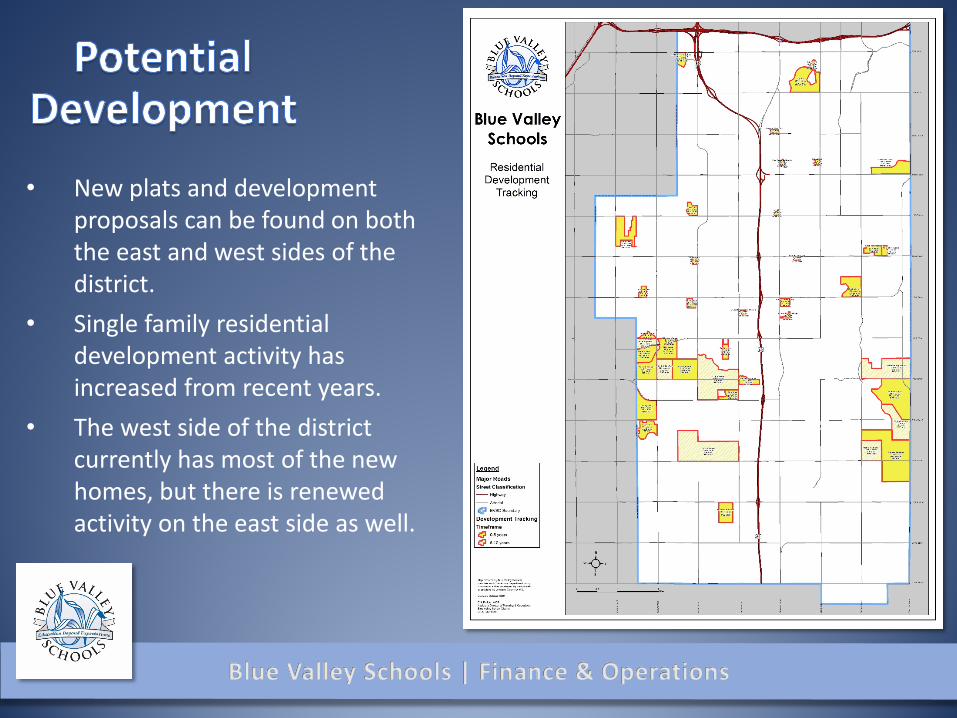
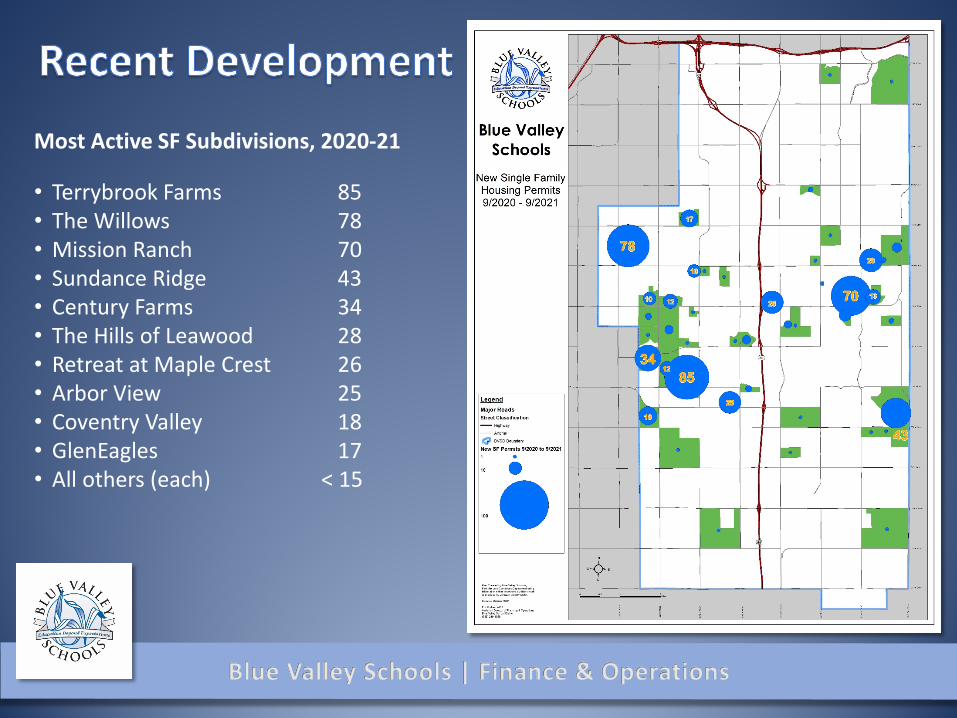
• New plats and development proposals can be found on both the east and west sides of the district.
• Single family residential development activity has increased from recent years.
• The west side of the district currently has most of the new homes, but there is renewed activity on the east side as well.
Blue Valley Schools | Finance & Operations
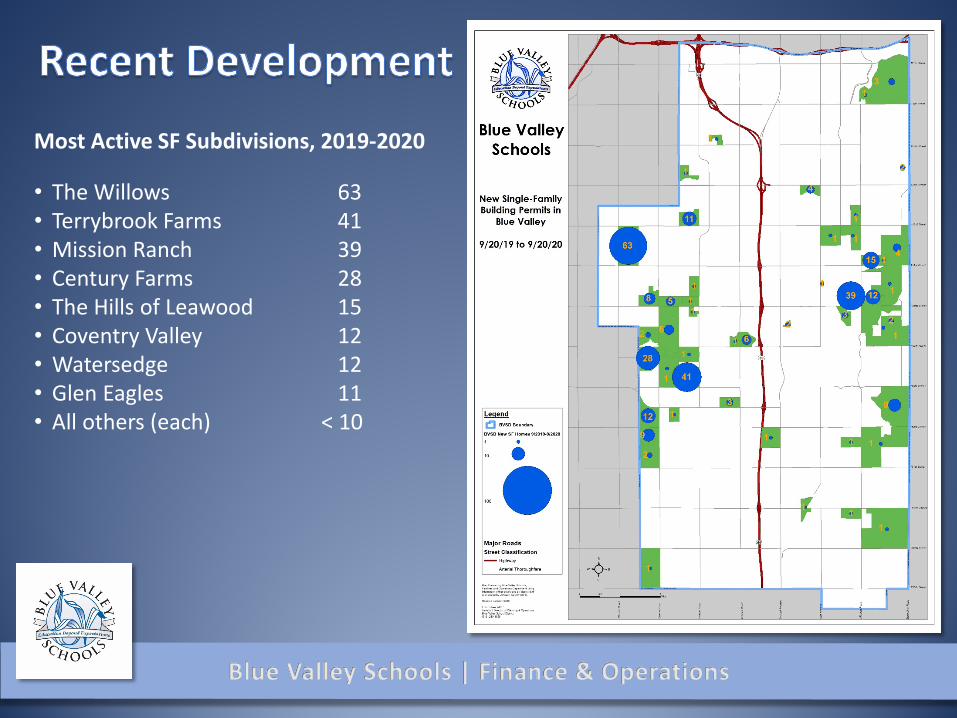
Most Active SF Subdivisions, 2019-2020
• The Willows 63• Terrybrook Farms 41• Mission Ranch 39• Century Farms 28• The Hills of Leawood 15• Coventry Valley 12• Watersedge 12• Glen Eagles 11• All others (each) < 10
Blue Valley Schools | Finance & Operations
Most Active SF Subdivisions, 2020-21
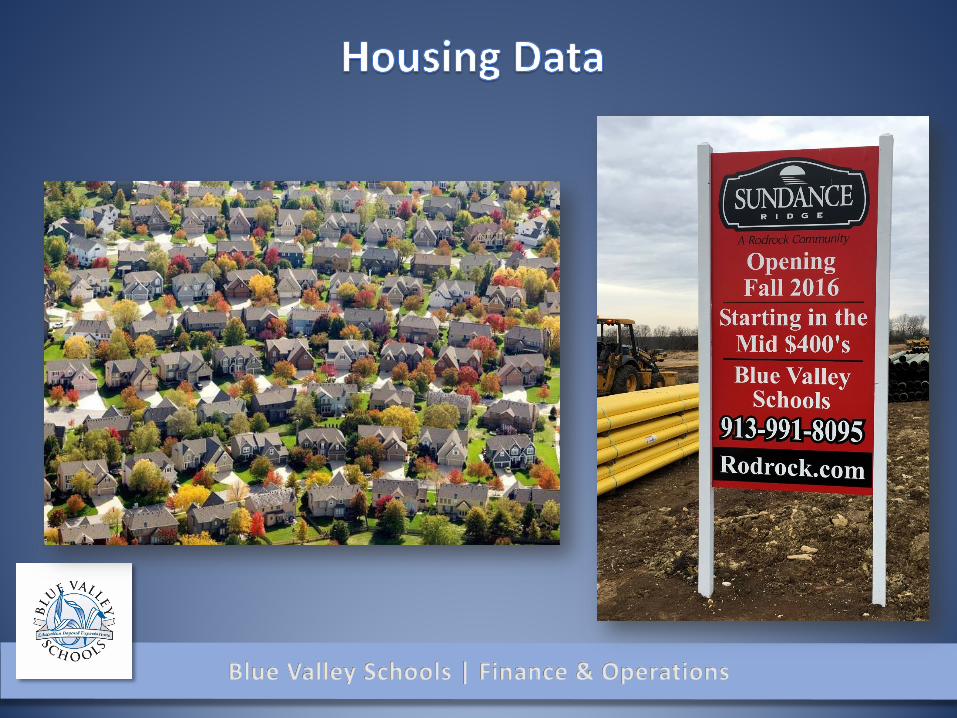
• Terrybrook Farms 85• The Willows 78• Mission Ranch 70• Sundance Ridge 43• Century Farms 34• The Hills of Leawood 28• Retreat at Maple Crest 26• Arbor View 25• Coventry Valley 18• GlenEagles 17• All others (each) < 15
Blue Valley Schools | Finance & Operations
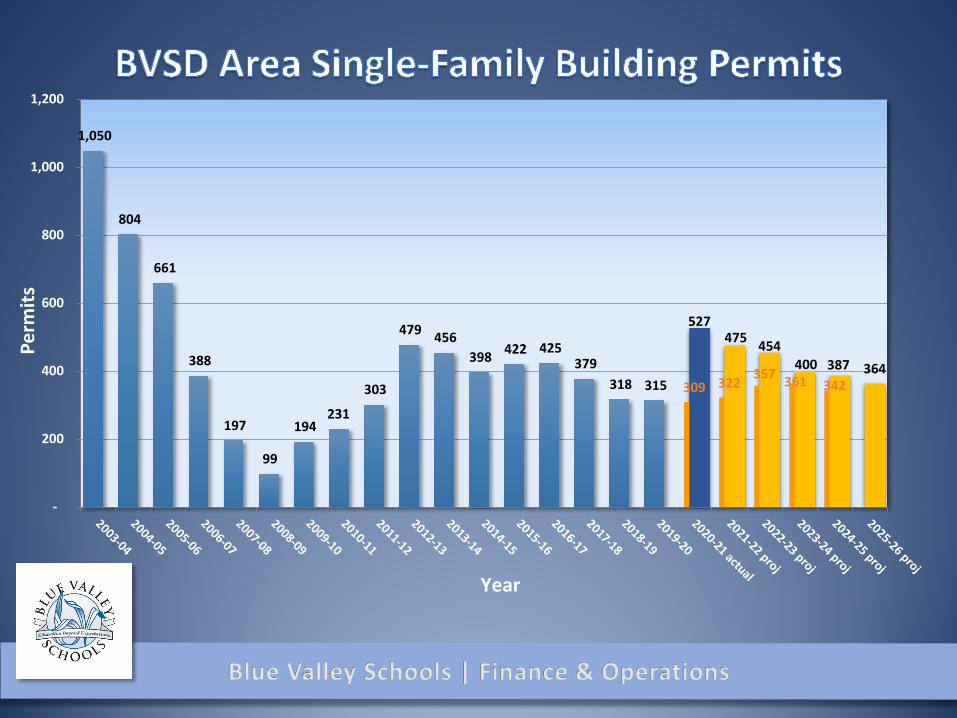
1,050
804
661
388
197
99
194 231
303
479 456 398 422 425
379 318 315 309 322 357 361 342
527475 454
400 387 364
-
200
400
600
800
1,000
1,200
Perm
its
Year
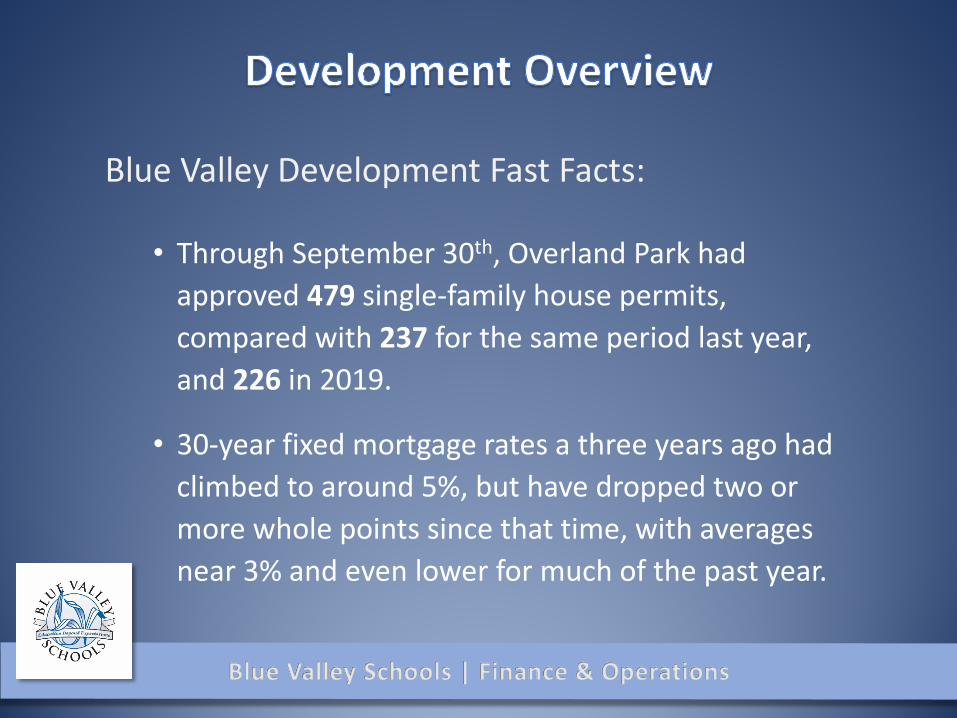
Blue Valley Development Fast Facts:
• Through September 30th, Overland Park had approved 479 single-family house permits, compared with 237 for the same period last year, and 226 in 2019.
• 30-year fixed mortgage rates a three years ago had climbed to around 5%, but have dropped two or more whole points since that time, with averages near 3% and even lower for much of the past year.
Blue Valley Schools | Finance & Operations

Blue Valley Schools | Finance & Operations
• Neighborhoods are monitored for growth or decline in student population. This number is referred to as their “retention rate.”
Blue Valley Schools | Finance & Operations
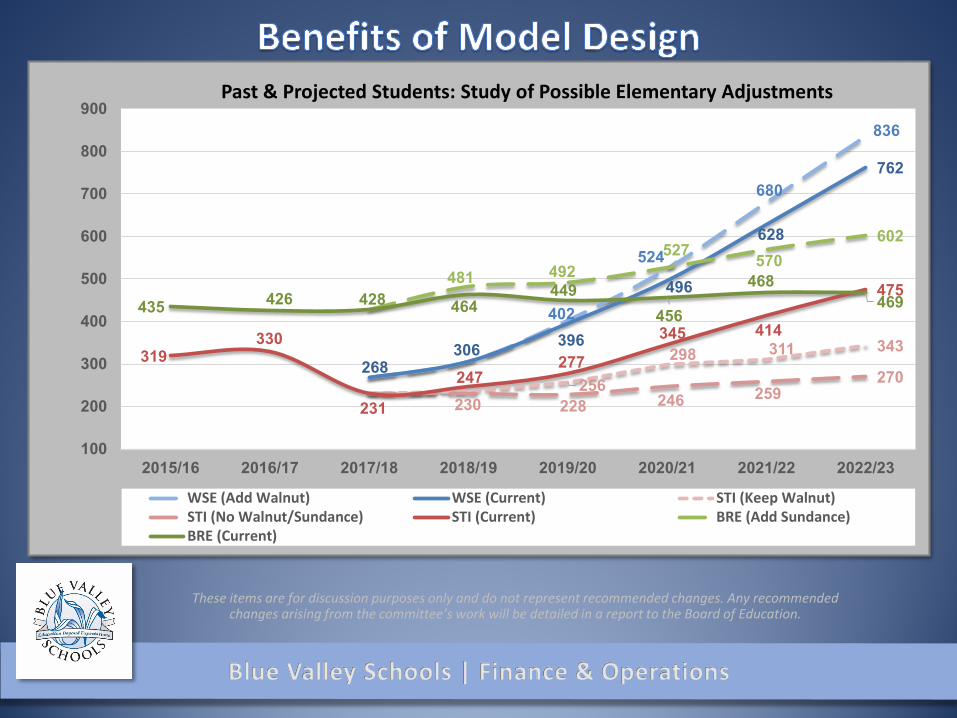
These items are for discussion purposes only and do not represent recommended changes. Any recommended changes arising from the committee’s work will be detailed in a report to the Board of Education.
402
524
680
836
268306 396
496
628
762
256
298 311 343
231 230 228 246 259270
319330
247277
345 414
475481 492
527 570602
435 426 428 464449
456
468469
100
200
300
400
500
600
700
800
900
2015/16 2016/17 2017/18 2018/19 2019/20 2020/21 2021/22 2022/23
Past & Projected Students: Study of Possible Elementary Adjustments
WSE (Add Walnut) WSE (Current) STI (Keep Walnut)STI (No Walnut/Sundance) STI (Current) BRE (Add Sundance)BRE (Current)
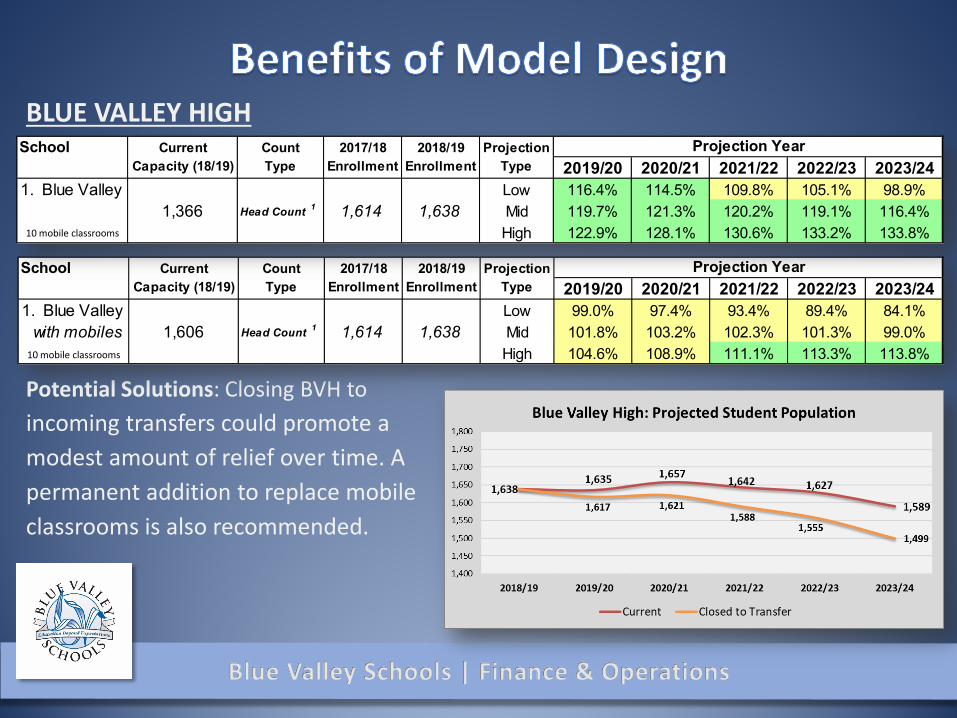
BLUE VALLEY HIGH
Potential Solutions: Closing BVH to incoming transfers could promote a modest amount of relief over time. Apermanent addition to replace mobileclassrooms is also recommended.
Blue Valley Schools | Finance & Operations
School Current Count 2017/18 2018/19 ProjectionCapacity (18/19) Type Enrollment Enrollment Type 2019/20 2020/21 2021/22 2022/23 2023/24
1. Blue Valley Low 99.0% 97.4% 93.4% 89.4% 84.1%with mobiles 1,606 Head Count 1 1,614 1,638 Mid 101.8% 103.2% 102.3% 101.3% 99.0%
High 104.6% 108.9% 111.1% 113.3% 113.8%
Projection Year
School Current Count 2017/18 2018/19 ProjectionCapacity (18/19) Type Enrollment Enrollment Type 2019/20 2020/21 2021/22 2022/23 2023/24
1. Blue Valley Low 116.4% 114.5% 109.8% 105.1% 98.9%1,366 Head Count 1 1,614 1,638 Mid 119.7% 121.3% 120.2% 119.1% 116.4%
High 122.9% 128.1% 130.6% 133.2% 133.8%
Projection Year
10 mobile classrooms
10 mobile classrooms
Blue Valley Schools | Finance & Operations
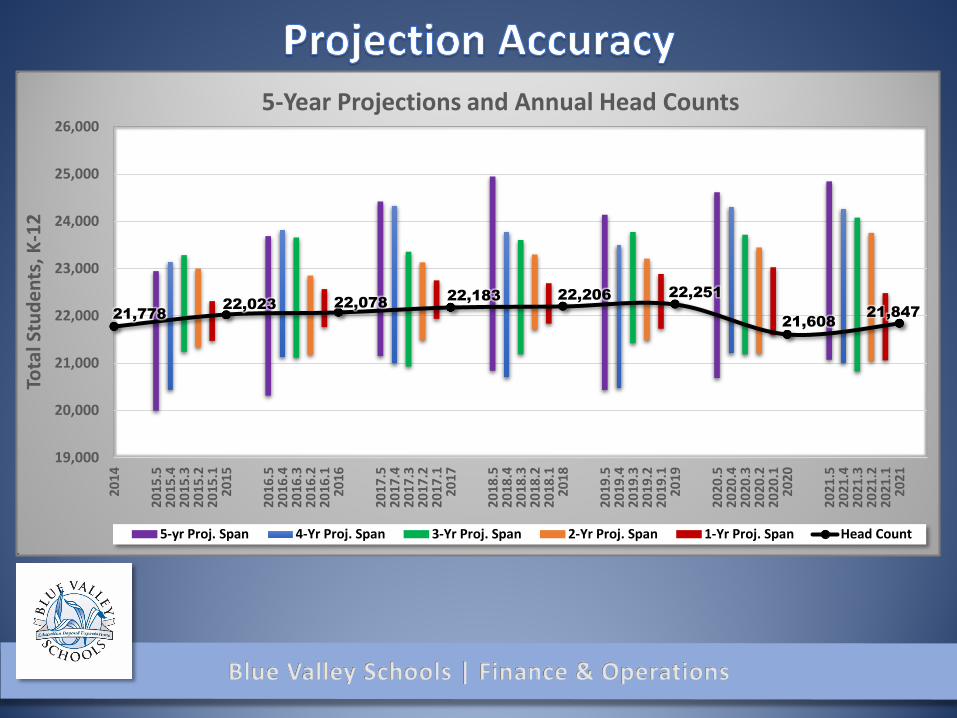
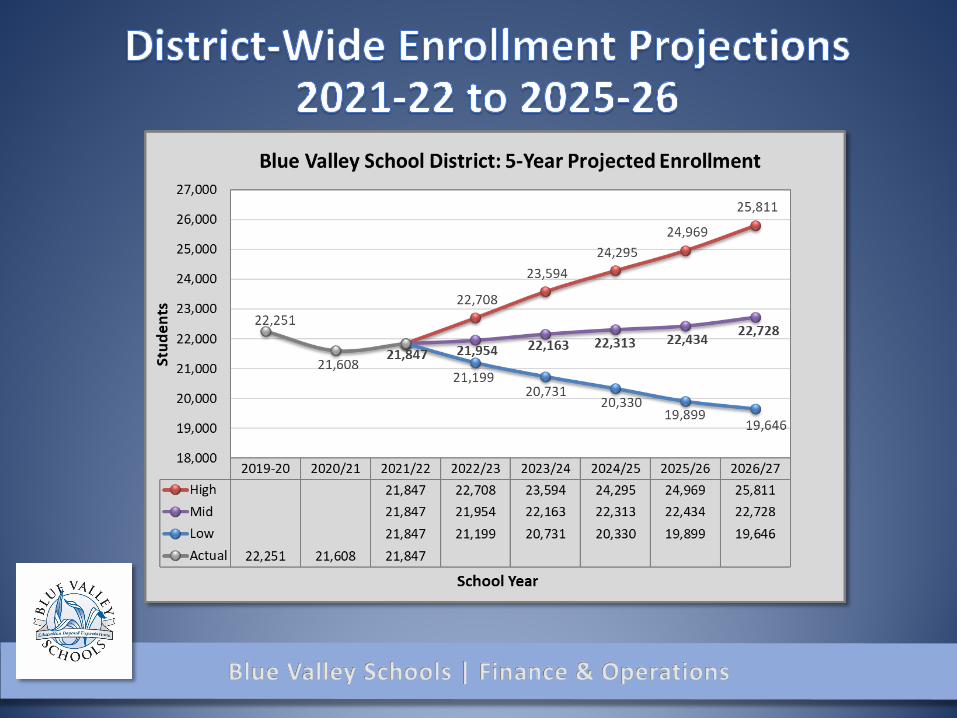
21,778 22,023 22,078 22,183 22,206 22,251
21,608 21,847
19,000
20,000
21,000
22,000
23,000
24,000
25,000
26,00020
14
2015
.520
15.4
2015
.320
15.2
2015
.120
15
2016
.520
16.4
2016
.320
16.2
2016
.120
16
2017
.520
17.4
2017
.320
17.2
2017
.120
17
2018
.520
18.4
2018
.320
18.2
2018
.120
18
2019
.520
19.4
2019
.320
19.2
2019
.120
19
2020
.520
20.4
2020
.320
20.2
2020
.120
20
2021
.520
21.4
2021
.320
21.2
2021
.120
21
Tota
l Stu
dent
s, K
-12
5-Year Projections and Annual Head Counts
5-yr Proj. Span 4-Yr Proj. Span 3-Yr Proj. Span 2-Yr Proj. Span 1-Yr Proj. Span Head Count
Questions about:
Blue Valley Schools | Finance & Operations
Enrollment?Projection Methods?
Blue Valley Schools | Finance & Operations
Blue Valley Schools | Finance & Operations
Blue Valley Schools | Finance & Operations
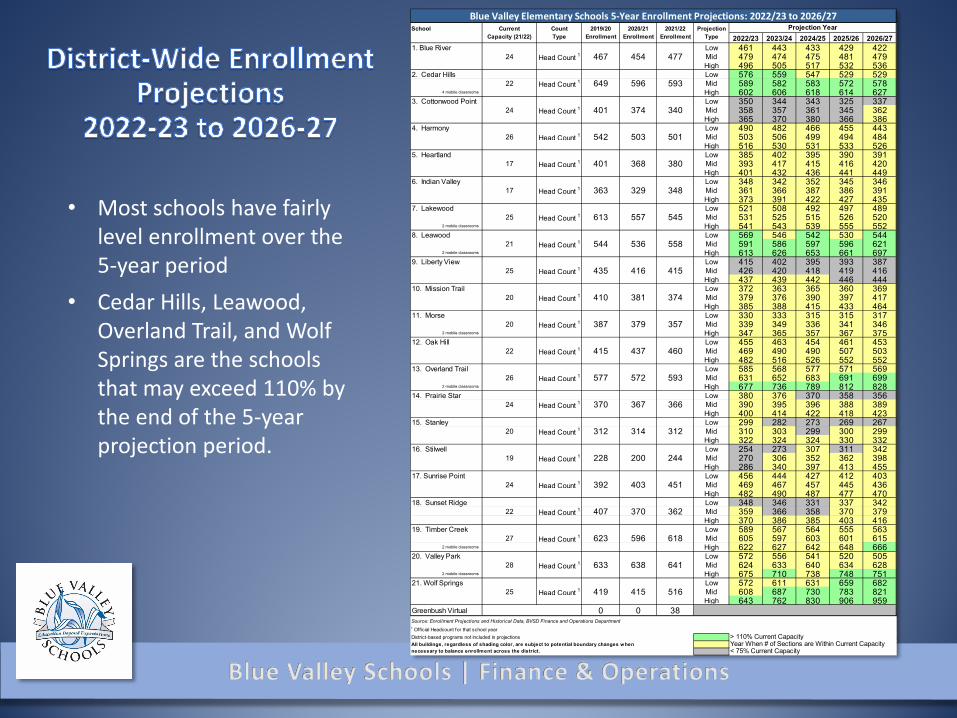
• Most schools have fairly level enrollment over the 5-year period
• Cedar Hills, Leawood, Overland Trail, and Wolf Springs are the schools that may exceed 110% by the end of the 5-year projection period.
School Current Count 2019/20 2020/21 2021/22 ProjectionCapacity (21/22) Type Enrollment Enrollment Enrollment Type 2022/23 2023/24 2024/25 2025/26 2026/27
1. Blue River Low 461 443 433 429 42224 Head Count 1 467 454 477 Mid 479 474 475 481 479
High 496 505 517 532 5362. Cedar Hills 24 Low 576 559 547 529 529
22 Head Count 1 649 596 593 Mid 589 582 583 572 5784 mobile classrooms High 602 606 618 614 627
3. Cottonwood Point 21 Low 350 344 343 325 33724 Head Count 1 401 374 340 Mid 358 357 361 345 362
High 365 370 380 366 3864. Harmony Low 490 482 466 455 443
26 Head Count 1 542 503 501 Mid 503 506 499 494 484High 516 530 531 533 526
5. Heartland 22 Low 385 402 395 390 39117 Head Count 1 401 368 380 Mid 393 417 415 416 420
High 401 432 436 441 4496. Indian Valley 20 Low 348 342 352 345 346
17 Head Count 1 363 329 348 Mid 361 366 387 386 391High 373 391 422 427 435
7. Lakewood 26 Low 521 508 492 497 48925 Head Count 1 613 557 545 Mid 531 525 515 526 520
2 mobile classrooms High 541 543 539 555 5528. Leawood Low 569 546 542 530 544
21 Head Count 1 544 536 558 Mid 591 586 597 596 6212 mobile classrooms High 613 626 653 661 697
9. Liberty View 26 Low 415 402 395 393 38725 Head Count 1 435 416 415 Mid 426 420 418 419 416
High 437 439 442 446 44410. Mission Trail 24 Low 372 363 365 360 369
20 Head Count 1 410 381 374 Mid 379 376 390 397 417High 385 388 415 433 464
11. Morse 19 Low 330 333 315 315 31720 Head Count 1 387 379 357 Mid 339 349 336 341 346
2 mobile classrooms High 347 365 357 367 37512. Oak Hill Low 455 463 454 461 453
22 Head Count 1 415 437 460 Mid 469 490 490 507 503High 482 516 526 552 552
13. Overland Trail 24 Low 585 568 577 571 56926 Head Count 1 577 572 593 Mid 631 652 683 691 699
2 mobile classrooms High 677 736 789 812 82814. Prairie Star 22 Low 380 376 370 358 356
24 Head Count 1 370 367 366 Mid 390 395 396 388 389High 400 414 422 418 423
15. Stanley Low 299 282 273 269 26720 Head Count 1 312 314 312 Mid 310 303 299 300 299
High 322 324 324 330 33216. Stilwell Low 254 273 307 311 342
19 Head Count 1 228 200 244 Mid 270 306 352 362 398High 286 340 397 413 455
17. Sunrise Point 22 Low 456 444 427 412 40324 Head Count 1 392 403 451 Mid 469 467 457 445 436
High 482 490 487 477 47018. Sunset Ridge Low 348 346 331 337 342
22 Head Count 1 407 370 362 Mid 359 366 358 370 379High 370 386 385 403 416
19. Timber Creek 28 Low 589 567 564 555 56327 Head Count 1 623 596 618 Mid 605 597 603 601 615
2 mobile classrooms High 622 627 642 648 66620. Valley Park Low 572 556 541 520 505
28 Head Count 1 633 638 641 Mid 624 633 640 634 6282 mobile classrooms High 675 710 738 748 751
21. Wolf Springs 24 Low 572 611 631 659 68225 Head Count 1 419 415 516 Mid 608 687 730 783 821
High 643 762 830 906 959Greenbush Virtual 0 0 38Source: Enrollment Projections and Historical Data, BVSD Finance and Operations Department1 Off icial Headcount for that school yearDistrict-based programs not included in projections > 110% Current Capacity
Year When # of Sections are Within Current Capacity< 75% Current Capacity
All buildings, regardless of shading color, are subject to potential boundary changes when necessary to balance enrollment across the district.
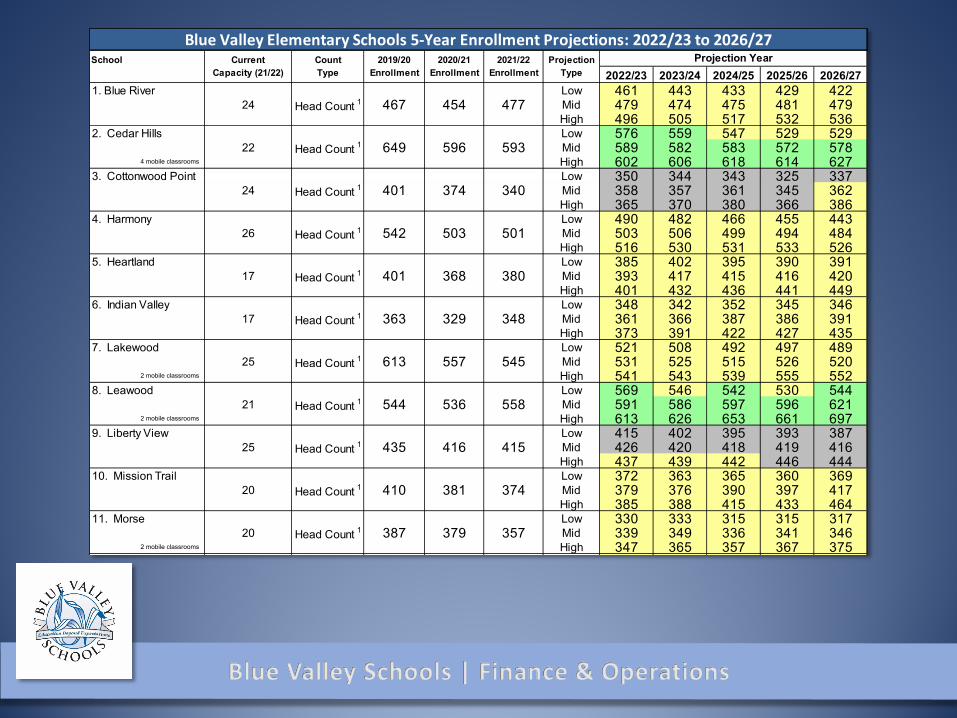
Blue Valley Elementary Schools 5-Year Enrollment Projections: 2022/23 to 2026/27Projection Year
Blue Valley Schools | Finance & Operations
School Current Count 2019/20 2020/21 2021/22 ProjectionCapacity (21/22) Type Enrollment Enrollment Enrollment Type 2022/23 2023/24 2024/25 2025/26 2026/27
1. Blue River Low 461 443 433 429 42224 Head Count 1 467 454 477 Mid 479 474 475 481 479
High 496 505 517 532 5362. Cedar Hills 24 Low 576 559 547 529 529
22 Head Count 1 649 596 593 Mid 589 582 583 572 5784 mobile classrooms High 602 606 618 614 627
3. Cottonwood Point 21 Low 350 344 343 325 33724 Head Count 1 401 374 340 Mid 358 357 361 345 362
High 365 370 380 366 3864. Harmony Low 490 482 466 455 443
26 Head Count 1 542 503 501 Mid 503 506 499 494 484High 516 530 531 533 526
5. Heartland 22 Low 385 402 395 390 39117 Head Count 1 401 368 380 Mid 393 417 415 416 420
High 401 432 436 441 4496. Indian Valley 20 Low 348 342 352 345 346
17 Head Count 1 363 329 348 Mid 361 366 387 386 391High 373 391 422 427 435
7. Lakewood 26 Low 521 508 492 497 48925 Head Count 1 613 557 545 Mid 531 525 515 526 520
2 mobile classrooms High 541 543 539 555 5528. Leawood Low 569 546 542 530 544
21 Head Count 1 544 536 558 Mid 591 586 597 596 6212 mobile classrooms High 613 626 653 661 697
9. Liberty View 26 Low 415 402 395 393 38725 Head Count 1 435 416 415 Mid 426 420 418 419 416
High 437 439 442 446 44410. Mission Trail 24 Low 372 363 365 360 369
20 Head Count 1 410 381 374 Mid 379 376 390 397 417High 385 388 415 433 464
11. Morse 19 Low 330 333 315 315 31720 Head Count 1 387 379 357 Mid 339 349 336 341 346
2 mobile classrooms High 347 365 357 367 375
Blue Valley Elementary Schools 5-Year Enrollment Projections: 2022/23 to 2026/27Projection Year
Blue Valley Schools | Finance & Operations
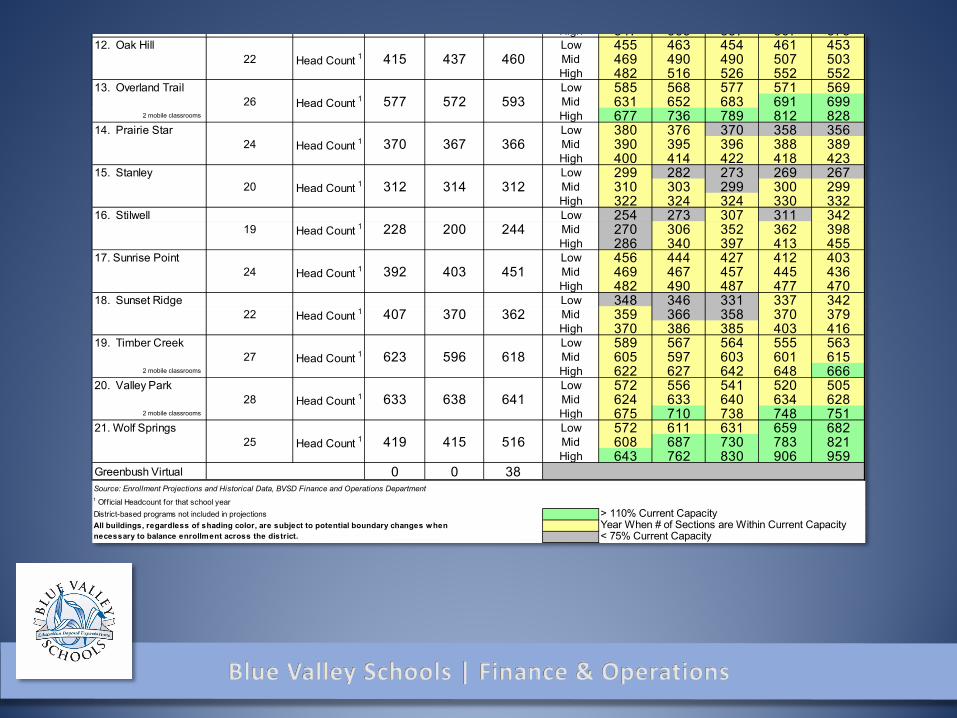
High 347 365 357 367 37512. Oak Hill Low 455 463 454 461 453
22 Head Count 1 415 437 460 Mid 469 490 490 507 503High 482 516 526 552 552
13. Overland Trail 24 Low 585 568 577 571 56926 Head Count 1 577 572 593 Mid 631 652 683 691 699
2 mobile classrooms High 677 736 789 812 82814. Prairie Star 22 Low 380 376 370 358 356
24 Head Count 1 370 367 366 Mid 390 395 396 388 389High 400 414 422 418 423
15. Stanley Low 299 282 273 269 26720 Head Count 1 312 314 312 Mid 310 303 299 300 299
High 322 324 324 330 33216. Stilwell Low 254 273 307 311 342
19 Head Count 1 228 200 244 Mid 270 306 352 362 398High 286 340 397 413 455
17. Sunrise Point 22 Low 456 444 427 412 40324 Head Count 1 392 403 451 Mid 469 467 457 445 436
High 482 490 487 477 47018. Sunset Ridge Low 348 346 331 337 342
22 Head Count 1 407 370 362 Mid 359 366 358 370 379High 370 386 385 403 416
19. Timber Creek 28 Low 589 567 564 555 56327 Head Count 1 623 596 618 Mid 605 597 603 601 615
2 mobile classrooms High 622 627 642 648 66620. Valley Park Low 572 556 541 520 505
28 Head Count 1 633 638 641 Mid 624 633 640 634 6282 mobile classrooms High 675 710 738 748 751
21. Wolf Springs 24 Low 572 611 631 659 68225 Head Count 1 419 415 516 Mid 608 687 730 783 821
High 643 762 830 906 959Greenbush Virtual 0 0 38Source: Enrollment Projections and Historical Data, BVSD Finance and Operations Department1 Off icial Headcount for that school yearDistrict-based programs not included in projections > 110% Current Capacity
Year When # of Sections are Within Current Capacity< 75% Current Capacity
All buildings, regardless of shading color, are subject to potential boundary changes when necessary to balance enrollment across the district.
Blue Valley Schools | Finance & Operations
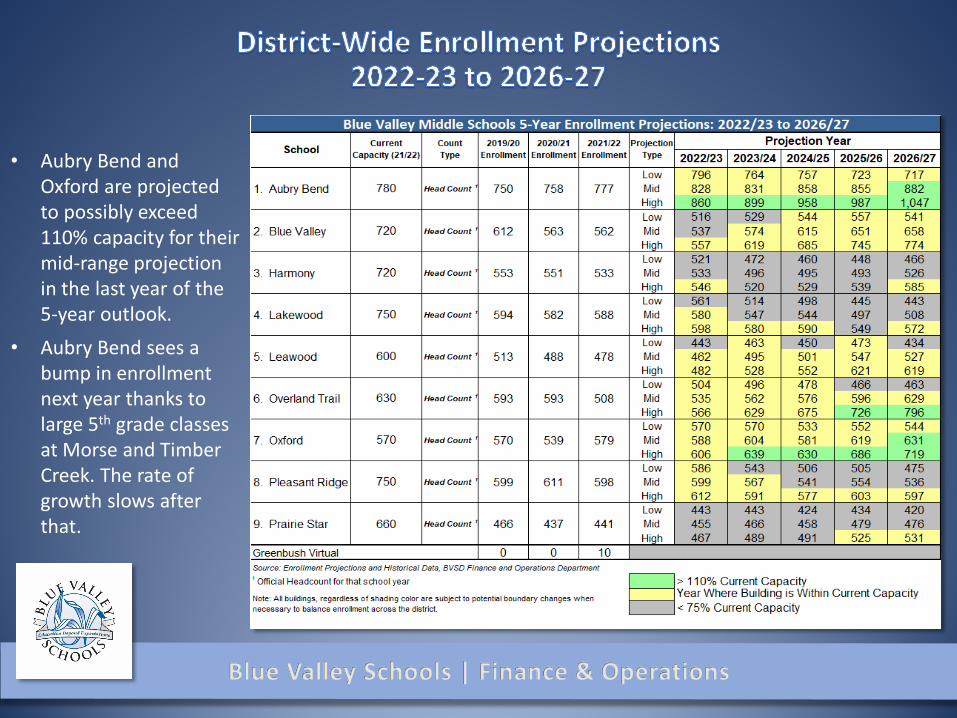
• Aubry Bend and Oxford are projected to possibly exceed 110% capacity for their mid-range projection in the last year of the 5-year outlook.
• Aubry Bend sees a bump in enrollment next year thanks to large 5th grade classes at Morse and Timber Creek. The rate of growth slows after that.
Blue Valley Schools | Finance & Operations
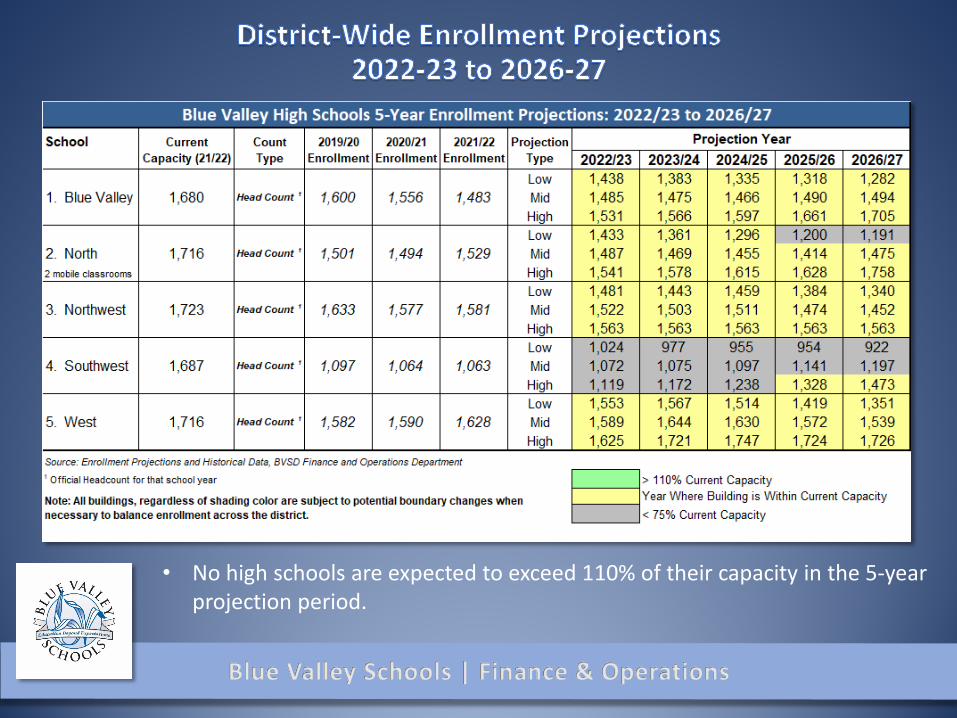
• No high schools are expected to exceed 110% of their capacity in the 5-year projection period.

Questions about projections?
Blue Valley Schools | Finance & Operations
Blue Valley Schools | Finance & Operations
Facility Planning Committee