Embed Size (px)
Citation preview
Current Issues with Meta-analysis in Medical
Research
Demissie AlemayehuDemissie AlemayehuPfizer & ColumbiaPfizer & Columbia
SemanadeSemanade
BioinformaticaBioinformatica, , BioestadisticaBioestadistica
AnalistsAnalists
de de SupervivenciaSupervivencia
InstitutoInstituto
PanamericanoPanamericano
de de EstudiosEstudios
AvanzadosAvanzados
en en ProbabilidadProbabilidad
y y EstadisticaEstadistica
May 2May 2--8, , 2010 8, , 2010
2
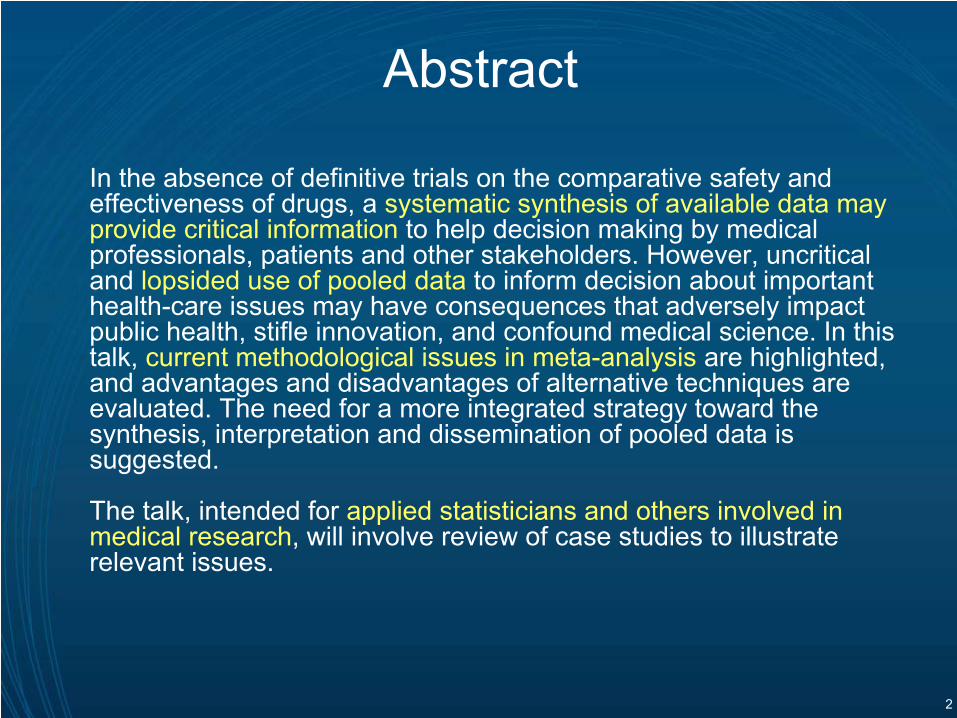
Abstract
In the absence of definitive trials on the comparative safety and effectiveness of drugs, a systematic synthesis of available data may provide critical information
to help decision making by medical professionals, patients and other stakeholders. However, uncritical and lopsided use of pooled data
to inform decision about important health-care issues may have consequences that adversely impact public health, stifle innovation, and confound medical science. In this talk, current methodological issues in meta-analysis
are highlighted, and advantages and disadvantages of alternative techniques are evaluated. The need for a more integrated strategy toward the synthesis, interpretation and dissemination of pooled data is suggested.
The talk, intended for applied statisticians and others involved in medical research, will involve review of case studies to illustrate relevant issues.
3
Outline•
Part I: Standard Meta-analysis–
A Case Study: The Avandia
Analysis
–
Procedures for Meta-analysis–
Criteria for Causality
–
The Avandia
Analysis Revisited
•
Part II: Non-standard Meta-analysis–
Cumulative Meta-analysis
–
Indirect Comparison –
Observational Data Analysis
–
Comparative Effectiveness Research
•
Concluding Remarks
4
AvandiaAvandia
MetaMeta--analysisanalysis
Nissen
& Wolski, N Engl J Med 2007;356:2457-71
“Diabetes drug called heart death risk”
Steve Sternberg Source: USA Today: May 22, 2007
5
Definition: MetaDefinition: Meta--analysisanalysis
••
MetaMeta--Analysis is a statistical approach for Analysis is a statistical approach for combiningcombining
information from independent information from independent
studies to address a studies to address a prepre--specifiedspecified hypothesis of interest.hypothesis of interest.
––
Based onBased on
systematicsystematic
literature reviewliterature review
––
Provides Provides precise estimateprecise estimate
of treatment effect, of treatment effect, giving due giving due weight weight to studies includedto studies included
6
Benefits of MetaBenefits of Meta--analysis analysis ••
Precision / PowerPrecision / Power––
Individual clinical trials may Individual clinical trials may lack power to provide lack power to provide conclusive resultsconclusive results
––
Particularly useful for rare Particularly useful for rare eventsevents
••
To assess consistency To assess consistency ((generalizabilitygeneralizability) of results) of results––
To settle controversies arising To settle controversies arising from conflicting studiesfrom conflicting studies
••
Answer questions not posed Answer questions not posed by the individual studiesby the individual studies––
generate new hypothesesgenerate new hypotheses
7
When to do a When to do a MetaMeta--analysisanalysis
•
Data are available from more than one study
•
There are no major differences in the study characteristics
•
Outcome has been measured in similar ways
8
When When notnot
to do a to do a MetaMeta--analysisanalysis
•• ‘‘Garbage in Garbage in --
garbage outgarbage out’’
––
A A metameta--analysisanalysis is only as is only as good as the studies in itgood as the studies in it
•• Beware of Beware of ‘‘mixing apples mixing apples with orangeswith oranges’’
––
Compare like with likeCompare like with like
•• Beware of reporting biasesBeware of reporting biases
9
Steps in MetaSteps in Meta--analysisanalysis1.1.
Detailed written protocol developmentDetailed written protocol development
2.2.
Comprehensive / systematic search for Comprehensive / systematic search for eligible studies eligible studies
3.3.
Presentation of results Presentation of results
4.4.
Sensitivity analysis / test for heterogeneity Sensitivity analysis / test for heterogeneity performed performed
5.5.
Discussion of limitations of analysis Discussion of limitations of analysis
6.6.
Reporting of results in light of available Reporting of results in light of available body of knowledge body of knowledge
10
••
Formulation of problem to be addressedFormulation of problem to be addressed
••
Eligibility criteria for studies to be included Eligibility criteria for studies to be included defined defined a prioria priori
••
Statistical methods for combining the dataStatistical methods for combining the data
Protocol DevelopmentProtocol Development
11
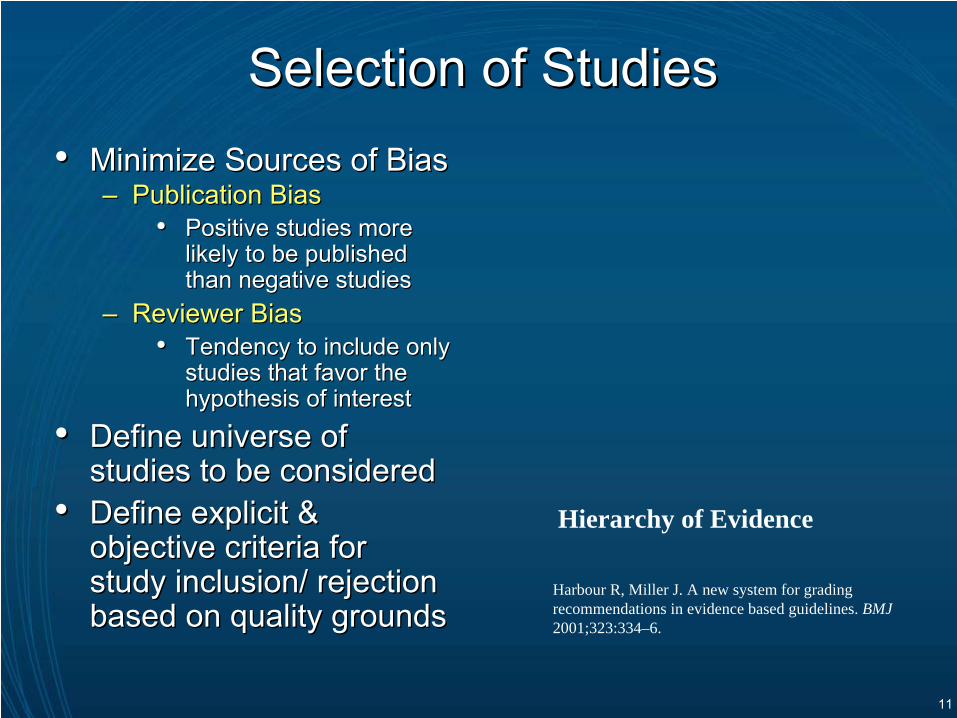
Selection of StudiesSelection of Studies••
Minimize Sources of BiasMinimize Sources of Bias––
Publication BiasPublication Bias••
Positive studies more Positive studies more likely to be published likely to be published than negative studiesthan negative studies
––
Reviewer BiasReviewer Bias••
Tendency to include only Tendency to include only studies that favor the studies that favor the hypothesis of interesthypothesis of interest
••
Define universe of Define universe of studies to be consideredstudies to be considered
••
Define explicit & Define explicit & objective criteria for objective criteria for study inclusion/ rejection study inclusion/ rejection based on quality groundsbased on quality grounds
Hierarchy of Evidence
Harbour R, Miller J. A new system for grading recommendations in evidence based guidelines. BMJ 2001;323:334–6.
12
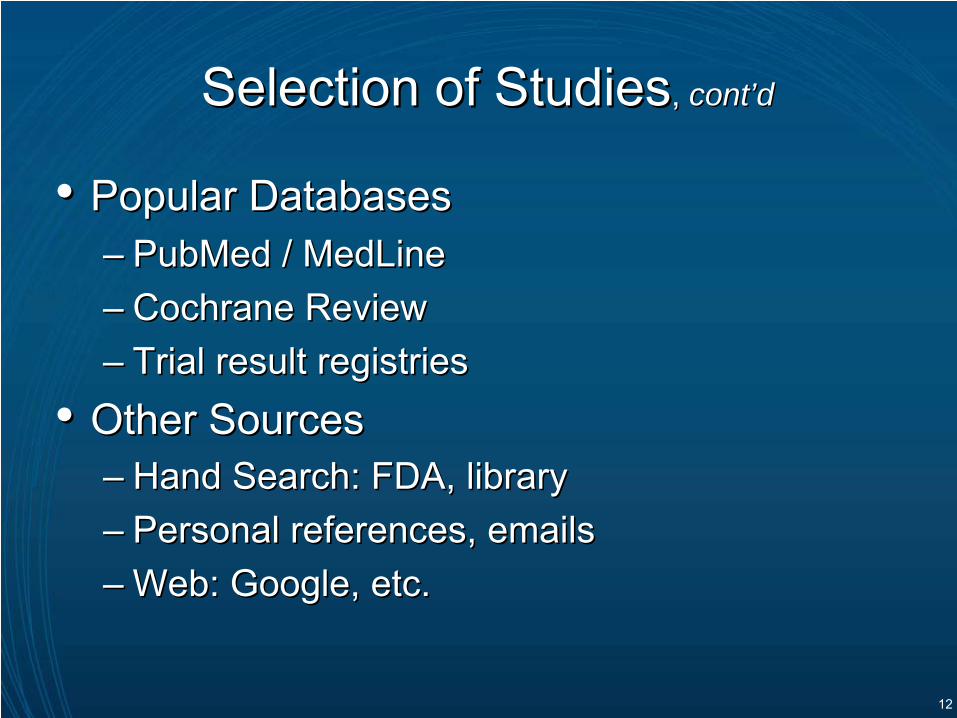
Selection of StudiesSelection of Studies, , contcont’’dd
••
PPopularopular
DatabasesDatabases––
PubMedPubMed
/ / MedLineMedLine
––
Cochrane ReviewCochrane Review––
Trial result registriesTrial result registries
••
Other SourcesOther Sources––
Hand Search: FDA, library Hand Search: FDA, library
––
Personal references, emailsPersonal references, emails––
Web: Google, etc.Web: Google, etc.
13
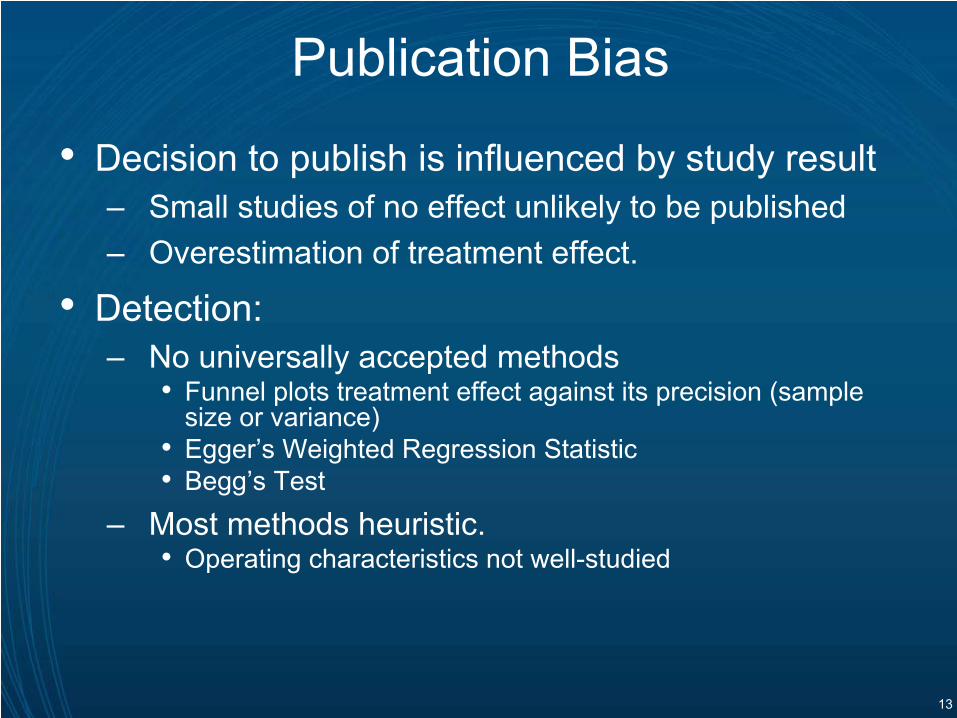
Publication Bias
•
Decision to publish is influenced by study result –
Small studies of no effect unlikely to be published
–
Overestimation of treatment effect.
•
Detection: –
No universally accepted methods•
Funnel plots treatment effect against its precision (sample size or variance)
•
Egger’s Weighted Regression Statistic•
Begg’s
Test
–
Most methods heuristic. •
Operating characteristics not well-studied
14
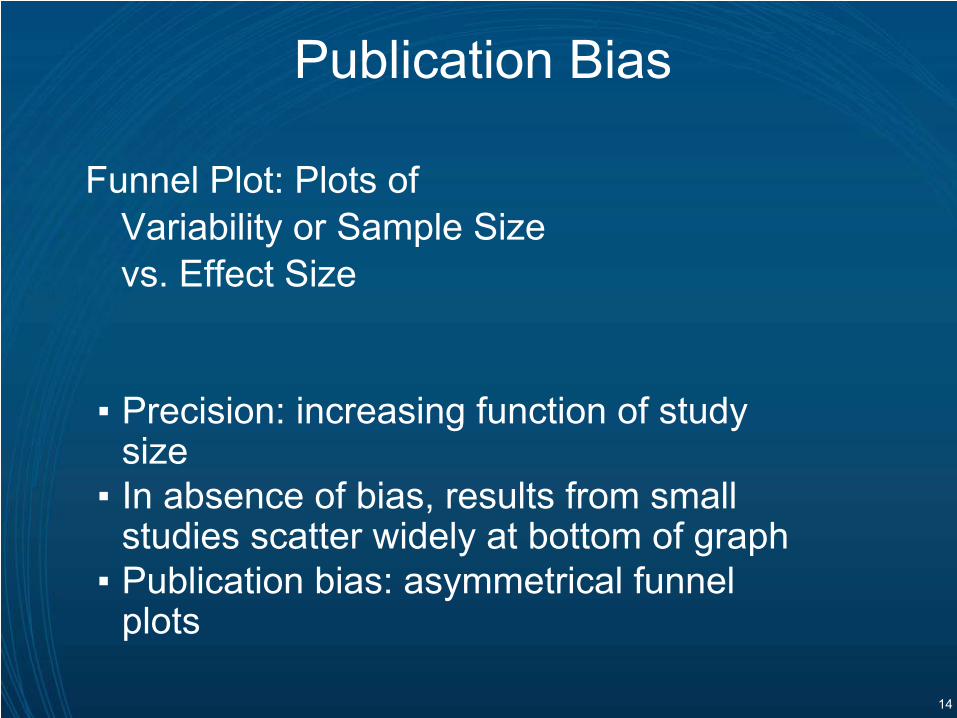
Funnel Plot: Plots of Variability or Sample Size vs. Effect Size
▪
Precision: increasing function of study size
▪
In absence of bias, results from small studies scatter widely at bottom of graph
▪
Publication bias: asymmetrical funnel plots
Publication Bias
15
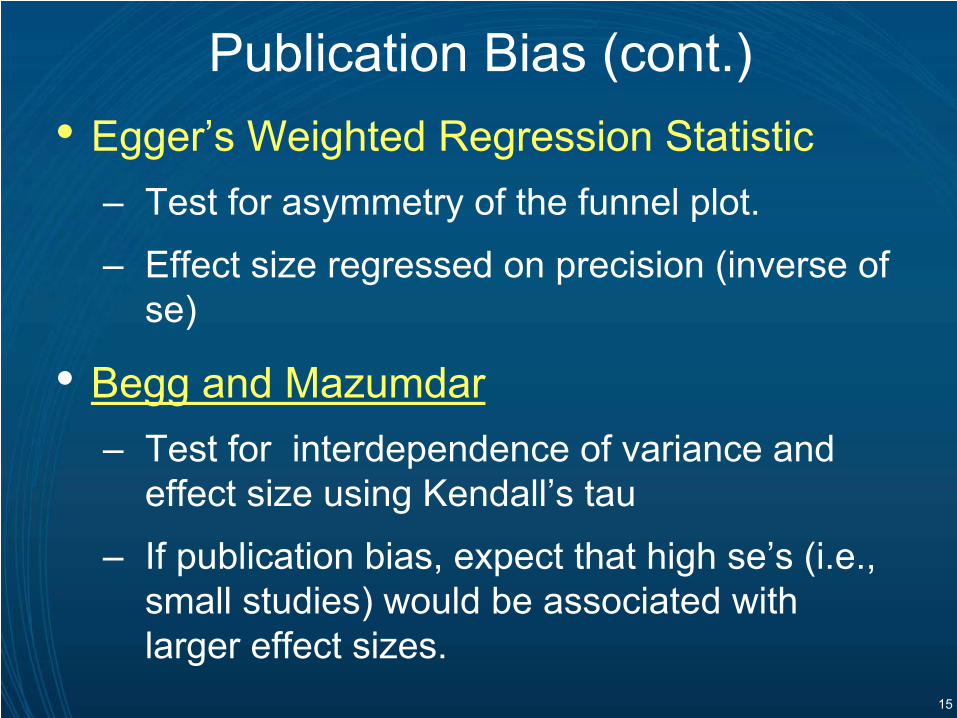
Publication Bias (cont.)•
Egger’s Weighted Regression Statistic–
Test for asymmetry of the funnel plot.
–
Effect size regressed on precision (inverse of se)
•
Begg
and Mazumdar–
Test for interdependence of variance and effect size using Kendall’s tau
–
If publication bias, expect that high se’s
(i.e., small studies) would be associated with larger effect sizes.
16
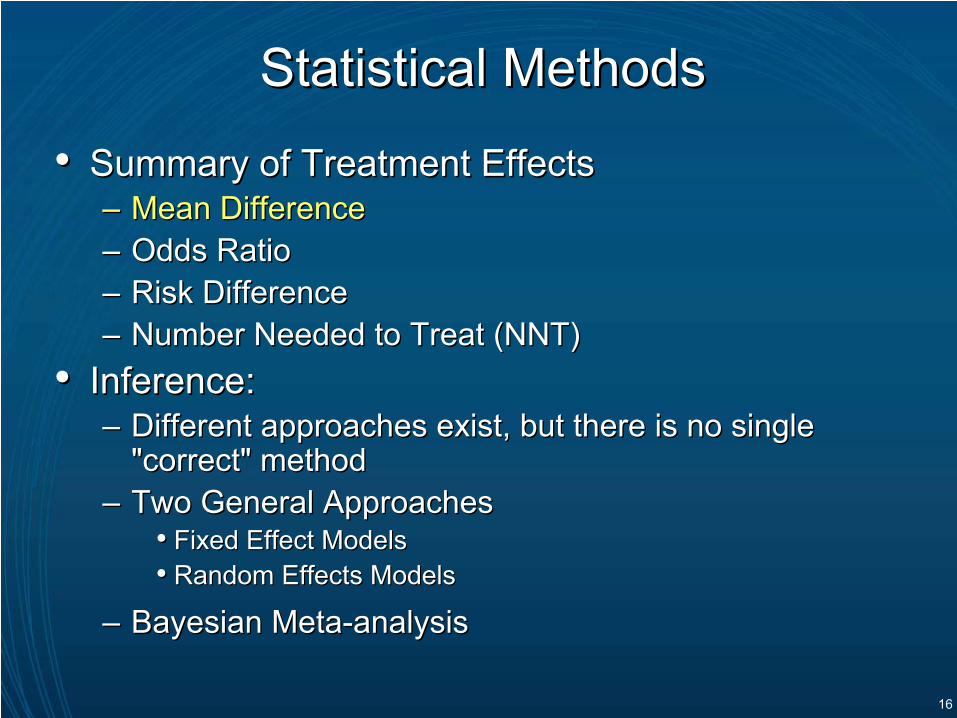
••
Summary of Treatment EffectsSummary of Treatment Effects––
Mean DifferenceMean Difference
––
Odds RatioOdds Ratio––
Risk DifferenceRisk Difference
––
Number Needed to Treat (NNT)Number Needed to Treat (NNT)••
Inference: Inference: ––
Different approaches exist, but there is no single Different approaches exist, but there is no single "correct" method "correct" method
––
Two General ApproachesTwo General Approaches••
Fixed Effect Models Fixed Effect Models
••
Random Effects ModelsRandom Effects Models
––
Bayesian MetaBayesian Meta--analysisanalysis
Statistical MethodsStatistical Methods
17
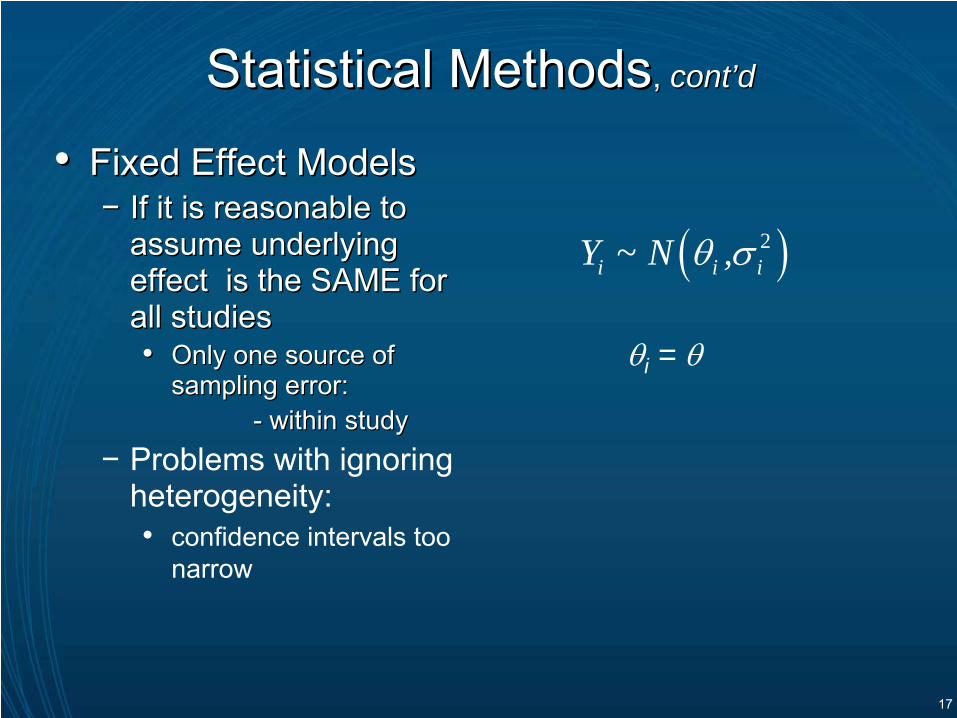
Statistical MethodsStatistical Methods, , contcont’’dd
••
Fixed Effect ModelsFixed Effect Models−−
If it is reasonable to If it is reasonable to assume underlying assume underlying effect is the SAME for effect is the SAME for all studiesall studies••
Only one source of Only one source of sampling error: sampling error:
--
within studywithin study−
Problems with ignoring heterogeneity:•
confidence intervals too narrow
( )2i i iY ~ N ,θ σ
θi = θ
18
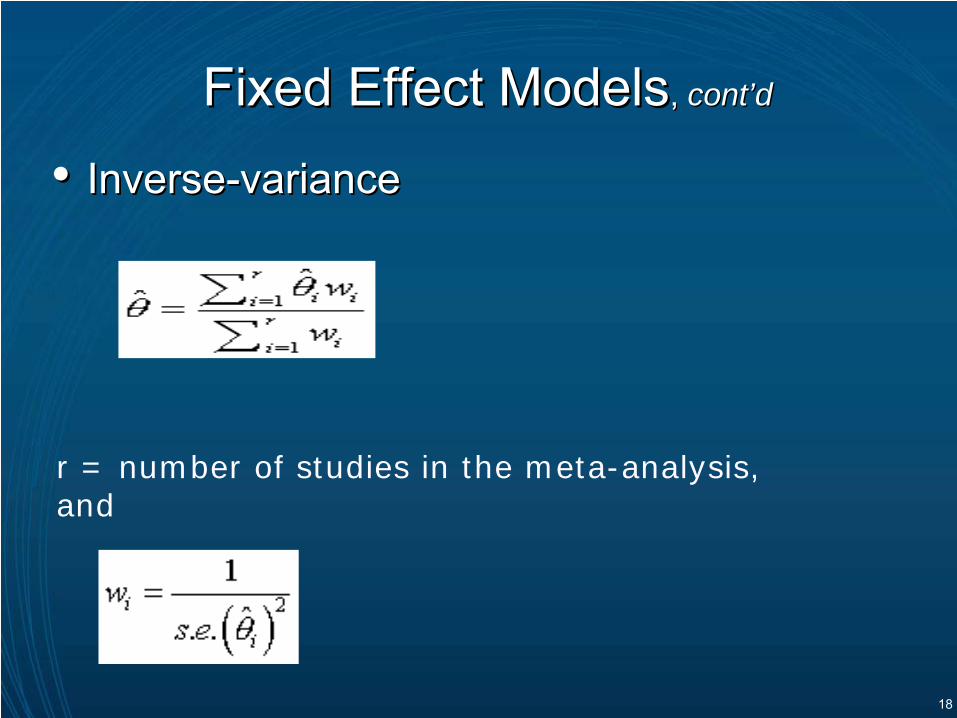
••
InverseInverse--variancevariance
Fixed Effect ModelsFixed Effect Models, , contcont’’dd
r = number of studies in the meta-analysis, and
19
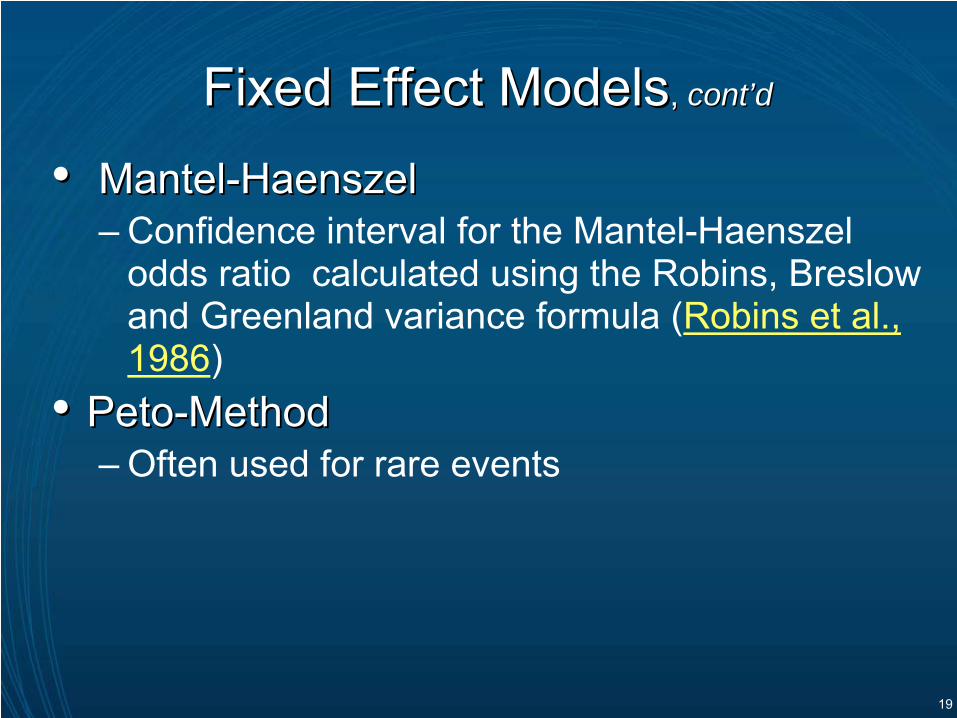
••
MantelMantel--HaenszelHaenszel–
Confidence interval for the Mantel-Haenszel
odds ratio calculated using the Robins, Breslow and Greenland variance formula (Robins et al.,
1986)••
PetoPeto--MethodMethod–
Often used for rare events
Fixed Effect ModelsFixed Effect Models, , contcont’’dd
20
Statistical MethodsStatistical Methods, , contcont’’dd
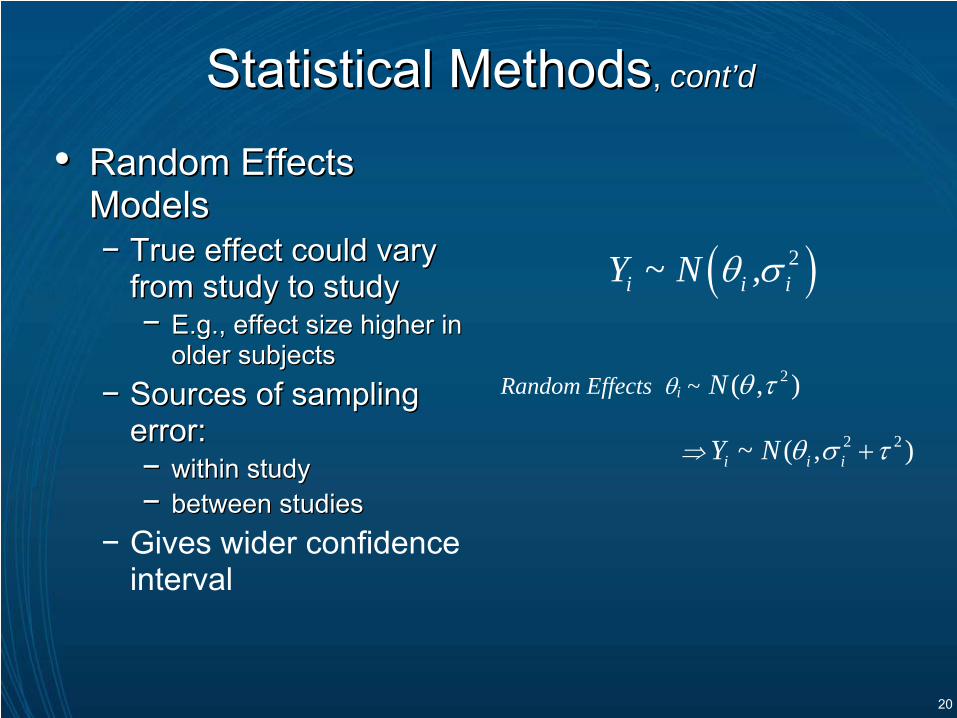
••
Random Effects Random Effects ModelsModels−−
True effect could vary True effect could vary from study to studyfrom study to study−−
E.g., effect size higher in E.g., effect size higher in older subjectsolder subjects
−−
Sources of sampling Sources of sampling error: error: −−
within study within study
−−
between studiesbetween studies−
Gives wider confidence interval
( )2i i iY ~ N ,θ σ
Random Effects θi ~ 2( , )N θ τ
⇒ 2 2~ ( , )i i iY N θ σ τ+
21
••
Random Effects ModelsRandom Effects Models−−
Common method: Common method: DerSimonianDerSimonian--LairdLaird
Statistical MethodsStatistical Methods, , contcont’’dd
*
22
Bayesian Meta-analysis
23
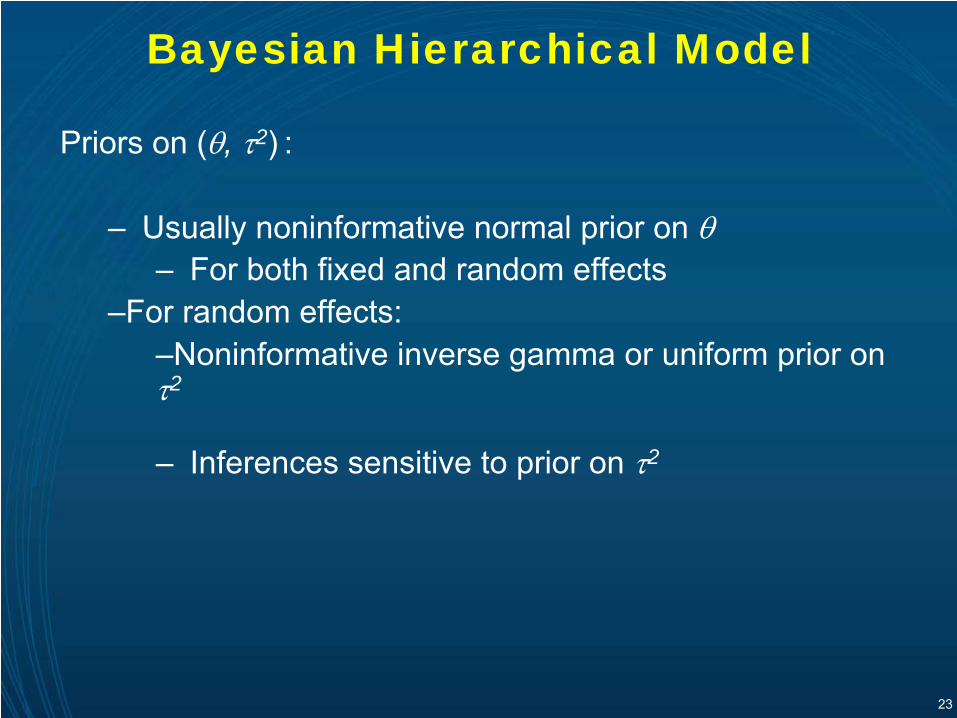
Priors on (θ, τ2) :
– Usually noninformative normal prior on θ– For both fixed and random effects
–For random effects:–Noninformative
inverse gamma or uniform prior on
τ2
– Inferences sensitive to prior on τ2
Bayesian Hierarchical Model
24
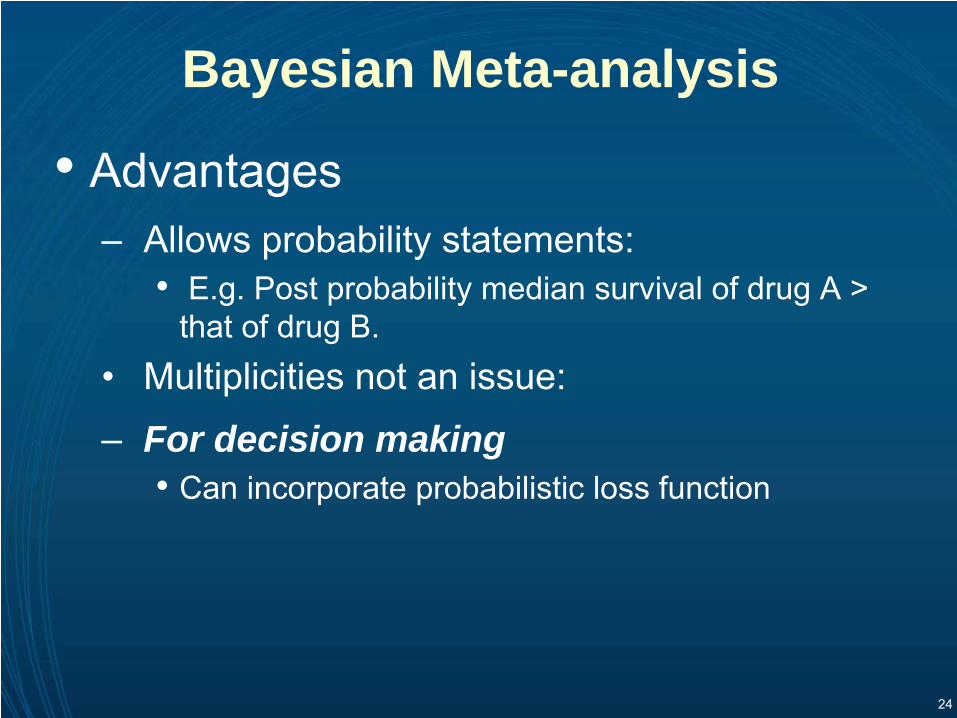
Bayesian Meta-analysis
•
Advantages–
Allows probability statements:•
E.g. Post probability median survival of drug A > that of drug B.
•
Multiplicities not an issue:
–
For decision making•
Can incorporate probabilistic loss function
25
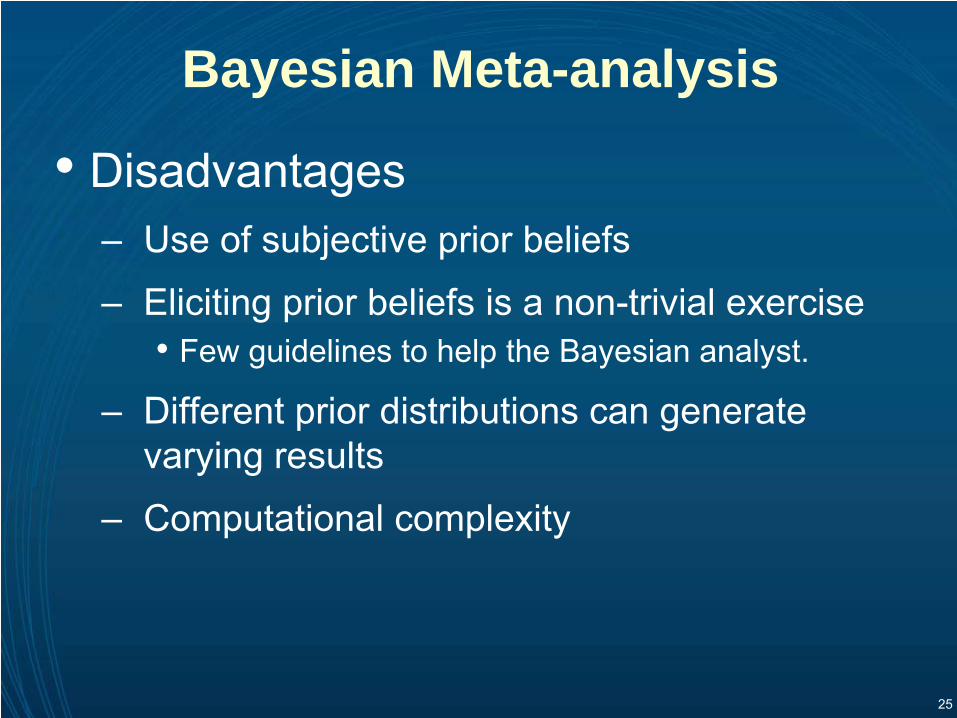
Bayesian Meta-analysis
•
Disadvantages–
Use of subjective prior beliefs
–
Eliciting prior beliefs is a non-trivial exercise•
Few guidelines to help the Bayesian analyst.
–
Different prior distributions can generate varying results
–
Computational complexity
26
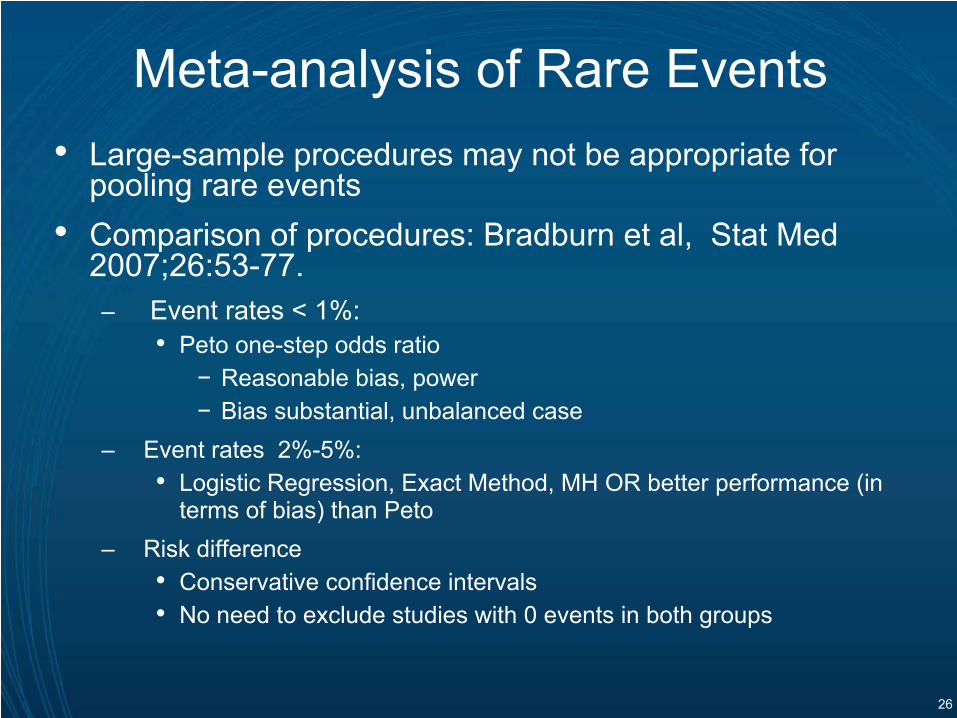
Meta-analysis of Rare Events•
Large-sample procedures may not be appropriate for pooling rare events
•
Comparison of procedures: Bradburn
et al, Stat Med 2007;26:53-77. –
Event rates < 1%: •
Peto
one-step odds ratio−
Reasonable bias, power−
Bias substantial, unbalanced case–
Event rates 2%-5%: •
Logistic Regression, Exact Method, MH OR better performance (in terms of bias) than Peto
–
Risk difference•
Conservative confidence intervals
•
No need to exclude studies with 0 events in both groups
27
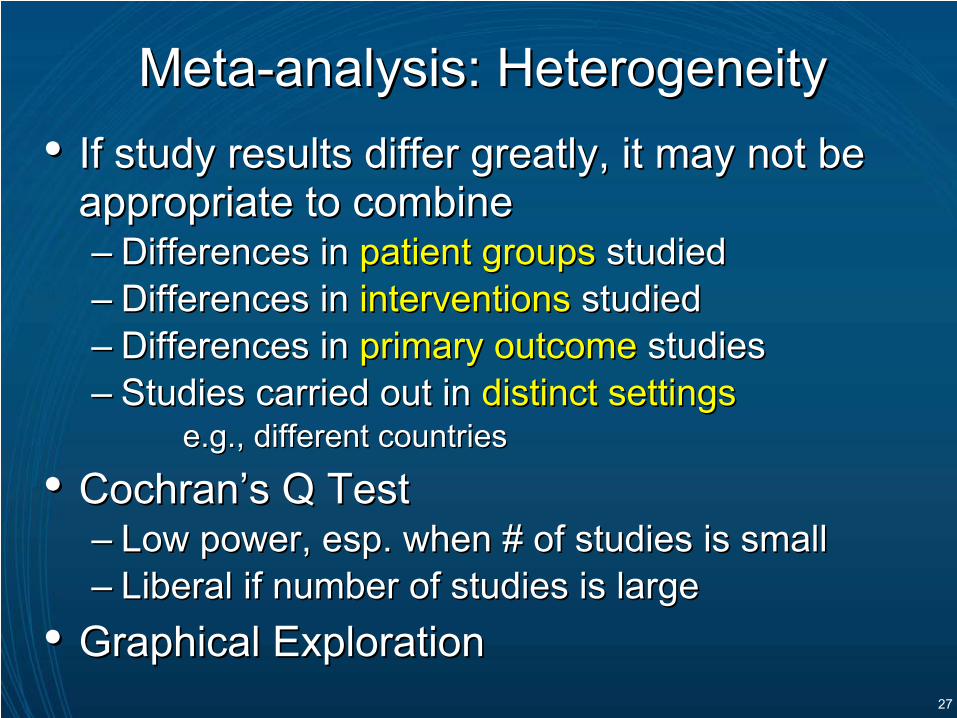
••
If study results differ greatly, it may not be If study results differ greatly, it may not be appropriate to combineappropriate to combine––
Differences in Differences in patient groupspatient groups
studiedstudied
––
Differences in Differences in interventionsinterventions
studiedstudied––
Differences in Differences in primary outcomeprimary outcome
studiesstudies
––
Studies carried out in Studies carried out in distinct settingsdistinct settingse.g., different countriese.g., different countries
••
CochranCochran’’s Q Tests Q Test––
Low power, esp. when # of studies is smallLow power, esp. when # of studies is small
––
Liberal if number of studies is largeLiberal if number of studies is large••
Graphical ExplorationGraphical Exploration
MetaMeta--analysis: Heterogeneityanalysis: Heterogeneity
28
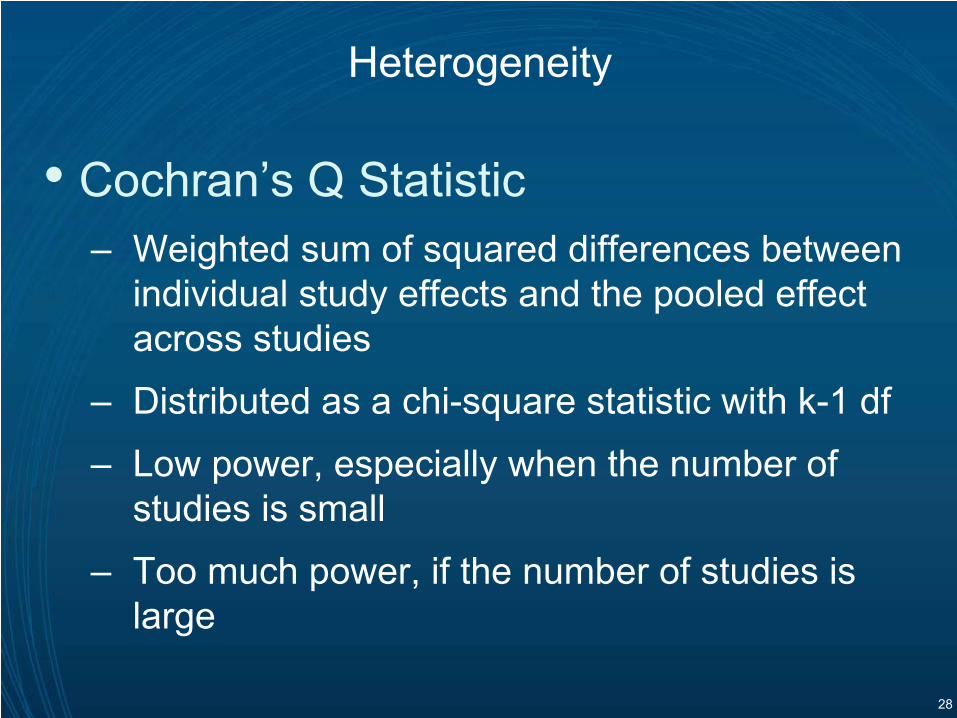
•
Cochran’s Q Statistic–
Weighted sum of squared differences between individual study effects and the pooled effect across studies
–
Distributed as a chi-square statistic with k-1 df
–
Low power, especially when the number of studies is small
–
Too much power, if the number of studies is large
Heterogeneity
29
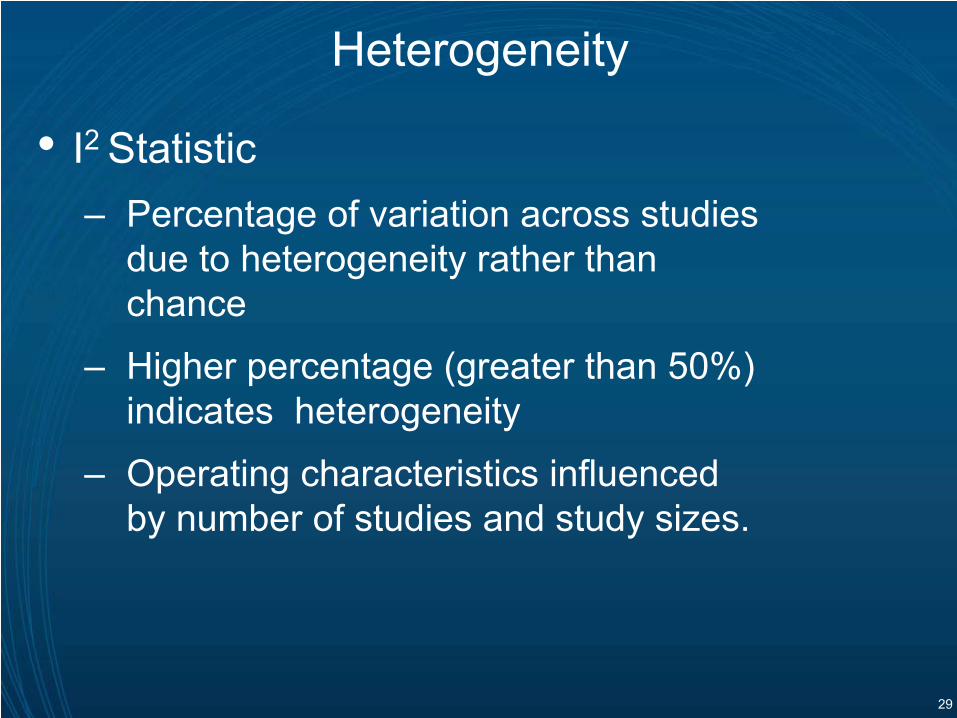
•
I2 Statistic–
Percentage of variation across studies due to heterogeneity rather than chance
–
Higher percentage (greater than 50%) indicates heterogeneity
–
Operating characteristics influenced by number of studies and study sizes.
Heterogeneity
30
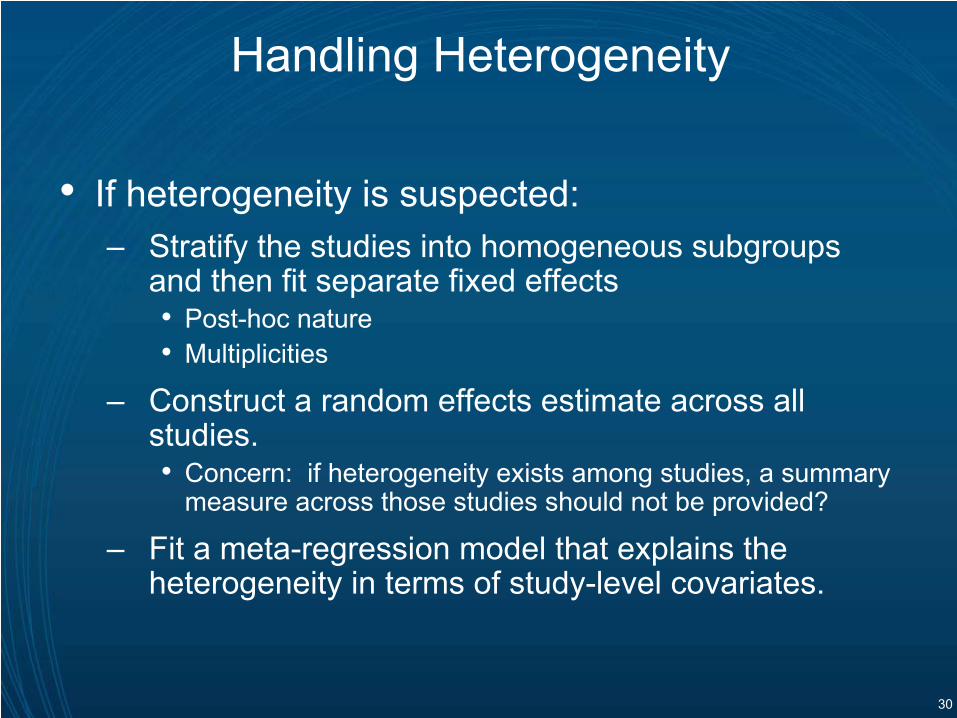
Handling Heterogeneity
•
If heterogeneity is suspected: –
Stratify the studies into homogeneous subgroups and then fit separate fixed effects•
Post-hoc nature
•
Multiplicities
–
Construct a random effects estimate across all studies. •
Concern: if heterogeneity exists among studies, a summary measure across those studies should not be provided?
–
Fit a meta-regression model that explains the heterogeneity in terms of study-level covariates.
31
Meta-Regression with Summary Data
•Can fit with standard weighted linear regression model
• With individual patient data, can fit by two-step process
32
Meta-regression: Issues •
Ecological fallacy–
Group averages don't represent individuals well
–
Averages have little between-study variation
•
Post-hoc specification of prognostic factors may lead to bias/spurious results
•
Number of studies usually small
•
Data may be unavailable (not conceived or not reported)
•
Cannot handle factors that vary by patient within study
33
Graphical display of results from individual Graphical display of results from individual studies on a common scale: studies on a common scale: BlobbogramsBlobbograms
––Also referred to as forest plotsAlso referred to as forest plots
MetaMeta--analysis: Data Presentationanalysis: Data Presentation
34
••
Examine Robustness of Findings Examine Robustness of Findings ––
Examine effects in certain studies, certain Examine effects in certain studies, certain groups of patients, or certain interventions groups of patients, or certain interventions
––
Robustness to departures from model Robustness to departures from model assumptionsassumptions
––
Sensitivity to departure from study selection Sensitivity to departure from study selection criteria criteria
MetaMeta--analysis:analysis: Sensitivity AnalysisSensitivity Analysis
35
••
Discuss Limitations of Analysis Discuss Limitations of Analysis ––
Bias: PublicationBias: Publication
––
Use of aggregate data: Confounding factorsUse of aggregate data: Confounding factors
––
Model assumptionsModel assumptions
––
Heterogeneity Heterogeneity
MetaMeta--analysis:analysis: Study LimitationsStudy Limitations
36
••
Results summarized in light of available Results summarized in light of available body of knowledge?body of knowledge?––
Association is not the same as causationAssociation is not the same as causation
MetaMeta--analysis:analysis: Communication of FindingsCommunication of Findings
37
••
Strength of AssociationStrength of Association––
Validity of measure: OR, RR, etc.Validity of measure: OR, RR, etc.
––
Clinical / statistical significanceClinical / statistical significance
••
Biological PlausibilityBiological Plausibility––
Known potential biologic basis to suggest a Known potential biologic basis to suggest a causal linkcausal link
––
Reference pharmacogenomic evidenceReference pharmacogenomic evidence
Assessment of CausalityAssessment of Causality
••
Assessment of ConsistencyAssessment of Consistency––
Review similar reports for drugReview similar reports for drug
––
Review similar reports for classReview similar reports for class
38
••
EpidemiologyEpidemiology––
Consider the expected rate in the general population for comparaConsider the expected rate in the general population for comparable ble demographic groupsdemographic groups
••
False Positive Findings False Positive Findings ––
Address issue of multiplicityAddress issue of multiplicity––
FDRFDR
••
Imbalance Imbalance (wrt Relevant Confounding Factors)(wrt Relevant Confounding Factors)––
Identify relevant risk factors Identify relevant risk factors
••
PharmacovigilancePharmacovigilance
DatabasesDatabases––
Recent advances in analysis of such dataRecent advances in analysis of such data––
Measures of Measures of disproportionalitydisproportionality
Assessment of CausalityAssessment of Causality, , contcont’’dd
39
QUOROM Statement
Moher
D, Cook DJ, Eastwood S, Olkin
I, Rennie
D, Stroup DF. Improving the Quality
of Reports of Meta-Analyses of Randomised
Controlled Trials: The
QUOROM Statement. Quality of Reporting of Meta-Analyses,
Lancet 1999;354:1896–
900

40
Major Limitations of Study by:
?
Nissen
& Wolski, N Engl J Med 2007;356:2457-71

41
Part II
42
Outline•
Cumulative Meta-analysis
–
Study Ordering–
Limitations
•
Indirect Comparison –
Adjusted Indirect Comparison–
Mixed Treatment Comparison–
Network Meta-analysis–
Issues with Indirect and MT Comparisons
•
Observational Data Analysis–
Sources of Bias–
Methodological Issues
•
Comparative Effectiveness Research–
Background–
Relation to Traditional Meta-analysis–
Current Status
•
Summary and Conclusion
43
Cumulative Meta-Analysis
•
Commonly executed with chronologically ordered RCTs–
Perform a new statistical pooling every time a new RCT becomes available
–
Impact of each study on the pooled estimate may be assessed
–
Reveals (temporal) trend towards superiority of the treatment or the control, or towards indifference
–
Performed retrospectively, the year when a treatment could have been found to be effective could be identified
–
Performed prospectively, an effective treatment may be identified at the earliest possible moment
44
Cumulative Meta-analysis: Study Ordering
•
By control group event rate–
Low control event rates require large n to establish efficacy–
Arrangement by descending or ascending order helps assess study heterogeneity
•
Study size–
Small studies imply high variability, and publication bias–
Pooling only small studies lead to overestimation of treat effect
•
Study quality–
Need a scoring algorithm for RCTs–
To evaluate impact of poorly designed/conducted trials
•
Effect size–
Impacts of inconclusive trials on results of analysis
45
Cumulative Meta-Analysis: Issues
•
Statistical: –
Typically, frequentist
approaches employed
–
Inflation of Type I error with repeated analyses.
•
Evolution of treatment effect over time–
Changes in patient demographics
–
Changes in healthcare delivery
–
Evolving medical practices
46
Indirect Comparison
•
Well-conducted randomized controlled trials (RCTs) provide the most valid estimates of the relative efficacy of competing healthcare interventions–
However, many interventions have not been directly compared in RCTs
•
Comparison of different healthcare interventions using data from disparate studies–
Often used because of a lack of, or sufficient, evidence from head-to-head comparative trials.
47
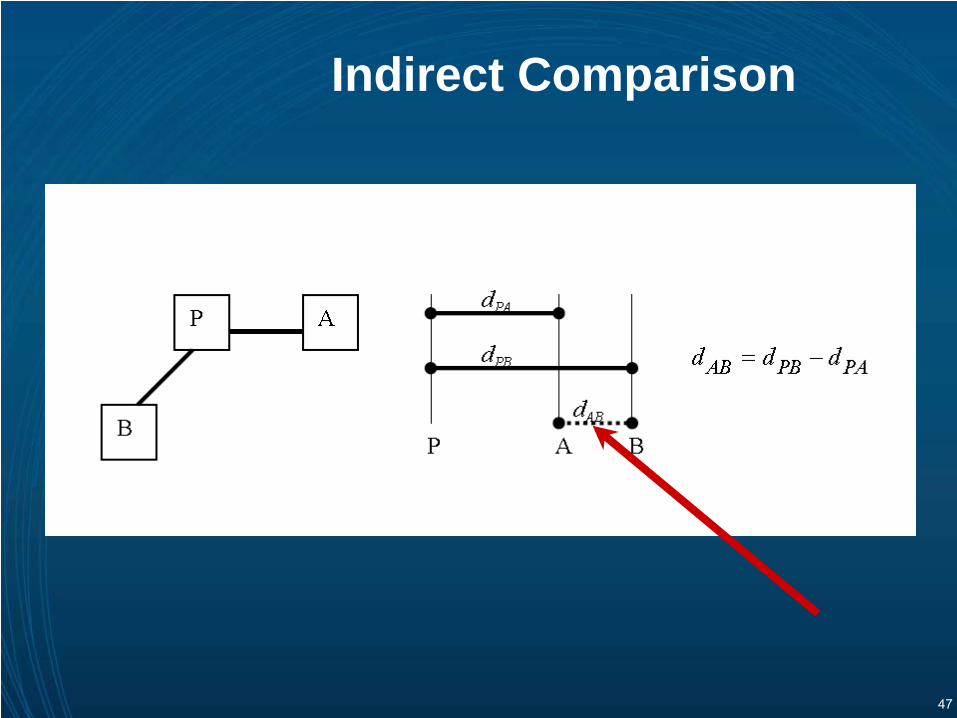
Indirect Comparison
48
Indirect Comparisons: Basic Assumptions
•
Exchangeability/Similarity–
All trials comparing pairs of tx
arms estimate
same effect
–
Different sets of trials being used are similar
•
Independence between pairwise comparisons:
–
Not true for more than 2 arm trials in Bucher’s method.
49
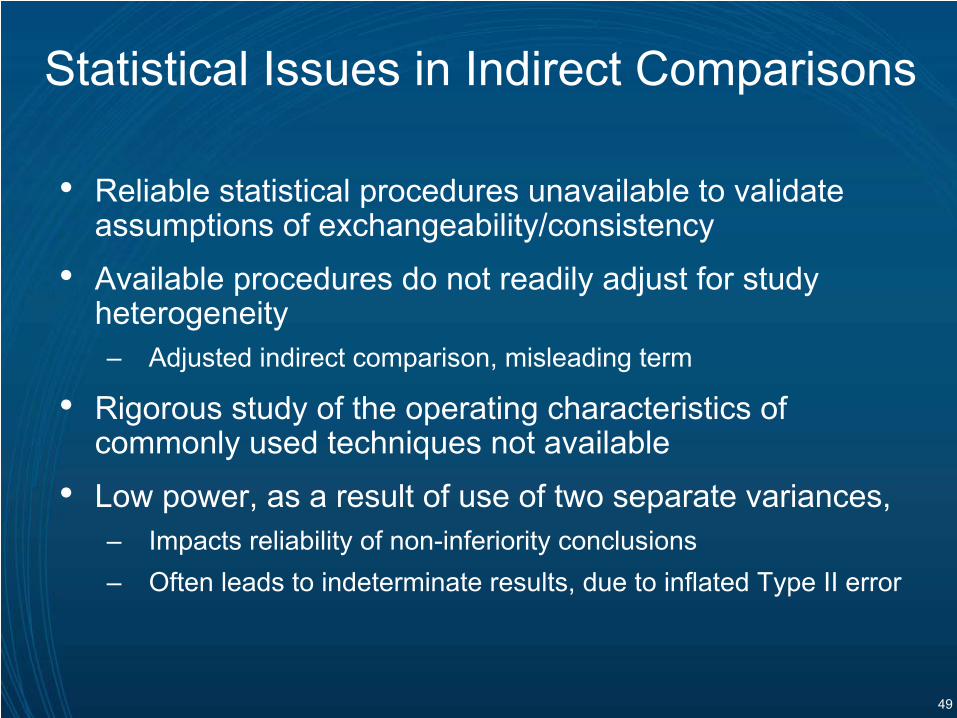
Statistical Issues in Indirect Comparisons
•
Reliable statistical procedures unavailable to validate assumptions of exchangeability/consistency
•
Available procedures do not readily adjust for study heterogeneity–
Adjusted indirect comparison, misleading term
•
Rigorous study of the operating characteristics of commonly used techniques not available
•
Low power, as a result of use of two separate variances, –
Impacts reliability of non-inferiority conclusions–
Often leads to indeterminate results, due to inflated Type II error
50
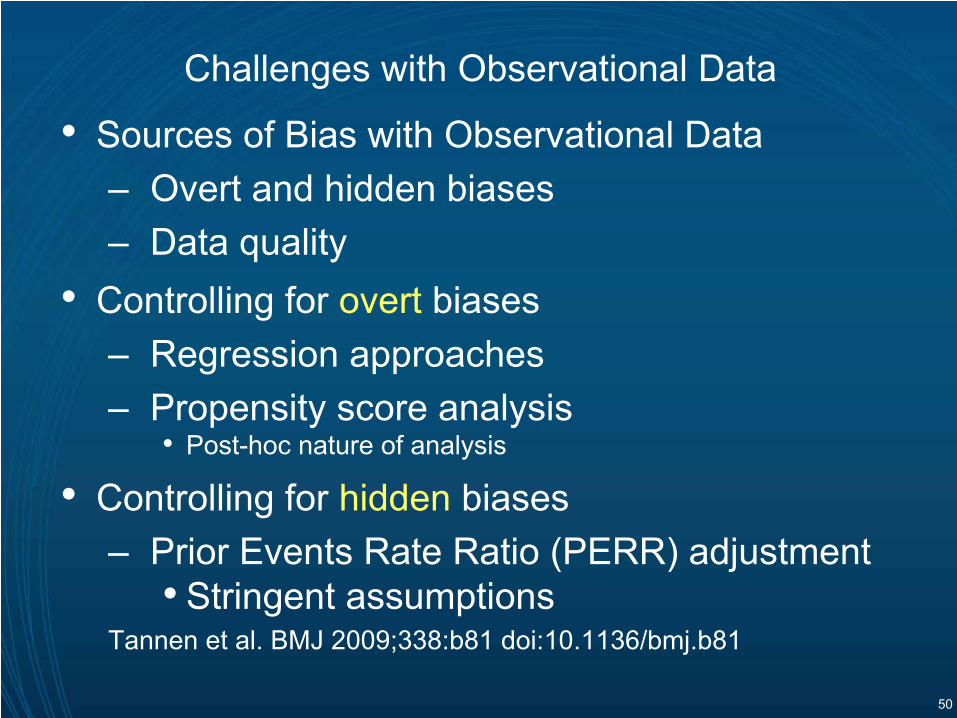
Challenges with Observational Data
•
Sources of Bias with Observational Data –
Overt and hidden biases
–
Data quality•
Controlling for overt
biases
–
Regression approaches–
Propensity score analysis•
Post-hoc nature of analysis
•
Controlling for hidden
biases–
Prior Events Rate Ratio (PERR) adjustment •
Stringent assumptions
Tannen
et al. BMJ 2009;338:b81 doi:10.1136/bmj.b81
51
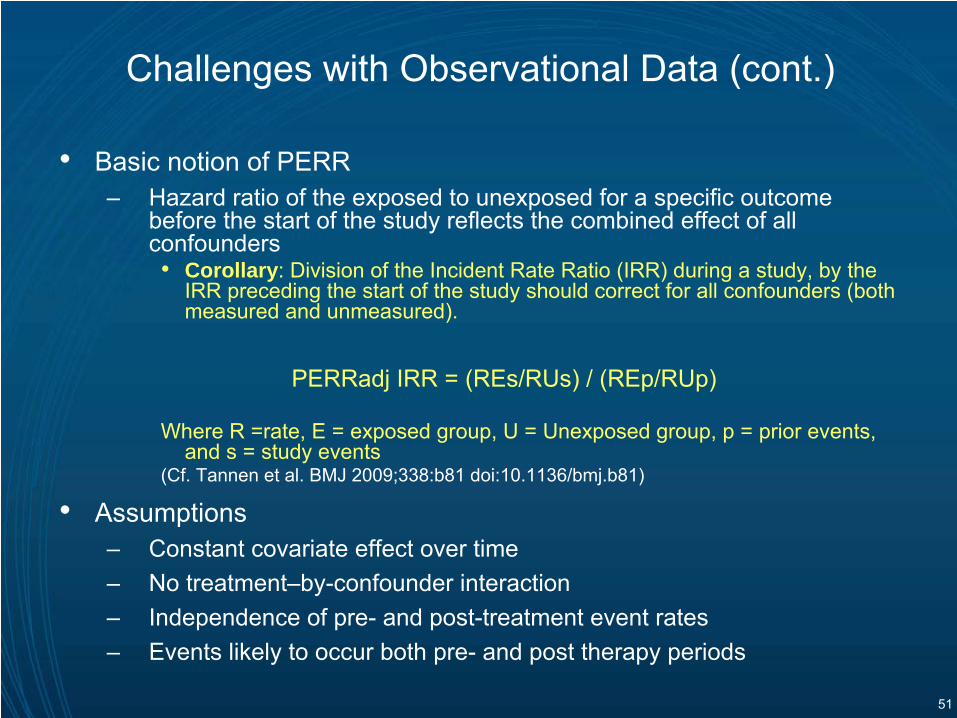
Challenges with Observational Data (cont.)
•
Basic notion of PERR–
Hazard ratio of the exposed to unexposed for a specific outcome before the start of the study reflects the combined effect of all confounders•
Corollary: Division of the Incident Rate Ratio (IRR) during a study, by the IRR preceding the start of the study should correct for all confounders (both measured and unmeasured).
PERRadj
IRR = (REs/RUs) / (REp/RUp)
Where R =rate, E = exposed group, U = Unexposed group, p = prior
events, and s = study events
(Cf. Tannen
et al. BMJ 2009;338:b81 doi:10.1136/bmj.b81)
•
Assumptions–
Constant covariate effect over time–
No treatment–by-confounder interaction–
Independence of pre-
and post-treatment event rates–
Events likely to occur both pre-
and post therapy periods
52
Challenges with Observational Data (cont.)
•
Research needed for–
Controlling for hidden bias
–
Assessment of consistency between RCTs
and Observational
studies–
Methods for combining RCTs
and
non-RCTs–
Conditions for and appropriateness of combining RCTs
and non-RCTs
53
Comparative Effectiveness Research (CER)
54
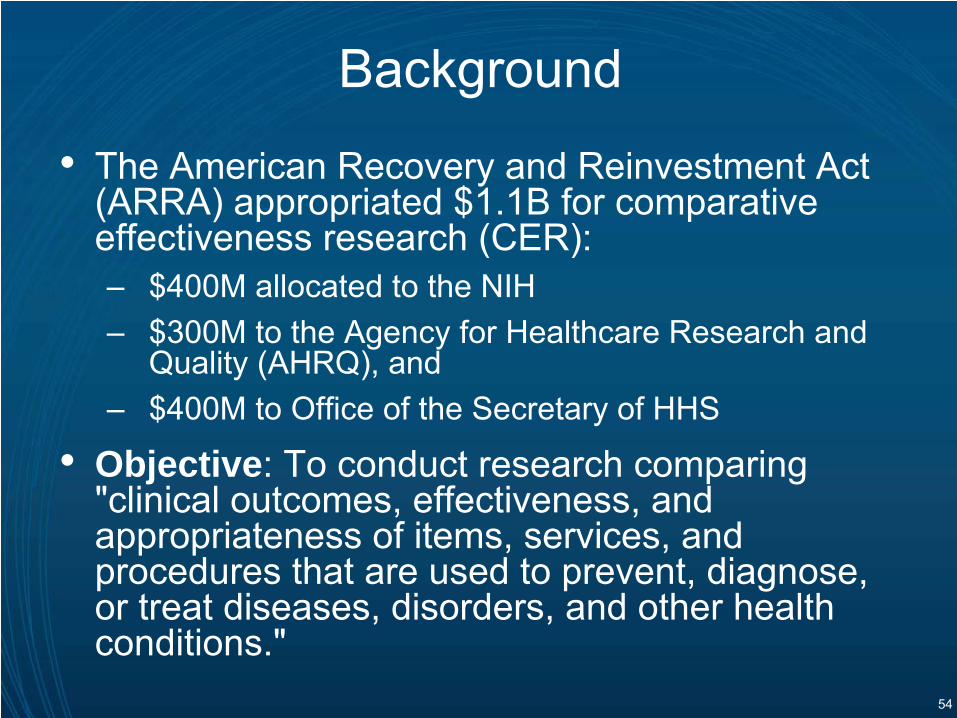
Background
•
The American Recovery and Reinvestment Act (ARRA) appropriated $1.1B for comparative effectiveness research (CER):–
$400M allocated to the NIH
–
$300M to the Agency for Healthcare Research and Quality (AHRQ), and
–
$400M to Office of the Secretary of HHS
•
Objective: To conduct research comparing "clinical outcomes, effectiveness, and appropriateness of items, services, and procedures that are used to prevent, diagnose, or treat diseases, disorders, and other health conditions."
55
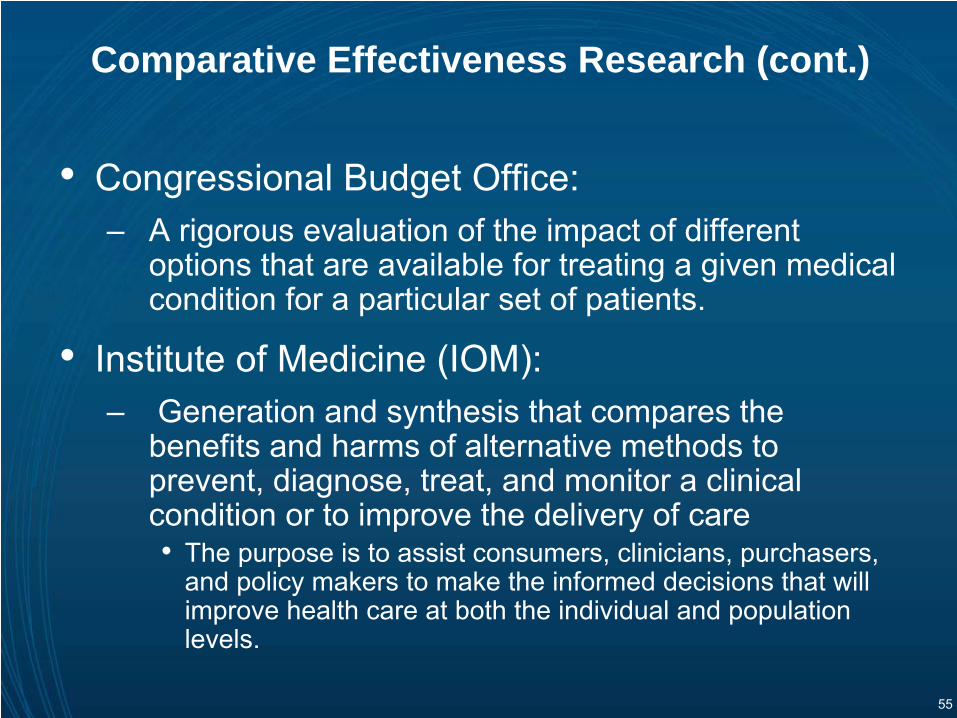
Comparative Effectiveness Research (cont.)
•
Congressional Budget Office: –
A rigorous evaluation of the impact of different options that are available for treating a given medical condition for a particular set of patients.
•
Institute of Medicine (IOM):–
Generation and synthesis that compares the benefits and harms of alternative methods to prevent, diagnose, treat, and monitor a clinical condition or to improve the delivery of care•
The purpose is to assist consumers, clinicians, purchasers, and policy makers to make the informed decisions that will improve health care at both the individual and population levels.
56
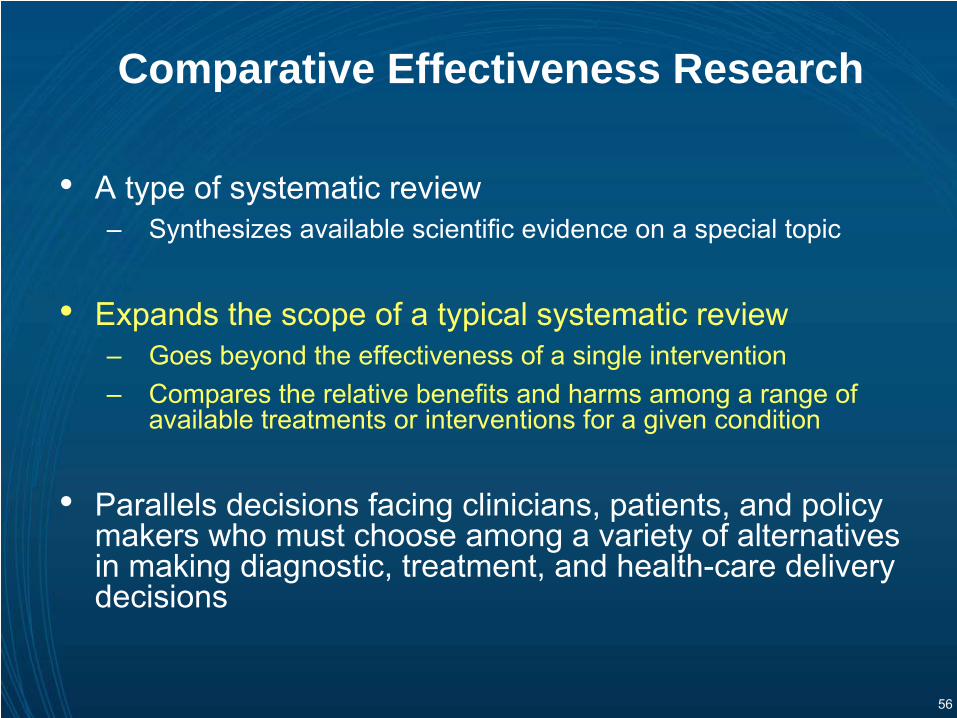
Comparative Effectiveness Research
•
A type of systematic review–
Synthesizes available scientific evidence on a special topic
•
Expands the scope of a typical systematic review–
Goes beyond the effectiveness of a single intervention–
Compares the relative benefits and harms among a range of available treatments or interventions for a given condition
•
Parallels decisions facing clinicians, patients, and policy makers who must choose among a variety of alternatives in making diagnostic, treatment, and health-care delivery decisions
57
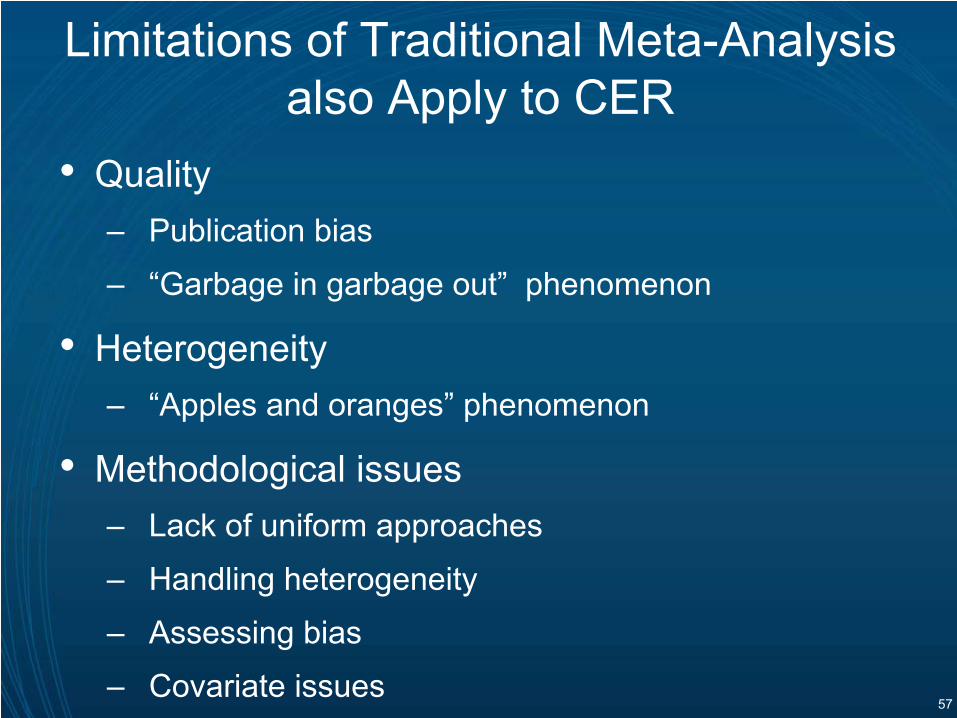
Limitations of Traditional Meta-Analysis also Apply to CER
•
Quality –
Publication bias
–
“Garbage in garbage out”
phenomenon
•
Heterogeneity–
“Apples and oranges”
phenomenon
•
Methodological issues–
Lack of uniform approaches
–
Handling heterogeneity
–
Assessing bias
–
Covariate issues
58
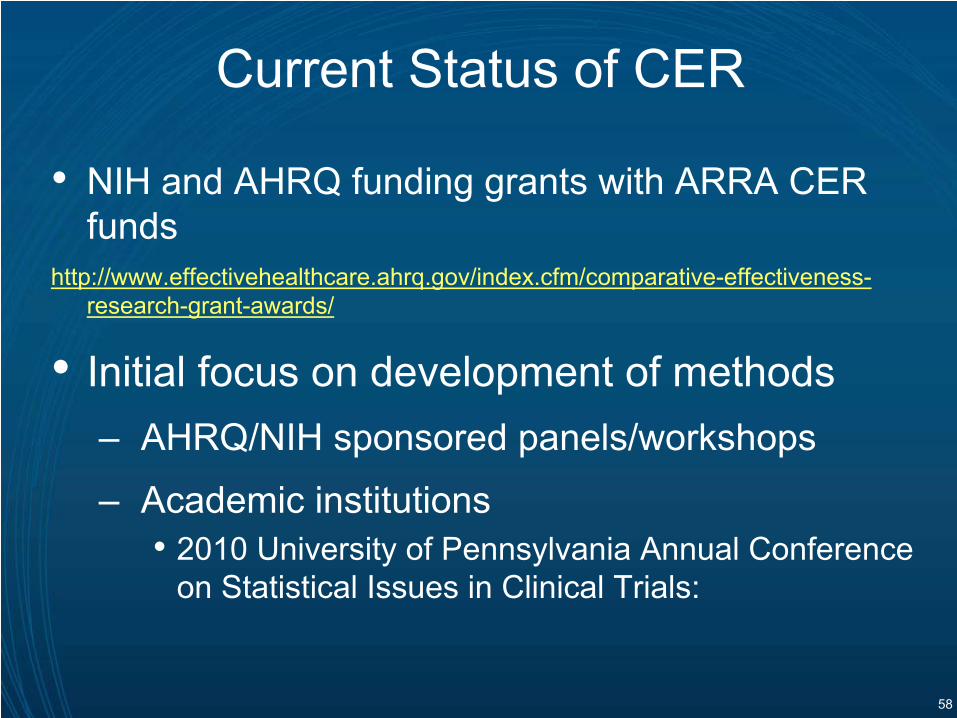
Current Status of CER
•
NIH and AHRQ funding grants with ARRA CER funds
http://www.effectivehealthcare.ahrq.gov/index.cfm/comparative-effectiveness-
research-grant-awards/
•
Initial focus on development of methods–
AHRQ/NIH sponsored panels/workshops
–
Academic institutions•
2010 University of Pennsylvania Annual Conference on Statistical Issues in Clinical Trials:
59
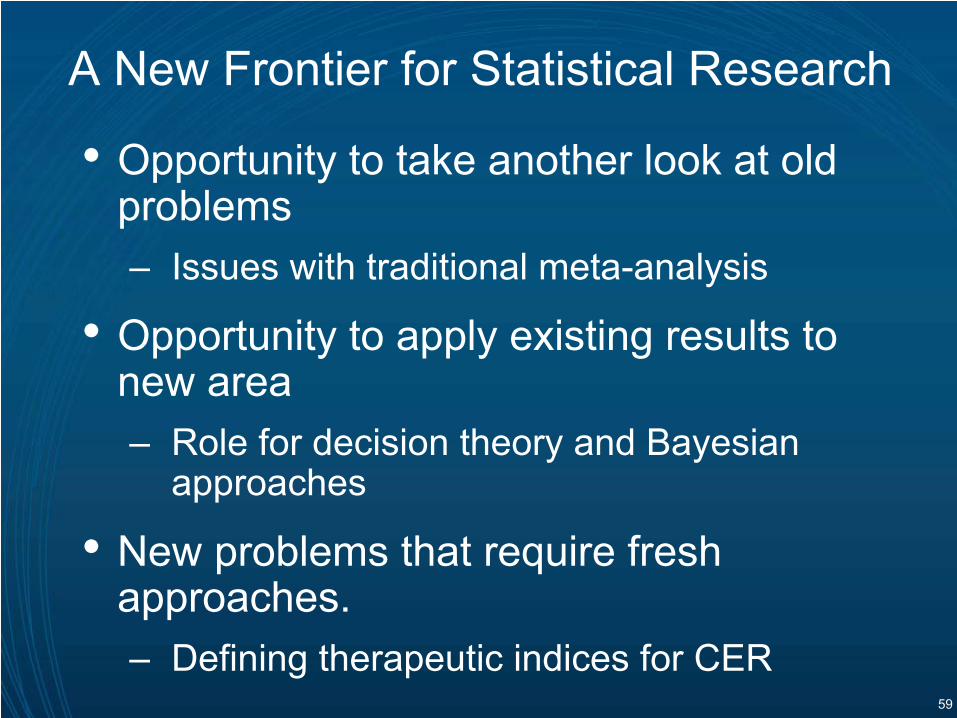
A New Frontier for Statistical Research
•
Opportunity to take another look at old problems–
Issues with traditional meta-analysis
•
Opportunity to apply existing results to new area–
Role for decision theory and Bayesian approaches
•
New problems that require fresh approaches.–
Defining therapeutic indices for CER
60
Concluding Remarks
•
Meta-analysis and CER pose considerable practical and methodological challenges
•
Critical role for statisticians to engage in methodological work
•
Without sound methodological foundation, potential for adverse impacts on public health
61
Selected References on Indirect Comparisons•
Bucher HC, Guyatt
GH, Griffith LE, Walter SD. The results of direct and indirect treatment comparisons in meta-analysis of randomized controlled trials. J Clin Epidemiol 1997;50(6):683-91.
•
Eddy DM, Hasselblad
V, Shachter
R. An introduction to a Bayesian method for meta-analysis: The confidence profile method. Med Decis
Making. 1990 Jan-Mar;10(1):15-23.•
Song F, Altman DG, Glenny
AM, Deeks
JJ. Validity of indirect comparison for estimating efficacy of competing interventions: empirical evidence from published meta-analyses. BMJ. 2003;326:472.
•
Lu G, Ades
AE. Combination of direct and indirect evidence in mixed treatment comparisons. Stat Med 2004;23:3105–24.•
Caldwell DM, Ades
AE, Higgins JP. Simultaneous comparison of multiple treatments:
combining direct and indirect evidence. BMJ 2005;331:897–900.
•
Jansen JP, Crawford B, Bergman G, Stam
W. Bayesian meta-analysis of multiple treatment comparisons: an introduction to mixed treatment comparisons. Value Health. 2008; 11:956-64.
•
Cooper NJ, Sutton AJ, Morris D, Ades
AE, Welton
NJ. Addressing between-study heterogeneity and inconsistency in mixed treatment comparisons: Application to stroke prevention treatments in individuals with non-rheumatic atrial
fibrillation. Stat Med. 2009;28:1861-81. •
Song F, Loke
YK, Walsh T, Glenny
AM, Eastwood AJ, Altman DG. Methodological problems in the use of indirect comparisons for evaluating healthcare interventions: survey of published systematic reviews. BMJ. 2009 Apr 3;338
•
Lumley T. Network meta-analysis for indirect treatment comparisons. Stat Med 2002;21(16):2313-24.•
Ades
AE. A chain of evidence with mixed comparisons: models for multi-parameter synthesis and consistency of evidence. Stat Med 2003;22(19):2995-3016.
•
Caldwell DM, Ades
AE, Higgins JP. Simultaneous comparison and indirect evidence. BMJ 2005;331(7521):897-900.•
Vandermeer
BW, Buscemi
N, Liang Y, Witmans
M. Comparison of meta-analytic results of indirect, direct, and combined comparisons of drugs for chronic insomnia in adults: a case study. Med Care 2007;45(10 Supl
2):S166-S172.•
Song F, Harvey I, Lilford
R. Adjusted indirect comparison may be less biased than direct comparison for evaluating new pharmaceutical interventions. J Clin Epidemiol 2008;61(5):455-63. 40.
•
Glenny
AM, Altman DG, Song F, Sakarovitch
C, Deeks
JJ, D'Amico R, et al. Indirect comparisons of competing interventions. Health Technol Assess 2005;9(26):1-134.
•
Nissen
SE, Wolski
K. Effect of Rosiglitazone
on the risk of myocardial infarction and death from cardiovascular causes. The New England Journal of Medicine 2007; 356(24):2457–2471.