Embed Size (px)
Citation preview
Current Condition of
nt ee
rin
g Water & Sanitation Infrastructures in Indonesia
epar
tmen
nta
l Eng
ine Infrastructures in Indonesia
nee
rin
g D
nvir
onm
enB
andu
ng
enta
l Eng
iC
ivil
& E
nek
nolo
gi B
Agus Jatnika EffendiHead of Environmental Engineering DepartmentF lt f Ci il & E i t l E i i
Envi
ronm
eFa
cult
y of
In
stit
ut
Te Faculty of Civil & Environmental EngineeringInstitute Technology Bandung
E F I
1

Water & Sanitation InfrastructuresW t S l• Water Supply:
– Water Resources:• Surface water: rivers, lakes, springs
nt ee
rin
g
, , p g
• groundwater
– Water treatment plant:d b l l ( ) l l
epar
tmen
nta
l Eng
ine • Operated by local goverment (PDAM): mostly clean water
• Operated by community for small water supply system
– Piping system:
nee
rin
g D
nvir
onm
enB
andu
ng
p g y• Transmission
• Distribution
D i W f ili
enta
l Eng
iC
ivil
& E
nek
nolo
gi B • Domestic Wastewater facilites:
– Wastewater treatment:• On site: Septic Tank (temporary: might contaminate groundwater)
Envi
ronm
eFa
cult
y of
In
stit
ut
Te
p ( p y g g )
• Off site: wastewater treatment plant
– Sanitation facility
E F I • Drainage & Sewerage: combine and separate system
• Solid Waste Handling: collecting to disposal 2

Water Supply Systempp y yn
t eeri
ng
epar
tmen
nta
l Eng
ine
nee
rin
g D
nvir
onm
enB
andu
ng
enta
l Eng
iC
ivil
& E
nek
nolo
gi B
Envi
ronm
eFa
cult
y of
In
stit
ut
Te
E F I
3

Sewerage Systemn
t eeri
ng
epar
tmen
nta
l Eng
ine
nee
rin
g D
nvir
onm
enB
andu
ng
enta
l Eng
iC
ivil
& E
nek
nolo
gi B
Envi
ronm
eFa
cult
y of
In
stit
ut
Te
E F I
4SOURCE : WWW.CO.THURSTON.WA.US

Drainage and Seweragen
t eeri
ng
epar
tmen
nta
l Eng
ine
nee
rin
g D
nvir
onm
enB
andu
ng
enta
l Eng
iC
ivil
& E
nek
nolo
gi B
Envi
ronm
eFa
cult
y of
In
stit
ut
Te
E F I
5

On Site Sanitationn
t eeri
ng
epar
tmen
nta
l Eng
ine
nee
rin
g D
nvir
onm
enB
andu
ng
enta
l Eng
iC
ivil
& E
nek
nolo
gi B
Envi
ronm
eFa
cult
y of
In
stit
ut
Te
E F I
6Source : www.abeeseptic.com

Solid Waste Handlingn
t eeri
ng
epar
tmen
nta
l Eng
ine
nee
rin
g D
nvir
onm
enB
andu
ng
enta
l Eng
iC
ivil
& E
nek
nolo
gi B
Envi
ronm
eFa
cult
y of
In
stit
ut
Te
E F I
7Source: www.fondoamericas.org.pe

nt ee
rin
g ep
artm
enn
tal E
ngin
en
eeri
ng
Dnv
iron
men
Ban
dung
enta
l Eng
iC
ivil
& E
nek
nolo
gi B
Envi
ronm
eFa
cult
y of
In
stit
ut
Te
E F I
8

Political reasons:n
t eeri
ng
epar
tmen
nta
l Eng
ine
nee
rin
g D
nvir
onm
enB
andu
ng
enta
l Eng
iC
ivil
& E
nek
nolo
gi B
Envi
ronm
eFa
cult
y of
In
stit
ut
Te
E F I
9Year 2008: Year of Sanitation (YoS)

Public Health Indicators• Every year in Indonesia 120 M diseases incidents and 50,000 babies
died (World Bank)
• Infant mortality rate (IMR) in Indonesia in 2005 were 23 7 per 1000
nt ee
rin
g
• Infant mortality rate (IMR) in Indonesia in 2005 were 23.7 per 1000 fertality (DepKes)
• From about 200.000 infant mortality in Asia every year, half of them
epar
tmen
nta
l Eng
ine
was in Indonesia. 31% of them due to diarhea (Data PLP Ditjen Cipta Karya)
• Diarhea in 2007 occurred in 10 kabupatens (3 661 cases) with Case
nee
rin
g D
nvir
onm
enB
andu
ng
Diarhea in 2007 occurred in 10 kabupatens (3,661 cases) with Case Fatality Rate (CFR) reached 1.26%. CFR of diarhea in 2000 and 2005 were 1.92% and 2.52% respectively. In Central Sulawesi Province: 18 84%!! (Depkes 2008)
enta
l Eng
iC
ivil
& E
nek
nolo
gi B 18.84%!! (Depkes, 2008)
• 45% of Public Health Indicators in Indonesia was found to be affected by Environmental Factors (Water & Sanitation) (BPS, 2005)
Envi
ronm
eFa
cult
y of
In
stit
ut
Te
According to World Bank Report (Jakarta Post, 29 August 2008), Indonesia was predicted to spend around 6 million USD due to E F I
10
improper hygiene dan sanitation management. Cost per capita reached about Rp. 275.000 in urban area and Rp. 224.000 in rural
area

The Cause of Infant Death in IndonesiaThe Cause of Infant Death in Indonesian
t eeri
ng
epar
tmen
nta
l Eng
ine
nee
rin
g D
nvir
onm
enB
andu
ng
enta
l Eng
iC
ivil
& E
nek
nolo
gi B
Envi
ronm
eFa
cult
y of
In
stit
ut
Te
E F I
11
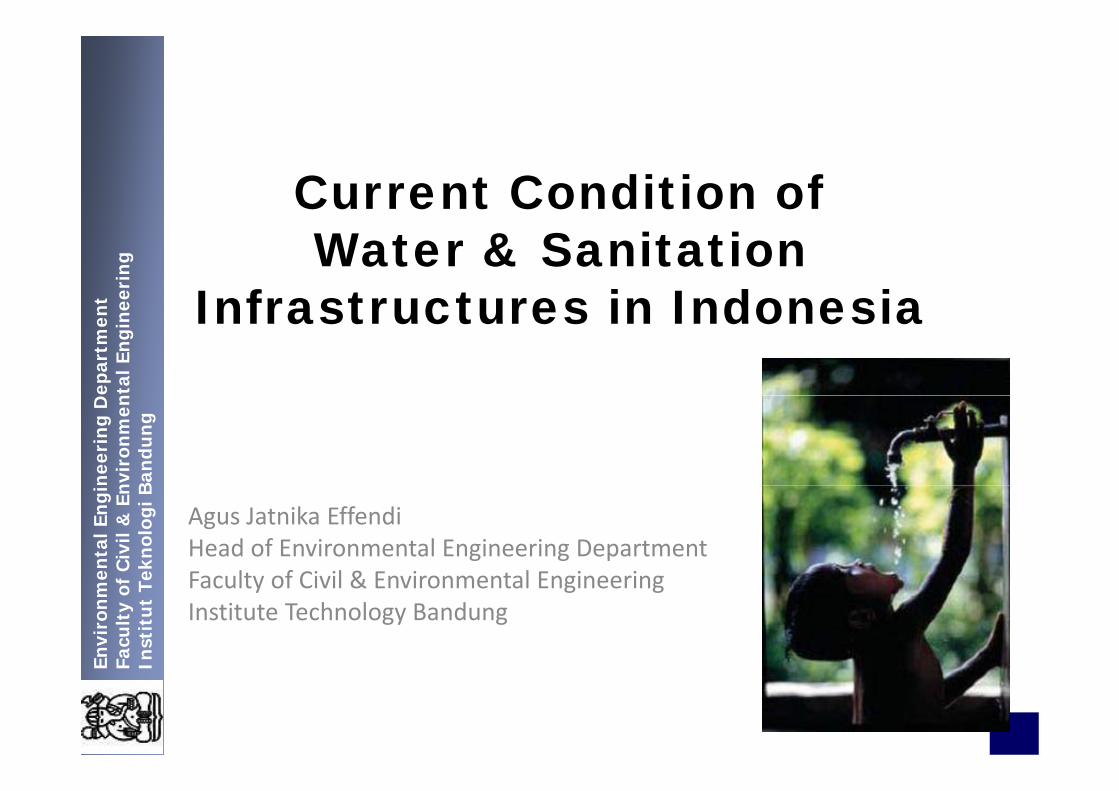
Water Infrastructure ‐ 1
• Water Supply requirements:
nt ee
rin
g
– Qualitatively:Water Treatment Plant
– Quantitatively: Water Resources
Continuity:Transmission & Distribution System
epar
tmen
nta
l Eng
ine – Continuity:Transmission & Distribution System
• Water Use in Indonesia:
– Direct Connection:100 – 120 lpd
nee
rin
g D
nvir
onm
enB
andu
ng
p
– Indirect Connection: 20 – 40 lpd
• Access to safe drinking water in Indonesia in year 2004, 2005 and 2006 48 3% 48 9% d 52 1% i l (BPS S )
enta
l Eng
iC
ivil
& E
nek
nolo
gi B 2006: 48.3%, 48.9% and 52.1% respectively (BPS, Susenas)
• There are 318 PDAM (Perusahaan Daerah Air Minum) known as water supply company owned by local goverment in 2006:
Envi
ronm
eFa
cult
y of
In
stit
ut
Te
pp y p y y g
– Healthy: 12% services 10,1 M persons
– Unhealthy: 23% services 16,7 M persons
E F I – Bad: 65% services 12,7 M persons
12

Water Use
Usage Bandung (lpd) Denpasar (lpd)
nt ee
rin
g
Usage Bandung (lpd) Denpasar (lpd)
Drinking 0.6 13.3
Cooking 1.4
epar
tmen
nta
l Eng
ine
Dishes Washing 13.0 7.8
WC Flushing 14.0 8.1
nee
rin
g D
nvir
onm
enB
andu
ng
Hand Washing ‐ ‐
Home Cleansing 2.0 3.6
B thi 36 0 45 5
enta
l Eng
iC
ivil
& E
nek
nolo
gi B Bathing 36.0 45.5
Cloth Washing 11.0 8.0
Plant Dewatering 4.0 6.6
Envi
ronm
eFa
cult
y of
In
stit
ut
Te
Plant Dewatering 4.0 6.6
Car Washing 1.0 2.9
Wudlu 17.0 1.4
E F I
Others ‐ 2.813

HoweverHowever,• No sinificant increase in access safe drinking water within 5 years:
MDG’s Target is 67% (BPS, Susenas)
nt ee
rin
g
MDG s Target is 67% (BPS, Susenas)
• 41% of them was connected to distribution system in urban area, whereas in rural area only 8% (Ditjen Cipta Karya)
epar
tmen
nta
l Eng
ine • Water losses from water supply system (technical and non technical
aspects): 30% – 40%
nee
rin
g D
nvir
onm
enB
andu
ng
enta
l Eng
iC
ivil
& E
nek
nolo
gi B
Envi
ronm
eFa
cult
y of
In
stit
ut
Te
E F I
14
Sanitation‐1
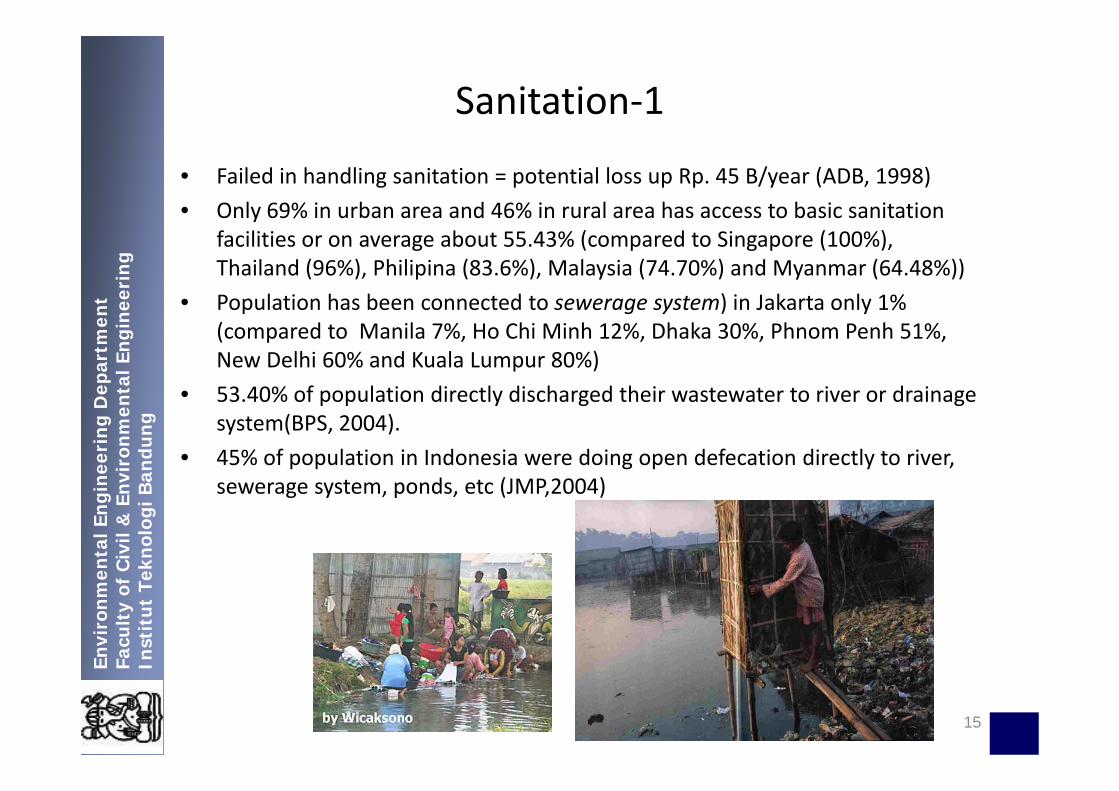
• Failed in handling sanitation = potential loss up Rp. 45 B/year (ADB, 1998)
• Only 69% in urban area and 46% in rural area has access to basic sanitation
nt ee
rin
g
Only 69% in urban area and 46% in rural area has access to basic sanitation facilities or on average about 55.43% (compared to Singapore (100%), Thailand (96%), Philipina (83.6%), Malaysia (74.70%) and Myanmar (64.48%))
• Population has been connected to sewerage system) in Jakarta only 1%
epar
tmen
nta
l Eng
ine Population has been connected to sewerage system) in Jakarta only 1%
(compared to Manila 7%, Ho Chi Minh 12%, Dhaka 30%, Phnom Penh 51%, New Delhi 60% and Kuala Lumpur 80%)
• 53 40% of population directly discharged their wastewater to river or drainage
nee
rin
g D
nvir
onm
enB
andu
ng
• 53.40% of population directly discharged their wastewater to river or drainage system(BPS, 2004).
• 45% of population in Indonesia were doing open defecation directly to river, sewerage system ponds etc (JMP2004)
enta
l Eng
iC
ivil
& E
nek
nolo
gi B sewerage system, ponds, etc (JMP,2004)
Envi
ronm
eFa
cult
y of
In
stit
ut
Te
E F I
15

Indonesian Wastewater CharacteristicJapan International Corporation Agency – Ministry of
Public Work RI
BOD
h / /d
nt ee
rin
g
High Income 43.9 gr/cap/day
Middle Income 31.7 gr/cap/day
Low Income 26 8 gr/cap/day
epar
tmen
nta
l Eng
ine Low Income 26.8 gr/cap/day
Environmental Standard Development Project‐Ministry of Public Work RI
BOD
nee
rin
g D
nvir
onm
enB
andu
ng
Strong 400 ppm
Medium 220 ppm
Weak 110 ppm
enta
l Eng
iC
ivil
& E
nek
nolo
gi B Weak 110 ppm
Metcalf, 1991 ( USA ) TSS 60 – 115
gr/cap/day
Envi
ronm
eFa
cult
y of
In
stit
ut
Te WPCF, 1959 ( USA ) TSS 90 gr/cap/day
Randal, 1980 TSS 36 gr/cap/day
E F I
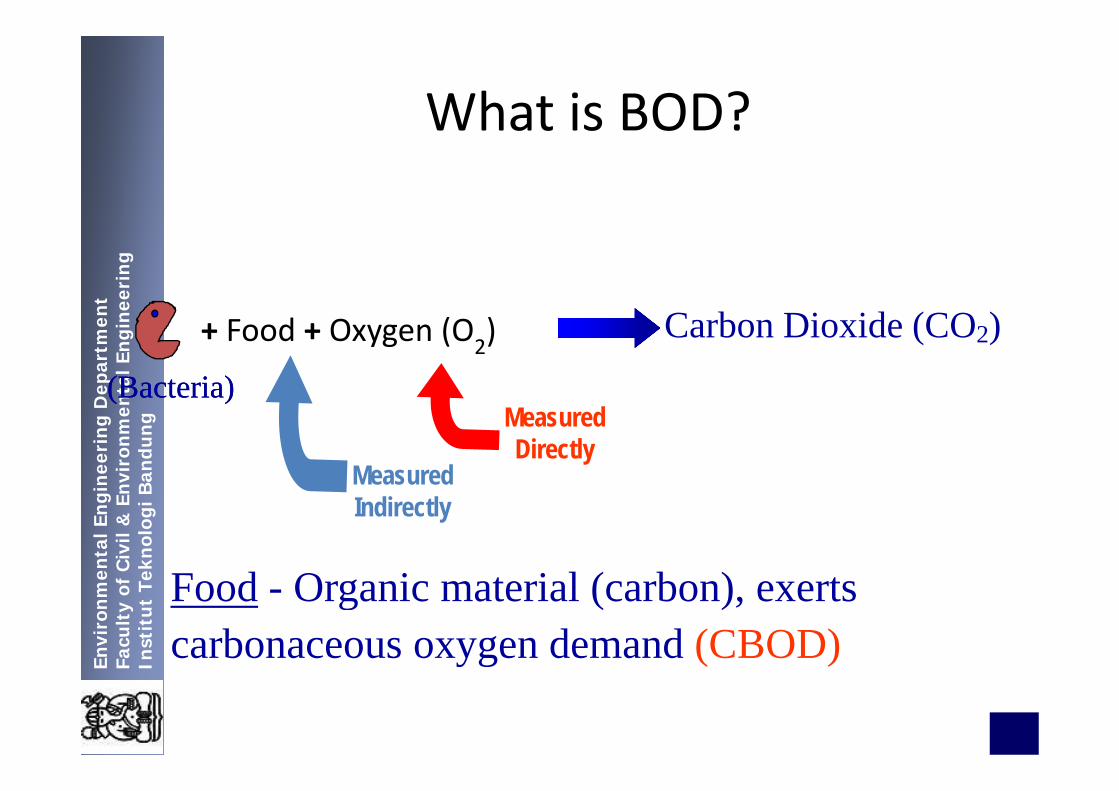
What is BOD?What is BOD?n
t eeri
ng
epar
tmen
nta
l Eng
ine
+ Food + Oxygen (O2) Carbon Dioxide (CO2)(Bacteria)(Bacteria)
nee
rin
g D
nvir
onm
enB
andu
ng
(Bacteria)(Bacteria)Measured Directly
Measured
enta
l Eng
iC
ivil
& E
nek
nolo
gi B Indirectly
F d O i i l ( b )
Envi
ronm
eFa
cult
y of
In
stit
ut
Te Food - Organic material (carbon), exerts carbonaceous oxygen demand (CBOD)E F I yg ( )

Sanitation‐2• Solid Waste handling: separation, storage, in‐site processing, collection,
transfer & transport, processing & transformation and disposal
l d d k / d d
nt ee
rin
g
• Solid waste generation was around 0.8 kg/capita in 1995 and increased to 1.0 kg/capita. It is expected to be 2.1 kg/capita in 2020. In Surabaya, waste generation reached 6000 m3/day in 2005. The rate of solid
epar
tmen
nta
l Eng
ine
waste generation is 2‐4%/year
• Only 18% of domestic solid waste was transported and handled by solid waste system whereas around 8% disposed to river and almost
nee
rin
g D
nvir
onm
enB
andu
ng
solid waste system , whereas around 8% disposed to river and almost 50% burned the solid waste (BPS, 2004)
• More than 15% of solid waste were 3R
enta
l Eng
iC
ivil
& E
nek
nolo
gi B
Envi
ronm
eFa
cult
y of
In
stit
ut
Te
E F I
18

Solid Waste Composition (%)
C d Si k k d
nt ee
rin
g
Component London Singapore Hongkong Jakarta Bandung
Organic 28 4.6 9.4 74 73.4
Papers 37 43 1 32 5 8 9 7
epar
tmen
nta
l Eng
ine Papers 37 43.1 32.5 8 9.7
Metals 9 3.0 2.2 2 0.5
Glass 9 1.3 9.7 2 0.4
nee
rin
g D
nvir
onm
enB
andu
ng Textiles 3 9.3 9.6 Nd 1.3
Plastics 3 6.1 6.2 6 8.6
enta
l Eng
iC
ivil
& E
nek
nolo
gi B Dust, etc 11 32.6 29.4 8 6.1
Envi
ronm
eFa
cult
y of
In
stit
ut
Te
Solid Waste Generation in Indonesia: 2.5 – 3.5 L/cap/day
E F I
19

nt ee
rin
g ep
artm
enn
tal E
ngin
en
eeri
ng
Dnv
iron
men
Ban
dung
enta
l Eng
iC
ivil
& E
nek
nolo
gi B
Envi
ronm
eFa
cult
y of
In
stit
ut
Te
E F I
20
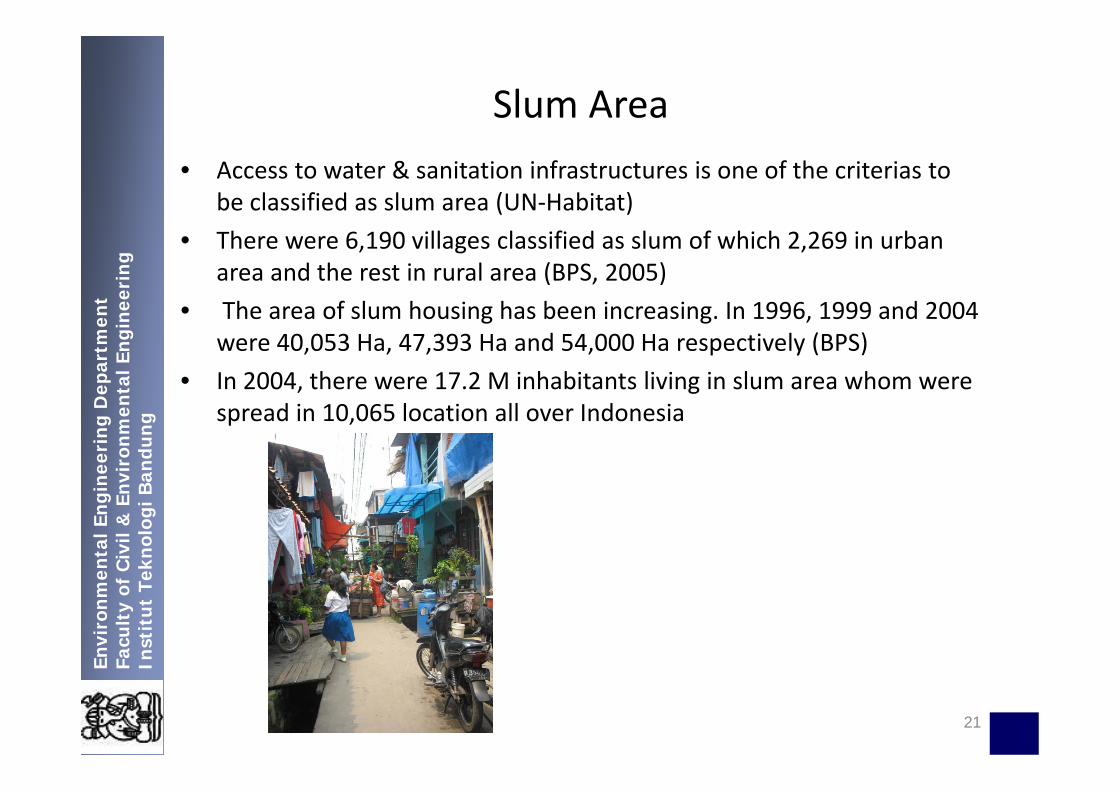
Slum Area• Access to water & sanitation infrastructures is one of the criterias to
be classified as slum area (UN‐Habitat)
nt ee
rin
g
• There were 6,190 villages classified as slum of which 2,269 in urban area and the rest in rural area (BPS, 2005)
Th f l h i h b i i I 1996 1999 d 2004
epar
tmen
nta
l Eng
ine • The area of slum housing has been increasing. In 1996, 1999 and 2004
were 40,053 Ha, 47,393 Ha and 54,000 Ha respectively (BPS)
• In 2004, there were 17.2 M inhabitants living in slum area whom were
nee
rin
g D
nvir
onm
enB
andu
ng
spread in 10,065 location all over Indonesia
enta
l Eng
iC
ivil
& E
nek
nolo
gi B
Envi
ronm
eFa
cult
y of
In
stit
ut
Te
E F I
21

So, the main issues (Bapenas):
• Water and Wastewater:– No significant acceleration on water supply coverage
nt ee
rin
g
No significant acceleration on water supply coverage– Water losses was remained very high: around 30‐40%– Improper wastewater handling: river is treated as a huge sewerage system– Sewerage system coverage is decreasing: less than 1% in metropolitan city
epar
tmen
nta
l Eng
ine g y g g p y
like Jakarta (however, this figure might increase since Denpasar Sewerage System officialy opened in February 2009 in cooperation with JICA)
– More than 80% of groundwater in urban area has been contaminated by E coli as a result 50 out of 1000 baby born are died due to diarhea
nee
rin
g D
nvir
onm
enB
andu
ng
coli as a result 50 out of 1000 baby born are died due to diarhea• Drainage & Solid Waste:
‐ No acceleration in solid waste and environmental friendly drainage management
enta
l Eng
iC
ivil
& E
nek
nolo
gi B
g‐ Environmental deteoriration accelerated due to solid waste improper
handling : in urban area in 2001 41% of solid waste was burned and disposed to river, whereas in 2004 reached up to 44%Fi l di l f lid t h t d t b d i t
Envi
ronm
eFa
cult
y of
In
stit
ut
Te ‐ Final disposal of solid waste has turned to be open dumping system, instead of sanitary or control landfill
‐ Mal‐function of drainage system due to community behaviour to dispose solid waste to drainage system E F I p g y
22

What’s next?• It is clear that Central Goverment Involvement is a must:
– Human Development Index 41 out of 102 (UNDP, 2004)
nt ee
rin
g
– To achieve MDG’s target required investement of about Rp. 50 T (Bapenas, 2003)
– In the last 30 years, central goverment invesment on Sanitation was only
epar
tmen
nta
l Eng
ine y , g y
USD820 M or about Rp 200/cap/year. The ideal is Rp. 47000/cap/year (Dept PU)
– Ideal investment on sanitation is expected to increase the productive time
nee
rin
g D
nvir
onm
enB
andu
ng
Ideal investment on sanitation is expected to increase the productive time up to 79%, saving cost for health of about 19% and most importantly may save 15 babies out of 50 those who died due to diarhea (The State of Sanitation in Indonesia)
enta
l Eng
iC
ivil
& E
nek
nolo
gi B
)
• Capacity building to create engineers on water and sanitation infrastructures must involve education institution. The interest of student on learning this field is decreasing significantly
Envi
ronm
eFa
cult
y of
In
stit
ut
Te student on learning this field is decreasing significantly.
• Socialization on the important of avoiding water borne diseases like diarhea and cholerra should be carried out by all stakeholdersE F I
23
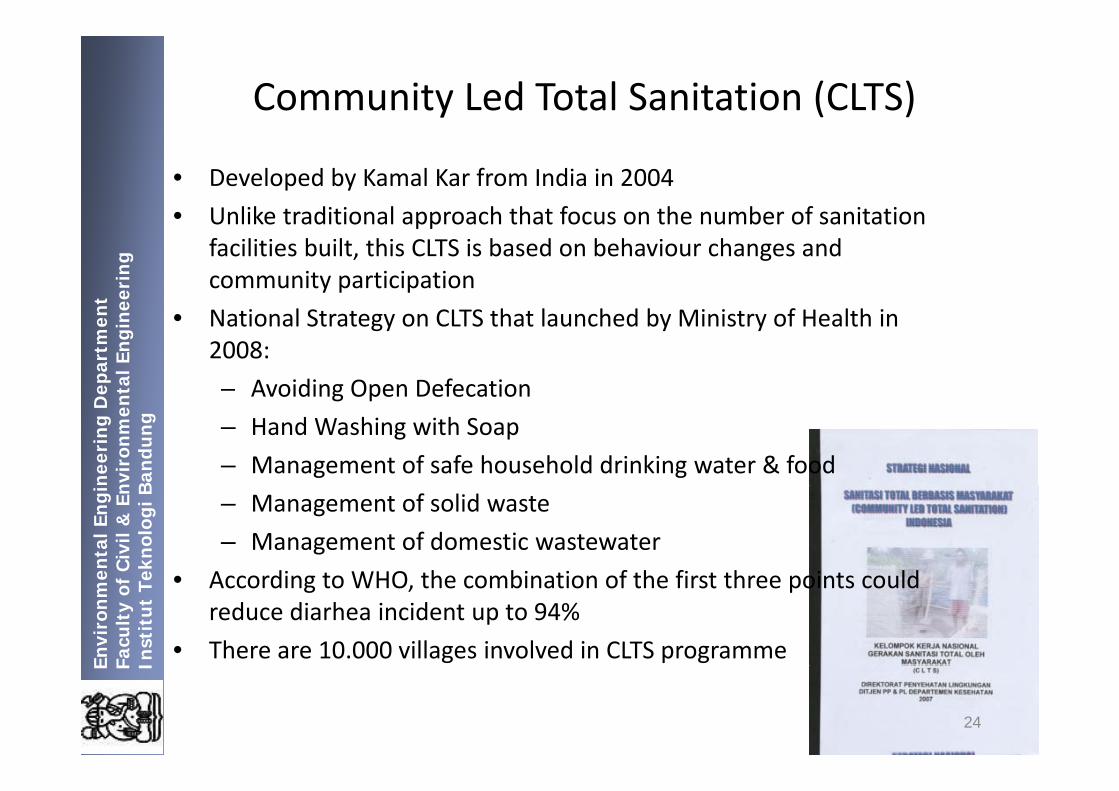
Community Led Total Sanitation (CLTS)
• Developed by Kamal Kar from India in 2004
• Unlike traditional approach that focus on the number of sanitation
nt ee
rin
g
• Unlike traditional approach that focus on the number of sanitation facilities built, this CLTS is based on behaviour changes and community participation
epar
tmen
nta
l Eng
ine • National Strategy on CLTS that launched by Ministry of Health in
2008:
– Avoiding Open Defecation
nee
rin
g D
nvir
onm
enB
andu
ng
Avoiding Open Defecation
– Hand Washing with Soap
– Management of safe household drinking water & food
enta
l Eng
iC
ivil
& E
nek
nolo
gi B – Management of solid waste
– Management of domestic wastewater
A di t WHO th bi ti f th fi t th i t ld
Envi
ronm
eFa
cult
y of
In
stit
ut
Te • According to WHO, the combination of the first three points could reduce diarhea incident up to 94%
• There are 10.000 villages involved in CLTS programmeE F I
24

nt ee
rin
g ep
artm
enn
tal E
ngin
en
eeri
ng
Dnv
iron
men
Ban
dung
enta
l Eng
iC
ivil
& E
nek
nolo
gi B
Envi
ronm
eFa
cult
y of
In
stit
ut
Te
E F I
25

nt ee
rin
g
Thank You
epar
tmen
nta
l Eng
ine Thank You
nee
rin
g D
nvir
onm
enB
andu
ng
enta
l Eng
iC
ivil
& E
nek
nolo
gi B
Envi
ronm
eFa
cult
y of
In
stit
ut
Te
E F I
26