Embed Size (px)
Citation preview

K38b: Current Climate Change - Ice
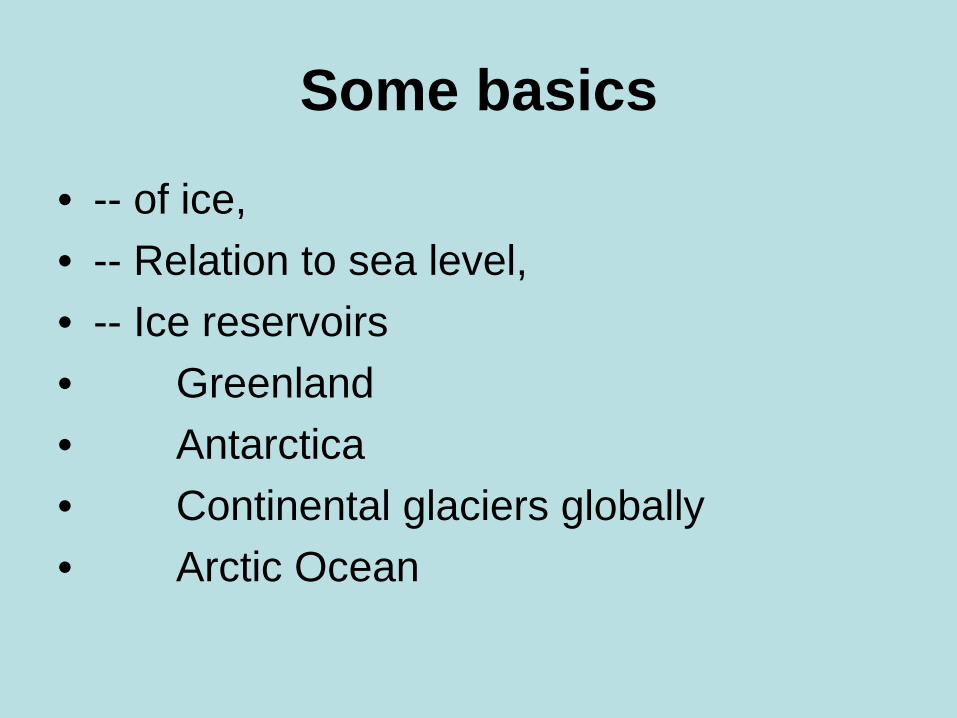
Some basics
• -- of ice, • -- Relation to sea level, • -- Ice reservoirs • Greenland • Antarctica • Continental glaciers globally • Arctic Ocean
An Important Point
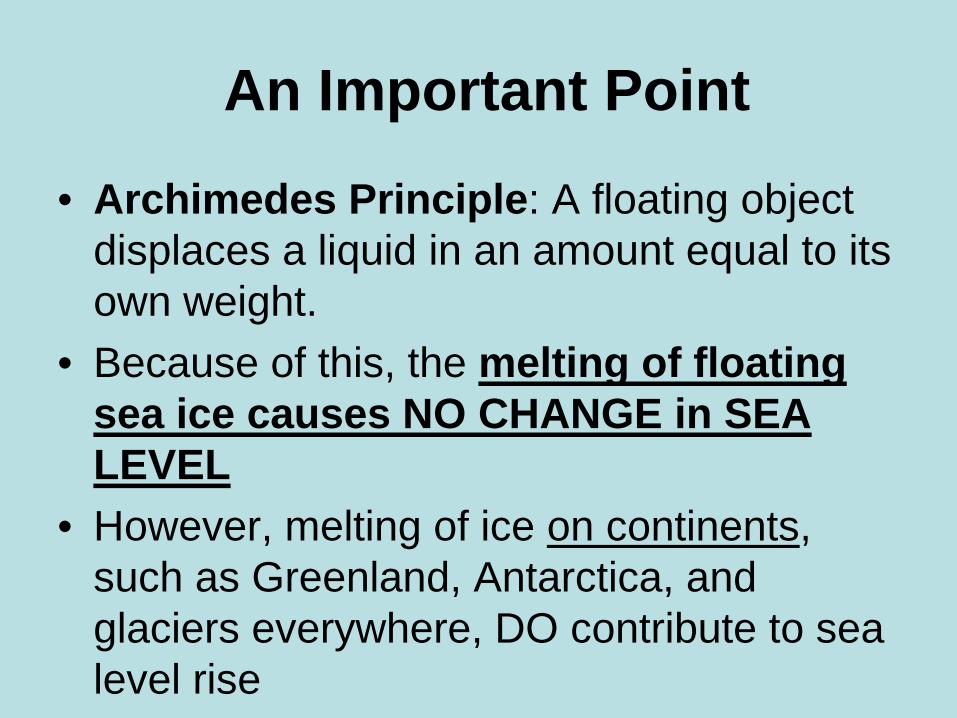
• Archimedes Principle: A floating object displaces a liquid in an amount equal to its own weight.
• Because of this, the melting of floating sea ice causes NO CHANGE in SEA LEVEL
• However, melting of ice on continents, such as Greenland, Antarctica, and glaciers everywhere, DO contribute to sea level rise

The Two Causes of Sea Level Rise
• 1. Thermal expansion. Warm water occupies slightly more volume. As the oceans warm, they fill more of the ocean basins. This contribution has been MOST of the existing total of all sea level rise over the past century
• 2. Continental ice melt: glaciers, Greenland and Antarctic ice caps melting. This has been relatively minor until recently now that global warming has accelerated. It now accounts for half of the total rise rate, and will dominate into the future

The Two Most Important Ice Reservoirs on Earth: #1
Antarctica, and #2 Greenland • Melting Greenland would add 23 ft to
global sea level • Melting only the low-land West Antarctic
Ice Sheet which is anchored by grounding against the bottom currently, would add 18 ft to global sea level.
• Melting ALL of Antarctica would add an additional 201 ft to global sea level.

How Does Greenland Lose Ice?
• There are two main contributions to loss of continental ice:
• 1. Glaciers calving into the ocean • 2. Air temperatures melting surface ice,
and meltwater finds its way to the ocean.

1. Glacial Calving into the Ocean • In this case, ice remains ice until it becomes
icebergs which then melt in the ocean • Greenland topography is unusual: The
mountains of Greenland are along the coastlines, so that the interior is a huge basin.
• So, ice must pass through mountain passes to get to the sea.
• As the elevation of the ice drops, the amount of ice which can clear the passes will drop. Ice in glacier form will eventually only be able to get to the ocean by the relatively fewer areas which are fjords or lowland paths from the interior.
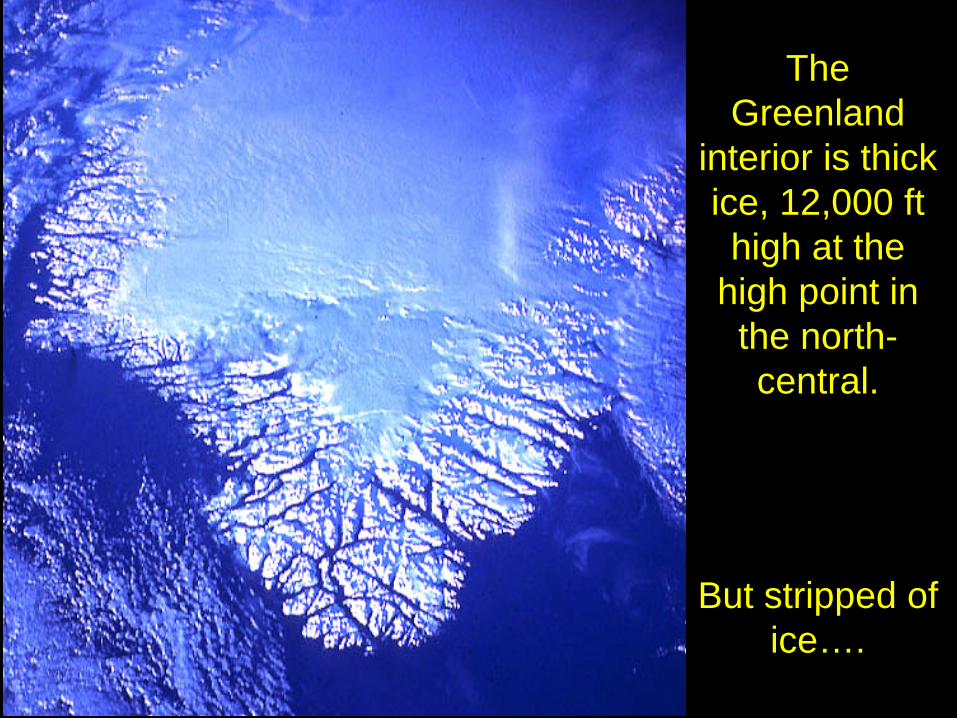
The Greenland
interior is thick ice, 12,000 ft high at the
high point in the north-central.
But stripped of ice….
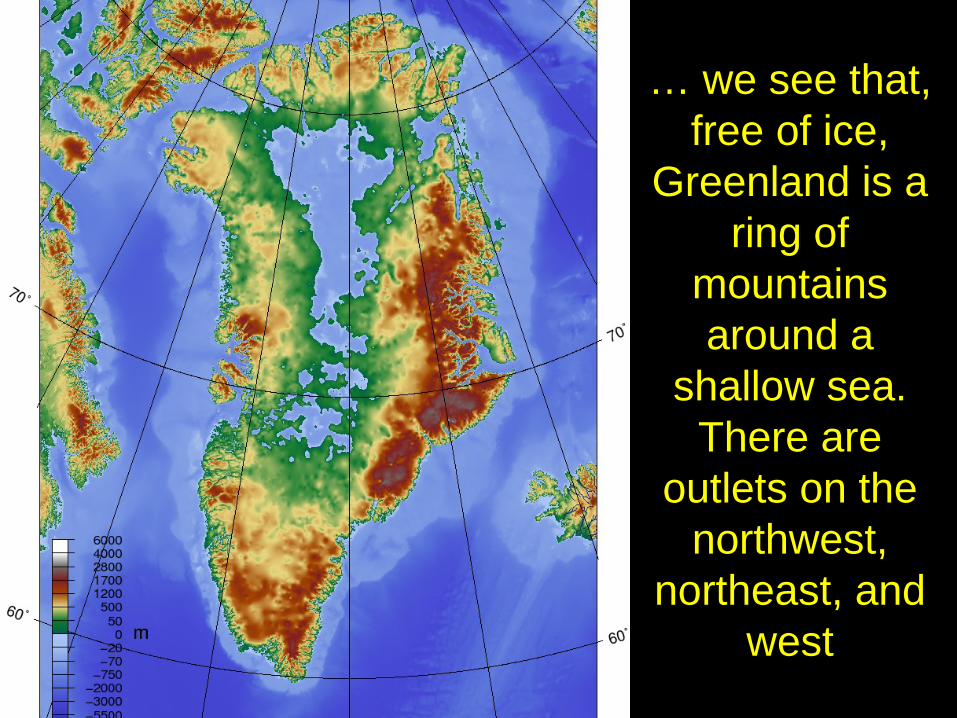
… we see that, free of ice,
Greenland is a ring of
mountains around a
shallow sea. There are
outlets on the northwest,
northeast, and west
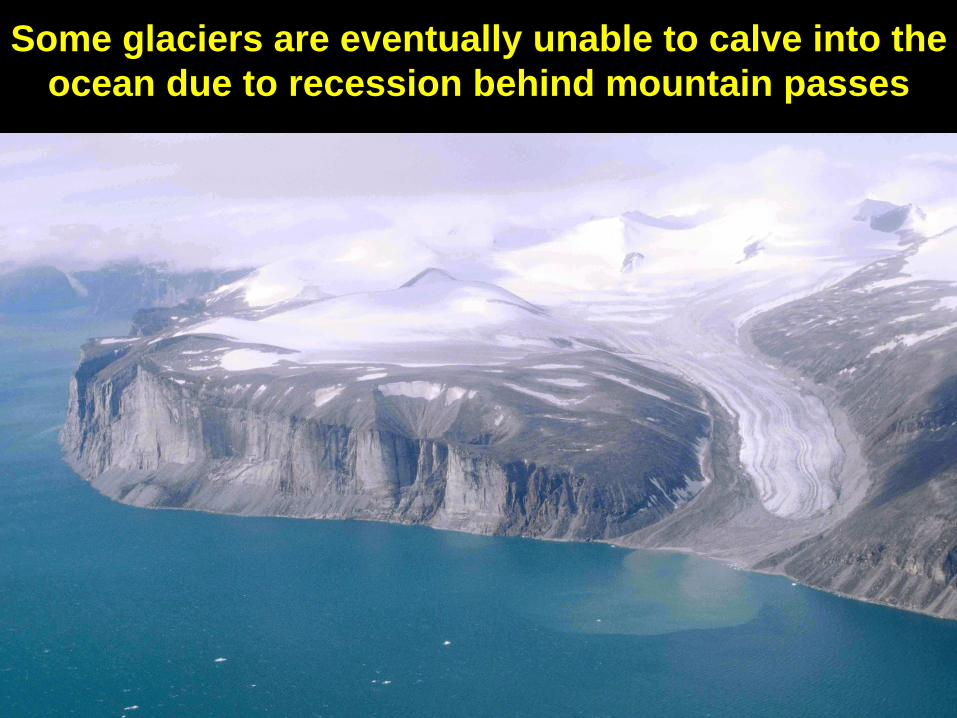
Some glaciers are eventually unable to calve into the ocean due to recession behind mountain passes

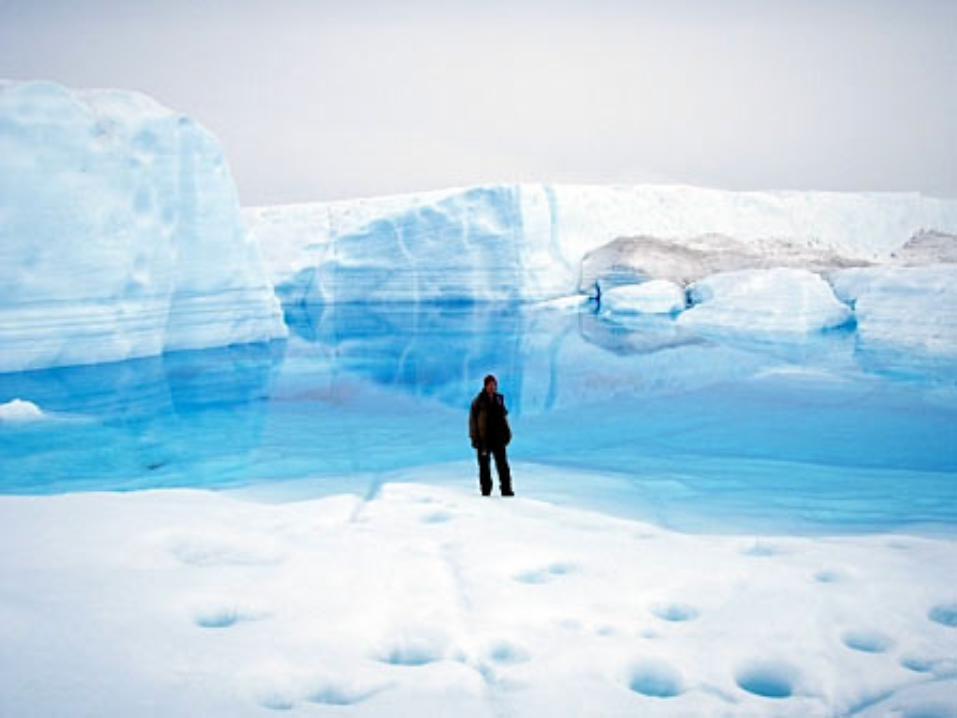
2. Melt from the Surface and Effects on Ice
• It’s not as simple as thinking of a huge ice cube melting on a hot day, as older, simple IPCC models had assumed.
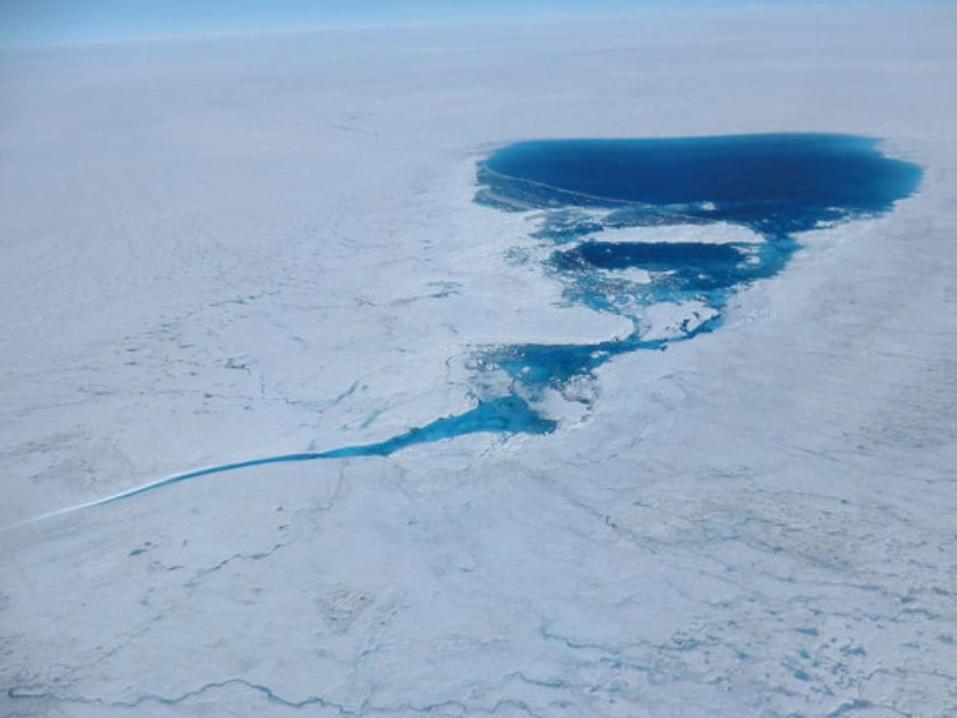
• Instead, water melts on the surface, pools, and the water (being warmer and denser than ice) drives cracks into the ice, sending the water down moulins to the base of the Greenland glaciers
• This lubricates the base, softening it by raising its temperature, and accelerating glaciers sliding towards the ocean.
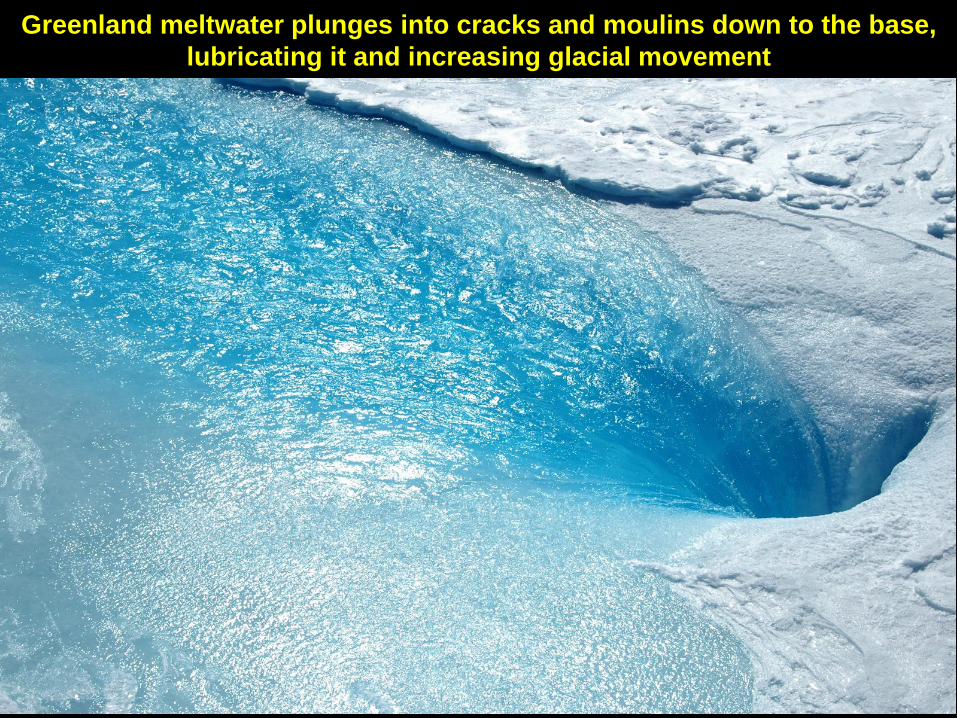
Greenland meltwater plunges into cracks and moulins down to the base, lubricating it and increasing glacial movement
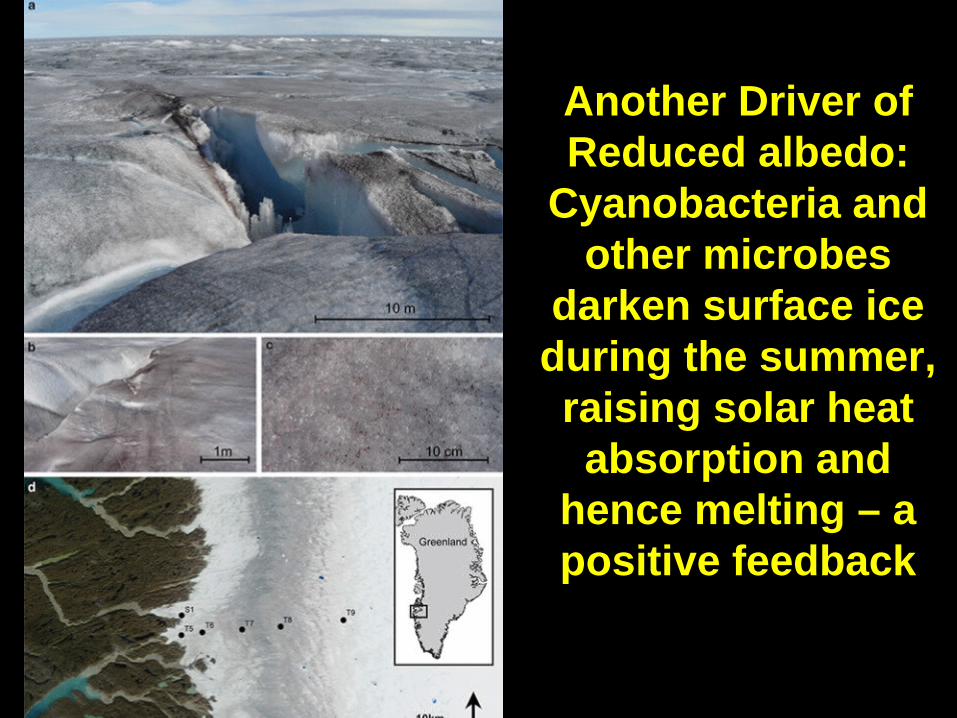
Another Driver of Reduced albedo:
Cyanobacteria and other microbes
darken surface ice during the summer, raising solar heat absorption and
hence melting – a positive feedback

Where darkest and densest, they absorb sunlight efficiently and melt holes
downward into the surrounding snow

“With longer melting seasons over the past few years, the algae have more time to bloom
and darken the sheet” Tranter et al. 2016)
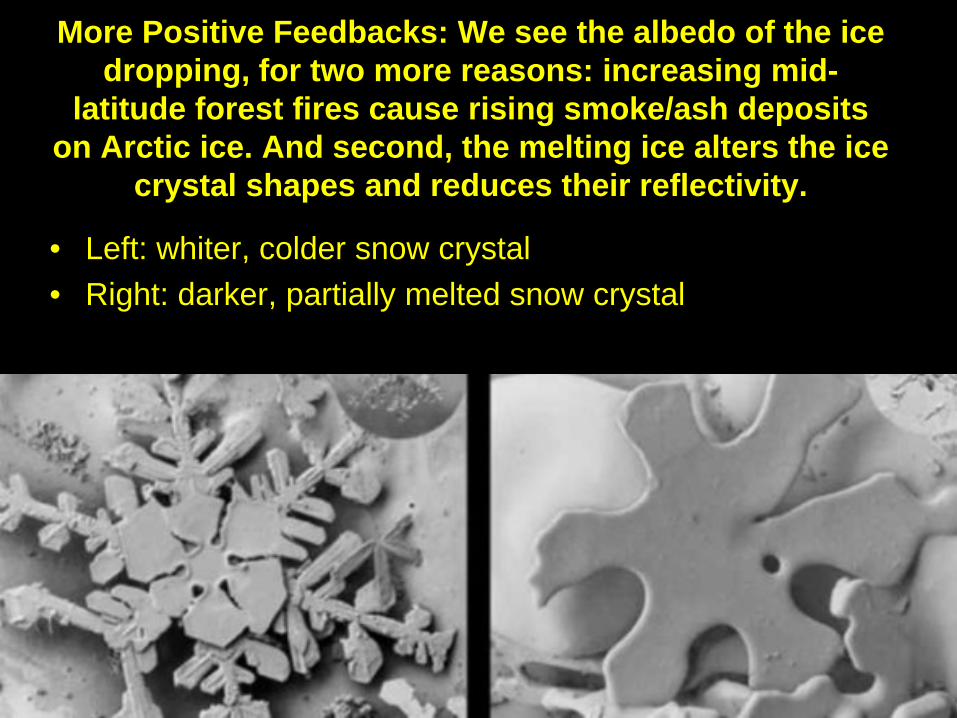
More Positive Feedbacks: We see the albedo of the ice dropping, for two more reasons: increasing mid-
latitude forest fires cause rising smoke/ash deposits on Arctic ice. And second, the melting ice alters the ice
crystal shapes and reduces their reflectivity.
• Left: whiter, colder snow crystal • Right: darker, partially melted snow crystal

Greenland Ice Reflectivity. Getting Darker, Absorbing More Solar Heat. 2012 was a Record Melt Year.

Also: Darkening from ash from increasing wild fires in the Boreal
Forests
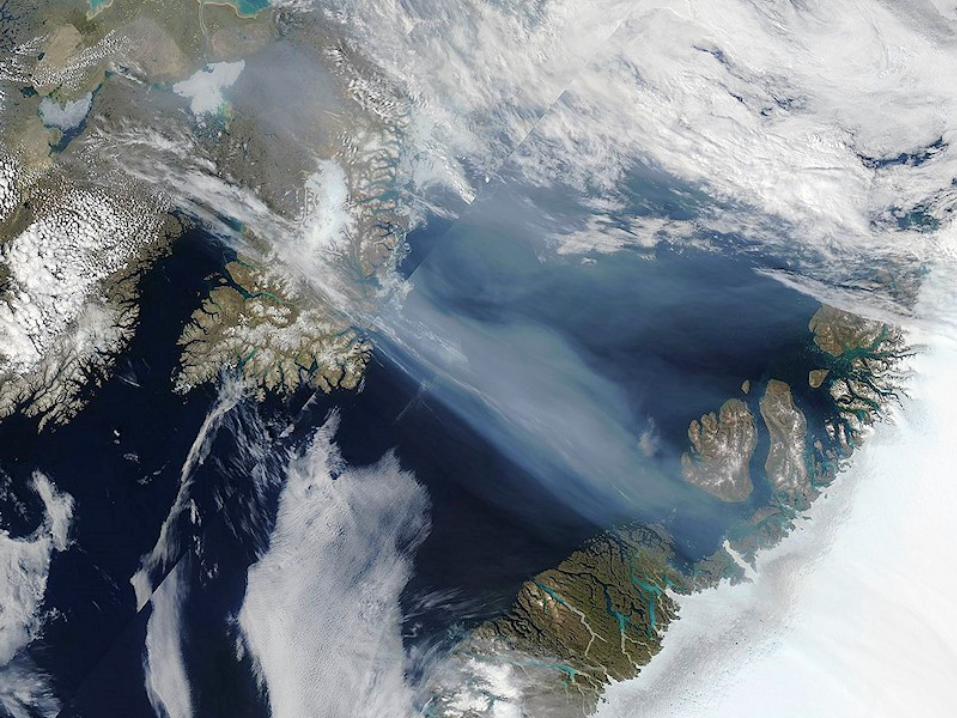

Greenland from the air.
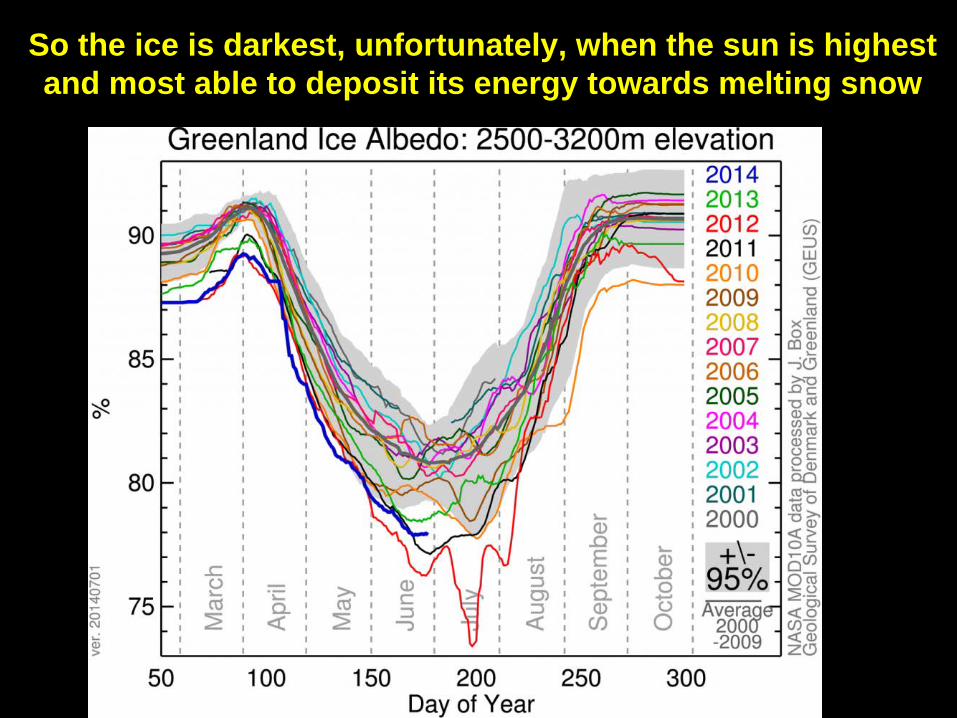
So the ice is darkest, unfortunately, when the sun is highest and most able to deposit its energy towards melting snow

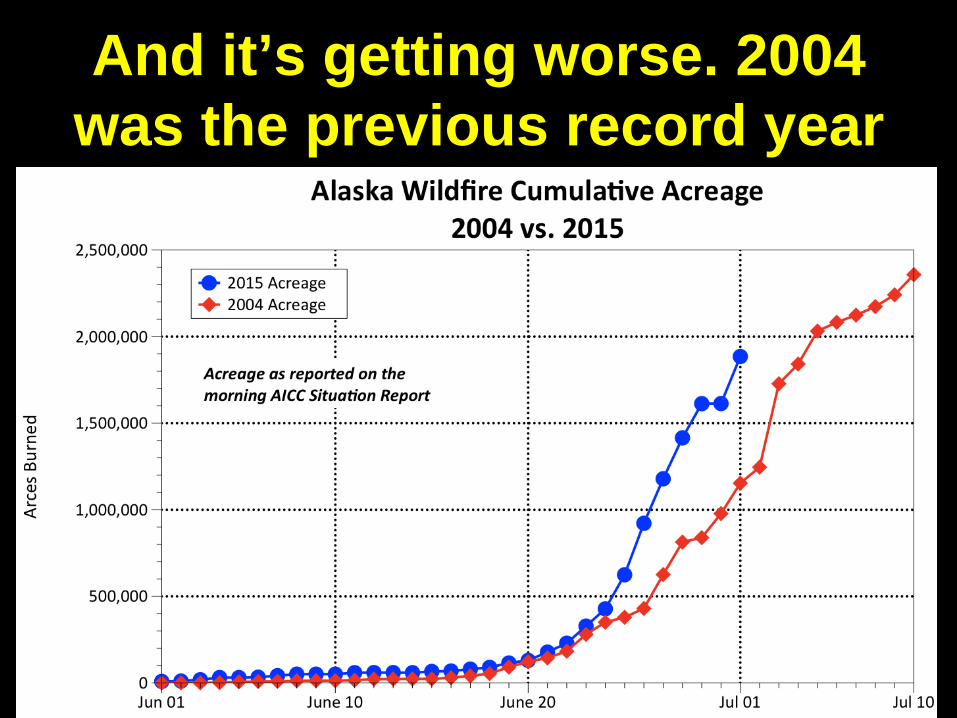
And it’s getting worse. 2004 was the previous record year

Even the Tundra is burning

More Amplifying Feedbacks not in Current Climate Models
(Box 2016)… • 1. Small, medium, and large size crevasses
open and deepen during melt, they trap more sunlight, which further reduces reflectivity and amplifies melt and crevasse depth
• 2. Warm ocean water is forced downward at glacier terminus faces by cold meltwater, hitting the base and cutting it back. This both weakens cliff face stability and also softens and speeds the frictional motion at that base
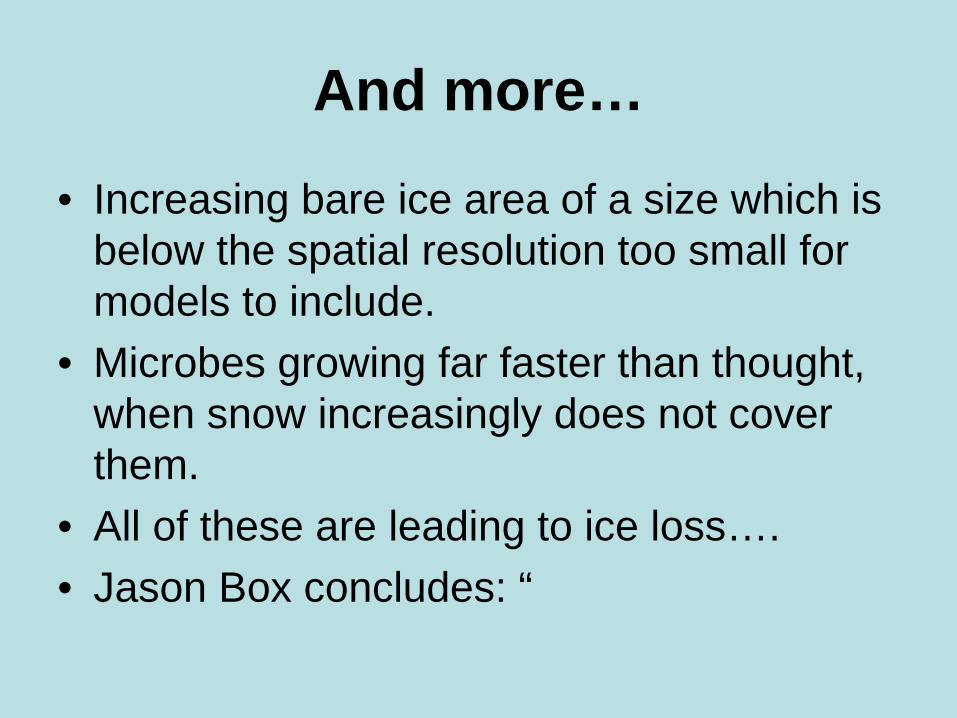
And more…
• Increasing bare ice area of a size which is below the spatial resolution too small for models to include.
• Microbes growing far faster than thought, when snow increasingly does not cover them.
• All of these are leading to ice loss…. • Jason Box concludes: “

Ice Loss – Faster Than we Thought • Thus, continental ice loss can be much more rapid and
dramatic than simple-minded ice cube melt calculations of years ago, and still promoted by many climate denialists as reason to do nothing.
• Be skeptical of simple calculations that assume the melt rate will be constant (leading to ~1000 year estimates before Greenland is totally ice free). More likely it’ll be much sooner.
• New research: CO2 now seen to act as a corrosive to ice, at the atomic level. It attacks the hydrogen bonds. Macro effects not well studied yet. But this may help explain why…
• …Paleo-climate data show equilibrium sea level rises associated with the temperatures we will see in just a few decades, correspond to nearly ice-free Greenland and much of Antarctica when equilibrium is reached.

Zachariae Istrom Glacier holds or buttresses 5% of the Greenland Ice Cap, and has entered a new accelerated phase
of melt • 26 sec YouTube video of 4 years of
darkening, calving, and dissolution • Study author Eric Rignot: “Zachariæ Isstrøm is
being hit from above and below. The top of the glacier is melting away as a result of decades of steadily increasing air temperatures, while its underside is compromised by currents carrying warmer ocean water, and the glacier is now breaking away into bits and pieces and retreating into deeper ground.”

Greenland Ice Loss: Most in coasts and southern end. Slight ice gains at cold 12,000 ft summit of interior ice sheet. Net is
loss of 200 billion tons per year, rapidly accelerating an additional 8 billion tons per year, every additional year
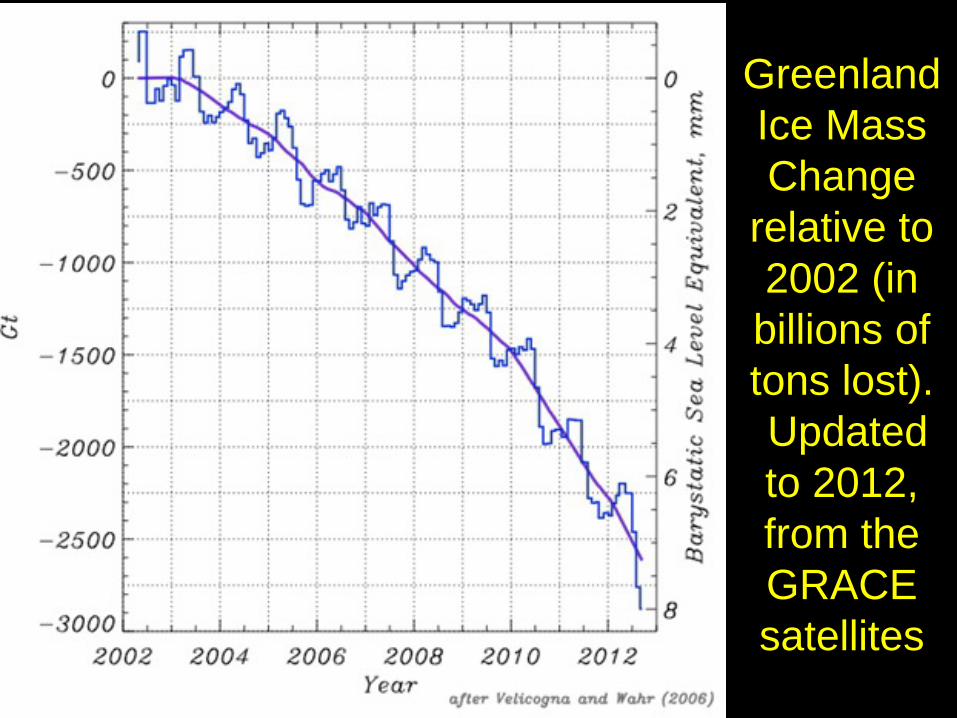
Greenland Ice Mass Change
relative to 2002 (in
billions of tons lost). Updated to 2012, from the GRACE satellites
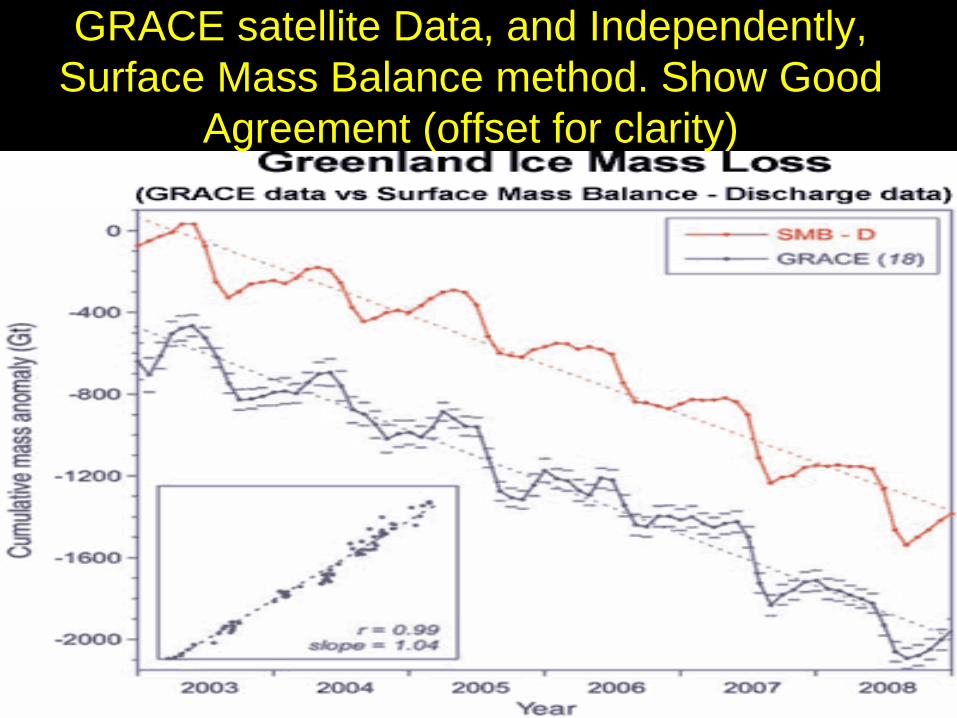
GRACE satellite Data, and Independently, Surface Mass Balance method. Show Good
Agreement (offset for clarity)

Greenland and Sea Level
• Greenland melt contributes to sea level rise. That rate is rising rapidly – the rate has doubled in just the last 10 years
• Greenland ice alone, melted, would raise global sea level by 23 feet.
• Yale Series on Climate Change “Greenland – A Ring of Mountains: How it Melts” (7 min)

How Long to Completely Lose all Greenland’s Ice?
• Let’s do the math… • Greenland has 2,850,000 cubic km of ice with a density of
0.92 g/cc giving 2.62 e18 kg of ice, or 2.89 e15 tons of ice • Loss rate of 200x109 tons/year, if kept constant would
imply a time scale of 15 thousand years. If the current acceleration rate of 8 billion tons/yr2 were maintained, all ice would be gone in 827 years.
• However, the paleo data show that the non-linearities in rate are substantial and the acceleration rate itself is likely to accelerate as feedbacks compound past tipping points.
• Hansen (2007) finds the paleo data provide no evidence to support the notion of time scales as long as millennia to de-ice Greenland, and ~centuries is more realistic.
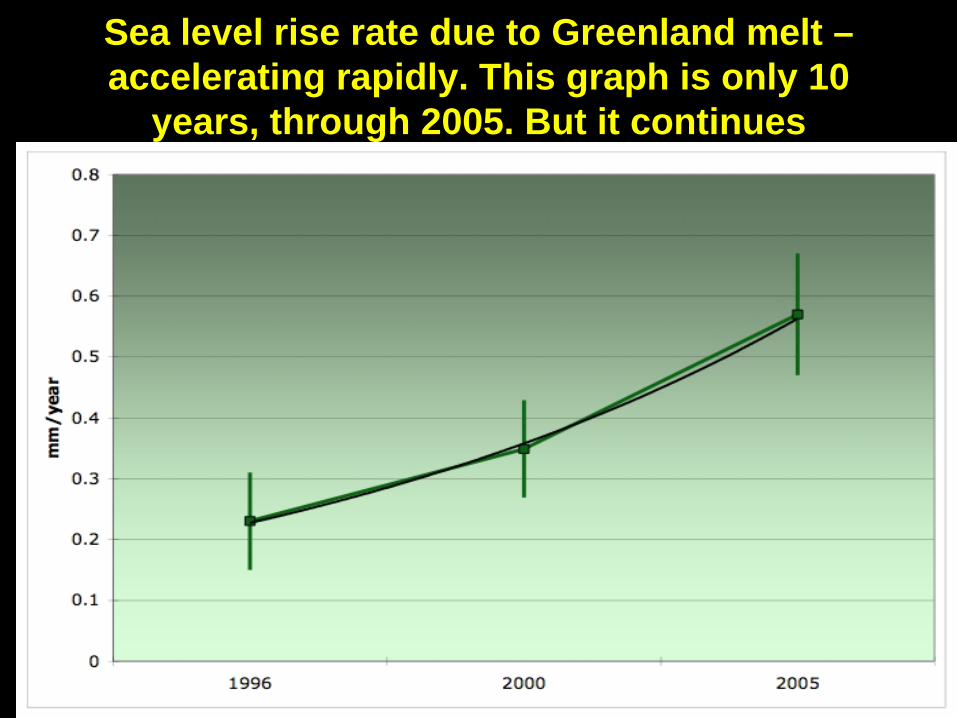
Sea level rise rate due to Greenland melt – accelerating rapidly. This graph is only 10
years, through 2005. But it continues

What About Antarctica?
• Climate denialists will claim that Antarctica is gaining ice, pointing to sea ice, offsetting the Arctic losses.
• While sea ice IS increasing (slightly), the total continent of ice is not. The claim …
• It’s false • Let’s look at the data…

Surface Air Temps show Strong Warming Rate. How Does this Affect Sea Ice? Very different than in the Arctic

How Can Sea Ice Grow if The Ocean Water in General is Warmer?
• Because both salinity and temperature affect water density, and salinity is the stronger effect, so that the glacial meltwaters, though colder, are much less saline and therefore float. In the winter, when air temps are low, this enables some (weak) growth in thin surface ice.
• Before you let out a cheer…

Antarctic Sea Ice increasing? Yes, slightly (left scale), at the height of winter (September)… When there is virtually no
sunlight to reflect anyway, therefore no influence on climate
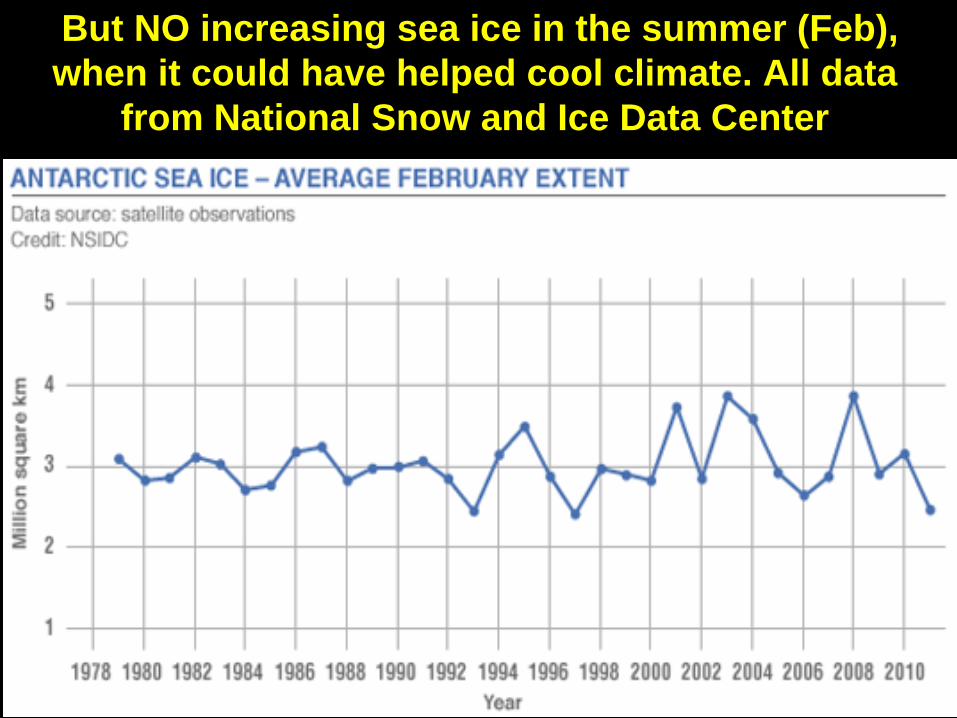
But NO increasing sea ice in the summer (Feb), when it could have helped cool climate. All data
from National Snow and Ice Data Center
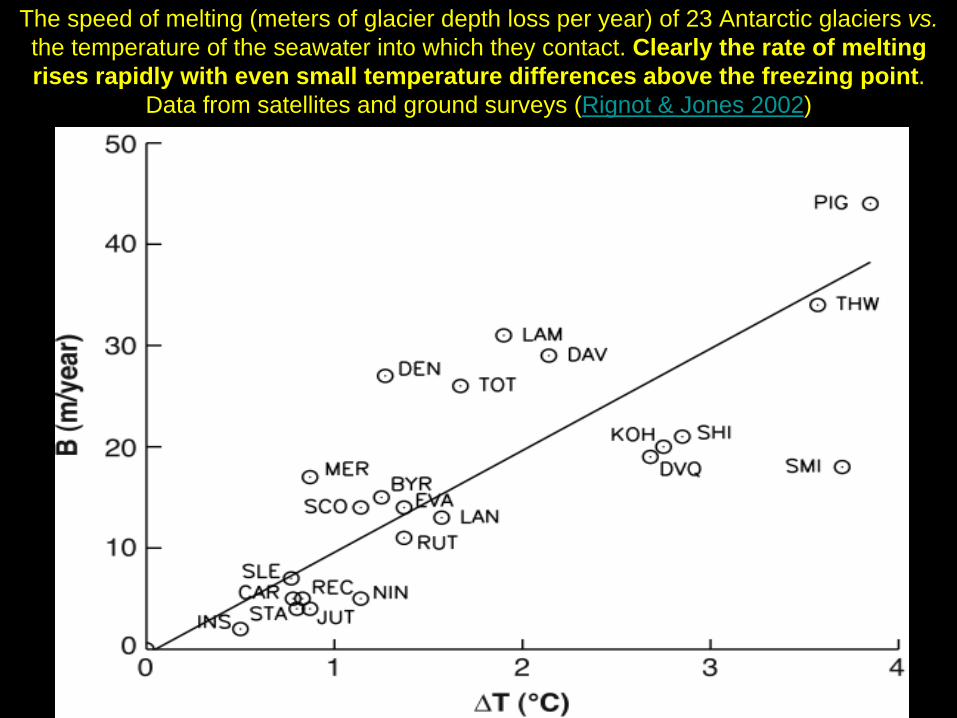
The speed of melting (meters of glacier depth loss per year) of 23 Antarctic glaciers vs. the temperature of the seawater into which they contact. Clearly the rate of melting rises rapidly with even small temperature differences above the freezing point.
Data from satellites and ground surveys (Rignot & Jones 2002)
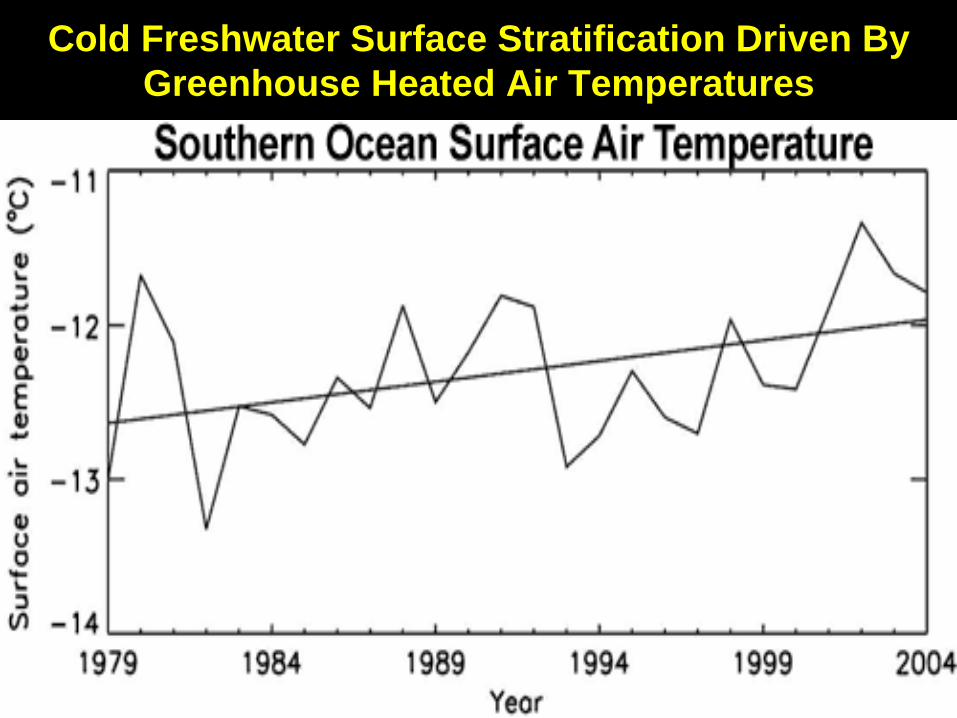
Cold Freshwater Surface Stratification Driven By Greenhouse Heated Air Temperatures

• 1. The Antarctic sea ice growth is weak and only in winter, when there is no sun and so there’s no ability for the whiteness to reflect sunlight and help cool the planet. Not significant for climate.
• 2. Far more important is the fact that the more saline WARM water is therefore beneath this cold layer, and is melting West Antarctica and Totten Glacier from the underside (3 min NASA video). Ice Shelf melt is driven mostly by heated ocean water from underneath.
• This has now melted the last anchor between the critical subsurface grounding ridge and the West Antarctic Ice Sheet, dooming the entire ice sheet to irreversible melt
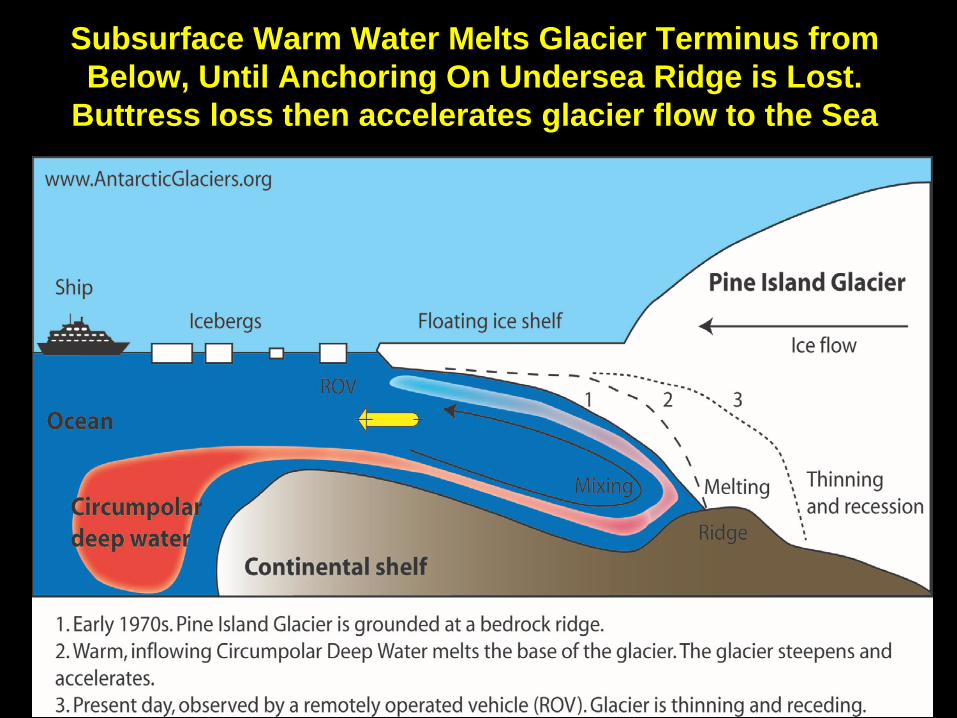
Subsurface Warm Water Melts Glacier Terminus from Below, Until Anchoring On Undersea Ridge is Lost.
Buttress loss then accelerates glacier flow to the Sea
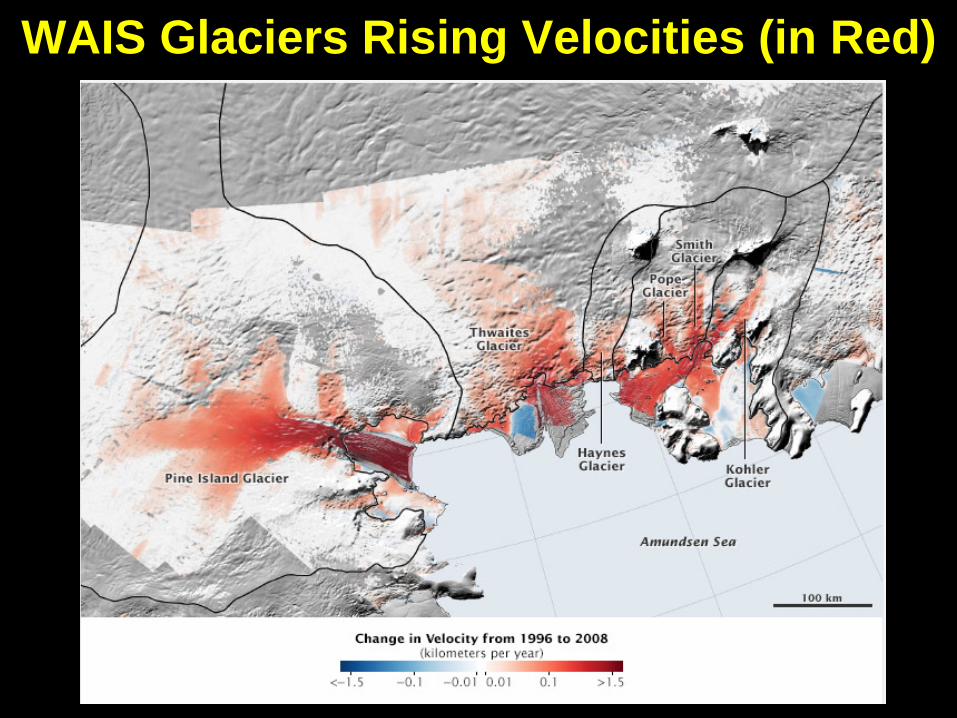
WAIS Glaciers Rising Velocities (in Red)

Including hydrofracturing of buttressing ice shelves and structural collapse of floating ice cliffs accelerates Antarctic melt substantially
• DeConto and Pollard (2016) show that including these previously un-modelled effects causes far more rapid ice sheet collapse, in agreement with the previously alarming but poorly understood “Meltwater Pulsa 1A and 2B” rising out of the last Ice Age.
• They find we’re on pace for Antarctica alone to contribute more than a meter of sea level rise before 2100, and 15 meters in the next few centuries
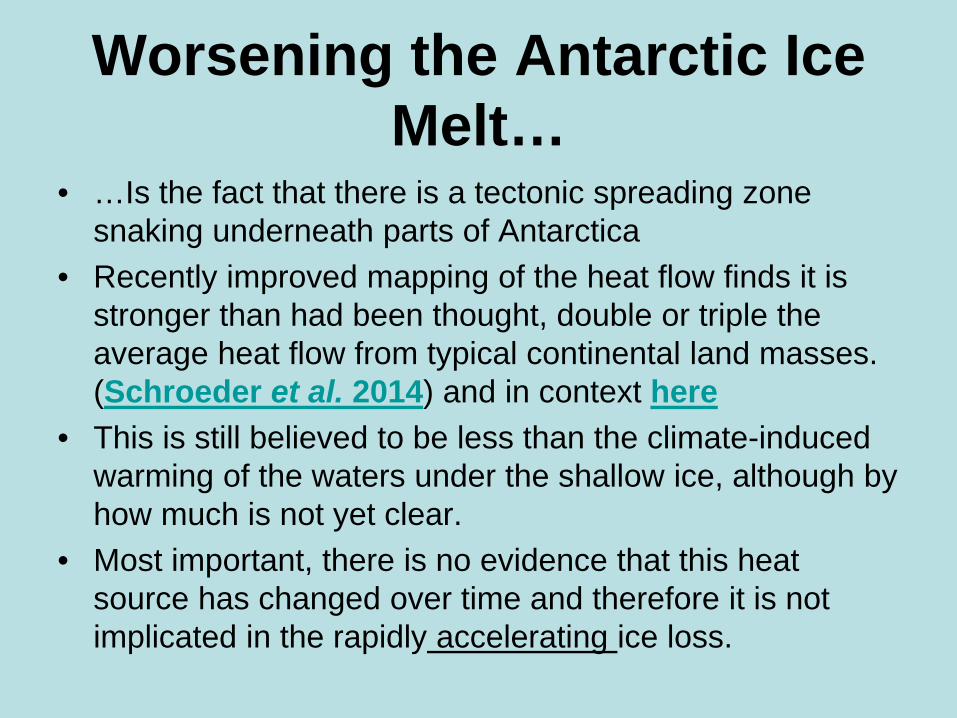
Worsening the Antarctic Ice Melt…
• …Is the fact that there is a tectonic spreading zone snaking underneath parts of Antarctica
• Recently improved mapping of the heat flow finds it is stronger than had been thought, double or triple the average heat flow from typical continental land masses. (Schroeder et al. 2014) and in context here
• This is still believed to be less than the climate-induced warming of the waters under the shallow ice, although by how much is not yet clear.
• Most important, there is no evidence that this heat source has changed over time and therefore it is not implicated in the rapidly accelerating ice loss.

This map shows the locations of geothermal
flow underneath Thwaites Glacier in West Antarctica that were identified with airborne ice-penetrating radar. The dark magenta
triangles show where geothermal flow exceeds 150 milliwatts per square
meter, and the light magenta triangles show where flow exceeds 200
milliwatts per square meter. Letters C, D and E denote high melt areas: in the western-most tributary,
C; adjacent to the Crary mountains, D; and in the
upper portion of the central tributaries, E.
Credit: University of Texas Institute Geophysics

So, to Summarize Antarctic Sea Ice • The Southern Ocean consists of a layer of cold meltwater near the
surface and a much thicker layer of warmer water below. • Water from the warmer layer rises up to the surface, melting sea ice
from below. However, as air temperatures warm, the amount of rain and snowfall also increases. This freshens the surface waters, leading to a surface layer less dense than the saltier, warmer water below. The layers become more stratified and mix less. Less heat is transported upwards from the deeper, warmer layer.
• Hence less sea ice is melted (Zhang 2007). As global warming continues, at some point surface air temperatures will rise high enough for even the slight rise in winter sea ice to halt.
• But total Antarctic ice is vastly concentrated on the continent, and this is in accelerated decline… Let’s look at Antarctic Continent Ice now…
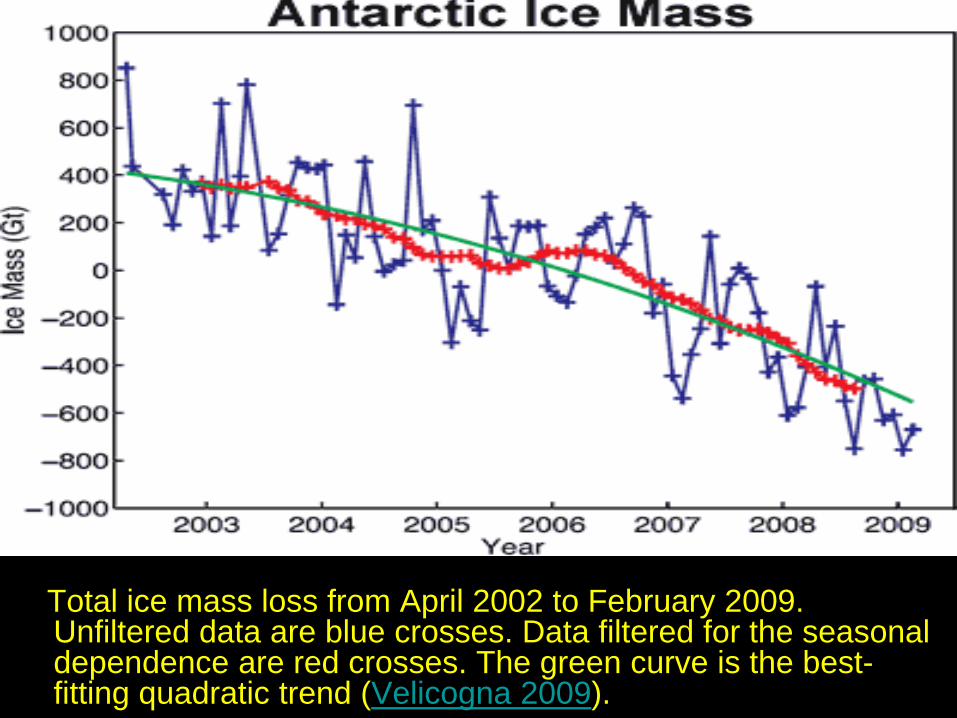
Total ice mass loss from April 2002 to February 2009. Unfiltered data are blue crosses. Data filtered for the seasonal dependence are red crosses. The green curve is the best-fitting quadratic trend (Velicogna 2009).
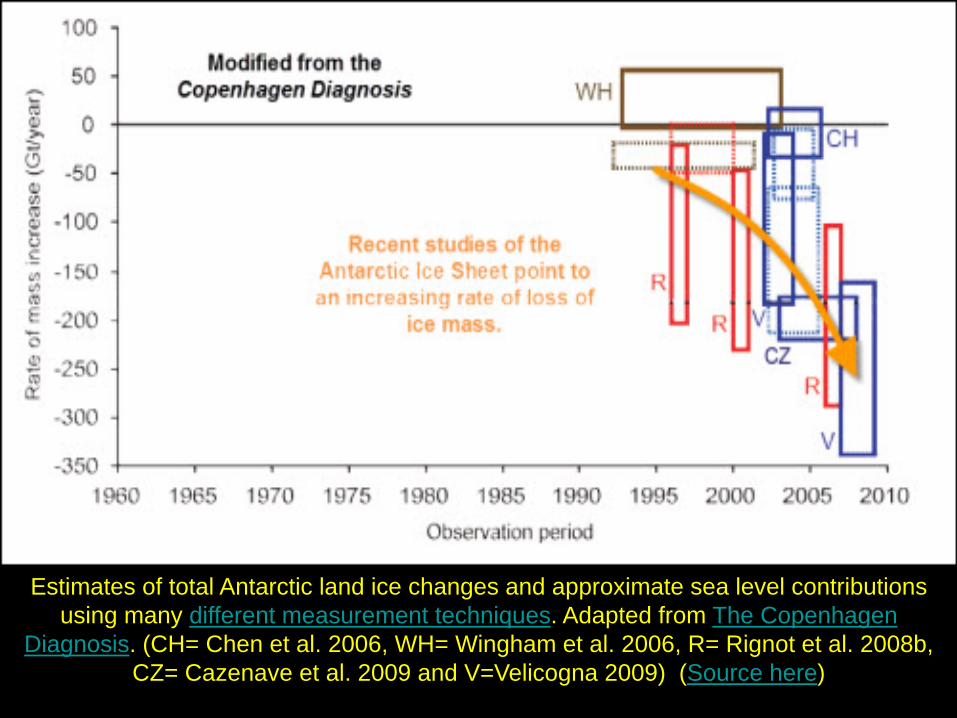
Estimates of total Antarctic land ice changes and approximate sea level contributions using many different measurement techniques. Adapted from The Copenhagen
Diagnosis. (CH= Chen et al. 2006, WH= Wingham et al. 2006, R= Rignot et al. 2008b, CZ= Cazenave et al. 2009 and V=Velicogna 2009) (Source here)
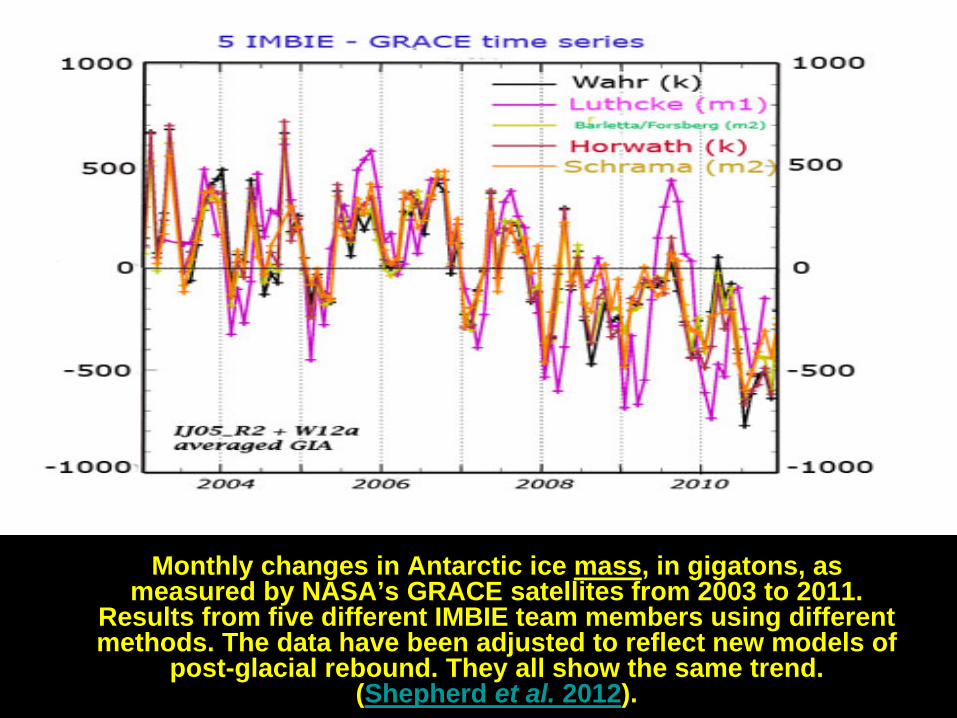
Monthly changes in Antarctic ice mass, in gigatons, as measured by NASA’s GRACE satellites from 2003 to 2011.
Results from five different IMBIE team members using different methods. The data have been adjusted to reflect new models of
post-glacial rebound. They all show the same trend. (Shepherd et al. 2012).

A NASA video showing where the Antarctic Ice is melting
from
• Antarctic Ice Loss 2004 to 2014, from the GRACE satellite (1min 34s)
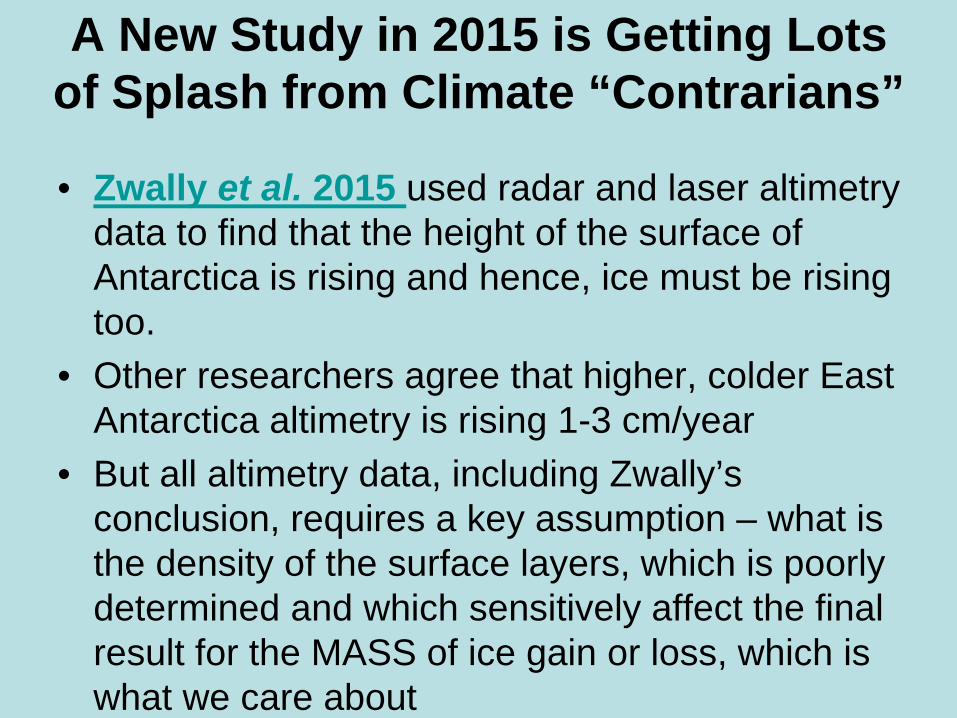
A New Study in 2015 is Getting Lots of Splash from Climate “Contrarians”
• Zwally et al. 2015 used radar and laser altimetry data to find that the height of the surface of Antarctica is rising and hence, ice must be rising too.
• Other researchers agree that higher, colder East Antarctica altimetry is rising 1-3 cm/year
• But all altimetry data, including Zwally’s conclusion, requires a key assumption – what is the density of the surface layers, which is poorly determined and which sensitively affect the final result for the MASS of ice gain or loss, which is what we care about

Alas, The Zwally 2015 study (brown boxes on top) sharply conflict with 13 other recent
studies
Is the Rising Altimetry due to new snow?
• The data says no, and in fact tend to indicate dropping snowfall rates. • Does it reflect ice from densification of earlier snow, as Zwally et al.
2015 assumes, and so has higher density? We don’t have good long term records of snowfall in East Antarctica, and this is crucial for assigning density to the altimetry.
• Even other altimetry studies find less than half the result of Zwally et al. (CryoSat 2)
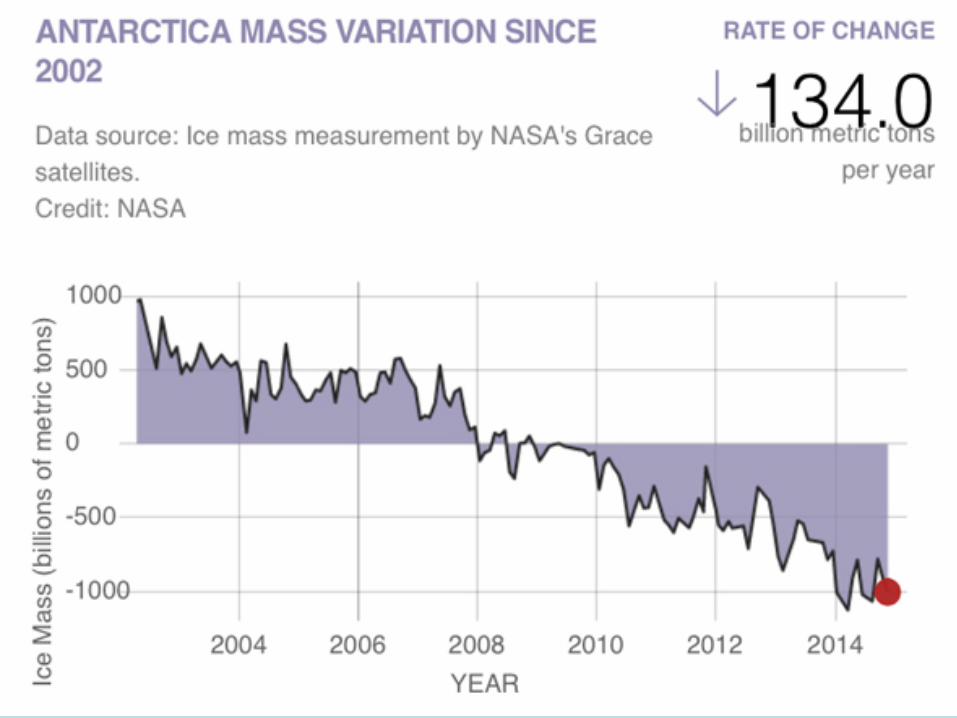
• However, we do have data on evolving total MASS, which is what we are really interested in, from the GRACE satellites. And GRACE data shows Antarctica is net losing ice mass at an accelerating rate. GRACE too depends on assumptions of the viscosity of the underlying mantle which are not as well known as we’d like.
• So the problem with giving credibility to the Zwally paper is that the crucial assumption of ice density is so poorly constrained by data.

But a key closure of the loop is this…
• – we do know the rate at which sea level is rising, and have good data on the temperature structure of the oceans for well over a decade from the Argo floats and if East Antarctica is gaining ice at the rate claimed by Zwally et al., it becomes very difficult to explain where the extra melt is coming from to match sea level rise, given the good data on other melt sources.
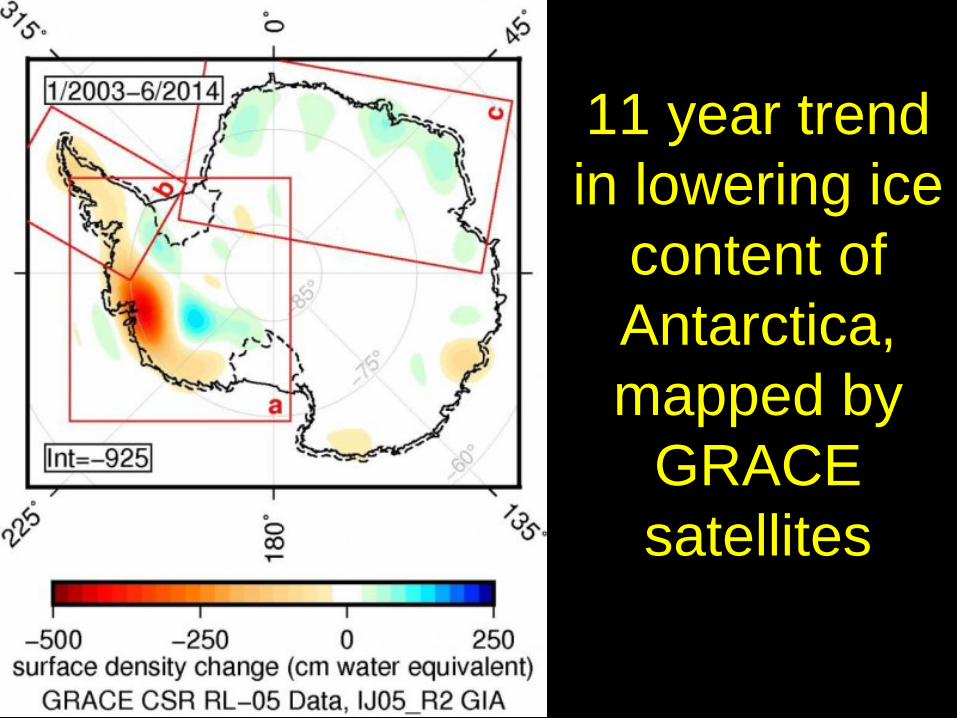
11 year trend in lowering ice
content of Antarctica, mapped by
GRACE satellites
Will Antarctic Ice Mass Continue to Decrease over Coming Decades?
• Yes. With the discovery of the ungrounding of the West Antarctic Ice Sheet, this seems unavoidable.
• However, there is a competing effect; central Antarctica is very high and very cold. It will not get above freezing there until global warming gets much more advanced.
• Meanwhile, humidity is increasing. This might possibly lead to more snowfall at the higher, colder elevations of Antarctica, at least for a while.
• We see no evidence of this yet, and Antarctic air is fairly well isolated from the rest of the world because the continent is centered on the pole, so the added snowfall effect may be minimal or non-existent
• Longer term (over the coming century and later), paleo sea level data indicates Antarctica will suffer major loss of ice
• It has already begun…

Antarctic Ice Shelves
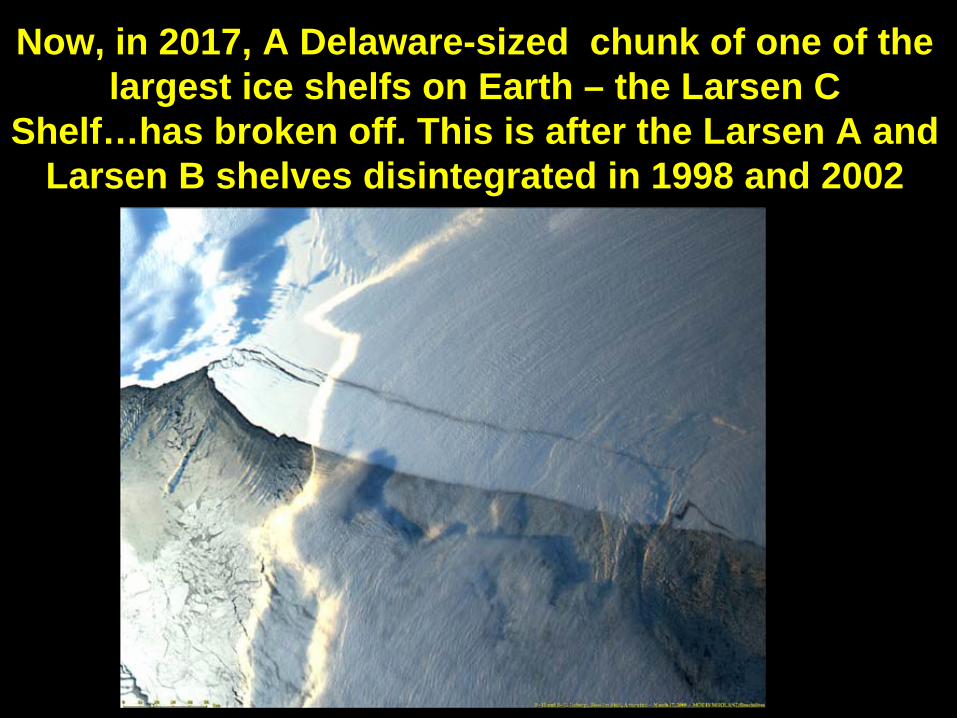
Now, in 2017, A Delaware-sized chunk of one of the largest ice shelfs on Earth – the Larsen C
Shelf…has broken off. This is after the Larsen A and Larsen B shelves disintegrated in 1998 and 2002

What about glaciers globally? Maybe it’s just Greenland and Antarctica
that are melting?
No.
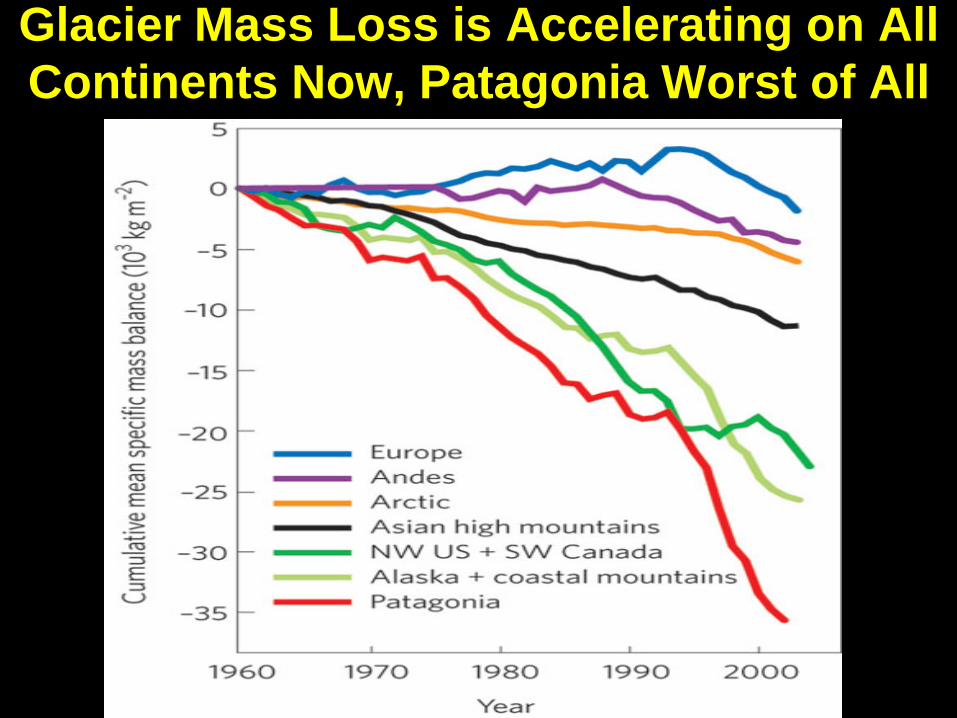
Glacier Mass Loss is Accelerating on All Continents Now, Patagonia Worst of All
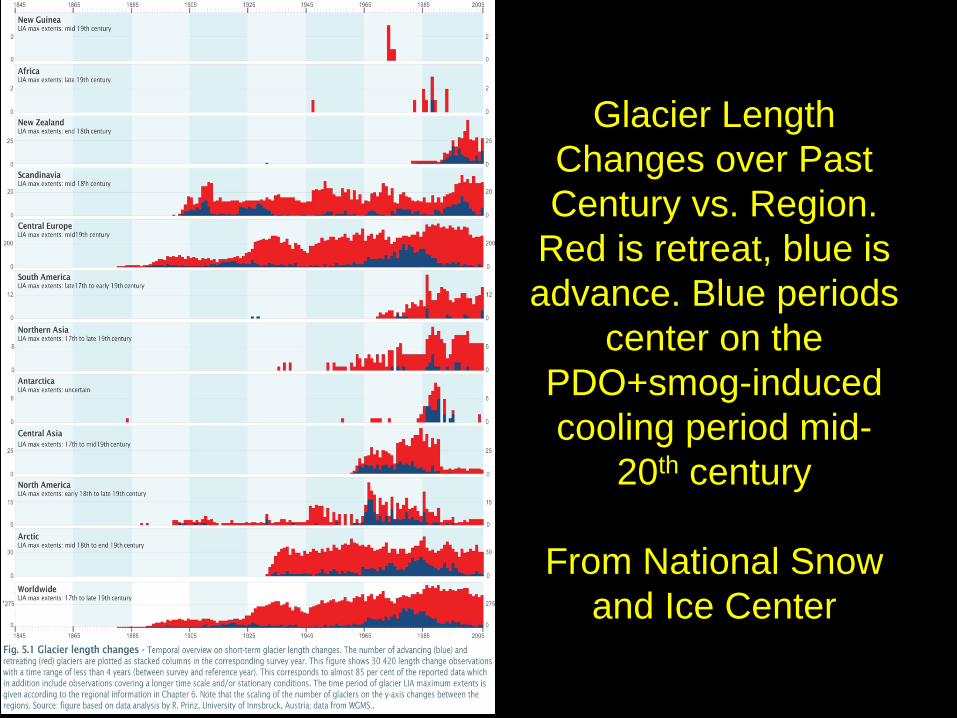
Glacier Length Changes over Past Century vs. Region.
Red is retreat, blue is advance. Blue periods
center on the PDO+smog-induced cooling period mid-
20th century
From National Snow and Ice Center

Global melt of glaciers, in equivalent water thickness (black boxes, meters/yr), and cumulative total
thickness loss (red boxes, right scale, meters). Glacier melt is clearly accelerating

Cumulative specific
mass balance of
Global Glaciers. The
cumulative specific mass
balance curves are
shown for the mean of all glaciers and
30 ‘reference’ glaciers with
(almost) continuous series since
1976. Source: Data from WGMS.

Annual contribution of global glacial melt to sea level rise (left axis, water equivalent, mm/yr) and cumulative (right axis, mm), based on surface area-
weighted mass balance observations (source). Glacier melt now provides as much sea level rise as does thermal expansion of seawater, and will dominate
going forward
Arctic Ocean Ice • Arctic melt is now rapid, as warm ocean
currents melt the ice from below, and warmer sea-level air temps melt it from above
• Ice near 32 F is also much softer, leading to breakage and rafting of pack ice out of the Arctic Ocean on either side of Greenland, a mechanism not modelled in GCM’s

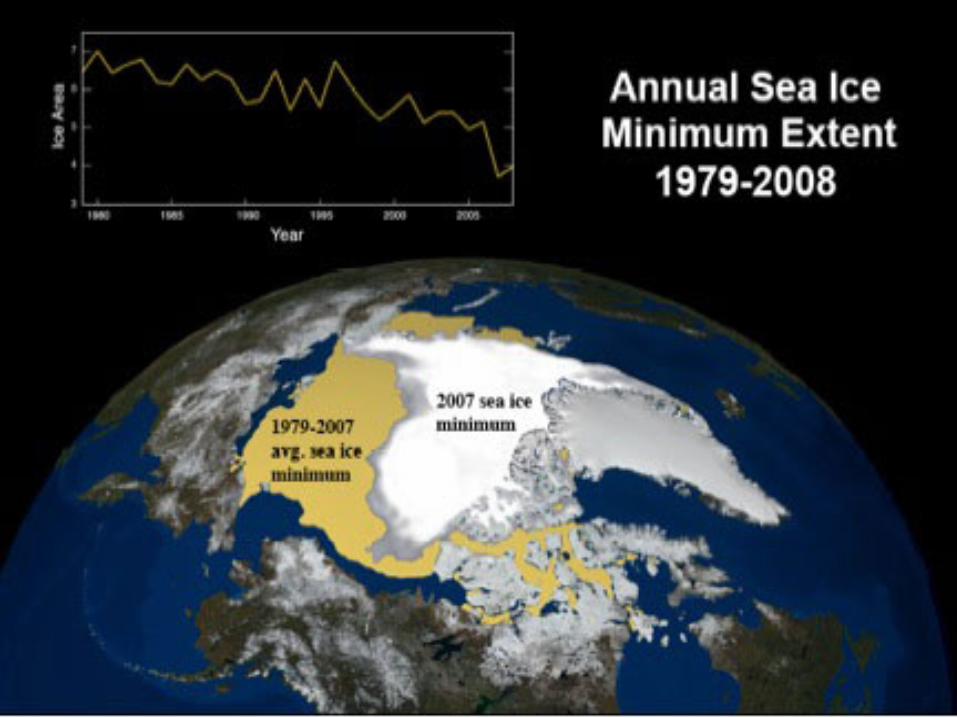
Summer Arctic Ocean Ice Coverage Area – Dropping Much More Rapidly than the 2007 IPCC AR4 Model Predictions

Here’s updated
through 2015, but w/o IPCC
model comparisons. Sept 2017 will very likely set
new low record…

…given plunging
winter sea ice due to
record Arctic
warmth

Arctic sea ice coverage is dropping in all seasons, not just summer
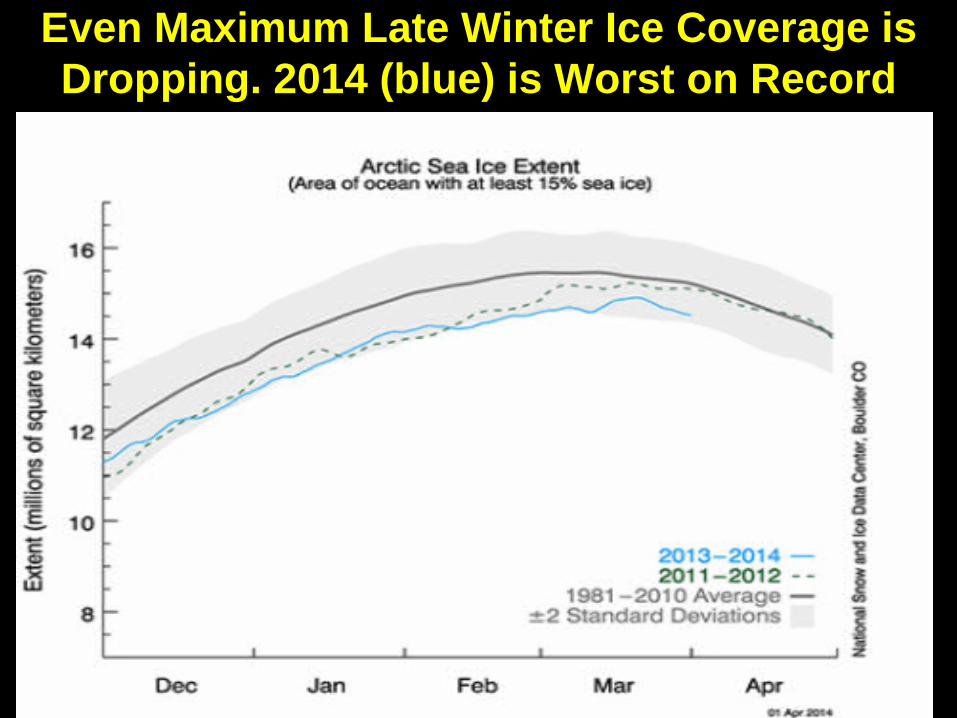
Even Maximum Late Winter Ice Coverage is Dropping. 2014 (blue) is Worst on Record
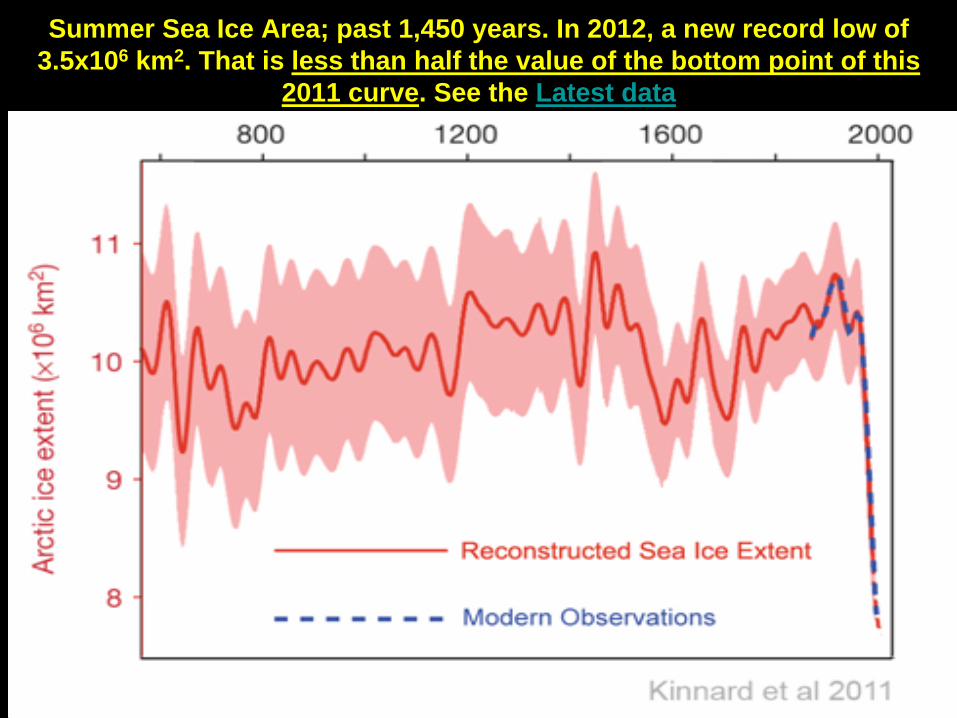
Summer Sea Ice Area; past 1,450 years. In 2012, a new record low of 3.5x10⁶ km2. That is less than half the value of the bottom point of this
2011 curve. See the Latest data


Not just ice coverage area, but Arctic Ocean ice volume is dropping even faster, as permanent ice rapidly disappears,
leaving only thin, breakable, seasonal ice. Linear trend: losing 310 cubic kilometers per year

• The permanent Arctic Ocean ice has been thinning, while remaining fairly white and reflective, all during the 20th century. Only in the 21st century has it thinned to the point of breaking up and disappearing at a rapid rate.
• Future climate change will be more rapid than earlier 20th century change rates because of this. Naively extrapolating from the first 40% rise in CO2 to the next 40% rise will UNDERestimate the severity of climate change. We’ll come back to this point in discussing the future in K42 “Future Climate”.
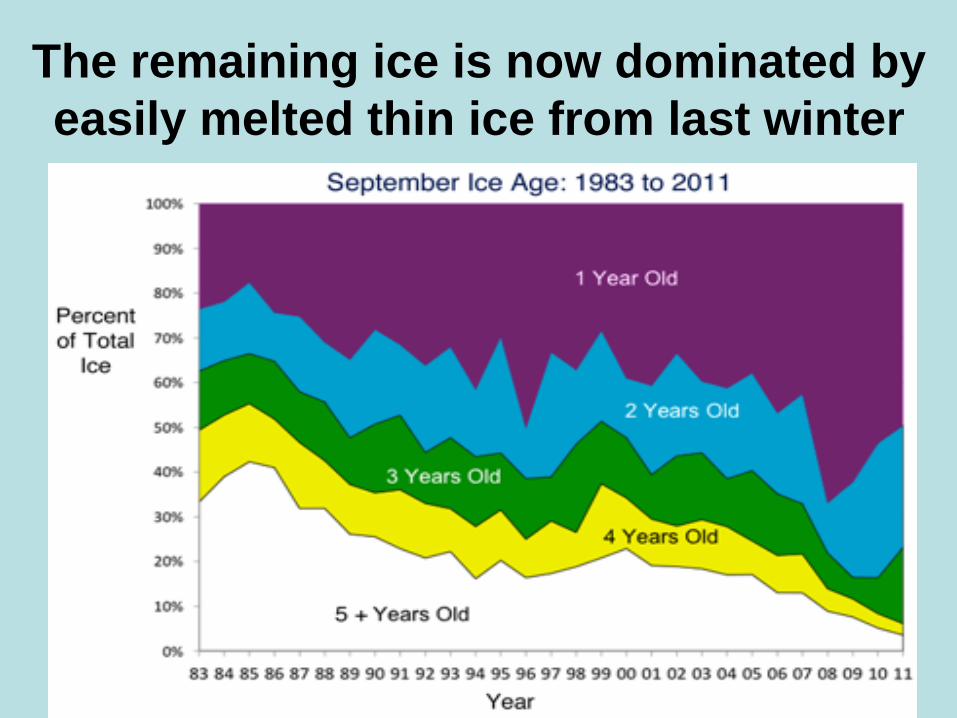
The remaining ice is now dominated by easily melted thin ice from last winter

Sea Ice in the Arctic: Grows from above, melts from below
• Sea ice grows from the top, since it is sub-freezing air in contact with the ice or water which lowers its temperature
• Warmer water is increasingly being driven just below the surface because of fresh meltwater, and it is this warm sea water which is melting the floating ice from below.
• The Polar Cell (“Polar Vortex”) is weakening. Recall, this is a cold descending air mass centered on the Arctic Ocean where the north pole is. Therefore…
• Previously, the Arctic had more clear cold skies that encouraged the formation of hard ice from cooling to the cold air and radiation to the clear dark polar nights. Now warmer, more humid, increasing snowfall in the Arctic is causing a thicker fluffy snow insulation layer topping the existing ice , and this worsens the melting from below.

Another Amplifying Feedback: The dark liquid ocean now being exposed is creating higher
humidity in the atmosphere above the Arctic Ocean. But water vapor is a powerful greenhouse gas and
amplifies warming beneath it

Here is how the climate denialists spin the data.
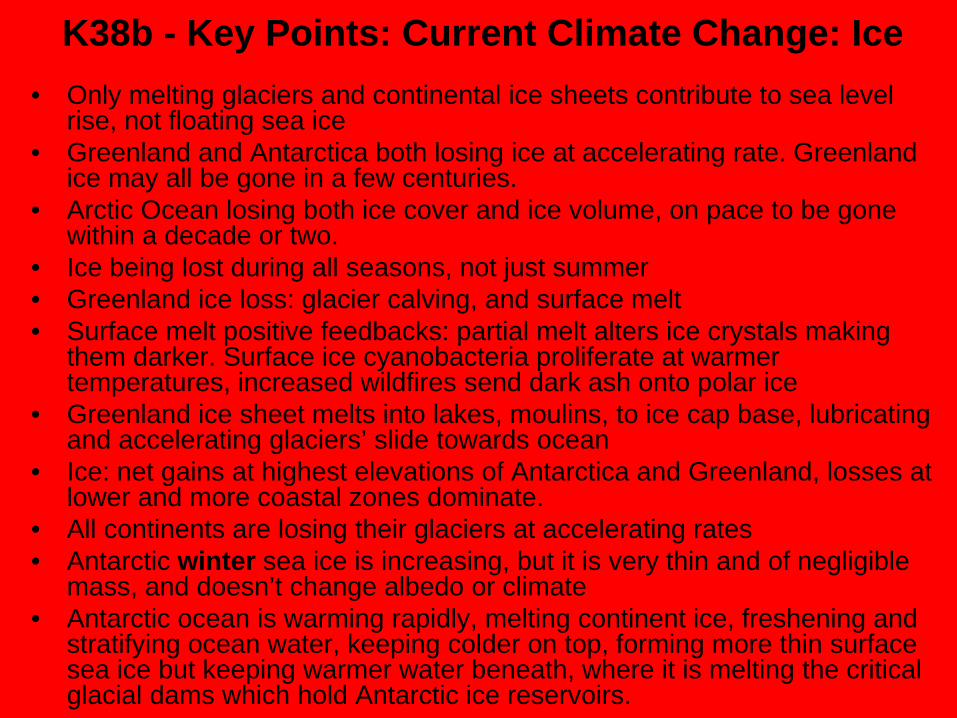
K38b - Key Points: Current Climate Change: Ice • Only melting glaciers and continental ice sheets contribute to sea level
rise, not floating sea ice • Greenland and Antarctica both losing ice at accelerating rate. Greenland
ice may all be gone in a few centuries. • Arctic Ocean losing both ice cover and ice volume, on pace to be gone
within a decade or two. • Ice being lost during all seasons, not just summer • Greenland ice loss: glacier calving, and surface melt • Surface melt positive feedbacks: partial melt alters ice crystals making
them darker. Surface ice cyanobacteria proliferate at warmer temperatures, increased wildfires send dark ash onto polar ice
• Greenland ice sheet melts into lakes, moulins, to ice cap base, lubricating and accelerating glaciers’ slide towards ocean
• Ice: net gains at highest elevations of Antarctica and Greenland, losses at lower and more coastal zones dominate.
• All continents are losing their glaciers at accelerating rates • Antarctic winter sea ice is increasing, but it is very thin and of negligible
mass, and doesn’t change albedo or climate • Antarctic ocean is warming rapidly, melting continent ice, freshening and
stratifying ocean water, keeping colder on top, forming more thin surface sea ice but keeping warmer water beneath, where it is melting the critical glacial dams which hold Antarctic ice reservoirs.