6
/ nJia. J. M••• Hydro!' Gwphy•. (1976),27,3,303.308 Cumuloni mbus tops around Bombay 551.576 .11 (547.1) A. K. )lUKllEIUEE and S. KUMAIl. Reg ional Mctcorologi<'.al Gern,e, Bl>mbay (Recei ved 6 August 1976) ABST&I\CT. Cumulonimbus cloudsaround - Hl mbl>,Y obsn-vcd du ring 1912·74 wl th tho help of 3 om BEL r<\l.l.<l. r equipped with RRC, were atudlod. T il') 3t11l11 revea led that high Cb tops orossing teopopeuse genorally occur 300 km !loW ,.y north and sout h of .B. )mb '.1 11 14ri ll.g p re-mon soon ] en d post-monsoon 86a!K)US . Genorally tho t.oP'fdid not e xceed 12 kru in Might around 100 km of Bcmb oy. It. W' .u a.LtO conflnmd th at t he tepa Gross ing tropopau 86 with a. fairdegree of 000l1ra01 een bJ Ioreoast 011 tho b.\sis of morning ll;JOOn t using t he wothod euggeated by Mukherjoa and Choudhury. I. Inlrod. cU oD The existence of very high cumulonimbus over northern and northeastern India is fai rly well known. Quite a numb er of studios have be en re- ported in literature on this subject (De and Bhat- tacharya 1966; Deshpande 1961, 196,1; Kulshre- stha 1962, 1961; Mukherjee and Choudu ry 1970; Natarajan and R ama Sastry 1970; Cornford and Spavins 1973). These studies were possible uiaiuly due to presence of radars which could measure heights accurately. Bedekar an,[ Agarwal (1970) attemp ted to study the height of Gb tops wit h Decca radar, Since the vertical beam wi dt h of Decca radar was .1°, and it was not equipped with RHI , the results cannot be accepted to be very reliable. Recently, iu :Uay 1972, a radar with Rll l has been in stalled at Bombay airport. The dutu collected from 1972 to 1974 may not be much but they were expected to give some indication about the distribution of heights of Gb clouds. In the present paper analysis of radar observati ons for months of May to October have been reported. Since during other months the weather was fail', no radar observations were taken, a. Data usod A BEL rad ar · was in stalled on 25 May 1972. AU ava ilable data upto 1974 were analysed. Since no jet aircraft cruise below 8 km and since clouds whose tops are less than this height may not have much charge separation to be classified as thun- derclouds, the clouds wi th tops below 8 kin were not taken into consideration. To find whether there are any preferred areas for high thuuderstorms, these observations were plot ted on a polar diagram and a reas of high tops were marked. For the purpose of ana- lysis, the clouds were grouped in intervals of two km. Such analysis for daily maximum tops gave the orientation of its monthwiso variation for preferred "rca of very high tops. Analysis of hourly da ta not only gave the diurnal variation of th e orientation, but also gave us variations and to Some extent the movement of regions of highe st clouds 'huing the course of the day. 3. Limitation It is necessary to mention the limitations of radar observat ions. They a re: (a) Heights of the clouds measured by radar are usually lower than the act ual tops. Cornford and Spavins have found t hat grouud based radar obser vatio ns were often under estimates and that, therefore, the summaries of similar observations should be regarded as frequencies which can be expected to be exceeded (also see Table 1 for comparison with aircraft observations). (b) Possibility of missing some clouds immedi- ately after the passage of thunderstorm. (e) The averages mentioned hero are to be taken as first approximations since the number of samples were limited. 4. Results The datu revealed that in the months of May J une, September and October, the Gb clouds observed reached 12 km height ( 31· 7 per cent eases) and in 2 per cent ea. ses they reached 16 km hei ght which is just below the height of tropopause over Bombay. In July and August, however, there was no case of Gb cloud heights reaching ·Spocifioations: Wave longth-X band t Maximum range-tOO k ill- Display-PPI lUll Pond A·gcope; Peak l'ower-200 kw, and Beam widt.h-Conicu,l lo. .

Cumulonimbus tops around Bombaymetnet.imd.gov.in/mausamdocs/52739.pdf · A. K. )lUKllEIUEE and S. KUMAIl. Regional Mctcorologi

  • Upload
    others

  • View
    8

  • Download
    0

Embed Size (px)

Citation preview

/ nJia. J . M••• Hydro!' Gwphy•. (1976),27,3,303.308

Cumulonimbus tops around Bombay551.576.11 (547.1)

A. K. )lUKllEIUEE and S. KUMAIl.

Regional Mctcorologi<'.al Gern,e, Bl>mbay

(Received6 August 1976)

ABST&I\CT. Cumulonimbus clouds around -Hlmbl>,Y obsn-vcd du ring 1912·74 wlth tho help of 3 om BELr<\l.l.<l.r equipped with RRC, were atudlod. T il') 3t11l11 revea led that high Cb tops orossing teopopeuse genorallyoccur 300 km !loW,.y north and sout h of .B.)mb '.1 1114rill.g p re-monsoon] end post-monsoon 86a!K)US. Genorallytho t.oP'fd id not exceed 12 kru in Might around 100 km of Bcmb oy. It. W'.u a.LtO conflnmd that t he tepa Grossingtropopau86with a. fairdegree of 000l1ra01 een bJ Ioreoast 011 tho b.\sis of morning ll;JOOnt using t he wothod euggeatedby Mukherjoa and Choudhury.

I. Inlrod. cUoD

The existence of very high cumulonimbus overnorthern and northeastern India is fai rly wellknown. Quite a numb er of studios have been re­ported in literature on th is subject (De and Bhat­tacharya 1966; Deshpand e 1961, 196,1; Kulshre­stha 1962, 1961; Mukherjee and Choudu ry 1970;Natarajan and R ama Sastry 1970; Cornford andSpavins 1973). These studies were possible uia iulydue to presence of radars which could measureheights accurately. Bedekar an,[ Agarwa l (1970)attempted to study the height of Gb tops withDecca radar, Since the vertic al beam width ofDecca radar was .1°, and it was not equipped withRHI, the results cannot be accepted to be veryreliable. Recently, iu :Uay 1972, a radar with Rlllhas been installed at Bombay airport. The dutucollected from 1972 to 1974 may not be muchbut they were expected to give some indicationabout the distribution of heights of Gb clouds. Inthe present paper analysis of radar observati onsfor months of May to October have been reported.Since during other months the weather was fail',no radar observations were taken,

a. Data usod

A BEL radar · was installed on 25 May 1972. AUava ilable data upto 1974 were analysed. Since nojet aircraft cruise below 8 km and since cloudswhose tops are less t han this height may not havemuch charge separation to be classified as thun­derclouds, the clouds with tops below 8 kin werenot taken into consideration.

To find ~)llt whether there are any preferredareas for high thuuderstorms, these observationswere plot ted on a polar diagram and areas of

high tops were marked. For the purpose of ana­lysis, the clouds were grouped in intervals oftwo km. Such analysis for daily maximum topsgave the orientation of its monthwiso variationfor preferred "rca of very high top s. Analysis ofhour ly data not only gave th e diurnal variationof th e orientation, but also gave us varia tions andto Some extent th e movement of regions of highestclouds 'hu ing the course of th e day .

3. Limitation

It is necessary to mention the limitations of radarobservations. They are:

(a ) Heights of the clouds measured by radarare usually lower than the actual tops. Corn fordand Spavins have found that grouud based radarobser vatio ns were often under estimates and that,t herefore, the summaries of similar observationsshould be regarded as frequencies which can beexpected to be exceeded (also see Table 1 forcomparison with aircraft observations) .

(b) Possibility of missing some clouds immedi­ately after the passage of thunderstorm.

(e) The averages mentioned hero are to be takenas first approximations since the number of sampleswere limited.
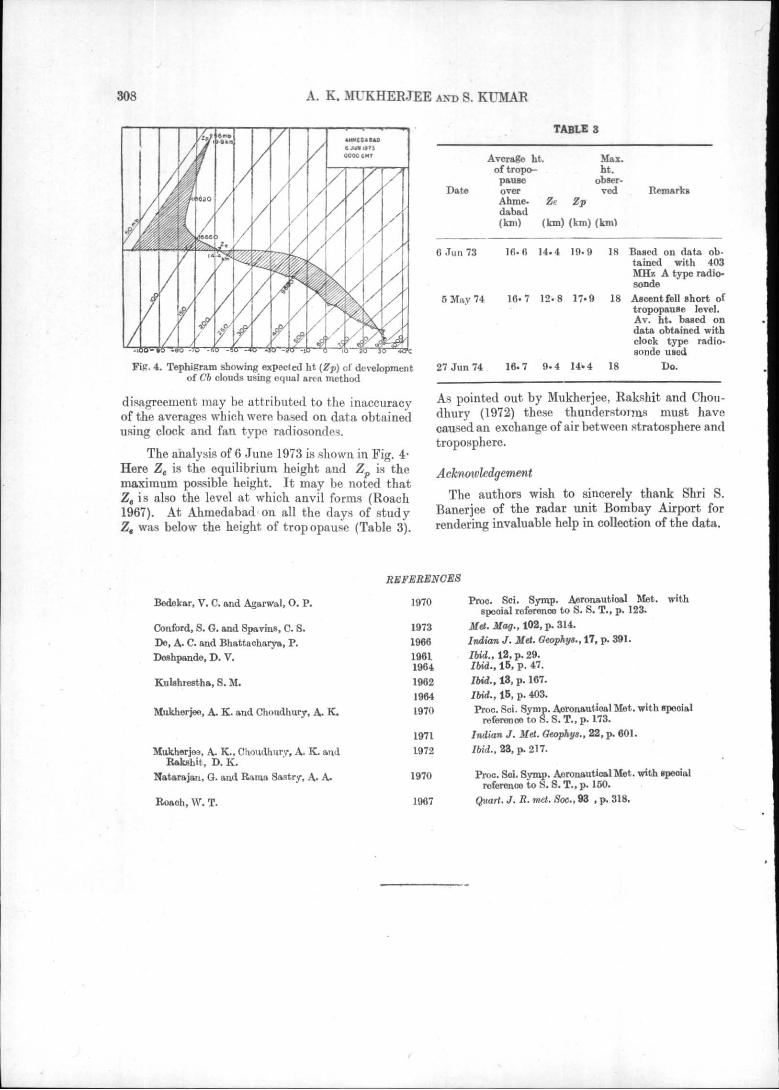
4. Results

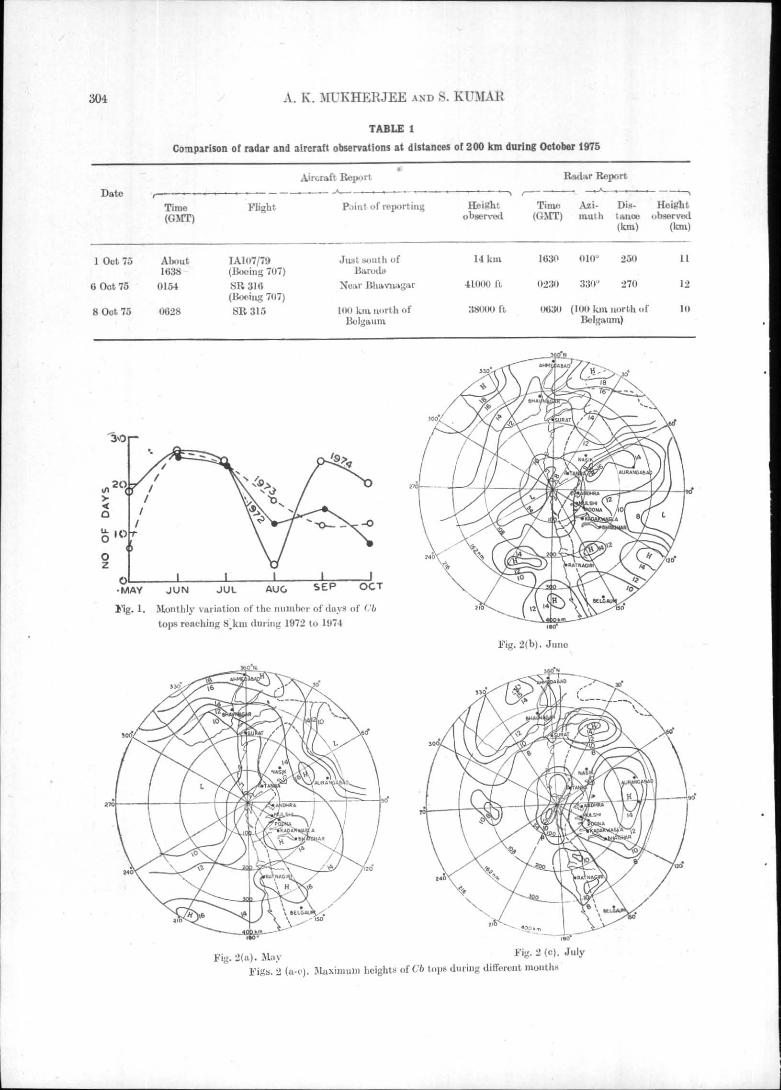
The datu revealed t hat in the months of MayJune, September and October, the Gb cloudsobserved reached 12 km height (31· 7 per centeases) and in 2 per cent ea.ses they reached 16 kmheight which is just below the height of t ropopa useover Bombay. In July and August, however,there was no case of Gb cloud heights reaching

·Spocifioations: Wave longth-X band t Maximum range-tOO k ill- Display-PPI lUll Pond A·gcope; Peak l'ower-200 kw,and Beam widt.h-Conicu,l lo. . • •