Embed Size (px)
Citation preview

Updated report
Cumulo rates
9 December 2011 • Updated report
1 Introduction
This report provides a critique of the treatment of „Cumulo rates‟ within Ofcom‟s charge control
models1, suggests alternative allocation methods, and estimates the corresponding impacts on the
unit costs output by the models.2
„Cumulo rates‟ is the phrase used to describe a tax on commercial property. The “commercial
property” taxed in this way is defined by the Valuation Office Agency (“VOA”) as BT‟s network
(ducts, poles, parts of exchange buildings and other assets as described more fully below).
The main findings of this report are:
The VOA calculates the amount of tax by considering the forecast profit (the “profits basis”, in
VOA parlance) of all the services offered by BT‟s UK wholesale activities
In view of this, a causal cost driver for this tax would be profits, not “profit weighted NRC
[Net Replacement Cost]”, as in Ofcom‟s models
By simulating how the VOA would have applied the “profits basis” in its assessment of the
tax, we have identified how the profits of individual groups of services (such as WLR and
MPF3) cause the tax to arise
Knowing how each of WLR and MPF cause the tax to arise allows us to identify a causal cost
driver based on profits. Applying this driver results in an improved allocation of Cumulo rates:
– to WLR of GBP2.45 per line per annum (versus GBP3.03 per line per annum in Ofcom‟s
models)
– to MPF of GBP1.45 per line per annum (versus GBP3.08 per line per annum in Ofcom‟s
models)
The above allocations are an improvement because they quantify something that seems
logical:
– BT‟s Regulatory Financial Statements (RFS) show that supplying MPF is, for BT, a less
profitable activity per line than supplying WLR (using the VOA‟s definition of profit)
1 This report refers to the models that were published with the Consultation “Charge control review for LLU and WLR
services” dated 31 March 2011. In its further consultation dated 23 November 2011, Ofcom noted that it subsequently removed from the models unsupported IS spend of £100m, among other less significant model changes. These changes should not materially affect the numerical conclusions of this report, because this report discusses Cumulo rates, which is a separate cost item to IS Spend.
2 This report supersedes the reports of the same title dated 17 August and 5 October 2011.
3 MPF and WLR are wholesale services offered by Openreach to Communications Providers (CPs) (including BT
Retail). MPF means Metallic Path Facility, a fully unbundled local loop allowing a CP to offer voice and data using its own switch co-located in BT‟s exchange. WLR+SPMF means Wholesale Line Rental plus Shared MPF, in effect a shared unbundled local loop allowing the CP to offer data via its own switch, plus voice via BT‟s switch.
Cumulo rates | 2
Updated report
– It therefore seems reasonable that MPF should attract a lower proportion per line than
WLR of a tax which is based on the VOA‟s forecast of profits
– The proposed allocation method is also consistent with deriving the additional Cumulo
rates cost that would result from an increment of MPF or WLR demand.
Furthermore, it appears that Cumulo rates have not been allocated to NGA4 in the later years
of the Ofcom‟s models. Our proposed lower costs per line of Core Rental Services are
compatible with Ofcom‟s forecast of BT‟s total cost of Cumulo rates.
This document is structured under the following headings:
an introduction to Cumulo rates and to the VOA‟s valuation methodology;
allocating Rateable Value to perimeters and sub-perimeters within BT‟s UK wholesale
activities;
allocation of Cumulo rates to WLR and MPF; and
allocation of Cumulo rates to NGA.
2 An introduction to Cumulo rates and to the VOA’s valuation methodology
This section summarises assumptions in Ofcom‟s models regarding the total cost of Cumulo rates,
and explains how the VOA assesses this tax.
Figure 1 shows the assumptions in Ofcom‟s models regarding the annual cost of Cumulo rates to
Openreach, together with the (smaller) portion of the same annual cost allocated to the rest of BT.
Figure 1: Annual cost of
Cumulo rates, GBP
million [Source: Ofcom‟s
Consultation Document
(31 March 2011, Fig 8.3,
p.53), after Ofcom
adjustment. „Rest of BT‟
derived by grossing up at
83% in all years, as per
Fig 8.2, p.52, and A8.39,
p.57]
The annual cost of Cumulo rates (or indeed of any business rates) is calculated by multiplying a
Rateable Value (“RV”) by a poundage rate (or “rate multiplier”). An RV applies to an individual
commercial property (a “hereditament”, in VOA jargon), while the poundage rate is the same for
4 NGA means next-generation access, an arrangement whereby BT‟s traditional all-copper local loop is replaced by a
local loop, making use of fibre-optic technology.
178101 100 97 95
36
21 20 20 19
214
122 120 117 114
2009/1
0
201
0/1
1
2011/1
2
2012/1
3
2013/1
4
Rest
of BT
Open-
reach

Cumulo rates | 3
Updated report
all hereditaments.5 The VOA revises each hereditament‟s RV every five years and publishes the
poundage rate every year.
For the BT Cumulo assessment, the hereditament is the entire BT network. This includes (among
other assets) BT‟s duct, fibre, copper, exchange buildings, cabinets, manholes and poles.6 These
are the “hereditament” assets. Other assets (including switches, power equipment, air conditioning
and numerous others) are known, again in VOA jargon, as “non-rateable assets”.
Ofcom‟s Consultation Document does not present the RV or the poundage rate used to derive the
annual cost of Cumulo rates. However, we can “reverse engineer” them by reference to VOA
publications. Figure 2 shows the poundage rate that we think Ofcom has used in its models.
Figure 2: Poundage rate
(or “rate multiplier”), per
GBP pence [Source:
Actuals from the VOA
(2009/10 and 2010/11),
increasing in line with
Ofcom‟s RPI forecast
thereafter]
Combining Figure 1 and Figure 2, we can derive the RV that Ofcom will have assumed for the
whole of BT. This is shown in Figure 3.
Figure 3: Rateable value
(RV), GBP million
[Source: inferred from
the annual cost and the
poundage rate]
5 The poundage rate is not uniform throughout the UK, because there are regional variations. However, the simplified
summary here is sufficient for the purposes of the current document.
6 Second witness statement of Edward Dolling to the LLU Appeal, page 4. The hereditament “includes, amongst other
assets, all the duct, fibre, copper and cabinets within BT‟s network plus all of its exchange buildings. It, however, excludes BT‟s office estate”. Ofcom‟s Statement of 22 May 2009 (at A6.126) mentions duct, exchange buildings, cabinets and poles. The 31 March 2011 Consultation Document (at Fig 8.2, p.55) mentions, in addition, fibre, copper, payphones and manholes.
48.5
41.4
43.3
44.6
45.9
2009/1
0
2010/1
1
2011/1
2
2012/1
3
2013/1
4
367
244 231 217 207
75
50 47 44 42
442
294 278 261 249
200
9/1
0
2010/1
1
201
1/1
2
201
2/1
3
2013/1
4
Rest
of BT
Open-
reach

Cumulo rates | 4
Updated report
BT‟s RV has fallen significantly in recent years. It was at least GBP533 million in 2005/6.7 As can
be seen in Figure 3, Ofcom forecasts further reductions in Cumulo rates over the period covered
by the charge control. The VOA does not aim to revise RVs annually, but only every five years.
The current five-year valuation cycle for BT‟s RV was supposed to have begun in April 2010.8
Over the previous five-year cycle there were “mid-cycle” adjustments to the RV in response to
what the VOA calls “material changes in circumstance” (“MCCs”). Ofcom has not forecast
expected MCCs individually,9 preferring instead to model a progressive future downward
adjustment to BT‟s Cumulo rates, equivalent to an average annual rate of reduction of 5.4% in the
RV.10
Ofcom has not explained the basis for this assumption.
According to the VOA, “the rateable value broadly represents the annual rent the property could
have been let for on the open market on a particular date”.11
The VOA employs various valuation
methods, one of which is called “expenses and receipts” or “profits basis”. The method used to
calculate BT‟s RV is the “profits basis”.12
The steps in the profits basis method are set out in the
VOA‟s Rating Manual (RM):13
“Firstly the gross profit derived from occupation of the hereditament is calculated by
deducting the cost of purchases made [by the hypothetical tenant] from [the hypothetical
tenant’s] gross receipts.
The working expenses, including an allowance for renewal of the tenant’s assets, are then
deducted from the gross profit to give the divisible balance.
The divisible balance represents the amount to be shared between the tenant (tenant’s
share) and the landlord (rent, or rateable value).”
7 Witness Statement of Euan Smith to the LLU Appeal, page 6: “the Central Rating List for England was […] updated
in January 2009 to reduce the rateable value of BT‟s infrastructure assets in England from £533,500,000 to £386,000,000” (our emphasis; the value including Scotland will have been higher).
8 Although we understand that the corresponding valuation is still a confidential draft.
9 Consultation Document Annexes, Paragraph A8.37.
10 Strictly speaking, Ofcom implies an annual average decline of 5.4% in Openreach‟s share of BT‟s RV. Ofcom does
not purport to forecast the annual cost or RV for BT as a whole. However, we can infer that Ofcom‟s approach requires the whole of BT‟s RV to decline by the same average rate of 5.4% p.a. This is because Ofcom‟s models keep the proportion of BT‟s Cumulo cost that is attributable to Openreach constant at 83% between 2009/10 and 2013/14.
11 VOA, “Business Rates: an introduction” (http://www.voa.gov.uk/corporate/publications/businessRatesAnIntro.html).
12 VOA, “Rating Manual – Volume 5 – Section 873: Next Generation Access Telecommunications Network (NGA):
Practice Note 2010” (http://test.voa.gov.uk/instructions/chapters/rating_manual/vol5/sect873/frame.htm).
13 VOA, “Rating Manual – Volume 4 – Section 6: the Receipts and Expenditures Method”
(http://www.voa.gov.uk/corporate/Publications/Manuals/RatingManual/RatingManualVolume4/sect6/b-rat-man-vol4-s6.html).

Cumulo rates | 5
Updated report
The VOA explains the above steps in detail by means of a 16-page chapter in the RM. It also
provides a worked example whose principal steps can be summarised as follows:14
“Adopted Net Profit” (ANP) is calculated, excluding depreciation, loan interest and
exceptional items
– In the example, this is done by taking some 20 revenue and cost “line items” for the
preceding three years and then extrapolating the three years‟ values to arrive at a single
“adopted” value for each line item for the first year of the valuation period
– These line items appear to be based on the last three years‟ accounts of the business being
assessed for rates (we refer to this as “the Taxpaying Business”, to distinguish it from the
so-called “hypothetical tenant” whose business is similar, but not necessarily the same, as
that of the Taxpaying Business). The worked example lists revenues from four of the
Taxpaying Business‟s products, along with its costs such as “wages and salaries”
– It is reasonable to assume that the VOA makes significant use of the last three years‟
accounts of the Taxpaying Business in this sort of exercise; the RM says “It is customary
for at least the three years accounts leading up to the [valuation date] to be examined in
order to establish trends and levels”.15
The worked example then subtracts from the ANP an amount called “Renewal Fund for the
replacement of Non-Rateable assets”. These are the assets that the company requires to
produce its products (excluding the assets comprising the hereditament). In the example, the
Renewal Fund (RF) is arrived at by comparing, contrasting and then combining three related
quantities:
– a single representative depreciation figure, based on an inspection of the depreciation in
the last three years‟ accounts
– an estimate of the replacement costs of the non-rateable assets, annualised using a sinking
fund formula16
– the same estimate of the replacement costs of the non-rateable assets, this time annualised
using a straight-line depreciation formula.
The result of the previous step (ANP minus RF) is called the “divisible balance”. The worked
example allocates this to the tenant in two tranches:
– “Interest on Capital”: 6% of the replacement costs of the “non-rateable assets”
– “Profit and risk”: a percentage of the Divisible Balance, after deduction of the Interest on
Capital. It is not clear how the percentage is derived. The RM suggests that the VOA has
discretion to set it based on individual circumstances, in particular in view of the
negotiating strengths of the parties to the hypothetical tenancy:
14
VOA, “Rating Manual – Volume 4 – Section 6; Appendix 2”
(http://www.voa.gov.uk/corporate/Publications/Manuals/RatingManual/RatingManualVolume4/sect6/d-rat-man-vol4-s6-app2.html).
15 Rating Manual – Volume 4 – Section 6 – Section 2.1.
16 In the sinking fund formula the replacement cost is converted to an annual „annuity‟ payment using the standard
formula for an annuity. In the version of the RM that we consulted the VOA suggested an interest rate in the range 3% to 4% to be employed in the „sinking fund‟ (annuity) formula.

Cumulo rates | 6
Updated report
“16.7 Percentage of the divisible balance
The percentage to adopt will depend on the negotiating strengths of the parties and the risk
to, and quantum of, the tenant’s capital. Where this method is adopted it is unlikely that
50% of the divisible balance will be correct, although by default such a split has been
commonplace in the past.
A variation on this division of the divisible balance is to estimate the tenant’s share in two
parts. Firstly, an allowance is made for “interest on capital”, at 6% for the 1995 Lists as
described at 16.2 above. This is then deducted from the divisible balance and a proportion
of the “remaining balance” attributed to the tenant as an allowance for “profit and risk”.
The proportion of the “remaining balance” adopted will again vary with the facts of the
case but will be a lower percentage than if an allowance for interest on capital had not
already been made […].
The allowances for “interest on capital” and “profit and risk” should be summed to arrive
at the total tenant’s share.”
3 Allocating Rateable Value to perimeters and sub-perimeters within BT’s UK
wholesale activities
Ofcom‟s allocation method results in an allocation of 83% of the RV of BT‟s wholesale activities,
and of its annual Cumulo cost, to Openreach. The same percentage figure is used in each year of
Ofcom‟s models. The 83% figure was explained by BT in the 2009 LLU Appeal.17
The key points
of BT‟s explanation (in the appeal and in the BT slides provided to TTG/Sky by Ofcom on 29
September 2011) were:18
BT‟s assumption is that the majority of the Cumulo charge charges should fall on Openreach,
because Openreach owns most of BT‟s rateable assets, notably “Access” assets like duct,
copper, telegraph poles, cabinets and manholes; and
The VOA applied its profits basis method to BT as a whole, not to Openreach as such
(although information provided on 29 September indicated that it was in fact only applied to
BT‟s “wholesale activities”). The allocation within BT of the cost of Cumulo was a matter for
BT, and done by BT.
17
First witness statement of Edward Dolling to the LLU Appeal in 2009.
18 Op. Cit., paragraph 78: “Firstly, under rating law and precedent, BT‟s rateable assets are assessed together. The
allocation of BT‟s rateable value and/or its Cumulo bill to various divisions is not a matter for rating law so an allocation basis has to be derived. For both the management and regulatory accounts, the key allocation basis is the net replacement value of BT‟s rateable network assets: this has been the subject of external audit and regulatory scrutiny for several years. Regardless of whatever value metric is used to apportion BT‟s Cumulo Rates bill the majority of the charges would fall on Openreach as Openreach owns most of BT‟s rateable assets, notably “Access” assets like duct, copper, telegraph poles, cabinets, manholes etc.”.

Cumulo rates | 7
Updated report
BT relied primarily on its own method and data to make this allocation – specifically the
database underpinning the RFS (which is not publicly available). This allowed BT to derive an
allocation key called “profit weighted NRC [Net Replacement Cost]” for each of its assets.
BT‟s method, outlined in the points above, appears flawed. On the first point above, the fact that
“Openreach owns” certain assets is not relevant to the allocation. The VOA methodology we
summarised above suggests that RV (and hence Cumulo cost) is a function of forecast profit, not
asset ownership. If profits cause Cumulo via the RV (as seems to be the case) then a causal
allocation key would be profits, not “profit weighted NRC”.
BT has confirmed that the VOA used the profits basis, and has further clarified that:19
the business perimeter that the VOA used was BT‟s UK wholesale activities
within this perimeter, the VOA considered three sub-perimeters: (i) Access markets, (ii) Other
Wholesale markets, and (iii) Wholesale residual.20
The three sub-perimeters which BT says the VOA analysed map precisely onto accounting
separation perimeters (with typographically identical names) within BT‟s RFS. This is
understandable: we noted above that the VOA‟s method is to take revenue and cost “line items”
from the published accounts of the Taxpaying Businesses for the preceding three years and then
extrapolate the three years‟ values to arrive at a single “adopted” value for each line item. It seems,
therefore, that a key input for the VOA‟s valuation of the RV of BT‟s “wholesale activities” will
have been the revenue and cost items in BT‟s RFS for the previous three years. This would have
been an attractive approach from the point of view of the VOA, because the RFS contains data
items for each of the three sub-perimeters that are helpful in providing inputs for the profits basis.
Furthermore, there are no other audited accounts that the VOA could have used for this purpose;
BT‟s statutory financial statements, for example, do not contain a sufficiently detailed breakdown
of revenues and costs to allow this.
We will now show how data in the published RFS can be used to simulate the VOA‟s valuation of
the RV, and how that RV can be causally allocated not only to the three sub-perimeters mentioned
above, but also to WLR and MPF. We will follow the three steps set out earlier in this report:
Step 1: calculate the Adopted Net Profit (ANP), i.e. gross receipts - cost of purchases -
working expenses for the hypothetical tenant of the hereditament
Step 2: calculate the “Renewal Fund for the replacement of Non-Rateable assets”, i.e. the
allowance for renewal of the hypothetical tenant‟s assets
19
BT, "BT Cumulo Rates: Non-confidential summary of BT presentation to Ofcom Aug 2011“, received September
2011.
20 These sub-perimeters are defined in the various Statements, Notifications and Directions which Ofcom periodically
issues regarding the RFS. In broad indicative terms, “Other Wholesale markets” includes per-minute interconnection, the associated interconnection links, and other such services. “Wholesale residual activities” comprises the wholesale activities which are not required to be reported upon in the RFS, such as certain kinds of transit service.

Cumulo rates | 8
Updated report
Step 3: calculate the Divisible Balance (DB), i.e. ANP minus RF, and share it between the
hypothetical tenant (the Tenant‟s Share) and the hypothetical landlord (the Rateable Value).
In this analysis we use data from the RFS for the three financial years preceding our simulated
valuation (2007/08, 2008/9 and 2009/10) to estimate the accounting line items mentioned earlier
(on page 5), as we expect the VOA might have done. We do this for each of the three sub-
perimeters:
Access markets, further subdivided into:
– Wholesale Analogue Exchange Line Services, which contains WLR;
– Wholesale Local Access (WLA), which contains MPF and SMPF; and
– Other Access.
Other wholesale markets; and
Wholesale residual activities.
Having gathered from the RFS the three years of data required to calculate the VOA‟s profits
basis, we then extrapolate this to arrive at “adopted” (i.e. 2010/11) values for ANP, RF, DB and
RV.
The “adopted” value for each line item is extrapolated by applying to the 2009/10 value the
average growth rate over the preceding three years. As BT has not told us how the VOA did its
extrapolation, we think using the growth rate is justified, as an approximation for the purposes of
this simulation.
3.1 Step 1: Adopted Net Profit (ANP)
Figure 4 illustrates how we simulated ANP for one of the sub-sets, Wholesale Analogue Exchange
Line Services (WAELS).
Item Unit 2007/08 2008/09 2009/10
Adopted,
2010/11
Turnover GBP m 2670 2549 2420 2304
HCA operating costs GBP m 2073 1904 1798 1674
… of which depreciation GBP m 637 634 670 687
Net Profit GBP m 1234 1279 1292 1317
Figure 4: Step 1(a): Calculating Adopted Net Profit (ANP) for one sub-set: Wholesale Analogue
Exchange Line Services [Sources: 2007/08 from RFS Sections 2.1, 2.3, 3.3, 3.4, 3.11;
2008/09 and 2009/10 from RFS Sections 5.1, 6.1, 7.3, 7.10; adopted values extrapolated]
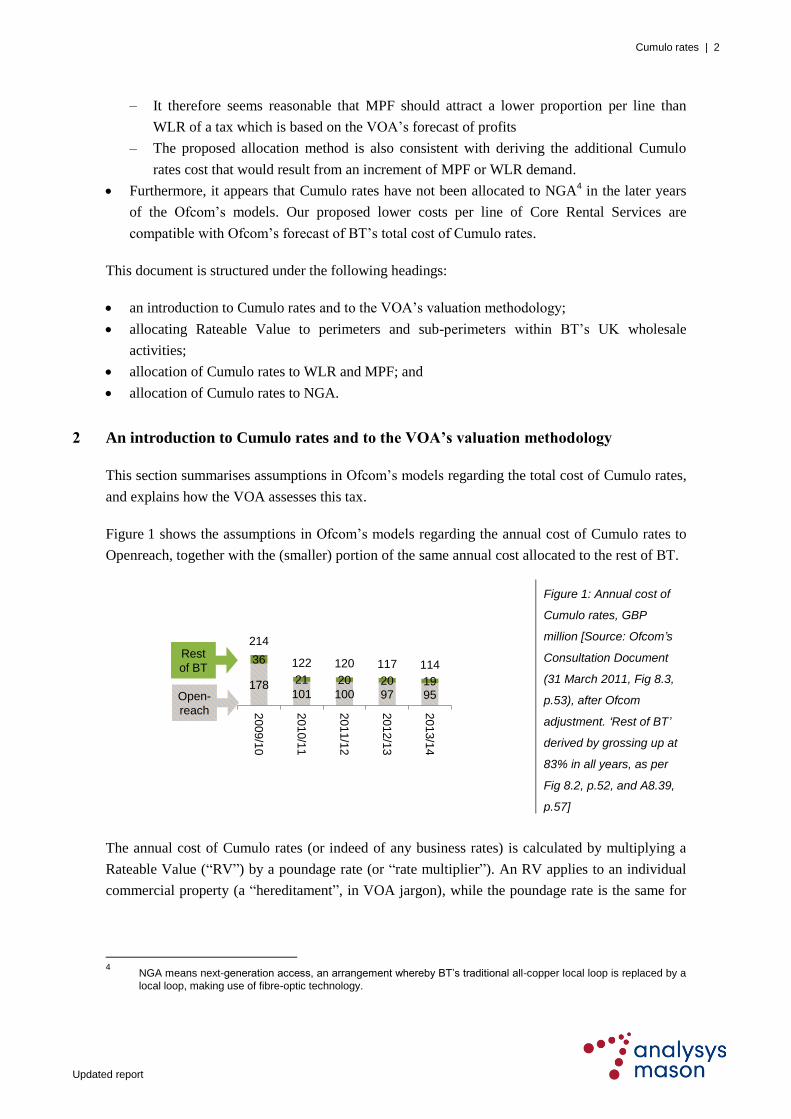
Figure 5 shows the Adopted Net Profit for all of the subsets, arrived at using the same method.
Cumulo rates | 9
Updated report
Item (adopted 2010/11) Unit WAELS WLA
Other
Access
Other
w/sale
markets
W/sale
residual
activities
Turnover GBP m 2304 517 1734 1564 2563
HCA operating costs (excluding
depreciation) GBP m 987 261 701 757 2114
Adopted Net Profit GBP m 1317 256 1033 807 449
Figure 5: Step 1(b): Calculating Adopted Net Profit (ANP) for all the sub-sets [Sources: as per
Figure 4]
In Figure 4 and Figure 5, Net Profit excludes depreciation, loan interest and exceptional items, as
required by the VOA‟s methods as set out in the RM.
3.2 Step 2: Calculation of the Renewal Fund (RF)
In order to calculate the RF, the various assets involved need to be separated into:
Rateable assets: those included in the hereditament, thought of as owned by the hypothetical
landlord. They are not owned by the hypothetical tenant, so cannot be associated with the
profits of the hypothetical tenant‟s business. Their value is therefore not an input to the RV
calculation, but rather an output from it.
Non-rateable assets: thought of as part of the hypothetical tenant‟s business, and so included
in the RF. These can be thought of as the plant and machinery that the hypothetical tenant buys
itself, and installs inside (or alongside) the hereditament that it rents.
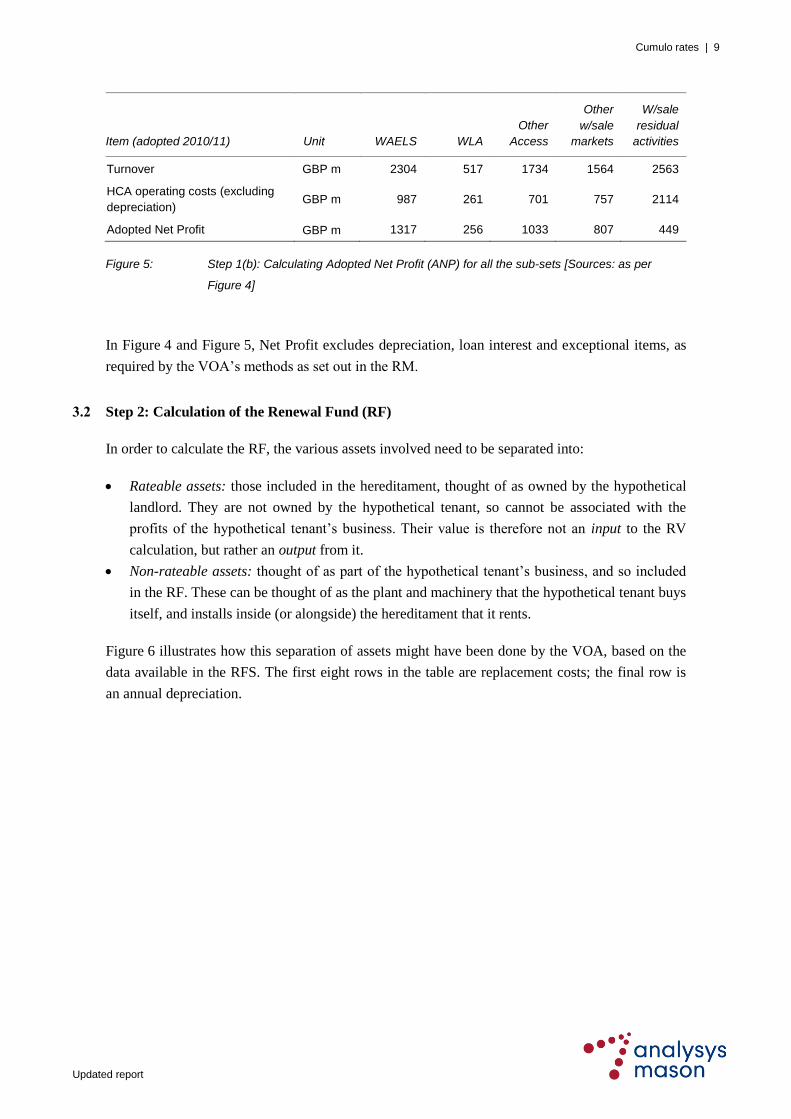
Figure 6 illustrates how this separation of assets might have been done by the VOA, based on the
data available in the RFS. The first eight rows in the table are replacement costs; the final row is
an annual depreciation.
Cumulo rates | 10
Updated report
Item Rateable? Unit 2007/08 2008/09 2009/10
Adopted,
2010/11
Land & Buildings Yes GBP m 141 157 153 159
Access – Copper Yes GBP m 4069 3764 3667 3481
Access – Fibre Yes GBP m 2 2 3 4
Access – Duct Yes GBP m 2707 2801 3266 3587
Switch No GBP m 303 237 195 156
Transmission No GBP m 258 302 310 340
Other21
No GBP m 433 485 385 363
Replacement cost of non-
rateable assets
GBP m 994 1024 890 859
Straight-line depreciation of
replacement costs (over 10
years)
GBP m 99 102 89 86
Figure 6: Step 2(a): Calculating Renewal Fund (RF) for one sub-set: Wholesale Analogue
Exchange Line Services [Sources: 2007/08 from RFS Section 2.5; 2008/09 and 2009/10
from RFS Section 6.3; adopted values extrapolated]
Figure 6 introduces two assumptions:
It is assumed that the category “Transmission” is 100% non-rateable (that is, none of
Transmission is included in the hereditament). It is possible that Transmission contains an
allocation of some duct assets. However, it is quite plausible that those particular duct assets
are outside the hereditament; neither BT nor the VOA gives enough information to be sure of
this, one way or the other.
A uniform financial lifetime of 10 years is assigned to all the non-rateable assets. We have
assumed 10 years because this is roughly in the middle of the range of the „useful lives‟ quoted
for relevant assets in BT‟s Annual Report,22
which range from 2 to 20 years.
Sensitivity tests later in this report show the impact of variations to these assumptions on the
allocations that result from this simulation. The tests show that varying the assumptions only has a
minor effect on the allocations.
Figure 7 shows the RF for all of the subsets.
21
“ Other” includes computing and other business support functions.
22 BT‟s Annual Report and Form 20-F. 2010/11, Note (xi) on Page 94. If we exclude buildings, duct, cable and fibre we
are left with the following ranges for „useful life‟ of assets: exchange equipment, 2 to 13 years; payphones and other network equipment, 2 to 20 years; motor vehicles, 2 to 9 years; computers and office equipment, 3 to 6 years.

Cumulo rates | 11
Updated report
Item (adopted 2010/11) Unit WAELS WLA
Other
Access
Other
w/sale
markets
W/sale
residual
activities
Replacement cost of non-
rateable assets GBP m 859 132 1145 1533 1351
RF: Straight-line depreciation of
replacement costs (over 10
years)
GBP m 86 13 114 153 135
Figure 7: Step 2(b): Calculating Renewal Fund (RF) for all the sub-sets [Sources: as per Figure 6]
3.3 Step 3: Calculation and sharing of the Divisible Balance (DB)
The DB is calculated by subtracting RF from ANP. It is then shared between the hypothetical
tenant (the Tenant‟s Share) and the hypothetical landlord (the Rateable Value), using the method
described earlier in this report:
“Interest on Capital” (6% of the replacement costs of the non-rateable assets) is calculated
“Profit and risk”: a percentage of the Divisible Balance (after deduction of the Interest on
Capital) is deducted, in function of the negotiating strengths of the hypothetical parties to the
tenancy.
It appears that the VOA assumed the hypothetical tenant would have a strong negotiating position.
We can infer the “profit and risk” percentage that the VOA is likely to have employed by
comparing the DB arrived at in the steps above with the RV published by the VOA. The “profit
and risk” percentage for which this simulation of 2010/11 coincides with the RV in Ofcom‟s
models for 2010/11 is 90%. (We estimated the RV in Ofcom‟s models to be GBP294 million in
2010/11, see Figure 3 above.)
In effect, this 90% is a third assumption (in addition to the two introduced earlier in Figure 6).
Sensitivity tests later in this report show the impact of variations to this assumption on the
allocations that result from this simulation. The test shows that varying the assumptions only has a
minor effect on the allocations.
Figure 8 shows the sharing of the Divisible Balance to give the Rateable Value.

Cumulo rates | 12
Updated report
Item (adopted 2010/11) Unit WAELS WLA
Other
Access
Other
w/sale
markets
W/sale
residual
activities
All UK
w/sale
activities
Adopted Net Profit (ANP) GBP m 1317 256 1033 807 449 3862
Renewal Fund (RF) GBP m 86 13 114 153 135 501
Divisible Balance (DB) GBP m 1231 243 919 654 314 3361
Interest on Capital GBP m 52 8 68 92 81 301
Profit and Risk GBP m 1066 212 769 508 211 2766
Rateable Value GBP m 113 23 82 54 22 294
Figure 8: Step 3: Calculating Divisible Balance (DB) and sharing it between hypothetical tenant and
landlord [Sources: derived from the preceding Figures]
The result of the simulation is that two of the causal drivers of the profit leading to BT‟s RV of
GBP294 million are:
Wholesale Analogue Exchange Line Services (WAELS): GBP113 million of the RV (and
hence of the profits that drive the RV)
Wholesale Local Access (WLA): GBP23 million of the RV (and hence of the profits driving
the RV).
Expressed in percentage terms, 38.4% of BT‟s RV in 2010/11 is driven by WAELS and 7.8% by
WLA.
Earlier in this section three assumptions were mentioned for which we would test the sensitivity of
these results. Figure 9 illustrates the results of those tests.
Scenario WAELS WLA
Base case (as per text) 38.4% 7.8%
50% of Transmission rateable (instead of 100%) 37.3% 7.4%
Financial lifetime 7.5 years (instead of 10) 39.7% 7.9%
Profit and risk 45% (instead of 90%) 38.5% 7.7%
Figure 9: Testing the sensitivity of the allocations to changed assumptions [Source: the same
calculations as above, but with modified assumptions as per the table]
As can be seen from Figure 9, the allocations that result from this simulation are not greatly
affected by the sensitivity testing.

Cumulo rates | 13
Updated report
4 Allocation of Cumulo rates to WLR and MPF
The previous section demonstrated how RV can be allocated using a causal cost driver to the
subsets Wholesale Analogue Exchange Line Services (WAELS) and Wholesale Local Access
(WLA). This section considers its allocation to even more detailed subdivisions within those
subsets: WLR rentals, MPF rentals and SMPF rentals (the Core Rental Services, or „CRS‟).
The data published in the RFS is not sufficiently detailed to allow this allocation to be simulated
using the profits basis employed so far in this report.23
Instead, we will do it based on revenues.
Figure 10 shows the proportion of revenues accounted for by the CRS within each sub-perimeter.
Proportion 2008/09 2009/10 2010/11
The proportion of WAELS revenues accounted for by basic (non-premium)
WLR
72% 70% 70%
The proportion of WLA revenues accounted for by MPF 34% 43% 53%
The proportion of WLA revenues accounted for by SMPF 16% 14% 8%
Figure 10: Further breakdowns within Wholesale Analogue Exchange Line Services (WAELS) and
Wholesale Local Access (WLA) [Source: derived from RFS 2009/10 and RFS 2010/11,
Sections 7.3 and 7.10]
It must be noted that it is not ideal to allocate profits using revenues as a driver. However,
insufficient audited data is publicly available to permit identification of profit by product
according to the definition employed by the VOA. We can identify profit after depreciation but not
net profit according to the VOA‟s definition. Ofcom probably has sufficient data to do this, in the
non-redacted version of its models. BT certainly has all the data required for this. However, we use
revenues for this allocation, which produces the results shown in Figure 11.
23
It is worth noting that BT probably does possess sufficient data in the unpublished database which underpins the
RFS to make this allocation using the profits basis.

Cumulo rates | 14
Updated report
Unit Source WLR MPF SMPF
RV of the sub-perimeter, 2010/11 GBP m [1] from Figure 8
113
(RV for
WAELS)
23
(RV for
WLA)
23
(RV for
WLA)
Product‟s proportion of the sub-perimeter‟s
revenues, 2010/11 % [2] from Figure 10 70% 53% 8%
Approximate RV of the product, 2010/11 GBP m [3] = [1] × [2] 79 12 2
Lines, 2010/11 Millions [4] Con Doc
24
Annex Fig 6.1 14.8 3.8 10.7
RV per line, 2010/11 GBP / line [3] / [4] 5.34 3.16 0.19
Figure 11: Estimating RV per product, and per line, for the Core Rental Services (CRS) [Source:
Analysys Mason]
Because the percentages shown in Figure 13 are not ideal cost drivers, they will be sensitivity
tested later in the report.
Earlier in this report, we estimated the RV in Ofcom‟s models to be GBP294 million in 2010/11
(Figure 3 above). So the RVs of WLR, MPF and SMPF (row [3] in Figure 11) account for 26.9%,
4.1% and 0.7% respectively of BT‟s expected total RV for 2010/11.
A second stage in the analysis is to determine the appropriate RV (and Cumulo rates cost) in
2013/14. We discuss two methods for this below.
As observed earlier in this report (page 4), the VOA does not aim to revise RVs annually, but only
every five years. The simulation set out in this report is based on the three years of historical data
(2007/09 to 2009/10) that the VOA would have had to hand when doing the most recent valuation,
work which we understand continued until well after BT‟s 2009/10 RFS came out. So the
simulation in this report represents an RV which would apply from 2010/11 through to 2014/15,
covering the final four years of the charge control period (and a year beyond). As the RV is not
supposed to change for five years, it is not necessary for its underlying cost drivers to change. In
other words, the 4.1% allocation to MPF rentals could be expected to stay constant for the whole
charge control period. It is not unusual for allocation drivers to be held constant for the model
period: Ofcom‟s models contain many drivers which are held constant in this way (for example,
the 83% of Cumulo rates that it allocates to Openreach).
Figure 12 sets out a calculation of the Cumulo rates due to WLR and MPF rentals in 2013/14,
based on the above assumption of a constant percentage allocation of RV to MPF, contrasting the
results of this calculation with the corresponding unit costs in Ofcom‟s models.
24
Consultation Document, “Charge control review for LLU and WLR services Annexes Non-confidential version”, 31
March 2011.
Cumulo rates | 15
Updated report
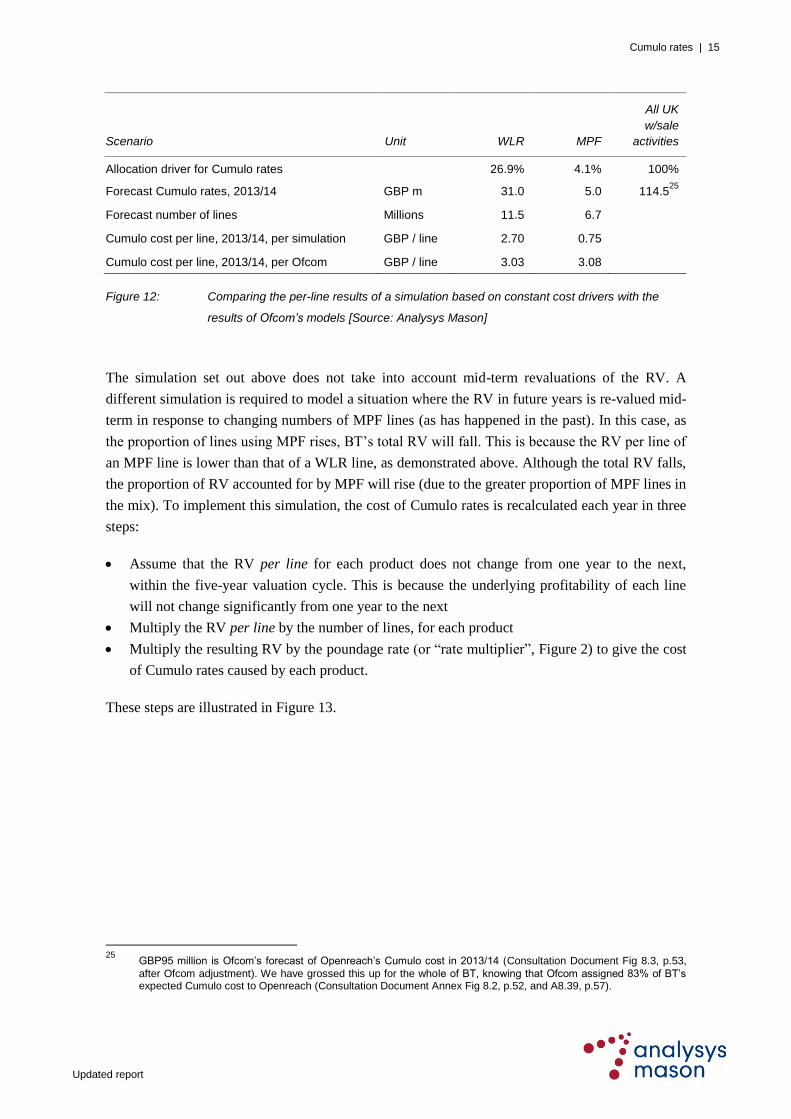
Scenario Unit WLR MPF
All UK
w/sale
activities
Allocation driver for Cumulo rates 26.9% 4.1% 100%
Forecast Cumulo rates, 2013/14 GBP m 31.0 5.0 114.525
Forecast number of lines Millions 11.5 6.7
Cumulo cost per line, 2013/14, per simulation GBP / line 2.70 0.75
Cumulo cost per line, 2013/14, per Ofcom GBP / line 3.03 3.08
Figure 12: Comparing the per-line results of a simulation based on constant cost drivers with the
results of Ofcom‟s models [Source: Analysys Mason]
The simulation set out above does not take into account mid-term revaluations of the RV. A
different simulation is required to model a situation where the RV in future years is re-valued mid-
term in response to changing numbers of MPF lines (as has happened in the past). In this case, as
the proportion of lines using MPF rises, BT‟s total RV will fall. This is because the RV per line of
an MPF line is lower than that of a WLR line, as demonstrated above. Although the total RV falls,
the proportion of RV accounted for by MPF will rise (due to the greater proportion of MPF lines in
the mix). To implement this simulation, the cost of Cumulo rates is recalculated each year in three
steps:
Assume that the RV per line for each product does not change from one year to the next,
within the five-year valuation cycle. This is because the underlying profitability of each line
will not change significantly from one year to the next
Multiply the RV per line by the number of lines, for each product
Multiply the resulting RV by the poundage rate (or “rate multiplier”, Figure 2) to give the cost
of Cumulo rates caused by each product.
These steps are illustrated in Figure 13.
25
GBP95 million is Ofcom‟s forecast of Openreach‟s Cumulo cost in 2013/14 (Consultation Document Fig 8.3, p.53,
after Ofcom adjustment). We have grossed this up for the whole of BT, knowing that Ofcom assigned 83% of BT‟s expected Cumulo cost to Openreach (Consultation Document Annex Fig 8.2, p.52, and A8.39, p.57).

Cumulo rates | 16
Updated report
Unit Source WLR MPF SMPF
RV per line, 2010/11 GBP / line [1] from Figure 11 5.34 3.16 0.19
Poundage rate (or “rate multiplier”),
2010/11
Pence per
GBP [2] from Figure 2 41.4 41.4 41.4
Cumulo cost per line, 2010/11 GBP / line [3] = [1] x [2] 2.21 1.31 0.08
Poundage rate (or “rate multiplier”),
2013/14
Pence per
GBP [4] from Figure 2 45.9 45.9 45.9
Increase in poundage, 2010/11-2013/14 % [5] = [4] / [2] 1.11
Cumulo cost per line, 2013/14 (our model) GBP / line [6] = [3] x [5] 2.45 1.45 0.09
Cumulo cost per line, 2013/14 (Ofcom
models)
Con Doc Annex Fig
8.10 3.03 3.08 0.04
Figure 13: Comparing the per-line results of the simulation based on a periodically updated RV with
the results of Ofcom‟s models [Source: Analysys Mason]
Earlier in this section an assumption was mentioned for which we would test the sensitivity of
these results. Instead of assuming that 53% of the profits of WLA costs are accounted for by CRS,
the simulation can be run with 75%. It should be noted that this simulation leads to an
overestimate of the Cumulo cost per line of MPF, because it assumes that MPF rentals are more
profitable than the other services in the WLA sub-perimeter. The Cumulo cost per MPF line in
2013/14 under this sensitivity test is GBP2.05.
5 Allocation of Cumulo rates to NGA
In the preceding sections of this report we have demonstrated that a causal allocation of the cost of
Cumulo rates to the CRS would lead to costs per line which are lower than those proposed by
Ofcom in the WLR and LLU Consultation.
Those lower costs per line of Cumulo rates imply, in turn, a lower total cost of Cumulo rates (for
the CRS) than that predicted by Ofcom. This section now presents a complementary analysis, and
arrives at the same conclusion via a different route, by considering the allocation of future Cumulo
rates to NGA, under two headings:
The non-allocation of the cost of Cumulo rates to NGA in Ofcom‟s models
The potential impact of allocating Cumulo cost to NGA.
5.1 The non-allocation of the cost of Cumulo rates to NGA in Ofcom’s models
It is unclear from the Consultation Document and accompanying models whether the models
allocate a portion of the cost of forecast Cumulo rates to NGA. The volume forecast employed in
the Consultation Document and accompanying models provides a forecast for NGA lines of 3.7

Cumulo rates | 17
Updated report
million in 2013/14.26
(To put this figure in context, the models forecast 11.5 million and 6.7
million lines of WLR and MPF, respectively, in 2013/14.)
It appears that in the forecast of Cumulo rates supplied by BT to Ofcom, the cost of Cumulo rates
is forecast taking NGA into account:27
“RVs are revised every year on the assumptions that there will be material changes in
circumstances (MCCs) that will trigger reassessments. Three MCC effects have been
estimated of which the largest relate to growth in MPF and NGA volumes.
It has been assumed that increasing MPF volumes will act to decrease the Cumulo RV […]
Higher NGA volumes are assumed to increase the Cumulo RV.”
However, it is unclear whether Ofcom intended to allocate Cumulo rates to NGA within its models
(which does not necessarily employ BT‟s forecast). The Consultation Document suggests that the
NGA forecast is used to allocate common costs:28
“The non-confidential version of the model shows forecast of NGA services in aggregate to
enable stakeholders to understand and comment on the contribution of common costs to
these services in our modelling.”
The remainder of this section shows that Ofcom appears not to have allocated a significant portion
of the cost of Cumulo rates to NGA.
In Ofcom‟s models, between 41% and 45% of Openreach‟s Cumulo cost is attributable to services
other than CRS. This can be worked out by applying the Cumulo allocation to CRS. As shown in
Figure 14, the Cumulo cross-charge attributable to CRS is modelled as GBP98 million in 2009/10,
falling to GBP56 million in 2013/14.
26
Consultation Document Annex A6.28, which makes reference to the non-confidential version of the models.
27 Consultation Document Annex A8.33.
28 Consultation Document Annex A6.28.

Cumulo rates | 18
Updated report
Concept Source WLR MPF SMPF Total
Cost per line per year,
2009/10, GBP
Con Doc29
Annex Fig
8.10, p.62
[a] 5.35 5.45 0.07
Lines, 2009/10, 000s Con Doc Annex Fig
6.1, p.43
[b] 15 851 2253 11 760
Allocated cost, 2009/10,
GBP m
[c] = [a]×[b] 85 12 1 98
Cost per line per year,
2013/14, GBP
Con Doc Annex Fig
8.10, p.62
[d] 3.03 3.08 0.04
Lines, 2013/14, 000s Con Doc Annex Fig
6.1, p.43
[e] 11 470 6 660 9 160
Allocated cost, 2013/14,
GBP m
[f] = [d]×[e] 35 21 0 56
Figure 14: Applying the Cumulo allocation to Core Rental Services (CRS) [Source: as indicated in
second column]
The CRS are not themselves NGA services, so the allocated costs in the table above should not
contain any NGA costs. If present, the cost of Cumulo allocated to NGA must therefore be found
in the remainder of Openreach‟s Cumulo cost, accounted for by:
LLU Ancillary Services („LLU-AS‟)30
that form part of the Consultation, such as new
provides, migrations, co-mingling, etc.
Other Openreach services (either regulated or non-regulated) that do not form part of the
Consultation Document, such as Alternative Interface Symmetric Broadband Origination
(“AISBO”) services, including Wholesale Extension (“WES”), Backhaul Extension Services
(“BES”), Ethernet Backhaul Direct (“EBD”) and Ethernet Access Direct (“EAD”), plus
Openreach activities without regulatory reporting obligations.
As shown in the rest of this section, it appears that this remainder does not contain any significant
allocations of Cumulo rates to NGA, either.
The Consultation Document does not provide a breakdown of this remainder of Openreach‟s
Cumulo cost, which is represented by the red area and question mark on Figure 15.
29
Consultation Document
30 By “LLU-AS” (a new term introduced in this document, not an Ofcom acronym) we mean Ancillary Services (new
provides, migrations and other related services); that is, everything whose prices are proposed to be regulated in the Consultation Document, except for the CRS.

Cumulo rates | 19
Updated report
Figure 15: Openreach
Cumulo transfer charge,
GBP million [Source:
inferred from the
Consultation Document,
as explained in the text]
In order to understand more clearly what services are accounted for by the areas depicted by red
dotted lines in Figure 15, we “grossed up” the amount labelled “CRS” in an attempt to estimate the
additional cost accounted for by Ancillary Services. That calculation is set out in Figure 16.
Item Source 2009/10 2013/14
Revenues from WLR, MPF and SMPF rentals (CRS)
Con Doc Annex Fig
6.1 multiplied by Con
Doc Fig 7.14 and 7.15
GBP m 2021 1849
Revenues from new provides and single migrations GBP m 224 181
Revenues from services in Ofcom migration basket Con Doc Annex Fig
7.19 GBP m 144 119
Revenues from services in Ofcom co-mingling basket Con Doc Annex Fig
7.18 GBP m 80 95
Revenues from services in Ofcom SMPF basket Con Doc Annex Fig
7.17 GBP m 44 30
Revenues from services in Ofcom MPF basket Con Doc Annex Fig
7.16 GBP m 18 4
Sub-total: LLU-AS GBP m 510 429
Total: CRS plus LLU-AS GBP m 2531 2279
CRS as a proportion of the total 79.9% 81.2%
Hence, gross-up factor to derive total from CRS 1.25 1.23
Figure 16: Calculating a gross-up factor for Ancillary Services (LLU-AS), based on revenues [Source:
as per second column]
The data in the table above is not presented in one single place in the Consultation Document – we
synthesised it from various data items in the Consultation Document. The table represents our
attempt to reproduce Ofcom‟s „bottom-up‟ calculation of what Openreach‟s forecast revenues
would be if prices were set at costs for the LLU-AS services defined previously. We have grossed
up costs using factors derived from revenues. It is therefore an approximation, but one which is
justified because the revenues should be derived (in effect) from cost-based prices. The result is
depicted in Figure 17.
98
56
80
39
178
95
2009/10 2013/14
45%
41%
CRS
?
Adjusted down-
wards by Ofcom
from BT‟s £105m
Cumulo rates | 20
Updated report
Figure 17: Openreach
Cumulo transfer charge,
GBP million [Source:
inferred from the
Consultation Document,
as explained in the text]
(1) = Ancillary Services
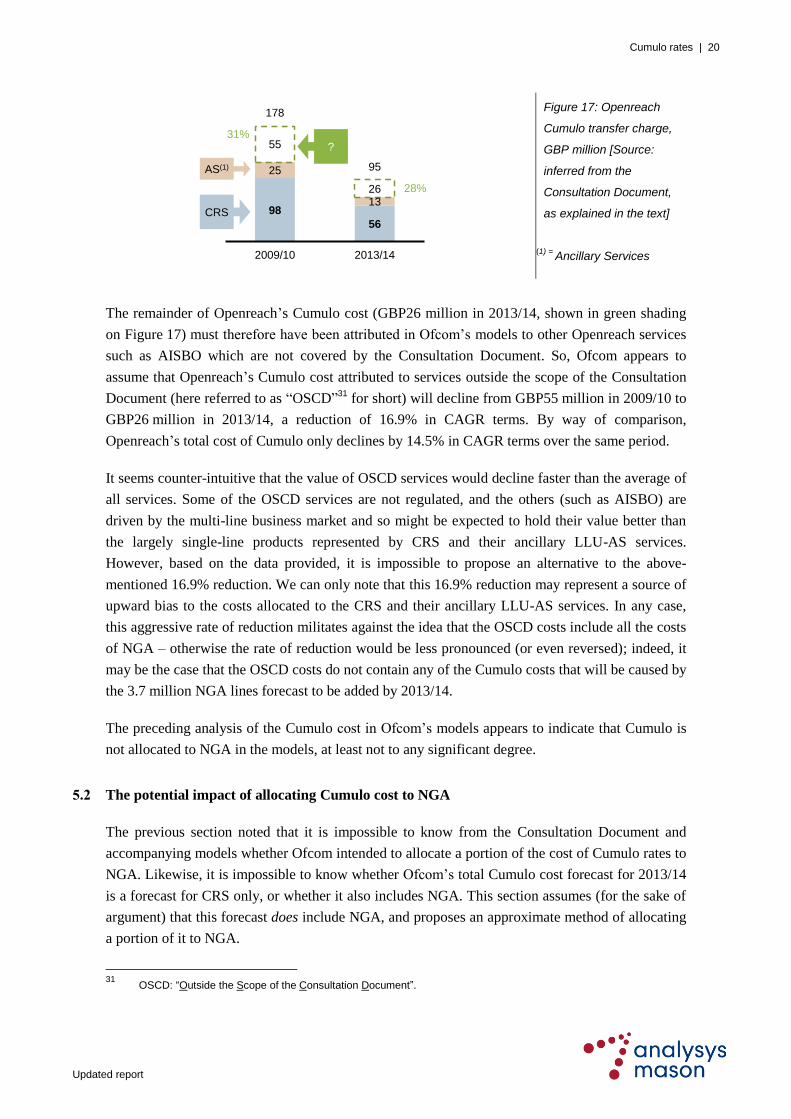
The remainder of Openreach‟s Cumulo cost (GBP26 million in 2013/14, shown in green shading
on Figure 17) must therefore have been attributed in Ofcom‟s models to other Openreach services
such as AISBO which are not covered by the Consultation Document. So, Ofcom appears to
assume that Openreach‟s Cumulo cost attributed to services outside the scope of the Consultation
Document (here referred to as “OSCD”31
for short) will decline from GBP55 million in 2009/10 to
GBP26 million in 2013/14, a reduction of 16.9% in CAGR terms. By way of comparison,
Openreach‟s total cost of Cumulo only declines by 14.5% in CAGR terms over the same period.
It seems counter-intuitive that the value of OSCD services would decline faster than the average of
all services. Some of the OSCD services are not regulated, and the others (such as AISBO) are
driven by the multi-line business market and so might be expected to hold their value better than
the largely single-line products represented by CRS and their ancillary LLU-AS services.
However, based on the data provided, it is impossible to propose an alternative to the above-
mentioned 16.9% reduction. We can only note that this 16.9% reduction may represent a source of
upward bias to the costs allocated to the CRS and their ancillary LLU-AS services. In any case,
this aggressive rate of reduction militates against the idea that the OSCD costs include all the costs
of NGA – otherwise the rate of reduction would be less pronounced (or even reversed); indeed, it
may be the case that the OSCD costs do not contain any of the Cumulo costs that will be caused by
the 3.7 million NGA lines forecast to be added by 2013/14.
The preceding analysis of the Cumulo cost in Ofcom‟s models appears to indicate that Cumulo is
not allocated to NGA in the models, at least not to any significant degree.
5.2 The potential impact of allocating Cumulo cost to NGA
The previous section noted that it is impossible to know from the Consultation Document and
accompanying models whether Ofcom intended to allocate a portion of the cost of Cumulo rates to
NGA. Likewise, it is impossible to know whether Ofcom‟s total Cumulo cost forecast for 2013/14
is a forecast for CRS only, or whether it also includes NGA. This section assumes (for the sake of
argument) that this forecast does include NGA, and proposes an approximate method of allocating
a portion of it to NGA.
31
OSCD: “Outside the Scope of the Consultation Document”.
98
56
25
13
55
26
178
95
2009/10 2013/14
31%
28%
CRS
?
AS(1)

Cumulo rates | 21
Updated report
It is impossible to calculate what results a causal method of allocation based on profits would
produce, if applied to NGA. The RFS contained sufficient historical data to permit the simulation
set out earlier in this report for WLR and MPF. But the RFS does not contain data for such a
simulation of NGA.
The VOA seems to take the view that NGA lines are more profitable than those based on copper
access lines. The VOA probably knew that BT estimated a Cumulo cost per line in 2009/10 of
approximately GBP5.50 for services based on copper access lines.32
At the same time, the VOA
proposed to assess NGA operators (other than BT) for Cumulo using an RV of GBP20 per home
connected,33
equivalent to an annual charge of GBP9.70 (after multiplying by the rates multiplier
of 48.5p in 2009/10).34
This implies that the profit potential of a non-BT NGA line is higher than
that of a BT copper-based line, by a factor of 1.76 (GBP9.70 divided by GBP5.50, that is 76%
higher), in the opinion of the VOA. In the following, we have taken a more conservative approach,
as the drivers for profitability of NGA lines (revenue per line, cost per line) and their future
evolution are uncertain: we have assumed that that NGA lines are only 10% more profitable for
BT than CRS lines.
Using these conservative assumptions, allocating Cumulo to NGA on a per-line basis should lead
to reductions in CRS costs of the order of 17%. This is illustrated in the calculations set out in
Figure 18.
32
Consultation Document, Annex Fig 8.10, p.62. WLR: GBP5.35. MPF: GBP5.45. SMPF: GBP0.07.
33 “Rating Manual – Volume 5 – Section 873: Next Generation Access Telecommunications Network (NGA): Practice
Note 2010” (http://test.voa.gov.uk/instructions/chapters/rating_manual/vol5/sect873/frame.htm)
34 See Figure 2.

Cumulo rates | 22
Updated report
Item Source 2009/10 2013/14
Average number of “non-NGA lines” Con Doc Annex Fig. 6.1 Lines (000s) 18 104 18 130
WLR Lines (000s) 15 851 11 470
MPF Lines (000s) 2 253 6 660
Average number of “NGA” lines (total) … CF model, sheet 1.Vol
row 343
Lines (000s) 0 3 716
… of which 90%35
pick up Cumulo from the
same cost base as CRS+AS
Lines (000s) 0 3 344
NGA “Value uplift” (intended to simulate how
much more valuable an NGA line might be than
a traditional copper line, in the VOA‟s opinion)
Analysys Mason
assumption
1.10 1.10
NGA equivalent cost driver after value uplift 0 3 679
Total cost driver (NGA equivalent + CRS
lines)
18 104 21 809
% of Cumulo to be re-allocated to NGA 0% 17%
Figure 18: Impact of NGA on Cumulo allocation to CRS [Source: as per second column]
If it turned out that the profit differential were higher than 10%, then the percentage of Cumulo
rates to be allocated to NGA would be even greater. However it is not necessary to quantify this
exactly: it is enough to note that our proposed lower costs per line of CRS (in Section 4 above) are
compatible with Ofcom‟s forecast of BT‟s total cost of Cumulo rates, knowing that any apparent
shortfall in the total brought about by our lower unit costs will be easily accounted for by the cost
of Cumulo rates due to NGA.
35
We are assuming here that the remaining 10% of NGA lines are addressing a different customer base to that
addressed using MPF and SMPF+WLR. The latter can be thought of as a “mass market” of consumer households, as well as small and home offices (SoHos). Our assumption here is that 90% of the NGA lines address consumers and SoHos, but that 10% address larger business sites that were never served by MPF and SMPF+WLR, but instead were traditionally served by leased lines, primary-rate ISDN or other such high-capacity accesses.

Updated report