Embed Size (px)
Citation preview
Asian and Pacific Islander Seafood Consumption Study (EPA 910/R-99-003)
Ruth Sechena, MD, MPH1, Connie Nakano, BA, Shiquan Liao, Ph.D., Nayak Polissar, Ph.D., Roseanne Lorenzana, DVM, Ph.D., Simon Truong, and
Richard Fenske, Ph.D., MPH
May 27, 1999
Funded by:
EPA Environmental Justice Community/University Partnership Grant EQ925003-01
Project Officer: Susan Morales EPA 910/R-99-003 (Phase II) EPA 910/R-96-007 (Phase I)
Address correspondence to:
Ruth Sechena, MD, MPH Director, NIEHS Center Community Outreach Programs 4225 Roosevelt Way NE, #100 Seattle, Washington 98105 e-mail: [email protected]
Address correspondence to:
Connie Nakano, BA University of Washington Box 356429 Seattle, WA 98195
Shiquan Liao, Ph.D., StatPro Consultants 7127 NE 167th Street Bothell, WA 98011
Nayak Lincoln Polissar, Ph.D. The Mountain-Whisper-Light Statistical Consulting 1827 23rd Avenue, East Seattle, WA 98112-2913
Roseanne Lorenzana, DVM, Ph.D., DABT U.S. EPA—Region 10 1200 Sixth Avenue Seattle, WA 98101
Simon Truong Social Services Director The Refugee Federation Service Center 7101 Martin Luther King, Jr. Way S., #214 Seattle, WA 98118
Richard Fenske, PhD, MPH Department of Environmental Health University of Washington Box 357234 Seattle, WA 98195
Acknowledgments
This study would not have been possible without the generosity of the Cambodian, Chinese, Filipino, Hmong, Japanese, Korean, Laotion, Mien, Samoan, and Vietnamese communities. We especially thank the participants from these communities for their willingness to provide the authors with the data needed to understand how Asian and Pacific Islanders acquire, prepare, and consume seafood. Their contributions to this study has provided invaluable information for their respective communities, the scientific community, and the general community at large.
The collaboration between the Community Steering Committee (CSC) and the authors was a groundbreaking experience. Without the CSC members’ time and effort, this study would not have materialized. Moreover, their knowledge and experience of the communities of focus, as well as their advice on interviewing strategies and communication tools assured a positive outcome for all involved. We are most grateful for their contributions to this study.
Community Steering Committee Ms. Bee Chang, Hmong community Mr. Chanthone Chin, Program Coordinator, The Coalition of Lao Mutual Assistance
Association of Washington State Ms. Regina Chae, Korean community Mr. Paul Egashira, Japanese community Mr. Ngy Hul, President, Khmer Community of Seattle-King County; Acting Executive
Director, Refugee Federation Service Center Mr. Nisay Nuth, Program Coordinator, Khmer Community of Seattle King County Ms. Luningning Murro, Filipino community Mr. Edwin Obras, Director of Development Operational Emergency Center Mr. Stan Shikuma, Japanese community Ms. Oanh Tran, Case Manager, Refugee Federation Service Center Mr. Simon Truong, Social Services Director, Refugee Federation Service Center;
President, Indochina Chinese Refugee Association Mr. Yaochien Sirisisangpha, Case Manager, Refugee Federation Service Center Ms. Lynna Song, Seattle-Washington State Korean Association Mr. Savieng Soukhaphonh, Laotian community Ms. May Wong, Beacon Hill Driving School Ms. Benling Wong, Seattle Public Library
We would like to thank the Taiwanese Association of Seattle for its endeavors to involve people from Taiwan in the study as a part of the Chinese community. We understand that many in the Taiwanese American community recognize Taiwan as a separate nation from China, and we respect their position. Our study focused on cultural consumption habits only and does not reflect a political position.
Additionally, we thank the Fujinkal Association with the Seattle Betsuin Temple as well as other API community religious organizations for helping to recruit participants. Several religious organizations in the communities of focus provided assistance in the participant recruitment process and cannot be listed here for confidentiality concerns.
We are grateful to the following scientists and communtiy activists for their participation and technical guidance. We appreciate their expertise as well as their concern for populations who may be impacted by environmental contaminants.
Technical Committee Dr. Kenneth Chew, Director, Administrative Office, Western Region Aquaculture Center Dr. Richard Fenske, Professor, Environmental Health Mr. Gregory Glass, Environmental Consultant Dr. Steven Gilbert, Director, Institute for Neurotoxicology Dr. Joan Hardy, Washington State Dept. of Health, Environmental Health Assessment
Services Ms. Leslie Keill, Toxicologist, Washington State Department of Ecology Dr. Marsha Landolt, Dean and Vice Provost, UW Graduate School Dr. Roseanne M. Lorenzana, Toxicologist, US EPA, Region 10 Mr. Craig McCormack, Senior Toxicologist, Washington State Department of Ecology Mr. Jonathan Sheilds, Water Quality Planner, Dept. of Natural Resources Dr. Juliet Van Eenwyk, Director, Non-Infectious Conditions Epidemiology, Washington
State Department of Health
Advisory Committee Dr. Elizabeth Evans, Rainier Center Clinic Mr. Joseph Johnson, Boeing Ms. Marcia Lagerloef, Water Quality Standards Coordinator, US EPA, Region 10 Ms. Roberta Gunn, Executive Director, Puget SoundKeeper Alliance Dr. Laura Weiss, Washington State Department of Ecology Dr. John Wekell, Research Chemist, US Dept. of Commerce, NOAA
The interviewers and translators were recruited from the ten participating communities. They provided the vital link in the success of this study: obtaining data from the study participants and recording it in a way the statisticians could accurately measure. Their patience and diligence in interviewing the participants was remarkable, as was their accurate recording of data.
Bilingual Interviewers and Translators Ms. Helen S. Barber, Filipino interviewer Ms. Regina Chae, Korean interviewer Mr. Pang Chang, Hmong interviewer Mr. Jeff Dang, Vietnamese interviewer Ms. Alison Doungphouchan, Laotian interviewer Ms. Chenda Eng, Cambodian translator
Ms. Jeanie Li, Chinese interviewer Ms. Mia Matsubara, Japanese interviewer/translator Bilingual Interviewers and Translators (continued) Ms. Luningning Murro, Filipino translator Mr. Chet Ouch, Cambodian interviewer Mr. Ton Saechao, Mien interviewer/translator Mr. Robert Tausili, Samoan interviewer/translator Ms. Jenny Wong, Chinese translator
We thank the University of Washington—National Institute for Environmental Health Sciences (UW-NIEHS) Center for Ecogenetics and Environmental Health for providing technical experts and facilities required to help bring this study and report to completion.
This was truly a multi-cultural, multi-disciplinary community study. Many individuals from the focus communities, Washington state governmental agencies, grassroots community groups, as well as the University of Washington, have contributed to the success of this endeavor. Following are listed those who have helped us realize this project.
Editor Ms. Anne B. Harrington, Information Specialist II, UW-NIEHS Center for Ecogenetics
and Environmental Health
Mr. Michael Antee, Washington State Dept. of Health, Office of Shellfish Programs Ms. Jude Ballard, Fred Hutchinson Cancer Research Center, Seattle, WA Ms. Audrey Chiang, Asian Pacific Environmental Network, Oakland, CA Ms. Angela Chung, US EPA, Washington, D.C. Mr. Wayne Clifford, Washington State Dept. of Health, Office of Shellfish Programs Mr. Floyd Davis, Accountant, Refugee Federation Service Center Dr. David L. Eaton, Director, UW-NIEHS Center for Ecogenetics and Environmental
Health Ms. Sharon Elliott, Manager, UW-NIEHS Center for Ecogenetics and Environmental
Health Mr. Seng Nguon Eng, Social Services Coordinator, Refugee Federation Service Center Governor Gary Locke Ms. Virginia McFerran, UW-NIEHS Center for Ecogenetics and Environmental Health Mr. Christopher Moffett, Graphic Designer, US EPA, Region 10 Mr. Long Kim Nguyen, President, Vietnamese Association of Greater Seattle Dr. Raphael A. Ponce, Research Scientist, UW Department of Environmental Health Ms. Frances Robinson, UW-NIEHS Center for Ecogenetics and Environmental Health Mr. Jim Simmonds, Water Quality Planner II, King County Water and Land Resources
Division Ms. Yolanda Sindé, Director, Community Coalition for Environmental Justice Mr. Chin Tan, Case Manager, Refugee Federation Service Center Washington State Representative Kip Tokuda

Doc Thompson, Manchester Lab, Environmental Protection Agency, Region 10 Dr. Margaret Tudor, Washington State Department of Fish and Wildlife Ecosystem
Education Washington State Representative Velma Veloria Ms. Kristine Wong, Community Coalition for Environmental Justice Ms. Cissie Yan, Administrative Assistant, Indochina Chinese Refugee
Association
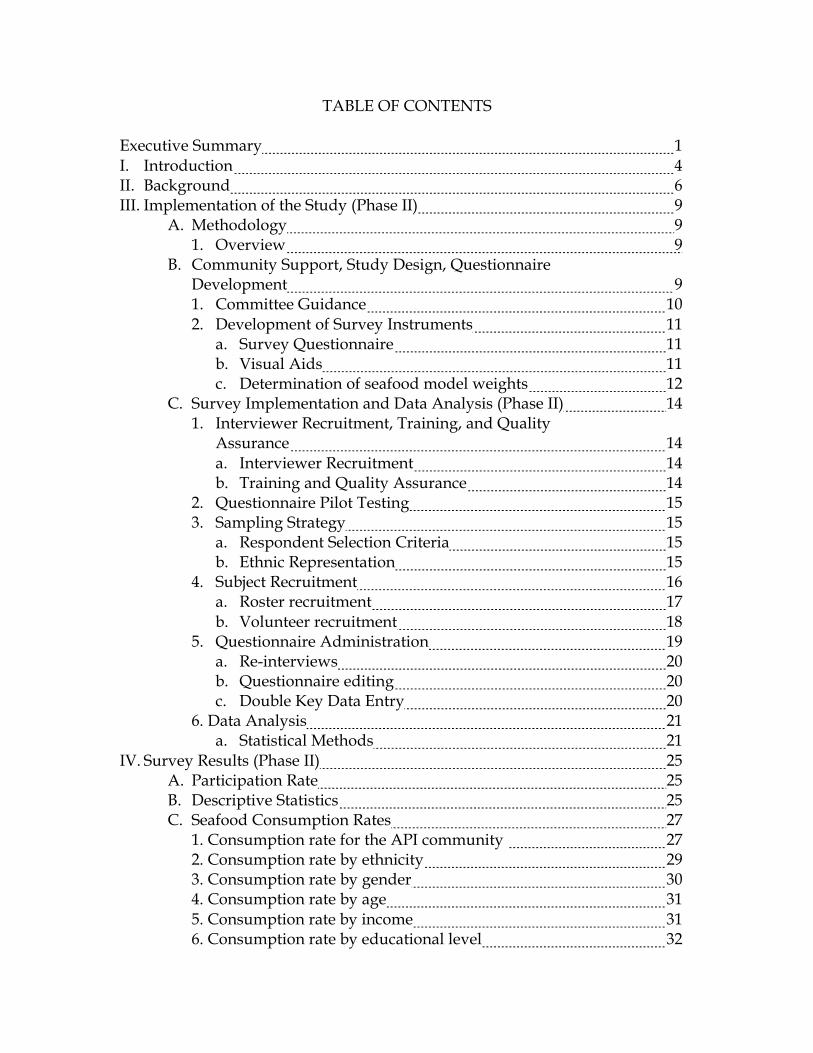
TABLE OF CONTENTS
Executive Summary 1 I. Introduction 4 II. Background 6 III. Implementation of the Study (Phase II) 9
A. Methodology 9 1. Overview 9
B. Community Support, Study Design, Questionnaire Development 9 1. Committee Guidance 10 2. Development of Survey Instruments 11
a. Survey Questionnaire 11 b. Visual Aids 11 c. Determination of seafood model weights 12
C. Survey Implementation and Data Analysis (Phase II) 14 1. Interviewer Recruitment, Training, and Quality
Assurance 14 a. Interviewer Recruitment 14 b. Training and Quality Assurance 14
2. Questionnaire Pilot Testing 15 3. Sampling Strategy 15
a. Respondent Selection Criteria 15 b. Ethnic Representation 15
4. Subject Recruitment 16 a. Roster recruitment 17 b. Volunteer recruitment 18
5. Questionnaire Administration 19 a. Re-interviews 20 b. Questionnaire editing 20 c. Double Key Data Entry 20
6. Data Analysis 21 a. Statistical Methods 21
IV. Survey Results (Phase II) 25 A. Participation Rate 25 B. Descriptive Statistics 25 C. Seafood Consumption Rates 27
1. Consumption rate for the API community 27 2. Consumption rate by ethnicity 29 3. Consumption rate by gender 30 4. Consumption rate by age 31 5. Consumption rate by income 31 6. Consumption rate by educational level 32
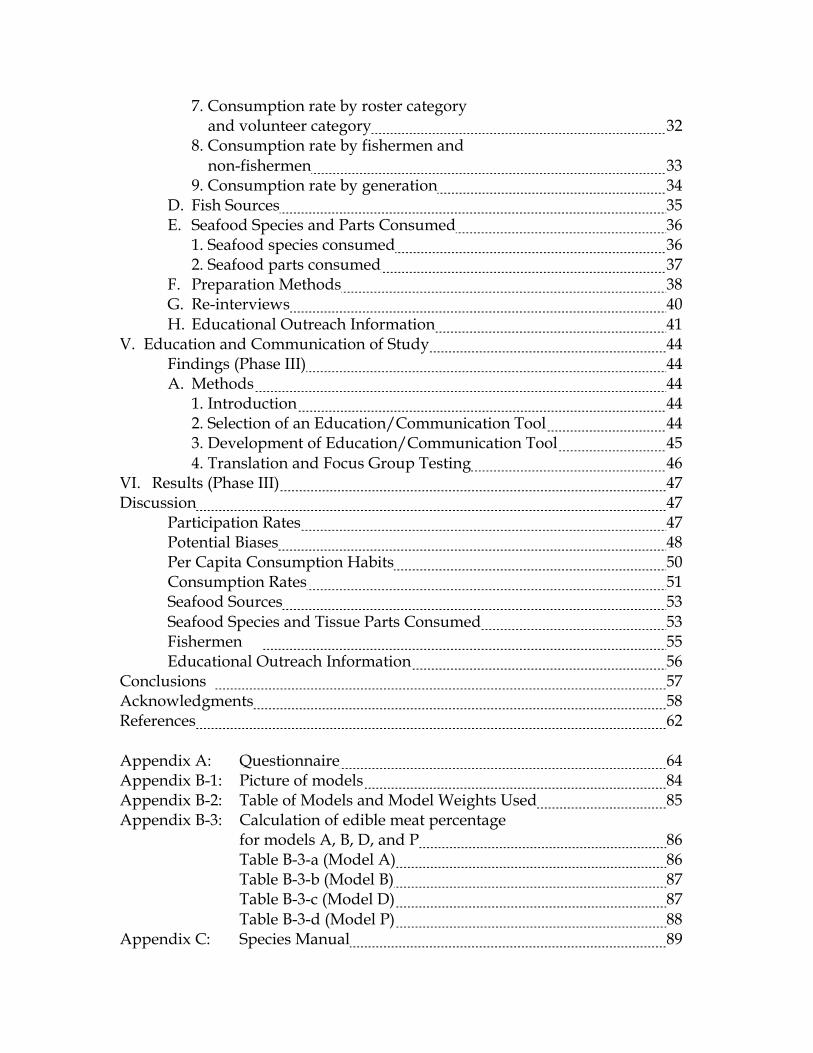
7. Consumption rate by roster category and volunteer category 32
8. Consumption rate by fishermen and non-fishermen 33
9. Consumption rate by generation 34 D. Fish Sources 35 E. Seafood Species and Parts Consumed 36
1. Seafood species consumed 36 2. Seafood parts consumed 37
F. Preparation Methods 38 G. Re-interviews 40 H. Educational Outreach Information 41
V. Education and Communication of Study 44 Findings (Phase III) 44 A. Methods 44
1. Introduction 44 2. Selection of an Education/Communication Tool 44 3. Development of Education/Communication Tool 45 4. Translation and Focus Group Testing 46
VI. Results (Phase III) 47 Discussion 47
Participation Rates 47 Potential Biases 48 Per Capita Consumption Habits 50 Consumption Rates 51 Seafood Sources 53 Seafood Species and Tissue Parts Consumed 53 Fishermen 55 Educational Outreach Information 56
Conclusions 57 Acknowledgments 58 References 62
Appendix A: Questionnaire 64 Appendix B-1: Picture of models 84 Appendix B-2: Table of Models and Model Weights Used 85 Appendix B-3: Calculation of edible meat percentage
for models A, B, D, and P 86 Table B-3-a (Model A) 86 Table B-3-b (Model B) 87 Table B-3-c (Model D) 87 Table B-3-d (Model P) 88
Appendix C: Species Manual 89
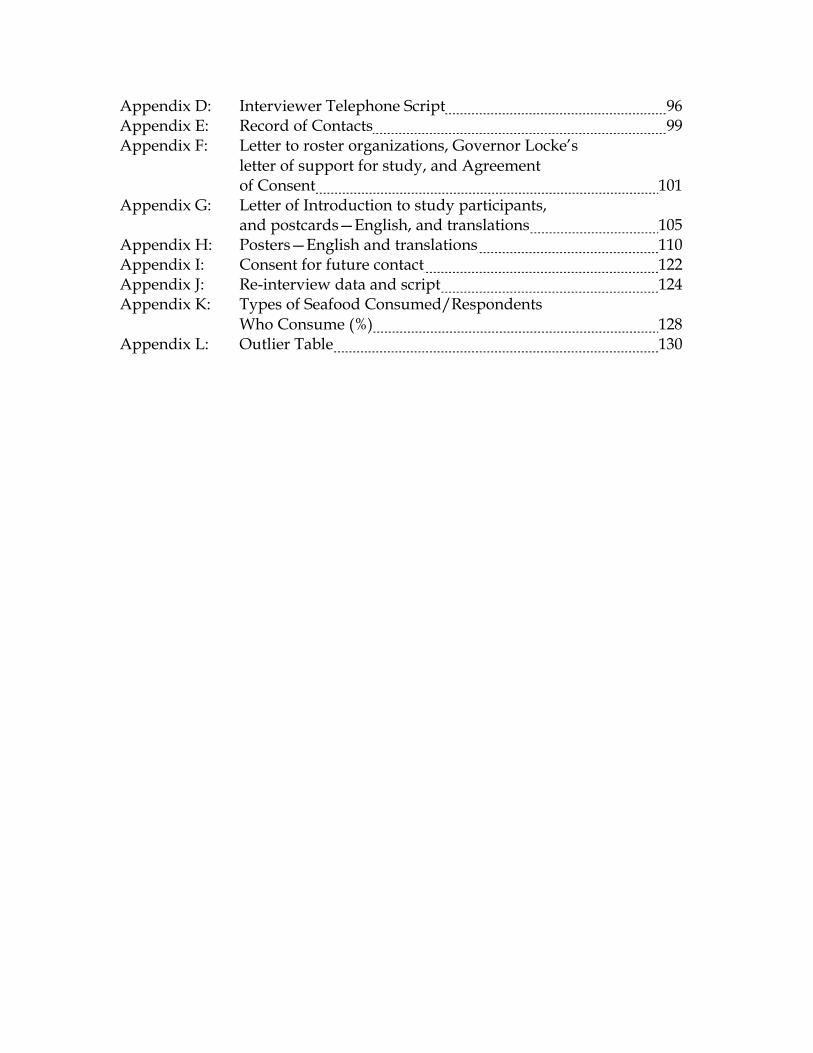
Appendix D: Interviewer Telephone Script 96 Appendix E: Record of Contacts 99 Appendix F: Letter to roster organizations, Governor Locke’s
letter of support for study, and Agreement of Consent 101
Appendix G: Letter of Introduction to study participants, and postcards—English, and translations 105
Appendix H: Posters—English and translations 110 Appendix I: Consent for future contact 122 Appendix J: Re-interview data and script 124 Appendix K: Types of Seafood Consumed/Respondents
Who Consume (%) 128 Appendix L: Outlier Table 130
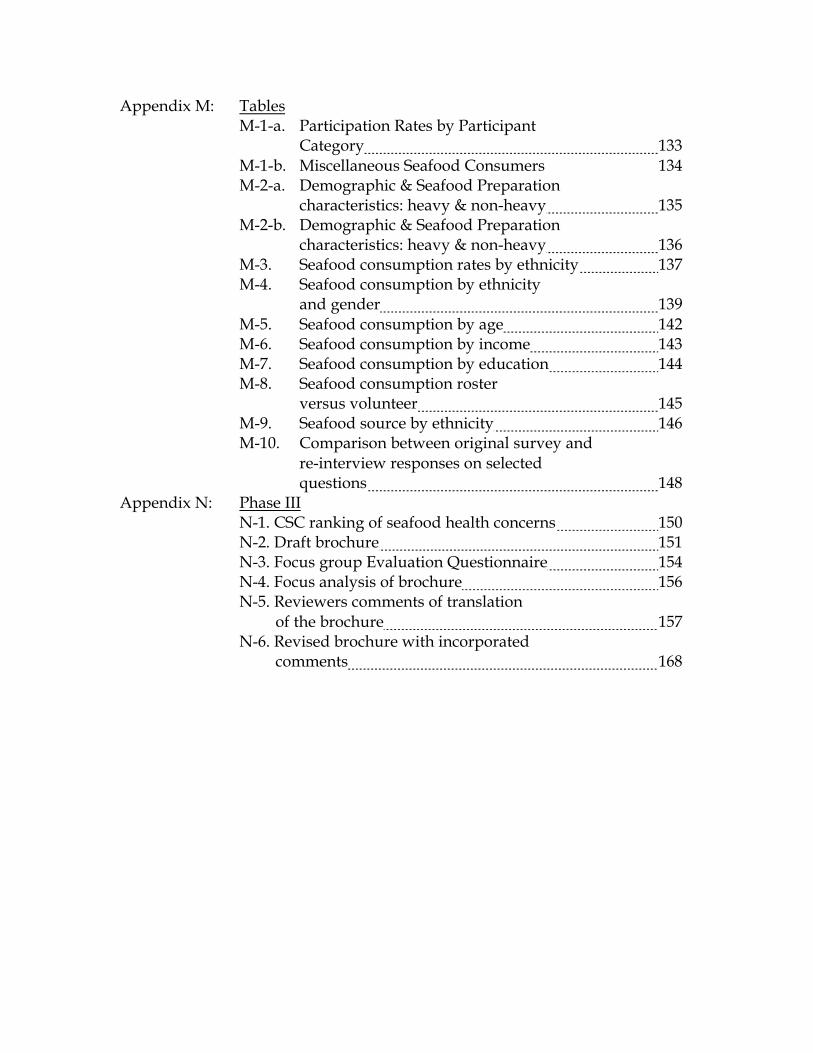
Appendix M: Tables M-1-a. Participation Rates by Participant
Category 133 M-1-b. Miscellaneous Seafood Consumers 134 M-2-a. Demographic & Seafood Preparation
characteristics: heavy & non-heavy 135 M-2-b. Demographic & Seafood Preparation
characteristics: heavy & non-heavy 136 M-3. Seafood consumption rates by ethnicity 137 M-4. Seafood consumption by ethnicity
and gender 139 M-5. Seafood consumption by age 142 M-6. Seafood consumption by income 143 M-7. Seafood consumption by education 144 M-8. Seafood consumption roster
versus volunteer 145 M-9. Seafood source by ethnicity 146 M-10. Comparison between original survey and
re-interview responses on selected questions 148
Appendix N: Phase III N-1. CSC ranking of seafood health concerns 150 N-2. Draft brochure 151 N-3. Focus group Evaluation Questionnaire 154 N-4. Focus analysis of brochure 156 N-5. Reviewers comments of translation
of the brochure 157 N-6. Revised brochure with incorporated
comments 168
EXECUTIVE SUMMARY
PURPOSE
The primary purpose of this study was to describe Asian and Pacific Islander
(API) seafood consumption rates, species, and seafood parts commonly consumed and cooking methods. This information is needed to allow the API
community in the Pacific Northwest to determine what risks it may face from
seafood and to balance such risks with the significant health and cultural benefits associated with seafood consumption. This study was a first step towards
gathering necessary information for such a risk assessment. Study aims also
included development of culturally appropriate health messages related to seafood consumption and the field testing of this information within the API
community.
METHODS
This work was made possible only because of the willingness of API community
leaders and the Refugee Federation Service Center to work in partnership with the University of Washington—National Institute for Environmental Health
Sciences (UW-NIEHS) Center for Ecogenetics and Environmental Health,
Community Outreach and Education Program.
Description and quantification of seafood consumption habits with the API
community was conducted in three phases. Phase I was considered a planning phase, and focused on identifying target ethnic groups and developing an
appropriate questionnaire. This work was accomplished prior to the initiation of
the study reported here and was published as a U.S. EPA Report (Asian and Pacific Islander Seafood Consumption Study, EPA 910/R-96-007, August 1996).
Phase II, which is detailed in this report, focused on the characterization of seafood consumption patterns of ten API ethnic groups (Cambodian, Chinese,
Filipino, Hmong, Japanese, Korean, Laotian, Mien, Samoan, and Vietnamese)
within King County, Washington. Participants were first or second generation members of the above ethnic groups, 18 years of age or older, who lived in King
County, Washington, and were seafood consumers. Data were collected using a survey questionnaire that was developed in English and later translated into the
respondents’ native languages. The surveys were administered by trained
bilingual interviewers recruited from the API community. The questionnaire solicited information about the types of seafood consumed, the source of the
seafood, the preparation of seafood, the frequency and portion size of
consumption by the respondents, demographic information, and educational approaches preferred by the respondents. Two hundred participants were
sought, and two selection methods were used. First, volunteers were recruited
for a “Dietary Habits Study” and from those volunteers participants were randomly selected. Second, religious and API community organizations donated
membership rosters from which potential participants were randomly selected
and contacted.
Phase III, also detailed within this report, focused on the development of
culturally appropriate health messages related to seafood consumption risks and the dissemination of this information to the API community. The technical
expertise of the Advisory and Technical Committees was linked to the cultural
expertise of the Community Steering Committee to develop an appropriate health education strategy. These efforts culminated in a multi-lingual brochure
that highlighted five key public health messages. The brochure was then tested
through an API focus group.
RESULTS
The majority of the 202 respondents (89%) were first generation (i.e., born
outside the United States). There were slightly more women (53%) than men (47%), and 35% lived under the 1997 Federal Poverty Line. In general, the API
members consumed seafood at a very high rate. The average overall
consumption rate for all seafood combined was 1.891 grams/per kilogram body weight/day (g/kg/day) , with a median consumption rate of 1.439 g/kg/day.
The predominant seafood consumed was shellfish (46% of all seafood). Seafood
consumption based on gender, age, income, and “fishermen” status did not differ significantly.
First generation APIs consumed more fish than the second generation APIs in all the fish categories, except pelagic fish -- the consumption rates being statistically
different for freshwater fish and shellfish. In general, members of the
Vietnamese and Japanese communities had the highest overall consumption rates of all seafood; and the Mien, Hmong, and Samoan communities consumed
the least amount of seafood.
The proportion seafood harvested (rather than purchased commercially) by API
community members varied from a low of 3% to a high of 21%, depending on
the seafood type. Differences were observed among the ethnic groups, with Japanese, Chinese, Filipino, and Korean groups consuming more seafood that
was purchased commercially. Members of the Mien, Hmong, and Laotian
communities seemed to harvest seafood more often than other ethnic groups. Salmon, tuna, shrimp, crab, and squid were the most frequently consumed
seafood. Skin was consumed with fillets 55% of the time, and crabs were eaten
with their butter 43% of the time. Seafood cooking fluids were commonly drunk or used in cooking. These customs suggest that risk assessment methods include
toxic chemical measurements in these tissues.
The study results also indicated that members of the API community were
interested in learning more about health issues surrounding eating fish, the
safety of seafood from Puget Sound (the water body surrounding King County), and the safe preparation methods of seafood. The learning methods preferred by
the APIs were book/pamphlets (69%), verbal communication (55%), and video
presentation (35%). Community newspapers/newsletters were the most preferred information source (75%), followed by television (65%) and word of
mouth (60%).
The public health messages developed during Phase III of the study were
generally well received by API community focus groups. The brochure was
viewed as helpful in decision making, and the presentation was considered clear and precise. Corrections and recommendations resulting from the focus group
process have been incorporated into the final version of the brochure.
I. Introduction
Asian and Pacific Islanders (API), people having origins in the Far East, Southeast Asia, the Indian subcontinent, or the Pacific Islands, represent one of
the most diverse and rapidly growing immigrant populations in the United
States. In 1997 API’s (166,000 people) accounted for 10% of the King County, Washington population, an increase from 8% in 1990. Between 1990 and 1997,
the total population of King County increased 9% while the population of API’s
increased 43% (State of Washington Population Trends, 1998).
API immigrants and refugees consider seafood collection and consumption as
healthy activities that reflect a homelike lifestyle and may fish for economic necessity. For these reasons, API immigrants have been hypothesized to
consume greater quantities of seafood, differing species, and differing parts of
seafood than the general United States (U.S.) population. Such cultural behaviors may increase their risk of toxic chemical exposure, especially among
subsistence fishermen who obtain seafood in polluted urban sites. Yet, the API
community has little information on the potential contamination in seafood consumed. Cultural and economic factors may put recent API immigrants at
greater than expected risk from environmental exposures.
Seafood consumption risk assessments within ethnic groups require specialized
survey tools because of cultural and language differences, as well as varying
consumption and acquisition habits. Only a few cases in the western United States for which reports are available: e.g., the Columbia River Inter-tribal
Fisheries Commission (CRITFC), the Tulalip and Squaxin Island Tribes, and the
Laotian Community of West Contra Costa County, California (CRITFC, 1994; Toy et al, 1996; Chiang, 1998, respectively). The CRITFC survey (1994) included
selected tribes in Washington and Oregon and estimated per capita consumption
at the 50th and 90th percentile of 41.5g/day and 127.2g/day, respectively. Fish consumption surveys were administered and reported jointly for a total of over
200 members of the Tulalip Tribes and Squaxin Island Tribe of the Puget Sound
Region (Toy, 1996). The results showed that the median daily per capita consumption rates for men were
53 g/day and 66 g/day for the two tribes, while women consumed a median rate of 34 g/day and 25 g/day, respectively.
Chiang (1998) surveyed the Laotian community (Laotian, Mien, Khmu, Thaidum) residing in the eastside of San Francisco Bay, in West Contra Costa
County, California, using a “usual intake” consumption survey and calculated a
mean per capita seafood consumption rate of 18 g/day. Chiang also reported that among 229 Laotian survey participants (87% of whom consumed seafood at
least one time per month), fish skin was “always” consumed by 76% and
“sometimes” by 23%; the head was “always” consumed by 20% and “sometimes” by 47%; and organs were “always” consumed by 6% and
“sometimes” consumed by 41%.
Considerable uncertainty regarding seafood consumption rates among APIs
exists because studies reporting API seafood consumption and habits are few
and use different methodologies. However, these studies are valuable for providing insight into the scope of potential exposures. Javitz used 1973-74
National Purchase Dietary data to calculate a mean per capita seafood
(fresh/estuarine/marine) consumption rate for “orientals” (21 g/day). Three surveys conducted among API fishermen fishing in San Francisco Bay, Santa
Monica Bay, and Los Angeles reported median seafood consumption rates of 43
g/day, 21 g/day, and 71 g/day, respectively (Wong, 1996; Allen, 1996; Puffer, 1982). These studies documented self-harvested seafood consumption rates only
from specific fishing sites over varying periods of time (7 days, 4 weeks and
“usual intake” per year, respectively).
The U.S. EPA uses differing consumption rates depending on the regulatory
program for which the assessment is being developed. Fish and seafood consumption rates are adopted only as U.S. EPA policy with varying degrees of
non-EPA review and input. The consumption rate which may have received the
most intense scrutiny due to publication in the Federal Register and a subsequent comment period is the value included in EPA's ambient water quality criteria
(AWQC) recommendations developed under section 304(a) of the Clean Water
Act. In 1980, a national average consumption rate of 6.5 grams per day (g/day) of fish and shellfish from estuarine and freshwaters was recommended. This is
the currently used value. This rate was based on the mean per capita (both consumer and non-consumers) consumption rate of freshwater and estuarine
finfish and shellfish from 3-day diary results that were reported in the 1973-74
National Purchase Diary Survey (Javitz, 1980). Proposed revisions to the AWQC methodology include a tiered approach for choosing an appropriate
consumption rate (Federal Register: August 14, 1998). The results from local or
regional seafood intake surveys are preferred, while the last preference is use of defaults based on the 1989-91 Continuing Survey of Food Intake by Individuals
(CSFII, 1990) data: 17.8g/day for the general adult population and sport fishers,
and 86.3/day for subsistence fishers.
The U.S. EPA national Superfund program’s policy is to assume an ingestion rate
of 54g/day for high consumers of locally caught fish (OSWER). Region 10 of the U.S. EPA, which includes the State of Washington, recommends the use of
results from local or regional seafood intake surveys for use in the regional
Superfund program (U.S. EPA, 1991).
The U.S. EPA Exposure Factors Handbook which can be used by any federal or
state program recommends a mean and 95th percentile for the general U.S. population of 20.1 g/day and 63 g/day, respectively (U.S. EPA, 1997). For
Native American subsistence populations the recommended value for mean
intake is 70 g/day and the recommended 95th percentile is 170 g/day.
The Washington State Department of Ecology recently recommended a statewide
default of 177g/day to protect all Washington residents including the highest consumers, subsistence fishers (Washington Department of Ecology, 1999).
II. Background
Because of an increasing awareness in the risk of consuming certain seafood in
the API community, the API community in King County, Washington, initiated a study to characterize seafood consumption patterns within their community.
The uniqueness of this evaluation included: 1) the community based approach
throughout the study; 2) the large number of ethnic groups participating; and 3) the partnership and interaction between the community and the researchers.
The Refugee Federation Service Center (RFSC), which is the largest social aid organization for recent immigrants and refugees in King County, Washington,
was established in 1982 by refugees for the provision of social services with an
initial budget of $60,000. Today, the agency is a thriving organization and operates three facilities with a budget over $1 million. The agency is managed
and staffed by refugees and remains a community-based organization through
its affiliated seven Mutual Assistance Associations: Coalition of Lao Mutual Assistance Association, East European Association, Ethiopian Community
Mutual Association, Khmer Community of Seattle-King County, Vietnamese
Friendship Association, Indochina Chinese Refugee Association, and Eritrean Community of Seattle and Vicinity. The agency’s most unique aspect is that the
bilingual/bicultural staff and volunteers provide comfort that comes with
speaking the native tongue and true understanding of what it means to be a refugee and an immigrant. The staff are familiar with the difficult transition to
life in the U.S., culturally specific coping mechanisms, and specific concerns of
their communities. In 1995 the RFSC identified seafood consumption and subsequent contamination as a chief environmental justice issue of the API
community.
The study documented in this report involved ten API ethnic groups
(Cambodian, Chinese, Filipino, Hmong, Japanese, Korean, Laotian, Mien,
Samoan, Vietnamese) within King County, Washington. The community played an important role in the study, from the initiation of the study to the final report.
During the study period, the researchers had frequent interactions with the
community because the researchers viewed the study as “by the API community,” instead of “for the API community.” This interaction and
cooperation helped the study team in its understanding of community concerns
and therefore gained the support of the community, which was vital for the completion of this study involving ten ethnic groups with diverse cultural
backgrounds.
The Refugee Federation Service Center and the University of Washington’s
Environmental Health Department collaborated with three instrumental
committees to develop the study. The planning, design, and development were conducted by a Community Steering Committee comprised of members
representing each ethnic group. A Technical and an Advisory Committee also shared responsibility in the design of the study. The Technical Committee was
responsible for providing technical assistance, while the Advisory Committee
provided recommendations to ensure the final study would be relevant to regulatory agencies, the medical field, industry, and businesses.
Description and quantification of seafood consumption habits among API’s in King County, Washington, was accomplished in three phases. The first, Phase I,
consisted primarily with identifying the target ethnic groups, modification of the
fish consumption and acquisition survey questionnaire used in the Tulalip and Squaxin Island Tribes Fish Consumption study (Toy, 1996) to be culturally
appropriate and accurate for the API community, and the translation of the
questionnaire into the native languages for the ethnic groups being identified. The first phase of the study has been presented in the technical report to U.S.
EPA (EPA, 1996).
Phase II and Phase III of the evaluation, which were conducted jointly by the
Refugee Federation Service Center and the University of Washington National
Institute for Environmental Health Sciences (UW-NIEHS) Center for Ecogenetics and Environmental Health, were funded by the U.S. EPA Environmental Justice
Community/University Partnership Grant No. 66-604, and are described in this
report. The specific purposes of Phase II were to: 1) document the seafood consumption pattern and consumption rate of the API community; 2) document
the sources of fish consumed by API members; and 3) document educational
approaches appropriate for the API community. The goals of Phase III were to: 1) identify culturally acceptable health messages related to seafood, 2) develop a
brochure on seafood related health risks jointly with the community, and 3) field
test the brochure within the API community for understandability and cultural appropriateness.
III IMPLEMENTATION OF THE STUDY (PHASE II)
A. METHODOLOGY
1. Overview
This study characterizes seafood consumption patterns of ten API ethnic groups (Cambodian, Chinese, Filipino, Hmong, Japanese, Korean, Laotian, Mien,
Samoan, Vietnamese) within King County, Washington. Participants were first or
second generation members of the above ethnic groups, 18 years of age or older, who lived in King County, Washington. Data were collected using a survey
questionnaire that was developed in English and later translated into the
respondent’s native language. The surveys were administered by trained bilingual interviewers recruited from the API community. The questionnaire
solicited information about the types of seafood consumed, the source of the
seafood, the preparation of seafood, the frequency of and portion size consumption by the respondents, demographic information, and educational
approaches preferred by the respondents.
The study was conducted in three phases. While this report mainly addresses
only Phases II and III, a brief discussion of Phase I is included for background
and will assist the readers in understanding the approach and results contained in this report. To promote reading clarity, some aspects of this study’s
methodology appear in appendices.
B. COMMUNITY SUPPORT, STUDY DESIGN, QUESTIONNAIRE DEVELOPMENT (PHASE I)
The purpose of Phase I was: 1) to develop a framework which would interest and
involve API leaders in a seafood consumption and acquisition study; and 2) to
develop a culturally acceptable survey instrument. To achieve these goals, three committees were formed by the Study Coordinator (SC) at the RFSC. The SC
was a resident of the local API community and belonged to one of the ethnic
groups included in the study.
1. Committee Guidance
The Community Steering Committee (CSC). This committee’s function was
twofold: 1) to provide recommendations on specific cultural issues such as how
to approach the community, language, and key concerns of the community; and 2) to provide community contacts that would enable the networking and
outreach efforts of the study’s staff. The fifteen members of the committee each
belonged to at least one of the ethnic groups being surveyed and had an affiliation with one or more community organizations (e.g., health care,
education, religious or social organizations) within his or her respective
community. Certain ethnic groups (e.g., Cambodian, Laotian, Vietnamese, Hmong and Mien) felt a strong vested interest in this study and sent more than
one member.
Technical Committee. The Technical Committee was responsible for: 1) advising
the design of a scientifically sound questionnaire that took into account the
cultural and language characteristics identified by the CSC for the ethnic groups involved; and 2) providing technical assistance to the CSC for the feasibility and
planning of the study. Members included representatives from the U.S. EPA,
King County Health Department, UW School of Fisheries, UW School of Public Health and Community Medicine, Washington (WA) State Department of
Health, WA State Department of Ecology, and two representatives from firms
(Steven Gilbert, Ph.D., BioSupport, Inc. and Gregory L. Glass, Environmental Consultant).
Advisory Committee. The Advisory Committee’s function was to provide recommendations to ensure that final documentation of the study would be
relevant and applicable to different interested agencies and ethnic groups.
Members of the Advisory Committee included representatives of industry, health care, and regulatory agencies. Represented agencies included the Boeing
Company, U.S. EPA, Puget Sound Keepers Alliance, National Oceanic and
Atmospheric Administration, Washington State Department of Ecology, and the Community Coalition for Environmental Justice.
2. Development of Survey Instruments
a. Survey Questionnaire
The Community Steering Committee deemed the use of creel, mail, or telephone
surveys as culturally inappropriate and indicated that APIs would be unlikely to participate. Therefore, a face-to-face interview survey questionnaire was
developed based on an earlier study by the Tulalip and the Squaxin Island Tribes
of Washington (Toy et. al., 1996). The modification of this questionnaire was mostly completed in Phase I. The Community Steering Committee was
instrumental in guiding the selection of seafood species most often consumed by
API as well as usual preparation methods and seafood tissue parts most frequently consumed. Minor modifications of the questionnaire also occurred
early in Phase II, for example, inclusion of 4 educational outreach questions.
Appendix A contains the final questionnaire used in this study.
The questionnaire was first developed in English and subsequently translated into the languages of the ten ethnic groups. Focus groups tested the
questionnaire within six ethnic groups (Cambodian, Laotian, Samoan, Korean,
Filipino, Vietnamese) for content, format, wording, language, accuracy of translation, presentation, and use of visual displays during the development
stage of the questionnaire. The focus group’s feedback was used to enhance the
questionnaire before it was finalized.
The final questionnaire covered selected demographic information of the
respondents, the frequency and portion size for each seafood consumed by the respondent, the sources of the seafood, the preparation methods, and specific
tissue parts consumed (for example, consumption of finfish skin, hepatopancreas
of crabs, etc).
b. Visual Aids
To maximize the recall reliability in the survey, visual aids for administering the
questionnaire were also developed during Phase I. One aid was plaster models
of seafood representing approximate portion sizes (pre-cooked) of the different species. Appendix B-1 contains a picture of these models, and Appendix B-2
describes the weight of each model used for calculation of seafood consumption rates. A second aid was the species manual (Appendix C), a collection of pictures
of the different seafood species. The manual was used to assist respondents in
identifying particular species of seafood. Pictures were obtained mainly from the Washington State Department of Fish and Wildlife, Fishing in Washington, 1996
pamphlet edition. A copy of this booklet is provided with the purchase of every
fishing or shellfish collecting license. Pictures were available for most of the species, except snowfish and moonsnail. For moonsnail, actual moonsnail shells
were available and therefore used. The species manual was especially important
for the API community because the names of some species (e.g., cockles, butter clams) could not be precisely translated as they are not generally collected or
consumed in some respondents' native countries. The manual also included a
map of the Puget Sound area. Interviewers used the map to help respondents identify seafood acquisition locations. Seafood “caught from Puget Sound” was
defined by interviewers as seafood caught within King County, Washington
which borders on Puget Sound; and seafood “caught from outside Puget Sound” as defined as seafood from all other areas, including non-King County Puget
Sound locations. The expanse of Puget Sound goes far beyond the confines of
King County, therefore to avoid confusion in this report, fishing areas will be referred to as: within King County and outside of King County.
c. Determination of seafood model weights.
Plaster models were cast from fish purchased from markets. Individual models could not be provided for the 21 finfish included in the survey. Therefore, all 21
finfish were represented by four models (Models A through D shown in
Appendix B-1). The models represented the appropriate body shape and preferred fish size for a group of finfish. The selection of models and preferred
fish size was determined by consensus of the CSC. Essentially, their guidance
was that a fish must fit on a serving plate and effective models must be similar in body shape to the finfish in question, but did not have to be exact replicas in
order to evoke recognition. Model A was the broad-bodied fish shape which was
cast from a tilapia, and represented a serving of snapper, snowfish, rockfish, crappie, perch, bass, or tilapia. Model B was the narrow-bodied fish shape which
was cast from a trout, and represented salmon, catfish, carp, sturgeon, and
suckers. Model C, the skinned fillet model, represented a typical serving of tuna, halibut, or cod. Model D symbolized small, narrow-bodied fishes that the CSC
advised were eaten whole or with the head attached, and represented smelt,
dogfish, and herring. Other seafoods were individually represented by 16 models except that abalone and scallop were represented in one model, and
shrimp and lobster were represented in one model.
The weights used in the consumption rate calculations are shown in Appendix B-
2. For models A, B, and D the measured weight in ounces of the uncooked fish
from which the model was cast was multiplied by an ounces to grams conversion factor (28.35) and the percentage of edible meat in the whole body. The edible
meat percentage was determined by methods described in Appendix B-3. The
weight for model C was the measured weight of the uncooked fillets of the same approximate size. The weight of the shellfish (models J, K, L, M, N, O and T
representing manila, macoma, horse, razor, geoduck and butter calms, and
cockles, oysters, mussels and moonsnails, respectively) were the measured weights of the edible tissues after cooking and removal from the shell. The
weights for models I, E, F, R, S and H (abalone/scallop, sea urchin,
shrimp/lobster, squid, sea cucumber and fresh seaweed/kelp, respectively) were the measured weights of uncooked samples of the same size. The weight for
model G (dried seaweed) was the weight stated on the packaging. The weight for
model P (crab) was determined from cooked crab meat plus crab “butter”. (See
Appendix B-3). Crab “butter” consisted of the yellowish liquid and all of the
easily removable soft tissue when the carapace is gently removed from the crab
body. The carapace is removed by turning the crab body upside down or tipping it sideways. The manner in which the carapace is removed intentionally
captures as much of the yellowish liquid as possible, and the carapace, itself, may
be used as a bowl to sip the liquid.
C. SURVEY IMPLEMENTATION AND DATA ANALYSIS (PHASE II)
The implementation of the survey and the data analyses were carried out in
Phase II. Phase II included the recruitment and training of bilingual interviewers, questionnaire pilot testing and revision, development of sampling
strategies, participant recruitment, survey administration, and the data analysis.
1. Interviewer Recruitment, Training, and Quality Assurance
c. Interviewer Recruitment
The RFSC study coordinator recruited ten interviewers. The job openings were announced in local API newspapers and social service organizations around
King County. Job announcements were placed in API newspapers, flyers, and
posted on local college and university campuses. The Community Steering Committee also recommended applicants. Each interviewer had to have a
cultural knowledge of at least one of the ten ethnic communities and be fluent in
both English and the respective native language.
d. Training and Quality Assurance
Prior to interview, all interviewers attended training on the skills of survey questioning and probing and use of seafood models. The 9-hour training (3 hours
daily for 3 days) was provided by an experienced consultant (Jude Ballard, Fred
Hutchinson Cancer Research Center) who has directed many survey studies. Issues addressed included interviewer tasks, familiarity and proficiency with
questionnaires, use of interview tools (e.g. models, maps), and data collection
consistency. After completing the training, interviewers were required to practice interviewing relatives and friends over a two-week period. Afterwards
they conducted a simulated interview with the RFSC study coordinator (SC)
using the models and manuals. Once the SC deemed the interviewers proficient in their interview and data recording techniques, interviewers were allowed to
begin interviewing survey participants. After each interviewer had administered
two questionnaires to survey participants, the consulting statisticians reviewed the completed questionnaires for data consistency and counseled interviewers to
improve data collection.
2. Questionnaire Pilot Testing
Ten survey pilot tests were conducted by the trained interviewers to assess the
format of the questionnaire and the effectiveness of the seafood models. The test
group had an equal number of males and females, at least one member of each ethnic group, at least one person from three identified age groups (18–39, 40–64,
65+ years), at least 3 members who were first generation Americans and 3 who
were second generation, and at least 2 people who identified fishing or collecting seafood as a major source of seafood consumed. Based on this pilot testing,
translations were modified as needed to improve clarity and cultural
appropriateness. Adjustments included translation corrections, re-phrasing of the questions, and the addition of questions related to cultural holidays.
3. Sampling Strategy
An interview goal of 200 respondents was planned. All respondents needed to
meet pre-defined criteria to be included in the study. In this section, we will
describe the criteria and the selection process of the respondents.
a. Respondent Selection Criteria
Prospective participants of the study needed to meet the following requirements:
1) Membership in one of ten API ethnic groups: Cambodian, Chinese, Filipino, Hmong, Japanese, Korean, Laotian, Mien, Samoan, or Vietnamese;
2) At least 18 years of age;
3) Resident of King County, Washington;
4) Seafood consumer (non-consumers were documented during the recruitment process);
5) First generation (born outside US) or second generation American (at least one of the parents was born outside US).
b. Ethnic Representation
The original sampling strategy specified that the ten API ethnic groups would be
represented in the sample proportionate to their composition as reported in the
1990 US Census data for King County (see Table M-1). The Community Steering
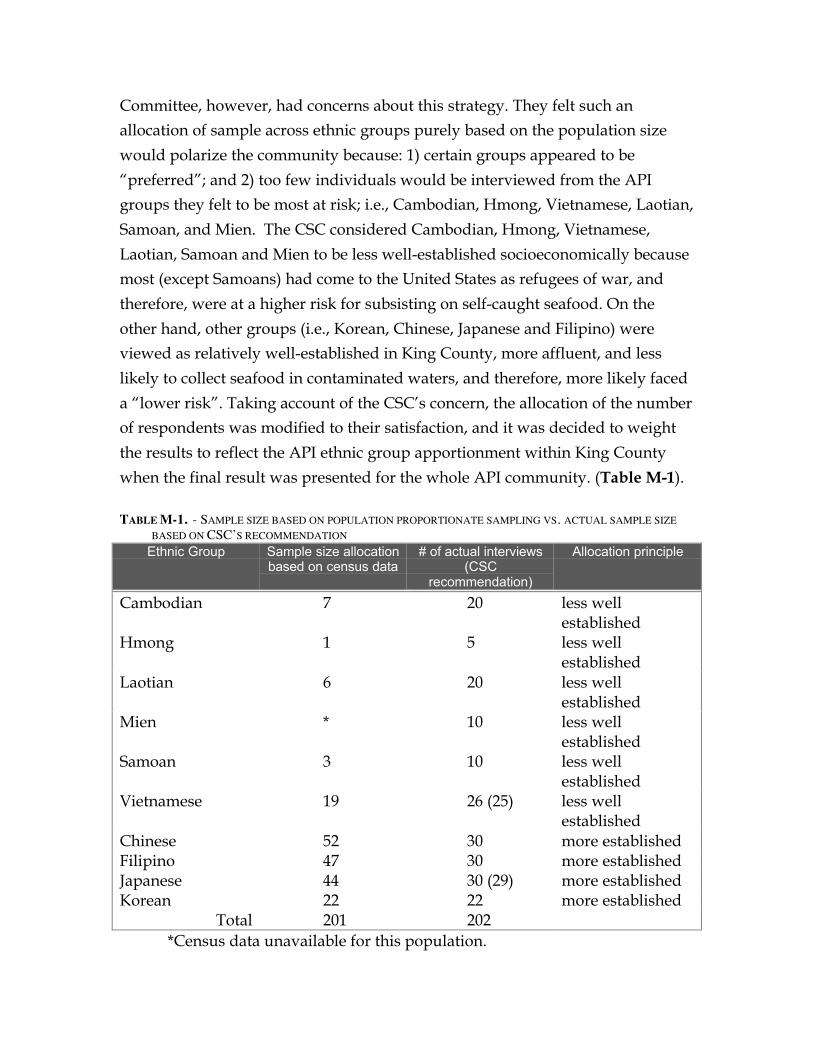
Committee, however, had concerns about this strategy. They felt such an allocation of sample across ethnic groups purely based on the population size
would polarize the community because: 1) certain groups appeared to be
“preferred”; and 2) too few individuals would be interviewed from the API groups they felt to be most at risk; i.e., Cambodian, Hmong, Vietnamese, Laotian,
Samoan, and Mien. The CSC considered Cambodian, Hmong, Vietnamese,
Laotian, Samoan and Mien to be less well-established socioeconomically because most (except Samoans) had come to the United States as refugees of war, and
therefore, were at a higher risk for subsisting on self-caught seafood. On the
other hand, other groups (i.e., Korean, Chinese, Japanese and Filipino) were viewed as relatively well-established in King County, more affluent, and less
likely to collect seafood in contaminated waters, and therefore, more likely faced
a “lower risk”. Taking account of the CSC’s concern, the allocation of the number of respondents was modified to their satisfaction, and it was decided to weight
the results to reflect the API ethnic group apportionment within King County
when the final result was presented for the whole API community. (Table M-1).
TABLE M-1. - SAMPLE SIZE BASED ON POPULATION PROPORTIONATE SAMPLING VS. ACTUAL SAMPLE SIZE BASED ON CSC’S RECOMMENDATION
Ethnic Group Sample size allocation based on census data
# of actual interviews (CSC
recommendation)
Allocation principle
Cambodian 7 20 less well established
Hmong 1 5 less well established
Laotian 6 20 less well established
Mien * 10 less well established
Samoan 3 10 less well established
Vietnamese 19 26 (25) less well established
Chinese 52 30 more established Filipino 47 30 more established Japanese 44 30 (29) more established Korean 22 22 more established
Total 201 202 *Census data unavailable for this population.
4. Subject Recruitment
Because of the diversity of the ethnic groups covered in this study, no known
master list existed for all first and second generation Asian and Pacific Islanders
residing in King County. The lack of a complete sample frame called for a special sampling approach in this study. Particularly, two recruitment methods,
“roster” and “volunteer” approach, were employed (described below). Both
methods were used within each ethnic group, except for the Hmong community, in which all five interviewees were from roster. In the sampling design, the goal
was to obtain one-half of the total participants via each method. In an effort to
reduce possible selection bias based upon participants’ knowledge that the study’s focus was seafood consumption, the study was advertised as a Dietary
Habits Study for Asian Pacific Islanders. A $25 check or grocery store gift
certificate was offered as an incentive for study participation.
Interviewers contacted respondents from a randomly constructed roster and/or
volunteer list by phone to arrange an interview appointment using a prepared telephone script (Appendix D) that was also translated into ten languages.
Interviewers documented their attempts to reach respondents on a record of
contacts; dates, times, and results of calls were recorded (Appendix E). Interviewers were instructed to contact respondents up to five
times, but not to leave messages on answering machines. If unable to speak with
the respondent in person by their fifth attempt, interviewers were to proceed to the next respondent on their list. For a completed interview, the respondent was
paid for their participation.
Once the number of respondents for each ethnic group was determined, the
number of respondents was allocated equally between “rosters” and
“volunteers.” To have a fair presentation of both genders, the percentage of each gender in the 1990 census data was used to decide the number of female and
male respondents for each ethnic group. Similarly, the percentage of people
above and below the median age (1990 census data) of each gender within a specific ethnic group was used to approximately reflect the age composition of
people in each ethnic group.
a. Roster Recruitment
Though no complete list of all API members existed in the community, a variety of roster lists did exist within different API ethnic organizations. These roster
lists in the API community covered a portion of the API members. It was
planned to recruit about half of the respondents from various roster lists in the API community. The SC contacted all known API religious and community
organizations to determine the sizes of their memberships. Based upon these
size estimates, organizations with sixty or more members were asked to share their membership rosters with the study. Approximately 50% of these religious
and community organizations agreed to share their rosters after one introduction
letter and a follow-up call from the SC. To increase participation a second letter was sent out to those who had initial reservations about providing an
organizational roster, which included a letter of support from Governor Gary
Locke, the first Chinese American to be governor in the United States. (Appendix
F.) No additional organizations agreed to participate. Membership rosters from
organizations that agreed to participate were used to randomly select potential
study participants based on the size of the roster list.
Once selected, a letter of introduction was sent to each potential participant
containing two response postcards, one in their native language and the other in English (Appendix G). A bilingual interviewer made a follow-up telephone call
approximately a week later to ascertain the potential participant’s qualifications
(see Section III.C.3.a.), interest, age and gender. If the qualified participant agreed and fit the needed age and gender profile, an interview was arranged.
b. Volunteer Recruitment
Study planners anticipated problems obtaining a sufficient number of
participants through the roster method, as well as possible selection bias based on the membership in a religious organization or community group. Therefore, a
second pool of participants, volunteers, was sought from which to randomly
select the remaining half of the participants needed for the study. This second group of potential participants was referred to as “volunteers.”
Recruitment of volunteers was achieved in a number of ways. Between March and April 1997, press releases were published in API newsletters, local
newspapers, and community organizations' and UW newsletters. Shortly
afterwards, approximately 1000 posters (Appendix H) in the ten ethnic languages and English were posted within King County in areas believed to be
frequented by API members: e.g., groceries, community organizations, churches,
UW campus, and area parking lots. Attached to the posters were bilingual postcards (e.g., if the poster was displayed in a Korean establish-ment, the
postage-paid postcards would be in Korean and English), deliver-able to the UW.
In addition, word of mouth, solicitation from various community and church leaders, and the RFSC staff encouraged and increased the participation in the
study. The volunteer category (from post cards and lists submitted by the RFSC)
identified 476 individuals for the dietary habit survey.
As the postcards were received at the UW, the information provided on the postcard (names, addresses, phone numbers, ethnicity, age, and gender) was
entered into a database maintained in a secure area at UW. The consulting
statisticians then randomly selected volunteers from the database and transmitted the names to interviewers. Letters indicating selection for study
participation were mailed to the selected volunteer category participants, and a
bilingual interviewer contacted them one week later to set up an interview.
As the study progressed, it was discovered that some minor adjustment was
necessary to enable timely completion of the data collection phase. Particularly, the preset age and gender sampling allocations could not be strictly met within
some ethnic groups because of insufficient names on either volunteer or roster
lists. Among Japanese and Cambodian participants, five people from the volunteer category were substituted when sufficient roster members of the
needed gender and age were not available, respectively. Also, within the
Japanese and Filipino groups there was difficulty locating individuals between the ages of 18-37. Therefore, relatives of roster selectees within the same age
group were recruited, though only one study participant per family participated
in the survey.
5. Questionnaire Administration
Interviews were conducted during the spring and summer of 1997 at convenient
locations preferred by the study respondent (e.g., residence, church, restaurants,
respondents' work location, RFSC office). In some cases, the interviews were conducted in the respondent’s native language. During the interviews,
interviewers showed participants seafood models and pictures of seafood to help
respondents identify types of seafood and the portion sizes consumed. Interview duration averaged 59 minutes (range: 25-120 minutes). Respondents who were
interviewed received monetary compensation of $25.00.
a. Re-interviews
During the initial interview, respondents were given the option of signing a
"Consent For Future Contact" form (Appendix I) for a potential re-interview. From these, twenty survey respondents were randomly selected, 10%
proportionately from each ethnic group, e.g. three each from the Chinese,
Japanese and Korean groups, one from the Mien group, etc. for re-interview via telephone using the re-interview questionnaire, which was a subset of the
questions contained in the main survey questionnaire (Appendix J). This re-
interview was used to check the reliability of responses on the earlier survey and participants were selected as soon as all 202 surveys were completed.
Respondents who were re-interviewed received an additional $10 compensation.
b. Questionnaire Editing
Completed surveys were subjected to an editing process between the SC and the
interviewer. This editing process was used to screen and verify answers that
were ambiguous or inconsistent. In the editing process, logic validation of answers (within field checks for values in the possible range and between-field
checks for relationships) was also carried out. The editing was completed before
the questionnaires were sent for data entry.
e. Double-key Data Entry
To minimize the data entry error, a “double key-entry” procedure was employed. The data entry was done initially for all questionnaires. After the first
data entry, the data entry program was set as the “verification” mode and a second round of data entry was done for all data fields and for all questionnaires.
This “verification” mode of the data entry prompted the data entry staff with an
on-screen error message if any inconsistency occurred for the data field being entered.
6. Data Analyses
When the data entry was completed, the data were transferred to the consulting statisticians for data analysis. For each seafood species, the answers of each
respondent were converted into a consumption rate based on the frequency and
the portion size as reported in the survey.
a. Statistical Methods
1) Consumption Rate. Seafood species were categorized into seven groups:
anadromous, pelagic, freshwater, bottom, shellfish, seaweed/kelp, and
miscellaneous seafood (see Appendix K) for surveyed species within each group. Anadromous, pelagic, freshwater and bottom fish were further combined
into the “finfish” category. Finfish, shellfish, and miscellaneous seafood were
used to compute the “all fish” category. “All fish” and “seaweed/kelp” were aggregated into “all seafood.”
The reported total amount consumed per year was computed for each of the
above seafood groups. The daily consumption amount for each person was then
calculated by dividing the annual amount by 365 days. The daily average amount was further adjusted for the body weight of the respondent (based upon
self-reported body weight), yielding a common daily consumption rate across all
respondents (grams/per kilogram body weight/per day, or g/kg/day).
Consumption Rate = (# annual servings x portion size in grams)/
(365 days x kg body weight)
The adjustment was necessary for comparison across different ethnic groups and
across other demographic characteristics. All results will be reported using this common unit of g/kg/day, unless otherwise stated. This unit of “g/kg/day” has
been used and reported in other fish consumption studies as well (Toy, 1996). Non-consumers of a specific fish species were assigned a consumption rate of
zero and were included in the data analysis and reporting.
2) Treatment of outliers. A number of respondents reported unusually large
consumption rates in this study. For example, the largest consumption rate
reported for shellfish was approximately 11.83g/kg/day (see table of Outliers and Substitution in Appendix L). Values such as these represent large but
uncertain consumption rates. Generally, these unusually large values are
referred as “outliers.”
Because outliers may have profound influence on the average and potentially
other summary statistics, special treatment for them is warranted. In this study, the outliers were identified as those with an observed value greater than 3
standard deviations above the mean for consumers of the specific seafood group
of interest. All outliers were identified within each fish category and substituted by a smaller value that equals to the mean plus 3 standard deviations.
The treatment of outliers involved three steps. Firstly, all observed values in individual seafood category (anadromous, pelagic, freshwater, bottom, shellfish,
seaweed/kelp, miscellaneous) that were greater than three standard deviations
(SD) above the mean of all consumers were identified as outliers, and these outliers were then substituted by mean+3SD (the rule of “mean plus three
standard deviations”).
Secondly, after the treatment of outliers for each of the individual seafood
categories, the “all seafood” consumption rate was computed as the sum of all
individual seafood sub-categories. Using the same principle as applied in individual seafood sub-categories, the outliers in the “all seafood” category was
also adjusted downward to a value of mean+3SD.
The last step in the treatment process of outliers involved a re-adjustment of
consumption rates of sub-categories for these respondents who were outliers in
the “all seafood” category. To reflect the fact that the overall “all seafood” rate was the sum of the individual seafood categories, all the individual seafood
categories (the components used in the computation of “all seafood”) were re-adjusted proportionately using the percentage of each sub-category in the “all
seafood” multiplied by the re-adjusted “all seafood” rate.
All results in this report are based on values after the substitution of the outliers.
Appendix L lists specific values that were recoded based on the rules of
treatment of outliers. These values, along with the means and standard errors reported in the tables, are sufficient statistics for recalculation should the reader
wish to recalculate means, standard errors, and confidence intervals, with outlier
values as originally reported.
3) Hypothesis testing and statistical significance. Analyses of consumption rates
(g/kg/day) are presented in terms of mean, standard error, median (the 50th
percentile), and percentiles. The 95% confidence interval on the mean is also
presented for the consumption rates for each ethnicity group. The statistical
significance of difference in consumption rates by ethnicity, gender, age, income level, and fishing activity was also calculated. Due to the occurrence of right
skewed distribution (because of a few fairly large values) in the observed
consumption rates, nonparametric methods, which are based on the ranked data and are more robust against skewness than parametric tests, were used in the
assessment of the statistical significance. When comparing consumption rates
between or across groups, either the Wilcoxon-Mann-Whitney test or the Kruskal-Wallis test was used, depending on the number of groups being
compared (Fisher and Van Belle 1993). In this report, p<0.05 is considered
statistically significant. Since there are many hypothesis tests and associated p-values, some results may be significant by chance alone. Readers are encouraged
to note that no formal methods of adjusting this “multiple testing problem” were
used in this report. Interpretation of statistical significance should take into account the number of tests (p-values) performed in the area of comparison to
the reader.
4) Calculation of means, standard errors, confidence interval, and percentiles of
consumption rates. The arithmetic mean (average) consumption rate
(g/kg/day) was calculated for each ethnic group. All 202 survey respondents
were used in the computation. However, if a respondent did not consume a
specific seafood species, the consumption rate of zero was assigned for the seafood species. The observed standard error was also calculated. The 95%
confidence interval on the mean for each ethnic group was constructed based on
the Student t-distribution. The median (50th percentile) and other percentile were also presented for the ethnic groups with at least ten respondents.
The arithmetic mean, standard error, median, and other percentiles were also calculated for all 202 respondents by gender, by source of respondents (roster list
vs. volunteer), by age group, and by income level.
5) Calculation of means, standard errors, confidence interval and percentiles for
API community using weighted methods. Ten ethnicity groups of the Asian and
Pacific Islander community were included in this survey. When the survey
results were aggregated into the average consumption rate for the whole API
community, different weights were applied to the mean for each ethnic group. The weighting was necessary to adjust for the composition (proportion) of the
ethnic groups in the API community. When the mean consumption rate was computed for the API community, the proportion (Pi) of each ethnicity of the API
community was used as the weight for mean of each ethnicity. This weighting
scheme by population percentage took into account the underlying population
structure of the API community. Specifically, the average consumption rate for the entire API community was calculated as
x = �10
Pi xi . i =1
where xi is the average for the ith group, and Pi is the population percentage of
that ethnic group in the API community. The standard error of the average
consumption rate for API was then computed as
10
SE ( x ) = 2� Pi var( x ) i=1
where var( xi ) is the observed variance for the ith group.
A different weighting scheme was used when the median and other percentiles
were calculated for the entire API community. All observed consumption rates in
a specific ethnic group are applied the same weight -- the ratio of the population
proportion (Pi) of the corresponding ethnicity and the number of the surveys (Pi
/ ni), with Pi the population percentage of that ethnic group in the API
community and ni the number of survey respondents for the ith group. This
weighting scheme for the percentiles took into account both the population proportion and the number of surveys in the sample. The median was then
calculated as the sorted rates (from the lowest to the largest) that corresponded
to the 50th percentile on the accumulated weights across all respondents (all weights add up to 1). Other percentiles were also obtained in the same manner
as the median, using the combination of the sorted consumption rates and the
accumulated weights.
The weighting was only applied in the calculation in the consumption rates for
all 202 respondents combined. No weighting was used for the computation of rates by ethnicity, gender, age, income, education, participant category (roster
versus volunteer), fishing status, generational status or consumption category
(high versus low).
IV Survey Results (Phase II)
A. PARTICIPATION RATE
Survey participation rates differed between the volunteer and roster categories.
Those in the volunteer category had already indicated their willingness to participate by sending in a postcard. Within this group (n=462), interviewers
attempted to contact 150 individuals. Of these, 16% could not be contacted. Of
those contacted, 13% were disqualified because they did not meet all of the selection criteria outlined in Section III.C.3.a. or did not fit into needed age and
gender categories. Excluding the disqualified, the participation rate within the
volunteer group was 96%. Within the roster category 365 contacts were attempted. Of these, 54% could not be contacted, and 14% did not meet selection
criteria. Excluding the disqualified, the participation rate in the roster group was
67% with 33% refusing participation. See table in Appendix M-1-a. Non-consumption of fish was considered a disqualifier for 0% of the volunteer
category and 2% of the roster category.
B. DESCRIPTIVE STATISTICS
The majority of the 202 respondents (89%) were first generation who were born outside the United States. The remaining 11% of the respondents were born in
the United States, but at least one of their parents was born outside the United
States. Forty percent (40%) of the respondents had completed college, and 13% had an education level less than high school.
As described in Table M-1, the 202 respondents in this study came from ten ethnic groups. Of these 202 respondents, there were slightly more women
(n=107, or 53%) than men (n=95, or 47%). The average body weight for men and
women in the sample was 70kg (SD=12kg) and 57kg (SD=13kg), respectively.
However, the sampled Samoans weighed more than other API groups. The average weight was 99kg for Samoan men (n=5, SD=19kg) and 95 kg for Samoan
women (n=5, SD=16kg). The body weight for other ethnic groups was more
homogeneous. The average body weight ranged from 52kg to 63 kg for women in the other 9 ethnic groups, and from 60kg to 73kg for men in the other ethnic
groups. Ninety-six (or 48%) of the respondents were recruited from the
community roster lists, and the remaining 106 respondents (or 52%) were from the volunteer category. The majority of the respondents were under age 55
(n=163, or 81%), and people 55 years or over accounted for 19%.
Household income, reported as income intervals, was provided by 187
respondents. The mid-point of the household income intervals was adjusted for
the number of people in the household and compared with 1997 Federal Poverty Level (FPL). Overall, 35% of the 202 respondents in the sample lived under the
1997 poverty line. However, the percent of respondents living under the FPL was
not uniform among the ethnic groups. A greater percentage of people living under FPL was observed for the Samoan community and those ethnic groups
with the majority members being refugees: Mien, Laotian, Cambodian, and
Vietnamese. Samoan (90%) had the highest percentage of respondents under FPL, followed by Vietnamese (62%), Mien (60%), Cambodian (50%), Laotian
(45%), Korean (32%), Chinese (26%), Filipino (21%), Japanese (6%) and Hmong
(0%). In 1990, the percentage of all API in King County living under the FPL was 14.8%. Respondents recruited from community rosters had a slightly higher
percentage of people living under FPL than the volunteer category respondents (39% versus 32%) did.
C. SEAFOOD CONSUMPTION RATES
1. Consumption rate for the API community
The main object of this study was to estimate the seafood consumption for the
entire Asian Pacific Islander community in King County, Washington. The consumption rates for API were aggregated for the ten ethnic groups included in
this study using the weighting methodology as described in the methods section.
All 202 respondents were fish consumers. Only one person (0.5%) did not eat
shellfish. The percentages of consumers of anadromous, pelagic, freshwater,
bottom fish, and seaweed/kelp were 96%, 97%, 86%, 81%, and 57%, respectively. The relatively low percentage of the respondents eating seaweed/kelp was due
to the fact that seaweed and kelp were primarily consumed by the Chinese,
Japanese, and Korean communities. Only a few members of other API ethnic groups ate seaweed and kelp.
In general, the API members consumed seafood at a very high rate (see Table R-1). The average overall consumption rate for all seafood combined was 1.891
g/kg/day (median 1.439 g/kg/day). The predominant seafood consumed by
API was shellfish (45.9% of all seafood consumed by APIs). The API community consumed more shellfish (average consumption rate of 0.867 g/kg/day) than all
finfish combined (an average rate of 0.819g/kg/day).
Within the category of finfish, pelagic fish were most consumed by the API
members, averaging 0.382 g/kg/day (median 0.215 g/kg/day), followed by
anadromous fish with an average consumption rate of 0.201 g/kg/day (median 0.093 g/kg/day). The average consumption for freshwater fish was 0.110
g/kg/day (median 0.043 g/kg/day), and bottom fish was 0.125 g/kg/day
(median 0.047 g/kg/day).
In addition, to the seafood specifically listed in the questionnaire, survey
respondents were asked if they consumed other types of seafood. For this report,
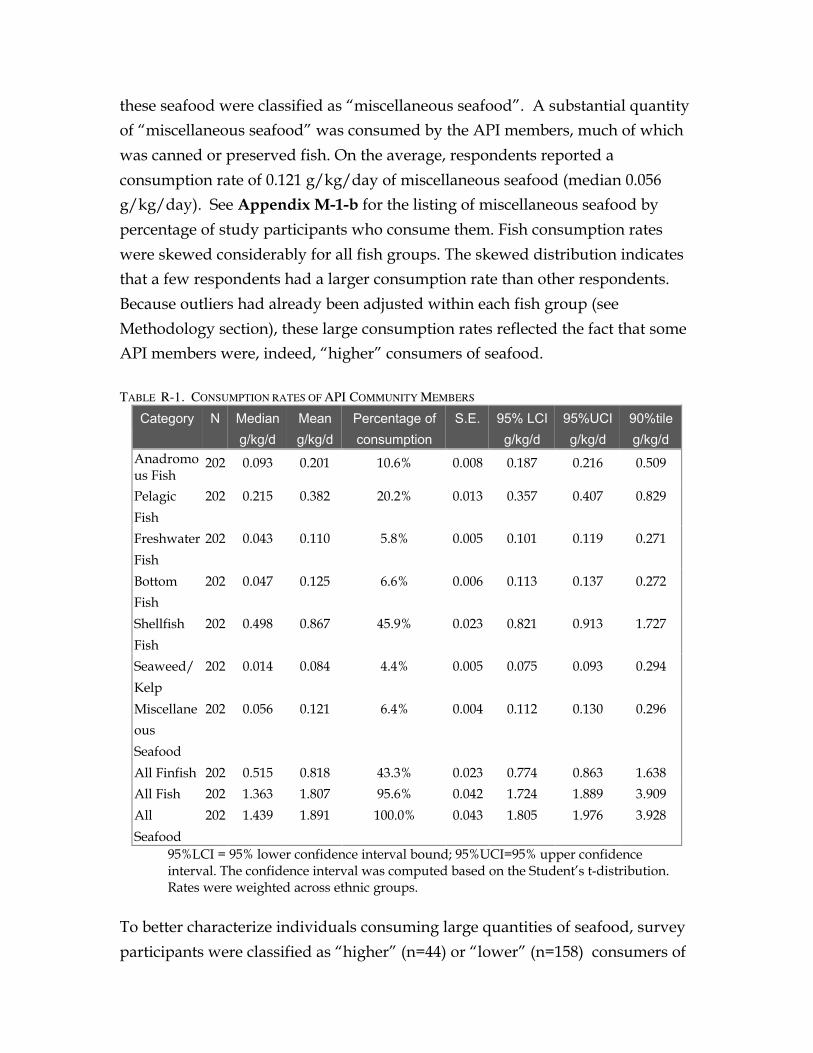
these seafood were classified as “miscellaneous seafood”. A substantial quantity of “miscellaneous seafood” was consumed by the API members, much of which
was canned or preserved fish. On the average, respondents reported a
consumption rate of 0.121 g/kg/day of miscellaneous seafood (median 0.056 g/kg/day). See Appendix M-1-b for the listing of miscellaneous seafood by
percentage of study participants who consume them. Fish consumption rates
were skewed considerably for all fish groups. The skewed distribution indicates that a few respondents had a larger consumption rate than other respondents.
Because outliers had already been adjusted within each fish group (see
Methodology section), these large consumption rates reflected the fact that some API members were, indeed, “higher” consumers of seafood.
TABLE R-1. CONSUMPTION RATES OF API COMMUNITY MEMBERS
Category N Median g/kg/d
Mean g/kg/d
Percentage of consumption
S.E. 95% LCI g/kg/d
95%UCI g/kg/d
90%tile g/kg/d
Anadromo 202 0.093 0.201 10.6% 0.008 0.187 0.216 0.509 us Fish Pelagic 202 0.215 0.382 20.2% 0.013 0.357 0.407 0.829
Fish
Freshwater 202 0.043 0.110 5.8% 0.005 0.101 0.119 0.271
Fish
Bottom 202 0.047 0.125 6.6% 0.006 0.113 0.137 0.272
Fish
Shellfish 202 0.498 0.867 45.9% 0.023 0.821 0.913 1.727
Fish
Seaweed/ 202 0.014 0.084 4.4% 0.005 0.075 0.093 0.294
Kelp
Miscellane 202 0.056 0.121 6.4% 0.004 0.112 0.130 0.296
ous
Seafood
All Finfish 202 0.515 0.818 43.3% 0.023 0.774 0.863 1.638
All Fish 202 1.363 1.807 95.6% 0.042 1.724 1.889 3.909
All 202 1.439 1.891 100.0% 0.043 1.805 1.976 3.928
Seafood 95%LCI = 95% lower confidence interval bound; 95%UCI=95% upper confidence interval. The confidence interval was computed based on the Student’s t-distribution. Rates were weighted across ethnic groups.
To better characterize individuals consuming large quantities of seafood, survey
participants were classified as “higher” (n=44) or “lower” (n=158) consumers of
shellfish or finfish if their consumption rates were > 75th or £ 75th percentile,
respectively. Appendix M-2 shows demographic and seafood preparation characteristics of each group. For finfish, a greater percentage of women fell into
the “higher” finfish consumers (24%) than men (19%). Japanese had a greater
percentage of “higher” finfish consumers. More individuals >55 years (36%) were in the “higher” consumer category for all finfish. Cambodian (10%), Mien
(10%), Korean (9%), Hmong (0%) and Samoan (0%) participants tended to be
“lower” consumers of finfish. Each consumption group had similar preparation and procurement practices for finfish. Frequency of finfish skin or
heads/bones/organs consumption did not differ between groups. For shellfish,
more women were “higher” shellfish consumers (29%) than men (21%) were. A greater percentage of Vietnamese (50%) were in the “higher” consumer category
for shellfish. Mien (10%), Hmong (0%) and Samoan (0%) participants tended to
be “lower” consumers of shellfish. Only 7% of “higher” consumers harvested (by self, family members or friends) shellfish.
2. Consumption rate by ethnicity
The study was designed to include the participation of members of ten API ethnic groups. Because of the small number of respondents for some ethnic
groups in the study, it is not feasible to estimate the consumption rates for each
ethnic group accurately. Nevertheless, differences in the pattern of seafood consumption can be observed from the data.
The detailed Seafood Consumption Rates by Ethnicity Table in Appendix M-3
suggests that the ten ethnic groups did not consume seafood uniformly. There
was a statistically significant difference (Kruskal-Wallis test) in all consumption
rates (anadromous, pelagic, freshwater, bottom fish, seaweed/kelp, miscellaneous seafood, shellfish, and the aggregated categories of finfish, all fish,
and all seafood) among the ten API ethnic groups.
In general, members of the Vietnamese and Japanese communities had the
highest overall consumption rate of all seafood, averaging 2.627 g/kg/day
(median 2.384 g/kg/day) and 2.182 g/kg/day (median 1.830 g/kg/day), respectively. On the other end of the spectrum, the Mien, Hmong, and Samoan
communities consumed the least amount of seafood. The overall consumption rate of all seafood for Miens was 0.580 g/kg/day (median 0.288 g/kg/day), less
than one-third of that of Vietnamese community. Hmong people consumed 0.587
g/kg/day on the average (median 0.521g/kg/day). The Samoan community ate about 0.850 g/kg/day of all seafood on the average (median 0.879g/kg/day).
For specific seafood categories, the amount consumed differed among the
communities. The Japanese community reported the largest consumption of anadromous fish, pelagic fish, and miscellaneous seafood. Members of
Vietnamese community had the largest consumption of shellfish and freshwater
fish of the ten ethnic groups. The Korean community consumed the most seaweed and kelp, followed by the Japanese and the Chinese groups.
3. Consumption rate by gender
Of the 202 respondents, 107 were women and 95 were men. The survey data
showed that in general women ate slightly more seafood after adjusting for body weight. However, there was no statistically significant difference in the
consumption rates between men and women for all the fish groups and the
combined categories, after adjusting for body weight. The average consumption rate for all seafood for women was 1.807 g/kg/day (median 1.417g/kg/day),
and 1.710g/kg/day (median 1.257g/kg/day) for men. Results in Table R-2
indicate that women had a slightly greater average consumption rate for all fish groups, except for anadromous and freshwater fish. Appendix M-4 shows
seafood consumption rates by ethnicity and gender.
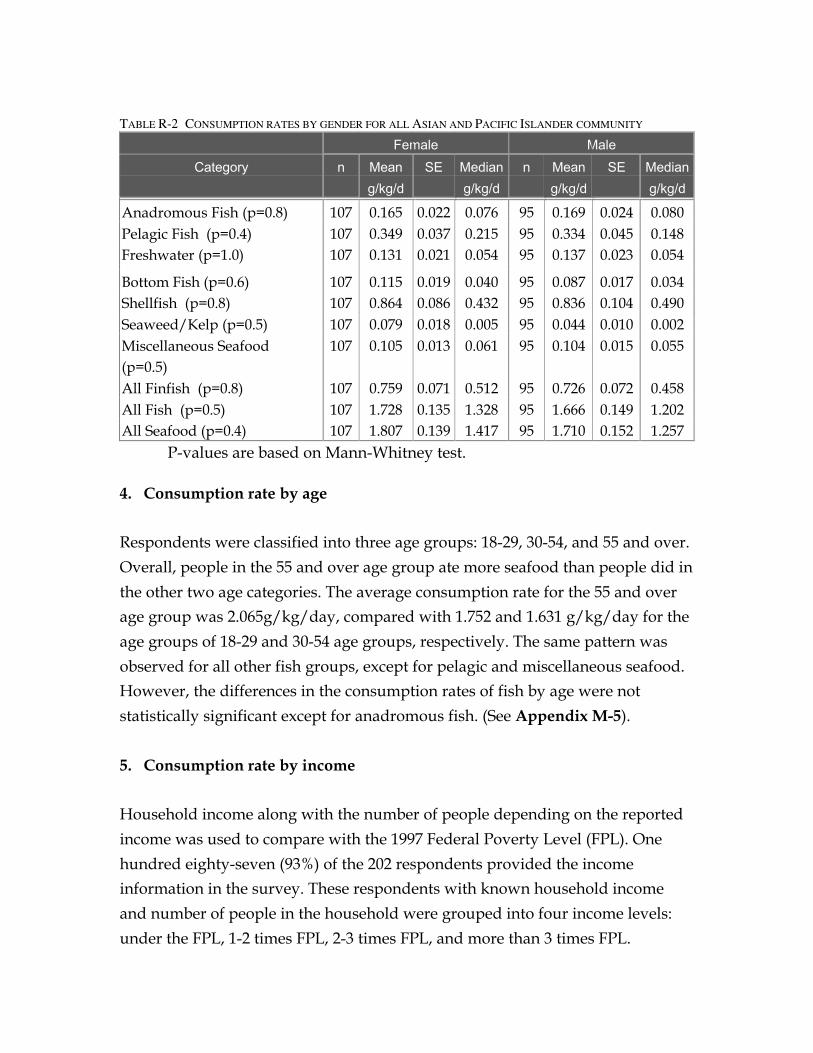
TABLE R-2 CONSUMPTION RATES BY GENDER FOR ALL ASIAN AND PACIFIC ISLANDER COMMUNITY
Female Male
Category n Mean g/kg/d
SE Median g/kg/d
n Mean g/kg/d
SE Median g/kg/d
Anadromous Fish (p=0.8) 107 0.165 0.022 0.076 95 0.169 0.024 0.080 Pelagic Fish (p=0.4) 107 0.349 0.037 0.215 95 0.334 0.045 0.148 Freshwater (p=1.0) 107 0.131 0.021 0.054 95 0.137 0.023 0.054
Bottom Fish (p=0.6) 107 0.115 0.019 0.040 95 0.087 0.017 0.034 Shellfish (p=0.8) 107 0.864 0.086 0.432 95 0.836 0.104 0.490 Seaweed/Kelp (p=0.5) 107 0.079 0.018 0.005 95 0.044 0.010 0.002 Miscellaneous Seafood (p=0.5)
107 0.105 0.013 0.061 95 0.104 0.015 0.055
All Finfish (p=0.8) 107 0.759 0.071 0.512 95 0.726 0.072 0.458 All Fish (p=0.5) 107 1.728 0.135 1.328 95 1.666 0.149 1.202 All Seafood (p=0.4) 107 1.807 0.139 1.417 95 1.710 0.152 1.257
P-values are based on Mann-Whitney test.
4. Consumption rate by age
Respondents were classified into three age groups: 18-29, 30-54, and 55 and over.
Overall, people in the 55 and over age group ate more seafood than people did in
the other two age categories. The average consumption rate for the 55 and over age group was 2.065g/kg/day, compared with 1.752 and 1.631 g/kg/day for the
age groups of 18-29 and 30-54 age groups, respectively. The same pattern was
observed for all other fish groups, except for pelagic and miscellaneous seafood. However, the differences in the consumption rates of fish by age were not
statistically significant except for anadromous fish. (See Appendix M-5).
5. Consumption rate by income
Household income along with the number of people depending on the reported
income was used to compare with the 1997 Federal Poverty Level (FPL). One
hundred eighty-seven (93%) of the 202 respondents provided the income information in the survey. These respondents with known household income
and number of people in the household were grouped into four income levels:
under the FPL, 1-2 times FPL, 2-3 times FPL, and more than 3 times FPL.
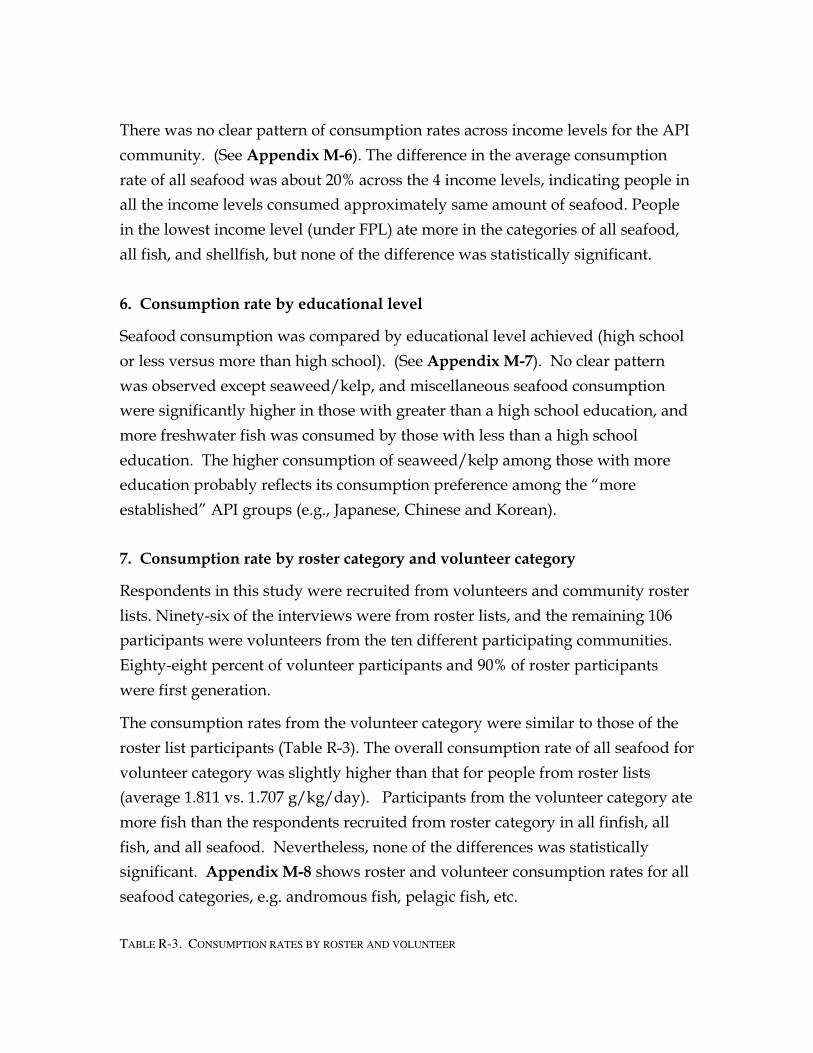
There was no clear pattern of consumption rates across income levels for the API
community. (See Appendix M-6). The difference in the average consumption
rate of all seafood was about 20% across the 4 income levels, indicating people in all the income levels consumed approximately same amount of seafood. People
in the lowest income level (under FPL) ate more in the categories of all seafood,
all fish, and shellfish, but none of the difference was statistically significant.
6. Consumption rate by educational level
Seafood consumption was compared by educational level achieved (high school
or less versus more than high school). (See Appendix M-7). No clear pattern
was observed except seaweed/kelp, and miscellaneous seafood consumption were significantly higher in those with greater than a high school education, and
more freshwater fish was consumed by those with less than a high school
education. The higher consumption of seaweed/kelp among those with more education probably reflects its consumption preference among the “more
established” API groups (e.g., Japanese, Chinese and Korean).
7. Consumption rate by roster category and volunteer category
Respondents in this study were recruited from volunteers and community roster
lists. Ninety-six of the interviews were from roster lists, and the remaining 106 participants were volunteers from the ten different participating communities.
Eighty-eight percent of volunteer participants and 90% of roster participants
were first generation.
The consumption rates from the volunteer category were similar to those of the
roster list participants (Table R-3). The overall consumption rate of all seafood for
volunteer category was slightly higher than that for people from roster lists (average 1.811 vs. 1.707 g/kg/day). Participants from the volunteer category ate
more fish than the respondents recruited from roster category in all finfish, all
fish, and all seafood. Nevertheless, none of the differences was statistically significant. Appendix M-8 shows roster and volunteer consumption rates for all
seafood categories, e.g. andromous fish, pelagic fish, etc.
TABLE R-3. CONSUMPTION RATES BY ROSTER AND VOLUNTEER
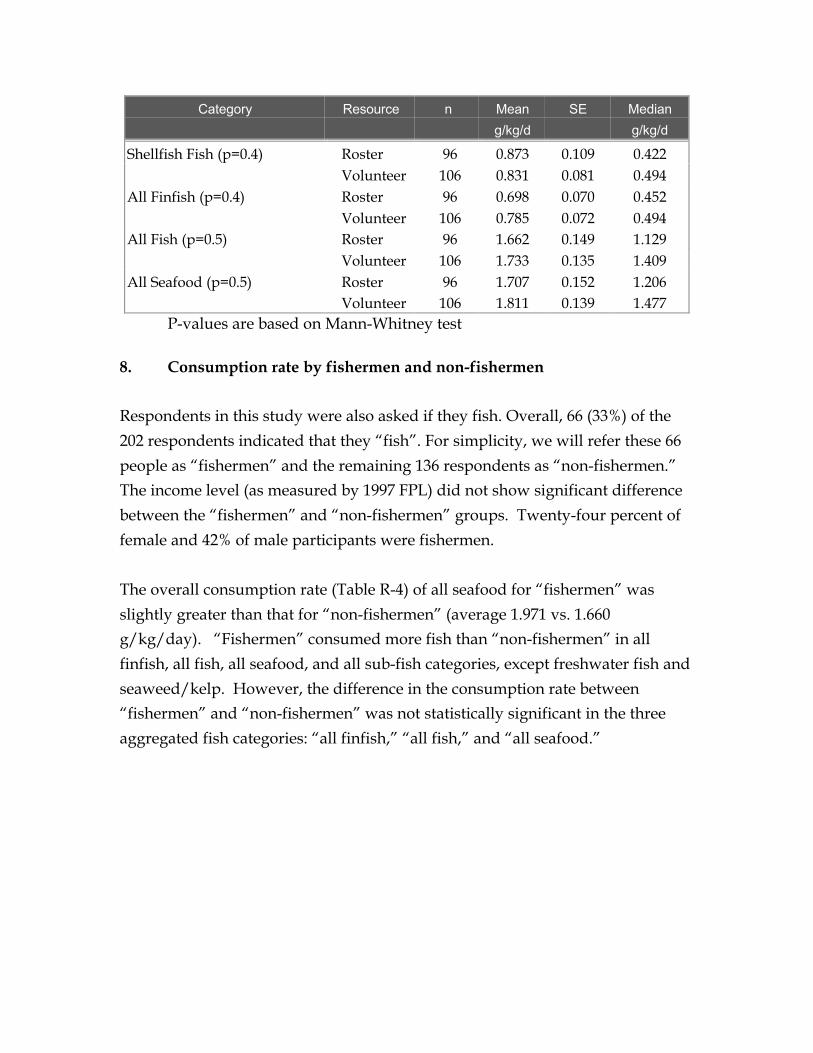
Category Resource n Mean g/kg/d
SE Median g/kg/d
Shellfish Fish (p=0.4) Roster 96 0.873 0.109 0.422 Volunteer 106 0.831 0.081 0.494
All Finfish (p=0.4) Roster 96 0.698 0.070 0.452
All Fish (p=0.5) Volunteer Roster
106 96
0.785 1.662
0.072 0.149
0.494 1.129
Volunteer 106 1.733 0.135 1.409 All Seafood (p=0.5) Roster
Volunteer 96 106
1.707 1.811
0.152 0.139
1.206 1.477
P-values are based on Mann-Whitney test
8. Consumption rate by fishermen and non-fishermen
Respondents in this study were also asked if they fish. Overall, 66 (33%) of the
202 respondents indicated that they “fish”. For simplicity, we will refer these 66
people as “fishermen” and the remaining 136 respondents as “non-fishermen.” The income level (as measured by 1997 FPL) did not show significant difference
between the “fishermen” and “non-fishermen” groups. Twenty-four percent of
female and 42% of male participants were fishermen.
The overall consumption rate (Table R-4) of all seafood for “fishermen” was
slightly greater than that for “non-fishermen” (average 1.971 vs. 1.660 g/kg/day). “Fishermen” consumed more fish than “non-fishermen” in all
finfish, all fish, all seafood, and all sub-fish categories, except freshwater fish and
seaweed/kelp. However, the difference in the consumption rate between “fishermen” and “non-fishermen” was not statistically significant in the three
aggregated fish categories: “all finfish,” “all fish,” and “all seafood.”
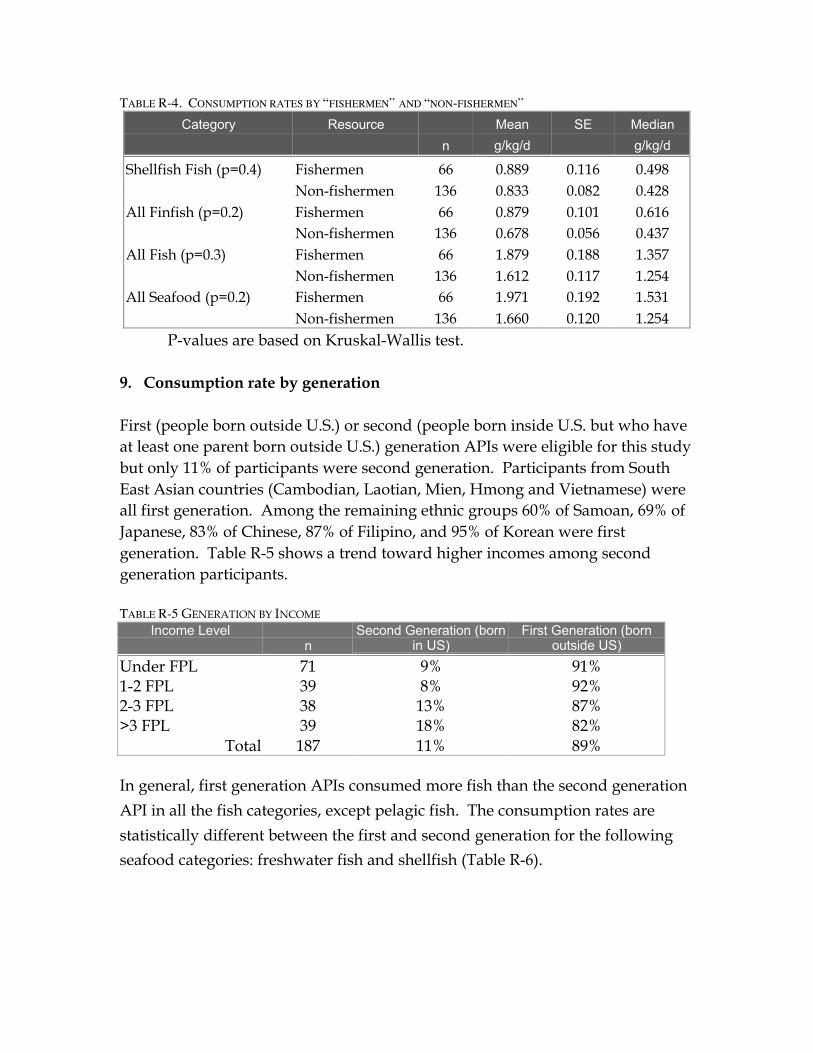
TABLE R-4. CONSUMPTION RATES BY “FISHERMEN” AND “NON-FISHERMEN” Category Resource
n Mean g/kg/d
SE Median g/kg/d
Shellfish Fish (p=0.4) Fishermen 66 0.889 0.116 0.498 Non-fishermen 136 0.833 0.082 0.428
All Finfish (p=0.2) Fishermen Non-fishermen
66 136
0.879 0.678
0.101 0.056
0.616 0.437
All Fish (p=0.3) Fishermen 66 1.879 0.188 1.357
All Seafood (p=0.2) Non-fishermen Fishermen
136 66
1.612 1.971
0.117 0.192
1.254 1.531
Non-fishermen 136 1.660 0.120 1.254 P-values are based on Kruskal-Wallis test.
9. Consumption rate by generation
First (people born outside U.S.) or second (people born inside U.S. but who have at least one parent born outside U.S.) generation APIs were eligible for this study but only 11% of participants were second generation. Participants from South East Asian countries (Cambodian, Laotian, Mien, Hmong and Vietnamese) were all first generation. Among the remaining ethnic groups 60% of Samoan, 69% of Japanese, 83% of Chinese, 87% of Filipino, and 95% of Korean were first generation. Table R-5 shows a trend toward higher incomes among second generation participants.
TABLE R-5 GENERATION BY INCOME
Income Level n
Second Generation (born in US)
First Generation (born outside US)
Under FPL 71 9% 91% 1-2 FPL 39 8% 92% 2-3 FPL 38 13% 87% >3 FPL 39 18% 82%
Total 187 11% 89%
In general, first generation APIs consumed more fish than the second generation
API in all the fish categories, except pelagic fish. The consumption rates are
statistically different between the first and second generation for the following seafood categories: freshwater fish and shellfish (Table R-6).
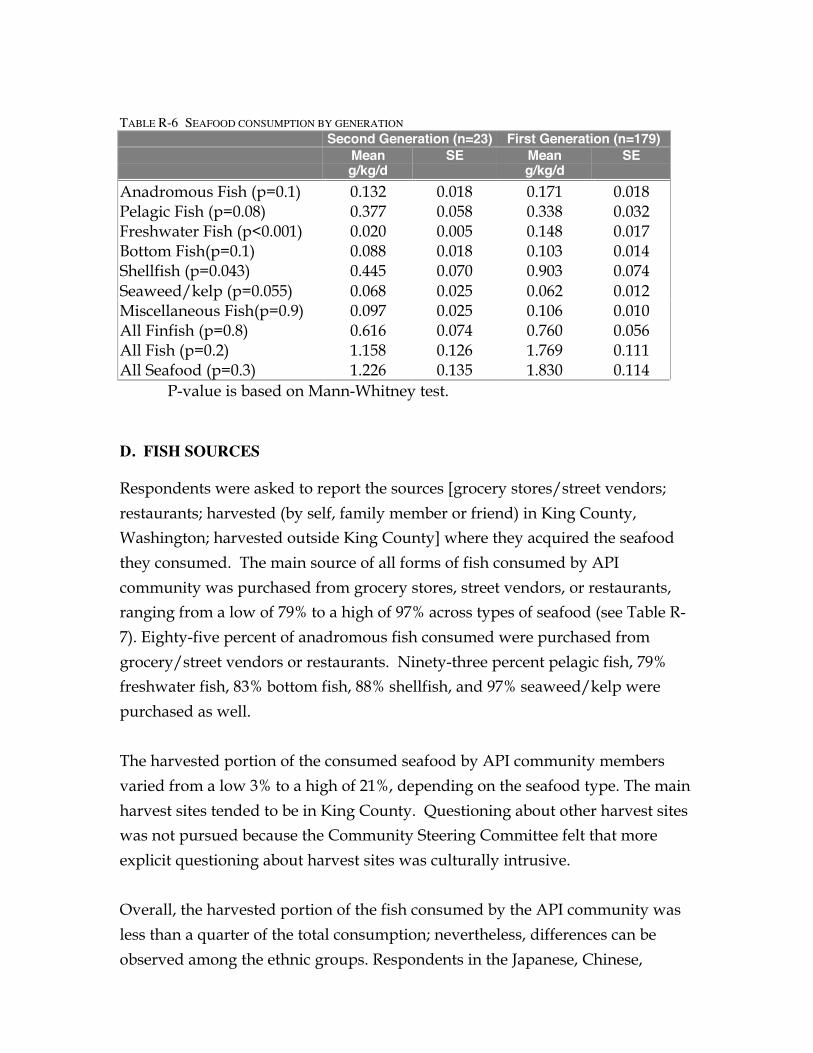
TABLE R-6 SEAFOOD CONSUMPTION BY GENERATION Second Generation (n=23) First Generation (n=179)
Mean SE Mean SE g/kg/d g/kg/d
Anadromous Fish (p=0.1) Pelagic Fish (p=0.08) Freshwater Fish (p<0.001) Bottom Fish(p=0.1) Shellfish (p=0.043) Seaweed/kelp (p=0.055) Miscellaneous Fish(p=0.9) All Finfish (p=0.8) All Fish (p=0.2) All Seafood (p=0.3)
0.132 0.018 0.377 0.058 0.020 0.005 0.088 0.018 0.445 0.070 0.068 0.025 0.097 0.025 0.616 0.074 1.158 0.126 1.226 0.135
0.171 0.018 0.338 0.032 0.148 0.017 0.103 0.014 0.903 0.074 0.062 0.012 0.106 0.010 0.760 0.056 1.769 0.111 1.830 0.114
P-value is based on Mann-Whitney test.
D. FISH SOURCES
Respondents were asked to report the sources [grocery stores/street vendors;
restaurants; harvested (by self, family member or friend) in King County, Washington; harvested outside King County] where they acquired the seafood
they consumed. The main source of all forms of fish consumed by API
community was purchased from grocery stores, street vendors, or restaurants, ranging from a low of 79% to a high of 97% across types of seafood (see Table R-
7). Eighty-five percent of anadromous fish consumed were purchased from
grocery/street vendors or restaurants. Ninety-three percent pelagic fish, 79% freshwater fish, 83% bottom fish, 88% shellfish, and 97% seaweed/kelp were
purchased as well.
The harvested portion of the consumed seafood by API community members
varied from a low 3% to a high of 21%, depending on the seafood type. The main
harvest sites tended to be in King County. Questioning about other harvest sites was not pursued because the Community Steering Committee felt that more
explicit questioning about harvest sites was culturally intrusive.
Overall, the harvested portion of the fish consumed by the API community was
less than a quarter of the total consumption; nevertheless, differences can be
observed among the ethnic groups. Respondents in the Japanese, Chinese,
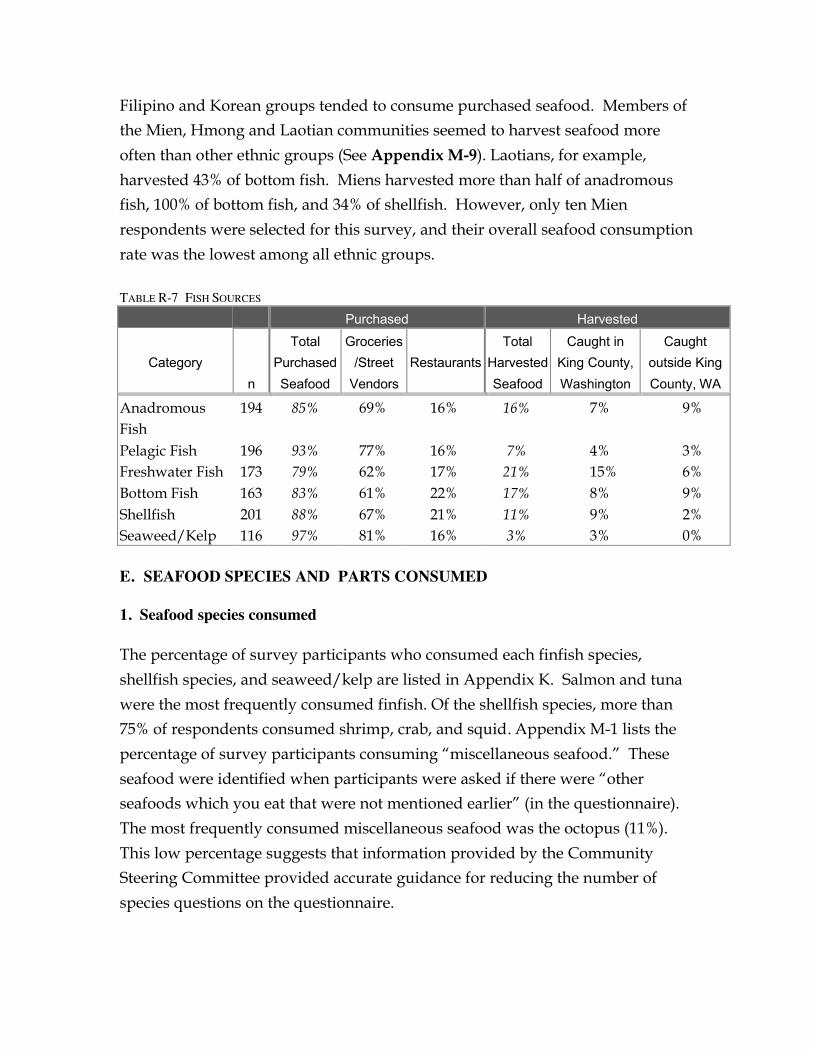
Filipino and Korean groups tended to consume purchased seafood. Members of the Mien, Hmong and Laotian communities seemed to harvest seafood more
often than other ethnic groups (See Appendix M-9). Laotians, for example,
harvested 43% of bottom fish. Miens harvested more than half of anadromous fish, 100% of bottom fish, and 34% of shellfish. However, only ten Mien
respondents were selected for this survey, and their overall seafood consumption
rate was the lowest among all ethnic groups.
TABLE R-7 FISH SOURCES
Purchased Harvested
Total Groceries Total Caught in Caught Category Purchased /Street Restaurants Harvested King County, outside King
n Seafood Vendors Seafood Washington County, WA
Anadromous 194 85% 69% 16% 16% 7% 9% Fish Pelagic Fish 196 93% 77% 16% 7% 4% 3% Freshwater Fish 173 79% 62% 17% 21% 15% 6% Bottom Fish 163 83% 61% 22% 17% 8% 9% Shellfish 201 88% 67% 21% 11% 9% 2% Seaweed/Kelp 116 97% 81% 16% 3% 3% 0%
E. SEAFOOD SPECIES AND PARTS CONSUMED
1. Seafood species consumed
The percentage of survey participants who consumed each finfish species,
shellfish species, and seaweed/kelp are listed in Appendix K. Salmon and tuna
were the most frequently consumed finfish. Of the shellfish species, more than 75% of respondents consumed shrimp, crab, and squid. Appendix M-1 lists the
percentage of survey participants consuming “miscellaneous seafood.” These
seafood were identified when participants were asked if there were “other seafoods which you eat that were not mentioned earlier” (in the questionnaire).
The most frequently consumed miscellaneous seafood was the octopus (11%).
This low percentage suggests that information provided by the Community Steering Committee provided accurate guidance for reducing the number of
species questions on the questionnaire.
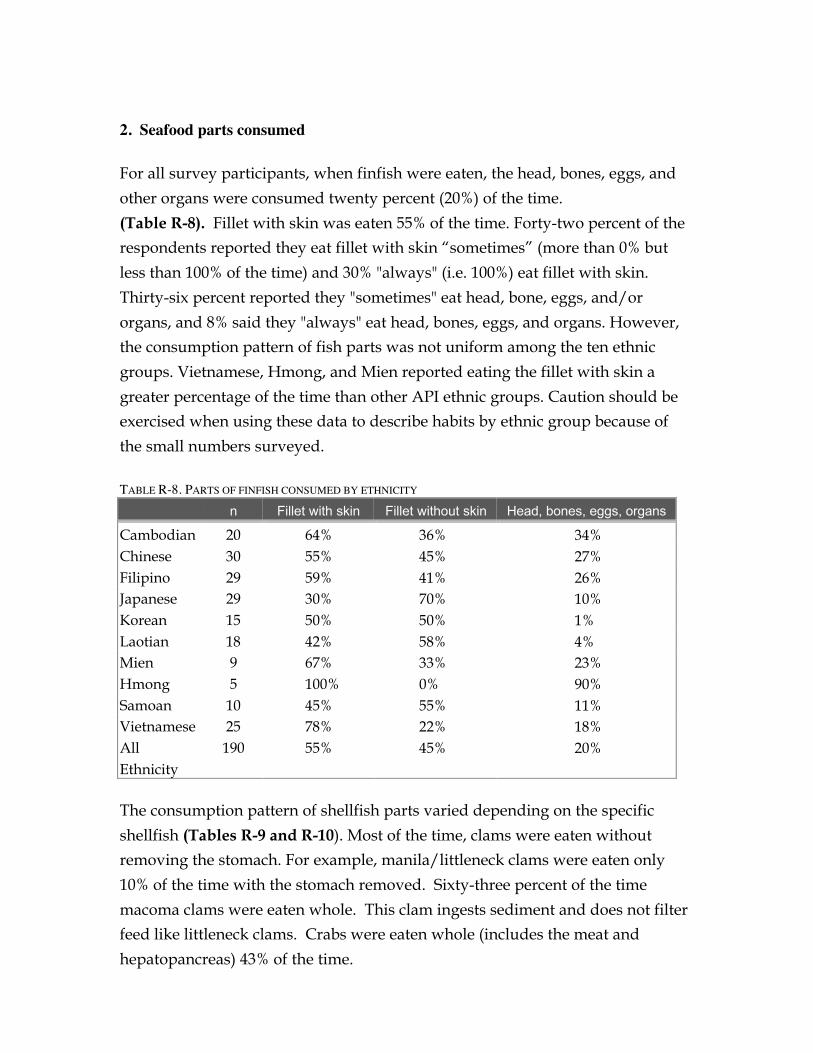
2. Seafood parts consumed
For all survey participants, when finfish were eaten, the head, bones, eggs, and
other organs were consumed twenty percent (20%) of the time.
(Table R-8). Fillet with skin was eaten 55% of the time. Forty-two percent of the respondents reported they eat fillet with skin “sometimes” (more than 0% but
less than 100% of the time) and 30% "always" (i.e. 100%) eat fillet with skin.
Thirty-six percent reported they "sometimes" eat head, bone, eggs, and/or
organs, and 8% said they "always" eat head, bones, eggs, and organs. However, the consumption pattern of fish parts was not uniform among the ten ethnic
groups. Vietnamese, Hmong, and Mien reported eating the fillet with skin a
greater percentage of the time than other API ethnic groups. Caution should be exercised when using these data to describe habits by ethnic group because of
the small numbers surveyed.
TABLE R-8. PARTS OF FINFISH CONSUMED BY ETHNICITY
n Fillet with skin Fillet without skin Head, bones, eggs, organs
Cambodian Chinese Filipino Japanese Korean Laotian Mien Hmong Samoan Vietnamese All Ethnicity
20 30 29 29 15 18 9 5
10 25 190
64% 55% 59% 30% 50% 42% 67% 100% 45% 78% 55%
36% 45% 41% 70% 50% 58% 33% 0% 55% 22% 45%
34% 27% 26% 10% 1% 4% 23% 90% 11% 18% 20%
The consumption pattern of shellfish parts varied depending on the specific
shellfish (Tables R-9 and R-10). Most of the time, clams were eaten without removing the stomach. For example, manila/littleneck clams were eaten only
10% of the time with the stomach removed. Sixty-three percent of the time
macoma clams were eaten whole. This clam ingests sediment and does not filter feed like littleneck clams. Crabs were eaten whole (includes the meat and
hepatopancreas) 43% of the time.
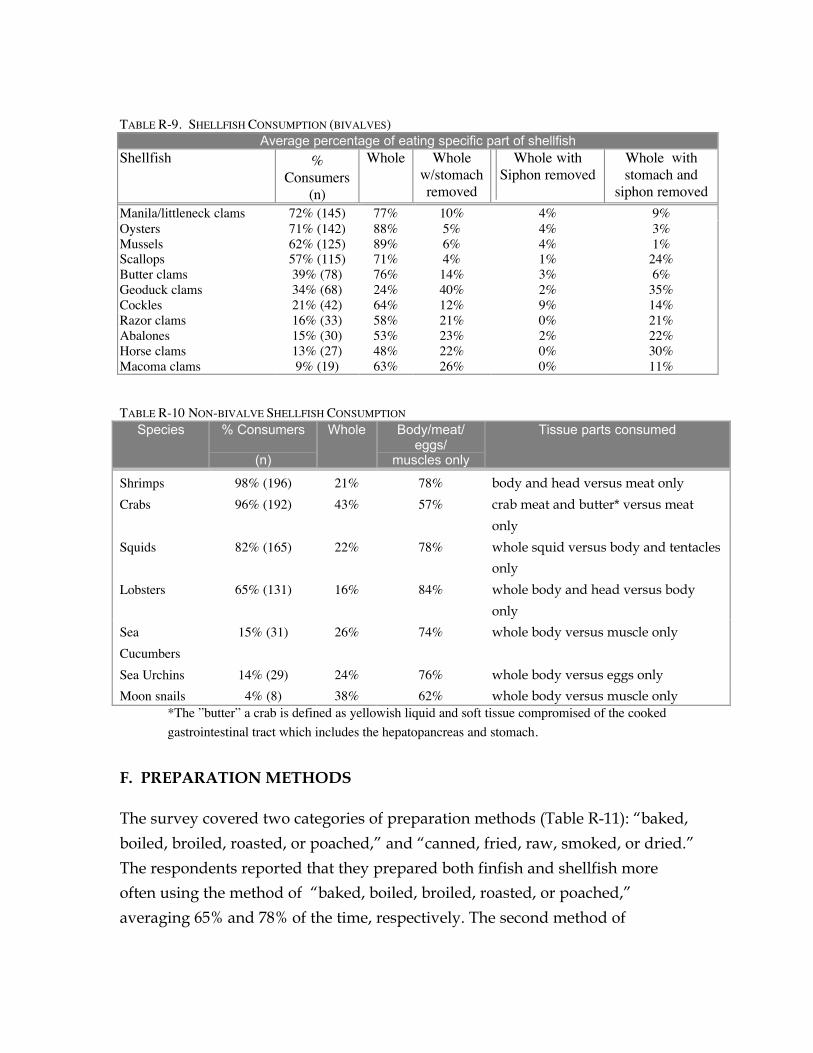
TABLE R-9. SHELLFISH CONSUMPTION (BIVALVES) Average percentage of eating specific part of shellfish
Shellfish % Consumers
(n)
Whole Whole w/stomach removed
Whole with Siphon removed
Whole with stomach and
siphon removed Manila/littleneck clams Oysters Mussels Scallops Butter clams Geoduck clams Cockles Razor clams Abalones Horse clams Macoma clams
72% (145) 77% 10% 4% 71% (142) 88% 5% 4% 62% (125) 89% 6% 4% 57% (115) 71% 4% 1% 39% (78) 76% 14% 3% 34% (68) 24% 40% 2% 21% (42) 64% 12% 9% 16% (33) 58% 21% 0% 15% (30) 53% 23% 2% 13% (27) 48% 22% 0% 9% (19) 63% 26% 0%
9% 3% 1%
24% 6%
35% 14% 21% 22% 30% 11%
TABLE R-10 NON-BIVALVE SHELLFISH CONSUMPTION Species % Consumers Whole Body/meat/ Tissue parts consumed
eggs/ (n) muscles only
Shrimps Crabs
Squids
Lobsters
Sea Cucumbers Sea Urchins Moon snails
98% (196) 96% (192)
82% (165)
65% (131)
15% (31)
14% (29) 4% (8)
21% 43%
22%
16%
26%
24% 38%
78% 57%
78%
84%
74%
76% 62%
body and head versus meat only
crab meat and butter* versus meat
only
whole squid versus body and tentacles
only
whole body and head versus body
only
whole body versus muscle only
whole body versus eggs only
whole body versus muscle only *The ”butter” a crab is defined as yellowish liquid and soft tissue compromised of the cooked gastrointestinal tract which includes the hepatopancreas and stomach.
F. PREPARATION METHODS
The survey covered two categories of preparation methods (Table R-11): “baked,
boiled, broiled, roasted, or poached,” and “canned, fried, raw, smoked, or dried.”
The respondents reported that they prepared both finfish and shellfish more often using the method of “baked, boiled, broiled, roasted, or poached,”
averaging 65% and 78% of the time, respectively. The second method of

“canned, fried, raw, smoked, or dried,” was also used substantially in the API community, ranging from 35% for finfish and 22% for shellfish.
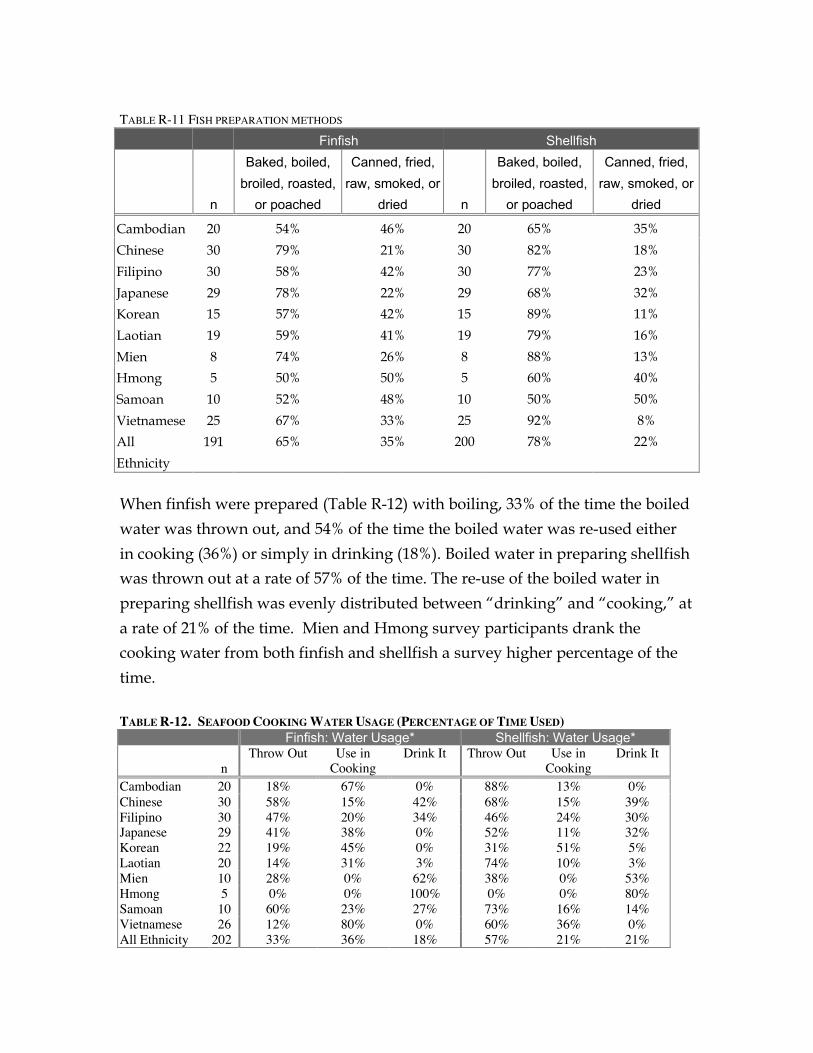
TABLE R-11 FISH PREPARATION METHODS
Finfish Shellfish
n
Baked, boiled, broiled, roasted,
or poached
Canned, fried, raw, smoked, or
dried n
Baked, boiled, broiled, roasted,
or poached
Canned, fried, raw, smoked, or
dried
Cambodian
Chinese
Filipino
Japanese
Korean
Laotian
Mien
Hmong
Samoan
Vietnamese
All
Ethnicity
20
30
30
29
15
19
8
5
10
25
191
54% 46%
79% 21%
58% 42%
78% 22%
57% 42%
59% 41%
74% 26%
50% 50%
52% 48%
67% 33%
65% 35%
20
30
30
29
15
19
8
5
10
25
200
65% 35%
82% 18%
77% 23%
68% 32%
89% 11%
79% 16%
88% 13%
60% 40%
50% 50%
92% 8%
78% 22%
When finfish were prepared (Table R-12) with boiling, 33% of the time the boiled
water was thrown out, and 54% of the time the boiled water was re-used either
in cooking (36%) or simply in drinking (18%). Boiled water in preparing shellfish was thrown out at a rate of 57% of the time. The re-use of the boiled water in
preparing shellfish was evenly distributed between “drinking” and “cooking,” at
a rate of 21% of the time. Mien and Hmong survey participants drank the cooking water from both finfish and shellfish a survey higher percentage of the
time.
TABLE R-12. SEAFOOD COOKING WATER USAGE (PERCENTAGE OF TIME USED) Finfish: Water Usage* Shellfish: Water Usage*
n Throw Out Use in
Cooking Drink It Throw Out Use in
Cooking Drink It
Cambodian Chinese Filipino Japanese Korean Laotian Mien Hmong Samoan Vietnamese All Ethnicity
20 30 30 29 22 20 10 5
10 26
202
18% 67% 0% 58% 15% 42% 47% 20% 34% 41% 38% 0% 19% 45% 0% 14% 31% 3% 28% 0% 62% 0% 0% 100% 60% 23% 27% 12% 80% 0% 33% 36% 18%
88% 13% 0% 68% 15% 39% 46% 24% 30% 52% 11% 32% 31% 51% 5% 74% 10% 3% 38% 0% 53% 0% 0% 80% 73% 16% 14% 60% 36% 0% 57% 21% 21%
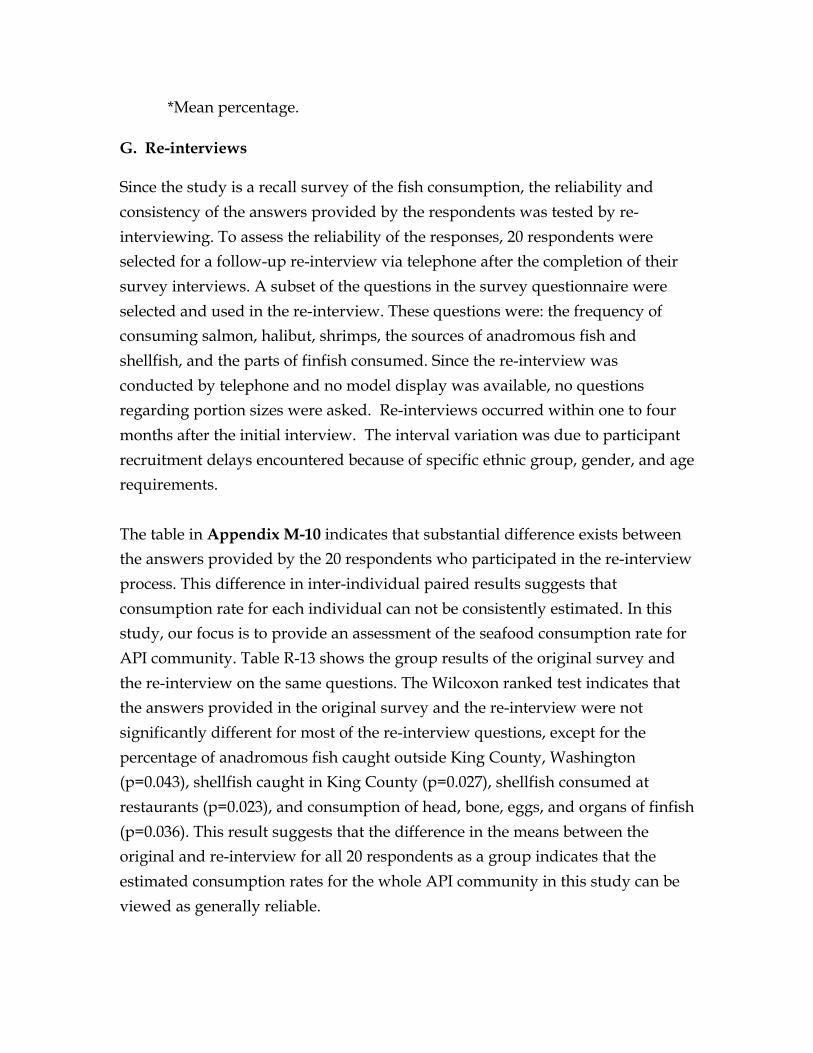
*Mean percentage.
G. Re-interviews
Since the study is a recall survey of the fish consumption, the reliability and
consistency of the answers provided by the respondents was tested by re-
interviewing. To assess the reliability of the responses, 20 respondents were selected for a follow-up re-interview via telephone after the completion of their
survey interviews. A subset of the questions in the survey questionnaire were
selected and used in the re-interview. These questions were: the frequency of consuming salmon, halibut, shrimps, the sources of anadromous fish and
shellfish, and the parts of finfish consumed. Since the re-interview was
conducted by telephone and no model display was available, no questions regarding portion sizes were asked. Re-interviews occurred within one to four
months after the initial interview. The interval variation was due to participant
recruitment delays encountered because of specific ethnic group, gender, and age requirements.
The table in Appendix M-10 indicates that substantial difference exists between the answers provided by the 20 respondents who participated in the re-interview
process. This difference in inter-individual paired results suggests that
consumption rate for each individual can not be consistently estimated. In this study, our focus is to provide an assessment of the seafood consumption rate for
API community. Table R-13 shows the group results of the original survey and
the re-interview on the same questions. The Wilcoxon ranked test indicates that the answers provided in the original survey and the re-interview were not
significantly different for most of the re-interview questions, except for the
percentage of anadromous fish caught outside King County, Washington (p=0.043), shellfish caught in King County (p=0.027), shellfish consumed at
restaurants (p=0.023), and consumption of head, bone, eggs, and organs of finfish
(p=0.036). This result suggests that the difference in the means between the original and re-interview for all 20 respondents as a group indicates that the
estimated consumption rates for the whole API community in this study can be
viewed as generally reliable.
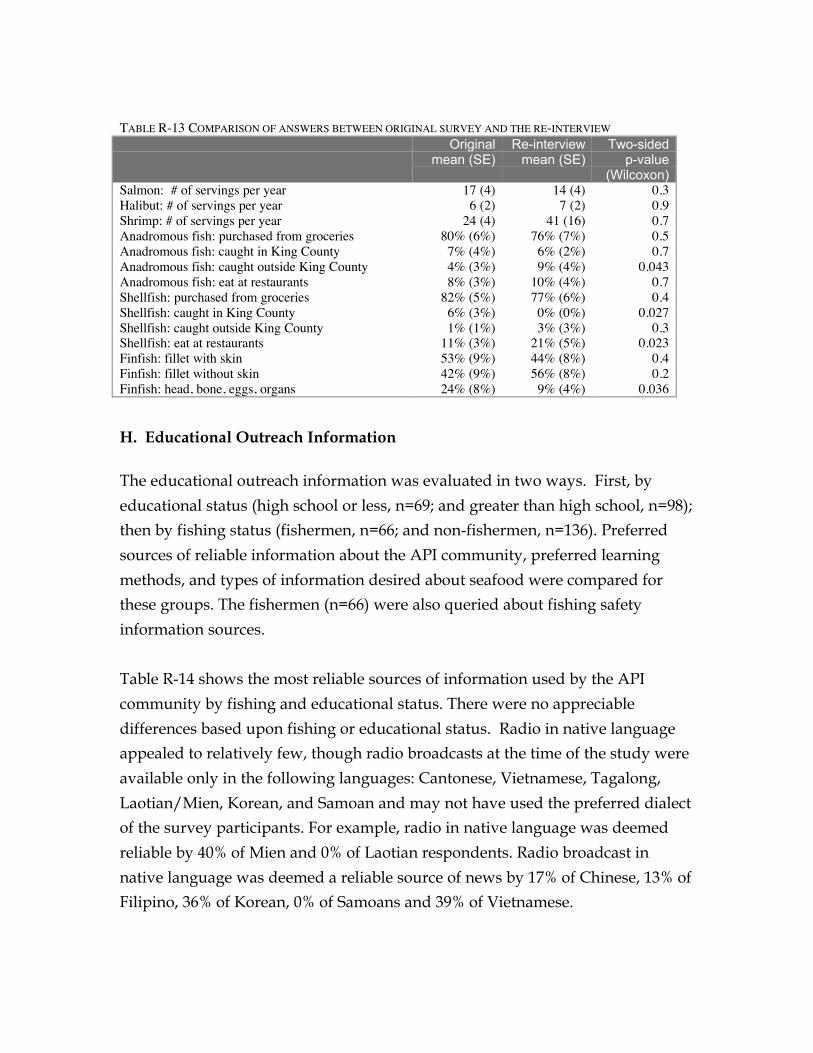
TABLE R-13 COMPARISON OF ANSWERS BETWEEN ORIGINAL SURVEY AND THE RE-INTERVIEW Original
mean (SE) Re-interview
mean (SE) Two-sided
p-value (Wilcoxon)
Salmon: # of servings per year 17 (4) 14 (4) 0.3 Halibut: # of servings per year 6 (2) 7 (2) 0.9 Shrimp: # of servings per year 24 (4) 41 (16) 0.7 Anadromous fish: purchased from groceries 80% (6%) 76% (7%) 0.5 Anadromous fish: caught in King County 7% (4%) 6% (2%) 0.7 Anadromous fish: caught outside King County 4% (3%) 9% (4%) 0.043 Anadromous fish: eat at restaurants 8% (3%) 10% (4%) 0.7 Shellfish: purchased from groceries 82% (5%) 77% (6%) 0.4 Shellfish: caught in King County 6% (3%) 0% (0%) 0.027 Shellfish: caught outside King County 1% (1%) 3% (3%) 0.3 Shellfish: eat at restaurants 11% (3%) 21% (5%) 0.023 Finfish: fillet with skin 53% (9%) 44% (8%) 0.4 Finfish: fillet without skin 42% (9%) 56% (8%) 0.2 Finfish: head, bone, eggs, organs 24% (8%) 9% (4%) 0.036
H. Educational Outreach Information
The educational outreach information was evaluated in two ways. First, by
educational status (high school or less, n=69; and greater than high school, n=98); then by fishing status (fishermen, n=66; and non-fishermen, n=136). Preferred
sources of reliable information about the API community, preferred learning
methods, and types of information desired about seafood were compared for these groups. The fishermen (n=66) were also queried about fishing safety
information sources.
Table R-14 shows the most reliable sources of information used by the API
community by fishing and educational status. There were no appreciable
differences based upon fishing or educational status. Radio in native language appealed to relatively few, though radio broadcasts at the time of the study were
available only in the following languages: Cantonese, Vietnamese, Tagalong,
Laotian/Mien, Korean, and Samoan and may not have used the preferred dialect of the survey participants. For example, radio in native language was deemed
reliable by 40% of Mien and 0% of Laotian respondents. Radio broadcast in
native language was deemed a reliable source of news by 17% of Chinese, 13% of Filipino, 36% of Korean, 0% of Samoans and 39% of Vietnamese.
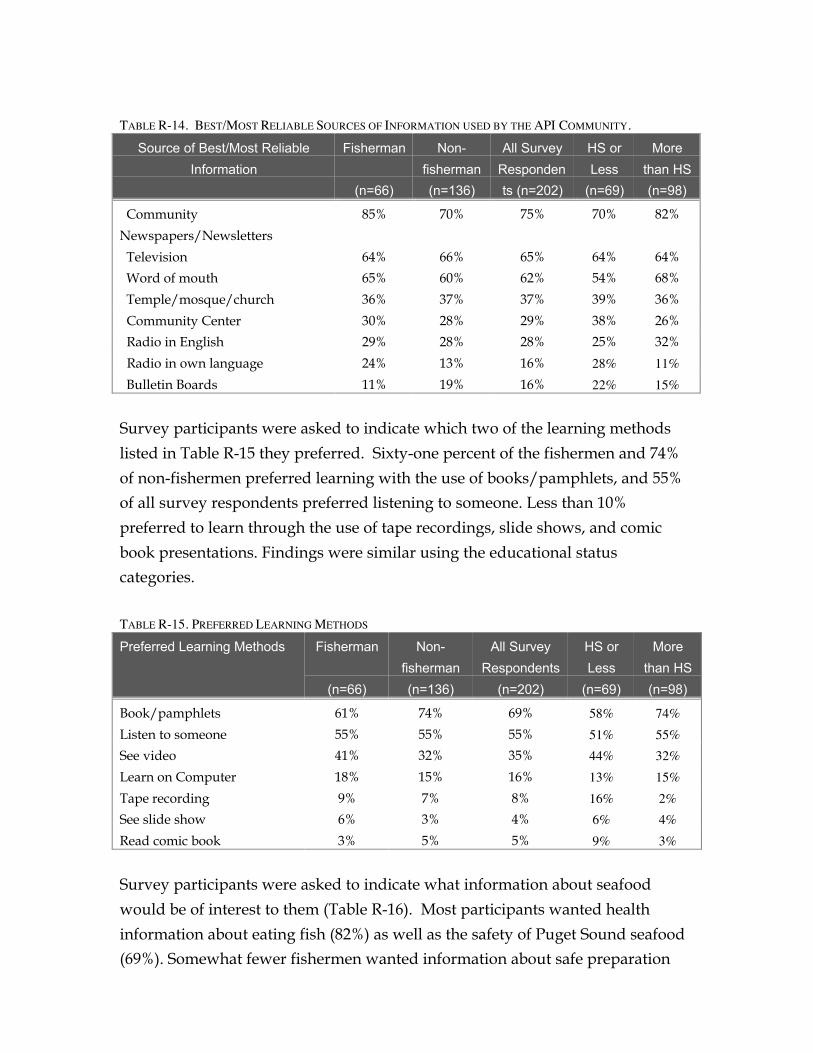
TABLE R-14. BEST/MOST RELIABLE SOURCES OF INFORMATION USED BY THE API COMMUNITY.
Source of Best/Most Reliable Fisherman Non- All Survey HS or More Information fisherman Responden Less than HS
(n=66) (n=136) ts (n=202) (n=69) (n=98)
Community
Newspapers/Newsletters
Television
Word of mouth
Temple/mosque/church
Community Center
Radio in English
Radio in own language
Bulletin Boards
85%
64%
65%
36%
30%
29%
24%
11%
70%
66%
60%
37%
28%
28%
13%
19%
75%
65%
62%
37%
29%
28%
16%
16%
70%
64%
54%
39%
38%
25%
28% 22%
82%
64%
68%
36%
26%
32%
11%15%
Survey participants were asked to indicate which two of the learning methods
listed in Table R-15 they preferred. Sixty-one percent of the fishermen and 74%
of non-fishermen preferred learning with the use of books/pamphlets, and 55% of all survey respondents preferred listening to someone. Less than 10%
preferred to learn through the use of tape recordings, slide shows, and comic
book presentations. Findings were similar using the educational status categories.
TABLE R-15. PREFERRED LEARNING METHODS
Preferred Learning Methods Fisherman Non- All Survey HS or More fisherman Respondents Less than HS
(n=66) (n=136) (n=202) (n=69) (n=98)
Book/pamphlets
Listen to someone
See video
Learn on Computer
Tape recording
See slide show
Read comic book
61%
55%
41%
18%
9%
6%
3%
74%
55%
32%
15%
7%
3%
5%
69%
55%
35%
16%
8%
4%
5%
58% 51% 44% 13% 16% 6% 9%
74% 55% 32% 15% 2% 4% 3%
Survey participants were asked to indicate what information about seafood
would be of interest to them (Table R-16). Most participants wanted health
information about eating fish (82%) as well as the safety of Puget Sound seafood (69%). Somewhat fewer fishermen wanted information about safe preparation
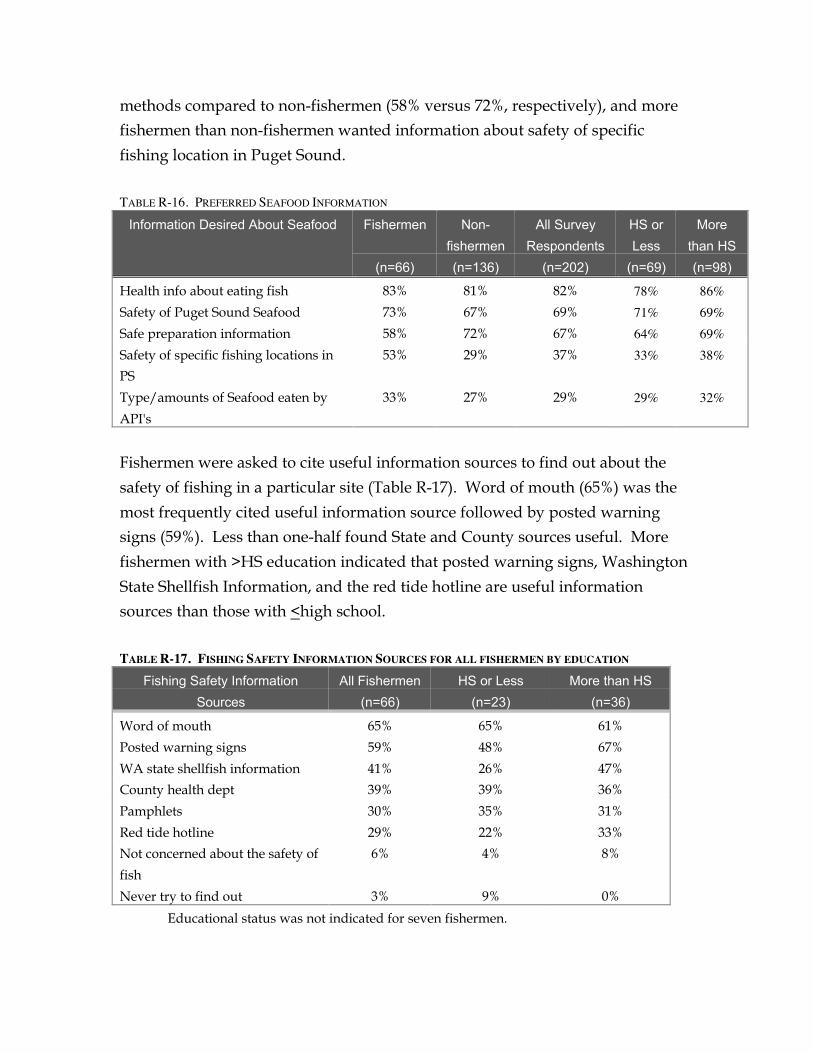
methods compared to non-fishermen (58% versus 72%, respectively), and more fishermen than non-fishermen wanted information about safety of specific
fishing location in Puget Sound.
TABLE R-16. PREFERRED SEAFOOD INFORMATION
Information Desired About Seafood Fishermen Non- All Survey HS or More fishermen Respondents Less than HS
(n=66) (n=136) (n=202) (n=69) (n=98)
Health info about eating fish
Safety of Puget Sound Seafood
Safe preparation information
Safety of specific fishing locations in
PS
Type/amounts of Seafood eaten by
API's
83%
73%
58%
53%
33%
81%
67%
72%
29%
27%
82%
69%
67%
37%
29%
78% 71% 64% 33%
29%
86% 69% 69% 38%
32%
Fishermen were asked to cite useful information sources to find out about the
safety of fishing in a particular site (Table R-17). Word of mouth (65%) was the
most frequently cited useful information source followed by posted warning signs (59%). Less than one-half found State and County sources useful. More
fishermen with >HS education indicated that posted warning signs, Washington
State Shellfish Information, and the red tide hotline are useful information sources than those with <high school.
TABLE R-17. FISHING SAFETY INFORMATION SOURCES FOR ALL FISHERMEN BY EDUCATION
Fishing Safety Information All Fishermen (n=66)
HS or Less (n=23)
More than HS (n=36)Sources
Word of mouth
Posted warning signs
WA state shellfish information
County health dept
Pamphlets
Red tide hotline
Not concerned about the safety of
fish
Never try to find out
65%
59%
41%
39%
30%
29%
6%
3%
65%
48%
26%
39%
35%
22%
4%
9%
61%
67%
47%
36%
31%
33%
8%
0%
Educational status was not indicated for seven fishermen.
2. EDUCATION AND COMMUNICATION OF STUDY
FINDINGS (PHASE III)
A. METHODS
1. Introduction
Phase III of the Seafood Consumption Study was intended to serve as a vehicle to develop and field test culturally appropriate educational materials to convey
information about seafood. While Phase II described and quantitated seafood
acquisition, consumption, and preparation habits, such technical information obtained in Phase II is more useful to the regulatory agencies and risk assessors
than the API community. Community leaders indicated that the quantitative
information was of little interest to them, and among survey respondents, only 29% of indicated that they would like to know the amount of the fish that was
consumed by API community. However, 82% of survey respondents desired
health information about eating fish, 68% information about safety of Puget Sound seafood, and 67% information about safe seafood preparation methods.
Therefore, a strategy was developed to link the technical expertise of the
Advisory and Technical Committees with the cultural perspectives of the Community Steering Committee to develop health messages for the API
community about seafood related health issues, safe acquisition information, and
safe preparation methods.
These efforts resulted in a draft brochure that was translated into ten languages
and focus group tested. Based upon comments from community focus group
reviewers, and the Advisory and Technical Committee members, modification of the English version of the educational materials was accomplished. Funding for
the pilot translation was available, but not to finalize the translation or distribute
the brochure.
B. Selection of an Education/Communication Tool
The original study design called for the development of a slide show; however, this idea, with concurrence from the U.S. EPA grant manager, was discarded for
several reasons. First, data collected from the Phase II study survey (see table R-
12) showed that only 4% of survey participants considered slide shows a preferred learning method while 69% preferred books or pamphlets. Secondly,
members of the Community Steering Committee indicated to the RFSC Study
Coordinator that they preferred brochures because they are easier to distribute than slide shows and can be referred to as reference material over a longer period
of time. They also felt that translators are more willing to translate a pamphlet
than a slide show and that slide shows are considered “old technology” with videos being preferred, however the cost of video production was not covered by
the grant funding.
3. Development of Education/Communication Tool
The UW asked members of the Technical and Advisory Committees to
brainstorm and name five most important public health risks associated with
seafood consumption and acquisition. Eight of the fourteen committee members (both committees combined) responded by identifying fifteen general concerns.
These were ranked by citation frequency. From this list, CSC members (n=16)
were then asked to select five concerns they felt to be most important for the API community (Appendix N-1). The goal was to incorporate the top five health
messages into the brochure; however, seven were ultimately included because
three health messages received the same rating from the CSC for the fifth position. The CSC was concerned about the issue of "seafood from foreign
markets and restaurants", but this was not included because of the topic’s
complexity and scope.
Using these topics, the UW developed the text (health and preventive behavior
messages) of the brochure, which then was edited by the RFSC Study Coordinator. The CSC reviewed these messages to ensure cultural
appropriateness and understandability. The UW and the RFSC also developed a
list of resources for obtaining further information (e.g., Red Tide Hotline, etc.) to include in the brochure. The resources included were based in part on
recommendations made by members of the Technical and Advisory committees,
and the SC.
Other sources of community input included discussion with the director of the Seafood Consumption Information Project with Save San Francisco Bay
Association, to advise in the planning and development of the educational
brochure. The San Francisco project had also developed an educational brochure to raise awareness of safe cooking preparations, sensitive populations, etc. The
SC also met with the director of the Wilderness-Inner City Leadership
Development Youth Programs of the International District Housing Alliance in Seattle, Washington, to exchange strategy and development ideas since that
organization was also in the midst of developing an educational brochure on
seafood consumption.
From the acquired information, the RFSC Study Coordinator developed a basic
layout for the brochure that was transformed into a brochure format by a graphic artist with the U.S. EPA Region X (Appendix N-2).
4. Translation and Focus Group Testing
RFSC Study Coordinator recruited ten translators from the community to translate the brochure. Translators were required to be bilingual in English and
one of ten languages: Cambodian, Chinese, Filipino, Japanese, Laotian, Korean,
Hmong, Mien, Samoan, and Vietnamese.
RFSC study coordinator recruited eight focus group members from the API
community to review the brochure (both English and translated version) for format, content, translation, and presentation; each was compensated with $25.
Focus group members were recruited from health clinics, educational
institutions, libraries, and community organizations. Due to unexpected and unavoidable time conflicts experienced by the RFSC study coordinator, focus
group members from the Hmong and Samoan communities were not recruited.
For the same reason, the focus group did not meet as a whole group; rather, members completed a self-administered questionnaire (Appendix N-3) which
evaluated the content, accuracy of translation, effectiveness, and format of the
brochure.
RFSC Study Coordinator also mailed the English brochure translation to the
Technical, Advisory, and Community Steering Committees for their general comments and recommendations.
Comments and recommendations from the Focus Group, Technical, Advisory, and Community Steering Committees, as well as other interested parties were
incorporated into the English translation of the educational brochure. Translation
of the final edited version was outside the scope of the grant study plan.
VI Results (Phase III)
Overall, with the exception of the Mien review, the health risk messages, graphics, and effectiveness of the brochure were rated, generally, good to
excellent by the focus group reviewers (see Appendix N-4). The brochure was
felt to be useful for decision making. Except for Laotian and Mien translations, the translations were above average, and the presentation clear and precise.
Reviewers made corrections to translation on the brochures themselves (see
Appendix N-5), which will be useful when the final version of the brochure is published (funding to be obtained).
Comments from the focus group reviews, the CSC, the Technical and Advisory Committees, as well as other interested parties, were incorporated into the
brochure where appropriate. An English version of the brochure, which
incorporated all of the editorial comments, is contained in (Appendix N-6).
DISCUSSION
PARTICIPATION RATES
As expected, participation rates among volunteers were high (96%), and
somewhat lower in the roster group (67%). Within the roster group, 67% elected
to participate. Reasons for refusal are unclear. Though community leaders were involved through membership on the Community Steering Committee and
urged community organizations to participate, they were not involved in person
to person recruitment. Chiang (1998) achieved a 79.8% participation rate in her study of the Laotian community, which was made up of the following ethnic
groups: Khmu (13%), Laotian (32%), Mein (45%), and Thadum (10%). Her success may reflect community leader involvement; e.g. they made first contact
with all study participants. In addition, Chiang’s study focused on only one
ethnic community which happened to be closely knit, unlike the King County study which targeted ten groups which were dispersed throughout the area. The
roster method of recruitment also had the drawback that churches and
community groups may not have resources to update their membership rosters. Interviewers were unable to contact 54% of the individuals selected for
interview. Despite the differing participation rates between the volunteer and
roster groups, the seafood consumption rates between the two groups did not differ significantly.
POTENTIAL BIASES
This study covers ten ethnic groups in the Asian and Pacific Islander community
who reside in a large metropolitan area. A complete numeration and a random
sampling of the targeted population was not feasible. To reduce potential coverage bias in the recruitment of respondents, a two-tier approach was
employed by the study team – “roster” and “volunteer” selection. This two-tier
approach may not be theoretically optimal for the coverage and selection of an unbiased sample of the targeted population; it was designed to minimize
possible bias in the selection of respondents.
While the study team made every effort in soliciting as many rosters as possible
from organizations in the API community, nevertheless, some organizations in
the API community refused to share their membership rosters with the study team. Reasons generally involved confidentiality concerns. It is difficult to assess
what bias, if any, exists by using the roster lists provided by the community
organizations.
The survey was advertised as a “dietary habits study” to reduce the possibility
that potential lower seafood consuming participants would de-select themselves. It is difficult to determine this strategy’s success because an undetermined
number of the community members were aware that a seafood consumption
study had been funded for Phase I (completed in 1996). This bias would be
expected to be most evident within the volunteer group which represented individuals who actively volunteered for the study versus the roster group
which was randomly selected from preexisting lists. This effect, if present, is
probably small because comparison of roster and volunteer consumption rates showed no significant difference between these two groups.
Thirty-eight percent of survey participants who responded to questions about their income (n=187) lived below the Federal Poverty Limit (FPL). These rates
are also considerably higher than the 14.8% observed among all API’s residing in
King County in 1990 (1990 U.S. Census). This difference may be due to the recent immigration status of the study group when compared to the multigenerational
composition of API’s in King County, or economic patterns shifting since the
1990 census. The relatively high percentage of individuals living below the FPL also may have been influenced by calculation procedures. Because income was
considered a culturally sensitive question, survey respondents were asked to
check income range categories instead of providing exact income information. Calculation of FPL used the midpoint of the range, e.g. $5000 for survey
participants who marked the $0 - $10,000 income level. This method may have
underestimated incomes.
A slightly greater percentage of the roster than volunteer respondents
interviewed in this study were living under the federal poverty level (39% versus 32%, respectively), but roster participants were not more likely than volunteers
to be first generation. People in the lowest income level (under FPL) ate more in
the categories of all seafood, all fish, and shellfish, but none of the differences were statistically significant. First generation consumed significantly more
freshwater fish and shellfish than second generation participants.
The impact of the relatively more low-income respondents in the study may not
warrant major concern. The results of this study have indicated that there was no
significant difference among the income levels in terms of overall fish consumption rates among the API community, and income was not related to
“fishermen” status. Respondents in the “more-established” ethnic groups (for
example, Japanese, Chinese, Filipino, Korean) seemed to consume more fish by
purchasing from groceries/street vendors and restaurants, the other groups reported more self-harvested fish for consumption.
The reliability of participant responses was assessed using a subset of 14 questions from the survey. Of these, 3 queried seafood consumption frequency,
3 tissue parts consumed, and 8 source of seafood. The retest of ten questions
showed no significant response differences and that responses were generally reliable. Two of the four questions for which answers differed significantly were
related to fishing locations. During face-to-face interviews a map visually
clarified the definition of “inside Puget Sound” versus “outside Puget Sound” to be “inside” versus “outside” of King County. Such visual clarification could not
be accomplished via telephone interview, and without the map,
misinterpretation was likely because Puget Sound, while within King County, is much more extensive then just King County, Washington. The other two
questions were source of shellfish (restaurants) and finfish tissue parts consumed
(head, bone, eggs, organs). Reasons for these differences are unclear.
PER CAPITA CONSUMPTION ESTIMATION
This study was designed to quantitate usual intake among API seafood
consumers. Because participants had to be seafood consumers, the study was not designed to determine per capita rates; so the percentage of non-consumers were
estimated from interviewer screening logs. The study recruitment protocol
required that prospective participants answer a series of qualifying questions; e.g., their county of residence, ethnic group, age, generation in the U.S., and
seafood consumption status. Of all prospective participants willing to
participate in the study, only 1.5% were disqualified because they did not eat seafood, 0% in the volunteer group, and 2% in the roster group. These data
suggest that seafood consumption is almost universal within the API community
and that per capita rates are probably similar to those calculated here. Chiang (1998) also did not quantitate the number of non-consumers, but found that 87%
of the Laotian community surveyed in West Contra Costa County, California, ate
seafood at least one time per month. A survey of 500 Native Americans from the Umatilla, Nez Perce, Yakima, and Warm Springs tribes found that ~9% did not
consume fish (CRITFC, 1994).
CONSUMPTION RATES
This study was intended to evaluate the fish consumption rates of the API
community members in King County, Washington. The 202 respondents were from ten different ethnic groups. While the observed consumption rates have
been reported for each ethnic group in this study, it is important to note that the
estimate of consumption rate for any specific ethnic group should not be considered accurate because of the small sample size for the individual ethnic
groups.
The median seafood consumption rate was 89g/day for the average weight
(62kg) of all survey participants. A consistent difference was noted between
mean and median seafood consumption rates. As discussed above, this difference persisted even when consumption rates for the highest consumers
(outliers) were corrected to 3 standard deviations above the mean. These data
suggest that there are APIs who have very high rates of seafood consumption. For example, consumption at the 90th percentile rate would be 242g/day or 7.8
ounces seafood per day. Even at the 10th percentile, consumption was 32g/day
which is above the 21g/day per capita rate estimated by Javitz (1980). The API ethnic groups with the highest seafood consumption rates were Vietnamese
(median: 148g/day) and Japanese (median: 113g/day).
These high rates may be explained by the more recent immigration status of 89%
of participants and possibly the lower income status of many participants,
though the higher fish consumption rates observed in the lowest income group were not statistically significant. There are no published studies available which
estimate seafood consumption rates in API countries of origin, e.g. Japan, China,
etc.
Survey methods may also overestimate consumption rates. Our survey
specifically queried “in” and “out of season” consumption rates for a total of 40 finfish and shellfish species, and participants could add additional species if
consumed. Several models were used for species types as outlined in the
methods. Multiple estimations of consumption by a single respondent may
overestimate consumption rates. The timing of survey administration (Spring
and Fall) may have influenced consumption reporting for certain species,
however, the survey was structured to query seafood consumption both “in” and
“out” of season.
In contrast, Chiang found markedly lower consumption rates (median 9.2g/day)
in the Laotian immigrant population in California. This may reflect several factors. First, there is a high-profile Superfund site which has contaminated the
Bay near this community, and the lower consumption rates may reflect the
effectiveness of the public awareness program regarding contaminated fish in local waters. Second, survey instrument differences may account for some of the
disparity. In Chiang’s survey, a single model was used to estimate usual seafood
portion size for both finfish and shellfish species together, and then grouped usual consumption frequencies into imprecise categories(e.g. more than
once/day, 3-4 times/week, a few times a month, etc), which may have resulted
in consumption rate underestimation. Finally, our study used models portraying uncooked weights except for crab and bivalve shellfish, whereas Chiang referred
to cooked weight. Jacobs (1998) indicates that an uncooked fish portion is ~22%
heavier than cooked fish.
Studies, using similarly structured questionnaires to that in our study, of Pacific
Northwest Native Americans who fish for subsistence have also documented high rates of fish consumption. Men in the Tulalip and Squaxin Island Tribes
(Toy, 1995) consumed a median of 53 g/day and 66 g/day for the two tribes
respectively, while women consumed a median rate of 34 g/day and 25 g/day. Among the Umatilla, Nez Perce, Yakama and Warm Springs Tribes of the
Columbia River Basin, median seafood consumption was 40 gram/d among
tribal members who eat fish (mean=63g/d), and 32 g/d (mean =58.7g/d) among all tribal members (n=500). Easy access to marine waters as well as fresh water
may account for the higher consumption rates among the Tulalip and Squaxin
Island Tribes.
SEAFOOD SOURCES
Our study showed that the majority of seafood is obtained at grocery stores,
street vendors, or from restaurants, with harvesting by self, family or friend
being used less often. While these numbers appear to suggest that the majority of seafood consumed is from “commercial” sources, locally caught fish, possibility
from contaminated sources, may be sold by vendors trying to cut costs. Chiang’s
study suggests that smaller markets and street vendors may be the source of a large percentage of seafood. She reported that 50% of the Laotian community
used large markets (e.g., Lucky, Costco, Safeway), 57% small markets, 55% a
fisher person/fish truck/farmer’s market, and 54% harvested (self/family/friend).
In our study, harvested seafood comprised less than one quarter of the total consumption; nevertheless, differences were observed among the ethnic groups.
Members of the Mien community seem to harvest seafood more often than other
ethnic groups. The percentage of time Miens consumed harvested fish were: 100% for bottom fish, 84% for freshwater fish, 54% for anadromous fish, 35% for
pelagic fish, and 34% for shellfish. However their total seafood consumption
was the lowest of all surveyed ethnic groups. Cultural traditions may play a role because Miens immigrated from the rural highland areas of Laos (Gilman, 1992)
where harvested fish may have not been readily available and therefore
consumption might not be as customary. In addition, 60% of Mien participants lived below the FPL. Even though the Mien community does not consume as
much seafood as other APIs, they may have greater risks for seafood
contaminant exposure because they harvest more for subsistence. Chiang’s study determined the number of fishermen (n=95) and their main reason for
fishing, of whom 53% fished “for food” compared with 37% for “recreation”, 1%
for “traditional” reasons, and 10% “no answer”. Despite the small sample size, these pilot data warrant follow-up study.
SEAFOOD SPECIES AND TISSUE PARTS CONSUMED
APIs consume a wide variety of seafood species, the most frequently consumed
being shellfish. These seafood, depending on their feeding and habitat
characteristics, and the tissue parts consumed pose varying chemical
contaminant risks to APIs. For example, certain fat soluble chemicals, e.g. PCB’s are concentrated in the fat layer between the meat and skin, potentially exposing
such consumers to higher contaminant levels than those who simply eat the fillet.
Eating the fillet with skin is clearly a common practice in the API community. Chiang (1998) determined that of Laotian community members who had ever
fished in San Francisco Bay (n=88), 76% “always” ate the fillet with skin, 23%
“sometimes” ate the skin, and 1% “never” ate the skin. Among all our study participants 30% “always” ate the fillet with skin, 42% “sometimes”, and 28%
“never”. Overall, skin was consumed with the fillet 55% of the time.
Consumption of fillet with skin appeared to vary with ethnicity, but interpretation is difficult because of the small numbers. Among the Hmong
(n=5), Vietnamese (n=25), and Mien (n=9), and Laotian (n=20) the fillet with skin
was consumed 100%, 78%, 67%, and 42% of the time, respectively.
In addition to concern about consuming fillets with skin, information about
contaminant levels in other fish tissues may be insufficient for culturally appropriate risk assessment (e.g., head, bone, eggs, and/or organs) because risk
assessors have not felt that they are commonly eaten. In this study, these parts
were eaten 20% of the time, (8% said they "always", and 36% reported they "sometimes" eat head, bone, eggs, and/or organs). Unfortunately our data
cannot determine which of these body parts are eaten more frequently. Salmon
eggs were consumed by 27% of participants, and other types of fish eggs by 10%. This is similar to Chiang’s findings that ‘organs’ were “always” consumed by 6%
and “sometimes” consumed by 41%. Wong (1997) found that 98% of 228 mixed
race fishermen residing near San Francisco Bay (36% Asian, 24% Caucasian, 14% Latino, 12% African American, 7% mixed race, 2% Pacific Islander) consumed
‘non-fillet parts’ (e.g., skin, eggs, heads, guts) when perch was eaten. Similar
rates were found for striped bass (84%) and white croaker (77%).
API community members appear to eat shellfish parts that are thought to contain
higher concentrations of chemical contamination, e.g. clam stomachs or the hepatopancreas of crabs (Faigenblum, 1988; Matter, 1994). Bivalve shellfish were
consumed whole by 24% (geoduck) to 89% (mussels) of the respondents
depending on the species. The “butter” as well as the meat of crabs were consumed 43% of the time, and though moon snails are not eaten by most
respondents, 38% of the time the entire moonsnail is eaten. Finally, cooking water, both for finfish and shellfish are commonly used in cooking or directly
consumed.
Cost considerations frequently preclude chemical contaminant analyses for these
tissues. Certainly for the API’s, seafood related risk assessment should include
chemical analyses of all consumed tissue parts for the most frequently consumed species. For instance, crabs were commonly consumed (96% of API’s), and 43%
of the time the “butter” of the crab, including the hepatopancreas was consumed.
Selection of seafood species and tissue part contaminant testing should reflect the cultural consumption habits of specific
“at risk” populations.
FISHERMEN
Fishermen have been reported (Allen 1996, Puffer 1982, Wong 1997) to consume
greater quantities of fish than non-fishermen. These data are generally derived from creel studies and may have surveyed biased groups, e.g. the “10% of
fishermen who catch 90% of the fish”. Our study was not advertised as a fish
consumption study and was expected to have captured a cross-section of fishermen. So, while this study showed that fishermen consumed greater
quantities of seafood than non-fishermen in all seafood categories, these
differences were not significant. In addition, the “higher” consumers (individuals who had seafood consumption rates >75th percentile for finfish or
shellfish) were no more likely to be fishermen than those with lower
consumption rates. Decreased opportunity for fishing is an unlikely reason because King County, Washington’s geographic proximity to Puget Sound and
multiple lakes and rivers, which provide easy access to fresh and salt water
fishing and shellfish collection both in urban (assessable by public transportation) and rural settings. This observation may be explained by cultural
traditions which incorporate seafood into daily diets of most first and second
generation API’s.
EDUCATIONAL OUTREACH INFORMATION
Many recent API immigrants are refugees from war torn countries and understandably distrust government officials or those in authority. Some local
efforts to establish communication with APIs have emphasized active support
and involvement of local API community service organization, as well as information conveyance through API community members and organizations
(Clifford, 1998; Tebaldi, 1999).
Our survey examined the educational preferences and fishing information
sources of APIs. Respondents expressed a preference for written material as a
way of learning. The preferred media were API community newspapers/newsletters, while bulletin boards were deemed reliable by only
16% of respondents. Audio-visual communication; e.g. television and word of
mouth were also preferred, but videos (35%) and slide shows (4%) were less favored. Radio broadcasts in API languages were used by a relatively small
percentage (16%), but multiple dialects may be a factor, and for specific groups
may be effective. Wong (1997) successfully used both a seafood cooking demonstration and pamphlet to educate children and adults about minimizing
exposures to chemically contaminated San Francisco Bay fish.
The API respondents were very concerned about health. They wanted health
information about eating fish, as well as safety information about Puget Sound
seafood. Very few fishermen said they were not concerned about the safety of fish (6%) or that they never try to find out about fishing safety (3%). Among
fishermen, fishing safety information is mainly obtained by word of mouth (65%)
and posted warning signs (59%). Education beyond high school appeared to play a positive role in utilization of posted warning signs, pamphlets, and telephone
information services, e.g. Washington State shellfish information and Red Tide
Hotline. Information from API community centers and API radio broadcast were more frequently deemed reliable by those with < high school, and may be
effective for disseminating information to specific groups.
CONCLUSIONS
API community members consume greater amounts of seafood, as well as differing species and tissue parts than the majority of U.S. citizens and residents.
These consumption patterns, while having significant general health benefits,
may pose a health risk if consumed seafood is contaminated with toxic chemicals. Evaluation of existing seafood toxicity data is warranted to determine
if sufficient data exists for the tissue parts described in this report.
API-specific risk assessments that take into account these higher consumption
rates, species consumed, tissue parts consumed, and the sources of seafood
acquisition need to be completed. API-specific risk assessments will help the API community determine if a risk exists, what activities increase risk, and which
community members have the highest risk. Such an analysis should also focus
on the benefits of consuming seafood and on culturally acceptable ways of reducing what risks may exist. Health messages should be designed and
delivered by API community members (including those of the first generation
who may have the highest risks) through partnership relationships with public health agencies.
The ethnic group specific data generated in this study is useful to identify information needs, but it is based upon relatively small group numbers. It
should be used with caution, if at all, for regulatory or risk assessment purposes
without additional verification. Further study of API community seafood acquisition habits, specific tissue parts consumed, and preparation methods are
important, particularly for members of the Hmong, Laotian, Mien and
Vietnamese communities because our pilot data suggest that they may have higher health risks if seafood is contaminated with toxic chemicals.
ACKNOWLEDGMENTS
This study would not have been possible without the generosity of the Cambodian, Chinese, Filipino, Hmong, Japanese, Korean, Laotion, Mien, Samoan, and Vietnamese communities. We especially thank the participants from these communities for their willingness to provide the authors with the data needed to understand how Asian and Pacific Islanders acquire, prepare, and consume seafood. Their contributions to this study has provided invaluable information for their respective communities, the scientific community, and the community at large.
The collaboration between the Community Steering Committee (CSC) and the authors was a groundbreaking experience. Without the CSC members’ time and effort, this study would not have materialized. Moreover, their knowledge and experience of the communities of focus, as well as their advice on interviewing strategies and communication tools, assured a positive outcome for all involved. We are most grateful for their contributions to this study.
Community Steering Committee Ms. Bee Chang, Hmong community Mr. Chanthone Chin, Program Coordinator, The Coalition of Lao Mutual
Assistance Association of Washington State Ms. Regina Chae, Korean community Mr. Paul Egashira, Japanese community Mr. Ngy Hul, President, Khmer Community of Seattle-King County; Acting
Executive Director, Refugee Federation Service Center Mr. Nisay Nuth, Program Coordinator, Khmer Community of Seattle King
County Ms. Luningning Murro, Filipino community Mr. Edwin Obras, Director of Development Operational Emergency Center Mr. Stan Shikuma, Japanese community Ms. Oanh Tran, Case Manager, Refugee Federation Service Center Mr. Simon Truong, Social Services Director, Refugee Federation Service Center;
President, Indochina Chinese Refugee Association Mr. Yaochien Sirisisangpha, Case Manager, Refugee Federation Service Center Ms. Lynna Song, Seattle-Washington State Korean Association Mr. Savieng Soukhaphonh, Laotian community Ms. May Wong, Beacon Hill Driving School Ms. Benling Wong, Seattle Public Library
We would like to thank the Taiwanese Association of Seattle for its endeavors to involve people from Taiwan in the study as a part of the Chinese community. We understand that many in the Taiwanese American community recognize Taiwan as a separate nation from China, and we respect their position.
Our study focused on cultural consumption habits only and does not reflect a political position.
Additionally, we thank the Fujinkal Association with the Seattle Betsuin Temple as well as other API community religious organizations for helping to recruit participants. Several religious organizations in the communities of focus provided assistance in the participant recruitment process and cannot be listed here for confidentiality concerns.
We are grateful to the following scientists and community activists for their participation and technical guidance. We appreciate their expertise as well as their concern for populations who may be impacted by environmental contaminants.
Technical Committee Dr. Kenneth Chew, Director, Administrative Office, Western Region Aquaculture
Center Dr. Richard Fenske, Professor, Environmental Health Mr. Gregory Glass, Environmental Consultant Dr. Steven Gilbert, Director, Institute for Neurotoxicology Dr. Joan Hardy, Washington State Dept. of Health, Environmental Health
Assessment Services Ms. Leslie Keill, Toxicologist, Washington State Department of Ecology Dr. Marsha Landolt, Dean and Vice Provost, UW Graduate School Dr. Roseanne M. Lorenzana, Toxicologist, US EPA, Region 10 Mr. Craig McCormack, Senior Toxicologist, Washington State Department of
Ecology Mr. Jonathan Sheilds, Water Quality Planner, Dept. of Natural Resources Dr. Juliet Van Eenwyk, Director, Non-Infectious Conditions Epidemiology,
Washington State Department of Health
Advisory Committee Dr. Elizabeth Evans, Rainier Center Clinic Mr. Joseph Johnson, Boeing Ms. Marcia Lagerloef, Water Quality Standards, US EPA, Region 10 Ms. Roberta Gunn, Executive Director, Puget SoundKeeper Alliance Dr. Laura Weiss, Washington State Department of Ecology Dr. John Wekell, Research Chemist, US Dept. of Commerce, NOAA
The interviewers and translators were recruited from the ten participating communities. They provided the vital link in the success of this study: obtaining data from the study participants and recording it in a way the statisticians could accurately measure. Their patience and diligence in interviewing the participants was remarkable, as was their accurate recording of data.
Bilingual Interviewers and Translators Ms. Helen S. Barber, Filipino interviewer Ms. Regina Chae, Korean interviewer Mr. Pang Chang, Hmong interviewer Mr. Jeff Dang, Vietnamese interviewer Ms. Alison Doungphouchan, Laotian interviewer Ms. Chenda Eng, Cambodian translator Ms. Jeanie Li, Chinese interviewer Ms. Mia Matsubara, Japanese interviewer/translator Ms. Luningning Murro, Filipino translator Mr. Chet Ouch, Cambodian interviewer Mr. Ton Saechao, Mien interviewer/translator Mr. Robert Tausili, Samoan interviewer/translator Ms. Jenny Wong, Chinese translator
We thank the University of Washington—National Institute for Environmental Health Sciences (UW-NIEHS) Center for Ecogenetics and Environmental Health for providing technical experts and facilities required to help bring this study and report to completion.
This was truly a multi-cultural, multi-disciplinary community study. Many individuals from the focus communities, Washington state governmental agencies, grassroots community groups, as well as the University of Washington, have contributed to the success of this endeavor. Following are listed those who have helped us realize this project.
Editor Ms. Anne B. Harrington, Information Specialist II, UW-NIEHS Center for
Ecogenetics and Environmental Health
Mr. Michael Antee, Washington State Dept. of Health, Office of Shellfish Programs
Ms. Jude Ballard, Fred Hutchinson Cancer Research Center, Seattle, WA Ms. Audrey Chiang, Asian Pacific Environmental Network, Oakland, CA Ms. Angela Chung, US EPA, Washington, D.C. Mr. Wayne Clifford, Washington State Dept. of Health, Office of Shellfish
Programs Mr. Floyd Davis, Accountant, Refugee Federation Service Center Dr. David L. Eaton, Director, UW-NIEHS Center for Ecogenetics and
Environmental Health Ms. Sharon Elliott, Manager, UW-NIEHS Center for Ecogenetics and
Environmental Health Mr. Seng Nguon Eng, Social Services Coordinator, Refugee Federation Service
Center
Governor Gary Locke Ms. Virginia McFerran, UW-NIEHS Center for Ecogenetics and Environmental
Health Mr. Christopher Moffett, Graphic Designer, US EPA, Region 10 Mr. Long Kim Nguyen, President, Vietnamese Association of Greater Seattle Dr. Raphael A. Ponce, Research Scientist, UW Department of Environmental
Health Ms. Frances Robinson, UW-NIEHS Center for Ecogenetics and Environmental
Health Mr. Jim Simmonds, Water Quality Planner II, King County Water and Land
Resources Division Ms. Yolanda Sindé, Director, Community Coalition for Environmental Justice Mr. Chin Tan, Case Manager, Refugee Federation Service Center Washington State Representative Kip Tokuda Doc Thompson, Manchester Lab, US EPA, Region 10 Dr. Margaret Tudor, Washington State Department of Fish and Wildlife
Ecosystem Education Washington State Representative Velma Veloria Ms. Kristine Wong, Community Coalition for Environmental Justice Ms. Cissie Yan, Administrative Assistant, Indochina Chinese Refugee
Association
REFERENCES
Allen JM, Velez PV, Diehl DW, McFadden SE, Kelsh M (1996). Demographic variability in seafood consumption rates among recreational anglers of Santa Monica Bay, California, in 1991-1992. Fishery Bulletin. 94:597-610
Bloom, NS (1992). On the chemical form of mercury in edible fish and marine invertebrate tissue. Can J. Fish Aquat Sci, 49, 1010-1017
CRITFC (Columbia River Inter-Tribal Fish Commission). 1994. A Fish Consumption Survey of the Umatilla, Nez Perce, Yakama, and Warm Springs Tribes of the Columbia River Basin CRITFC Technical Report 94-3. Portland, Oregon.
Chiang A, A Seafood Consumption Survey of the Laotian Community of West Contra Cost County, California. Asian Pacific Environmental Network, March 1998.
Clean Water Act, Section 304 (a). Appendix C – Guidelines and methodology used in the preparation of health effects assessment chapters of the consent decree water criteria document, 45 FR 79347, November 28, 1980.
Clifford W. (1998) “Barriers to Reducing High Risk Recreational Shellfish Harvesting”, conference presentation at the 5th Annual Joint Conference on Health, Yakima, Washington.
Faigenblum J (1988). Chemicals and Bacteriological Organisms in Recreational Shellfish; Final Report Co-operative Agreement; U.S. EPA, Region X; State of Washington Department of Health 6B ML87A000.
Federal Register: August 14, 1998, Volume 63. Number 157, Page 43755-43828.
Fisher, L.D., van Belle, G. 1993. Biostatistics: A Methodology for Health Sciences. New York: John Wiley & Sons.
Gilman SC, Justice J, Saepharn K and Charles G. (1992) “Cross-cultural Medicine A Decade Later” Western Journal of Medicine. Sep; 157-310-315.
Jacobs, et. al, “Estimates of per capita Fish Consumption in the U.S. Based on the Continuing Survey of food Intake by Individuals (CSFII), Risk Analysis, vol. 18. no. 3, 1998, 283-291.)
Javitz H. 1980. Seafood consumption data analysis. U.S. EPA Contract 68-01-3887. Prepared by SRI International for the Office of Water /Regulations and Standards, Washington, D.C.)
Kendall, M.G., Stuart, A. 1963. The Advanced Theory of Statistics, vol. 1. New York: Hafner Publishing Co., 236-237.
Landolt, M.L., Hafer, F.R., Nevissi A., van Belle G., van Ness K., and Rockwell, C. 1985. Final Report, “Potential Toxicant Exposure among Consumers of Recreationally Caught Fish from Urban Embayments of Puget Sound.” NOAA Technical Memorandum No. OMA 33. National Oceanic and Atmospheric Administration. Rockville, MD.
Landolt, M.L., Hafer, F.R., Nevissi A., van Belle G., van Ness K., and Rockwell, C. 1987. Final Report, “Potential Toxicant Exposure among Consumers of Recreationally Caught Fish from Urban Embayments of Puget Sound.” NOAA Technical Memorandum No. OMA 33. National Oceanic and Atmospheric Administration. Rockville, MD.
Leikin JB and Paloucek FP. (1996-1997) Poisoning & Toxicology Handbook. 2nd
Edition, Lexi-Comp, Hudson, Ohio.
Matter, AL. (1994). Paralytic Shellfish Poisoning: Toxin Accumulation in the Marine Food Web, With Emphasis on Predatory Snails: U.S. EPA, Region X; U.S. EPA 910/R94-005.
McCallum, M. 1985. “Seafood Catch and Consumption in Urban Bays of Puget Sound.” Washington State Division of Health, Epidemiology Section.
Nakano C & Lorenzana R (1996) Asian and Pacific Islander Seafood Consumption Study: Exposure Information Obtained through a Community-Center Approach., U.S. EPA 910/R-96-007, August 1996).
OSWER directive 9285.6-03.
Pierce, D., Noviello D., and Rogers, S. (Dec. 1981) “Commencement Bay Seafood Consumption Study.” Tacoma-Pierce County Health Department. Seattle, WA.
Puffer HW, Azen SP, Duda MJ Young DR (1982) Consumption Rates of Potentially Hazardous Marine Fish Caught in the Metropolitan Los Angeles Area. University of Southern California School of Medicine.
Departments of Pathology and Preventive Medicine. Los Angeles, CA: Report No. U.S. EPA-600/3-82-070. June 1982.
State of Washington Population Trends, October, 1998. Office of Financial Management, State of Washington.
Tebaldi J, Memo to Juliet Van Eenwyk, Acting State Epidemiologist regarding API Seafood Consumption Survey Study Review, May 19, 1999.
Toy K, Gawne-Mittelstaedt G, Polissar N and Liao S. 1996. A Fish consumption survey of the Tulalip and Squaxin Island tribes of the Puget Sound region. Tulalip Tribes, National Resources Department, Marysville, Washington
United States Census Bureau, “King County, Washington” (1990).
United States Department of Agriculture, Continuing Survey of Food Intakes by Individuals, Data Set and Documentation (Agriculture Research Service, Beltsville Human Nutrition Research Center, Beltsville, Maryland 20705, 1990).
U.S. EPA, Supplemental Guidance for Superfund Risk Assessment in Region 10, 1991.
U.S. EPA, Exposure Factors Handbook, U.S. EPA/600/P-95/002Fb, August 1997.
Washington Department of Ecology, Analysis and selection of fish consumption rates for Washington State risk assessments and risk-based standards, external review draft, March 1999.
Wong K, Fishing for Food in San Francisco Bay: Part II. Save San Francisco Bay Association, 1997).