Embed Size (px)
Citation preview

Chris TarryAviation Industry Research and Advisory
CTAIRA
Dreams and Realities
Will the airline industry ever be sufficiently profitable?
Chris Tarry
Guildford
June 11th 2003

Chris TarryAviation Industry Research and Advisory
CTAIRA
A simple business strategy for airlines
Survive
Compete
Prosper

Chris TarryAviation Industry Research and Advisory
CTAIRA
The real cyclical issue – the life cycleFor the airline industry :
Is maturity and decline the only option?
Does structural rigidity mean an inability to change?
Has the managerial prerogative at some airlines been ceded?
Is the fundamental and necessary change impossible?
Are the costs of change too high?
Will there be further exits?
Opportunities for segmental new entrants

Chris TarryAviation Industry Research and Advisory
CTAIRA
Airline traffic and capacity trends
Passnger traffic and capacity index 1972-2002
0
100
200
300
400
500
600
1972
1973
1974
1975
1976
1977
1978
1979
1980
1981
1982
1983
1984
1985
1986
1987
1988
1989
1990
1991
1992
1993
1994
1995
1996
1997
1998
1999
2000
2001
2002
Ind
ex 1
972=
100
Passenger traff ic Passenger capacity

Chris TarryAviation Industry Research and Advisory
CTAIRA
Long term industry trends
Load factors and margins 1970 -2000
-2.00
0.00
2.00
4.00
6.00
8.00
10.00
1970
1972
1974
1976
1978
1980
1982
1984
1986
1988
1990
1992
1994
1996
1998
2000
% lo
ad f
acto
r
35.00
45.00
55.00
65.00
75.00
Operating margin Load factor est BE load factor

Chris TarryAviation Industry Research and Advisory
CTAIRA
Reported traffic and GDP
GDP, ASK and RPK 1972-2002
-10
-5
0
5
10
15
1972
1974
1976
1978
1980
1982
1984
1986
1988
1990
1992
1994
1996
1998
2000
2002
E
% c
hang
e GDP change
Change (ASK)
RPK change
Data: IMF/IATA

Chris TarryAviation Industry Research and Advisory
CTAIRA
Forecasting issues – traffic and real GDP
Capacity and traffic ratios with GDP
-6.00
-4.00
-2.00
0.00
2.00
4.00
6.00
8.00
10.0019
72
1974
1976
1978
1980
1982
1984
1986
1988
1990
1992
1994
1996
1998
2000
x
RPK/GDP
ASK/GDP
Data: IMF, IATA

Chris TarryAviation Industry Research and Advisory
CTAIRA
US Airlines: scheduled traffic and GDP
US airlines: Scheduled traffic and GDP changes
-8.0
-6.0
-4.0
-2.0
0.0
2.0
4.0
6.0
8.0
1990 1991 1992 1993 1994 1995 1996 1997 1998 1999 2000 2001
% c
han
ge
Traffic Real GDP
Source: BTS/IMF

Chris TarryAviation Industry Research and Advisory
CTAIRA
US traffic multipliers
US airlines : passenger traffic multiplier with GDP
0.0
0.5
1.0
1.5
2.0
2.5
3.0
3.5
4.0
4.5
5.0
1990 1991 1992 1993 1994 1995 1996 1997 1998 1999 2000
Source: BTS/IMF

Chris TarryAviation Industry Research and Advisory
CTAIRA
Long term US yield trends in a mature market
US Domestic yields
0
2
4
6
8
10
12
14
16
18
1971
1973
1975
1977
1979
1981
1983
1985
1987
1989
1991
1993
1995
1997
1999
2001
US
c
Nominal Real (1978 cents) Linear (Real (1978 cents)) Linear (Nominal)

Chris TarryAviation Industry Research and Advisory
CTAIRA
US Airlines: Fare changes vs. 2 years ago
Source: ATA
US fares vs 2 years ago
-25.00
-20.00
-15.00
-10.00
-5.00
0.00
Jan-
02
Feb
-02
Mar
-02
Apr
-02
May
-02
Jun-
02
Jul-0
2
Aug
-02
Sep
-02
Oct
-02
Nov
-02
Dec
-02
Jan-
03
Feb
-03
Mar
-03
Apr
-03
% c
han
ge
International Domestic
Chris TarryAviation Industry Research and Advisory
CTAIRA
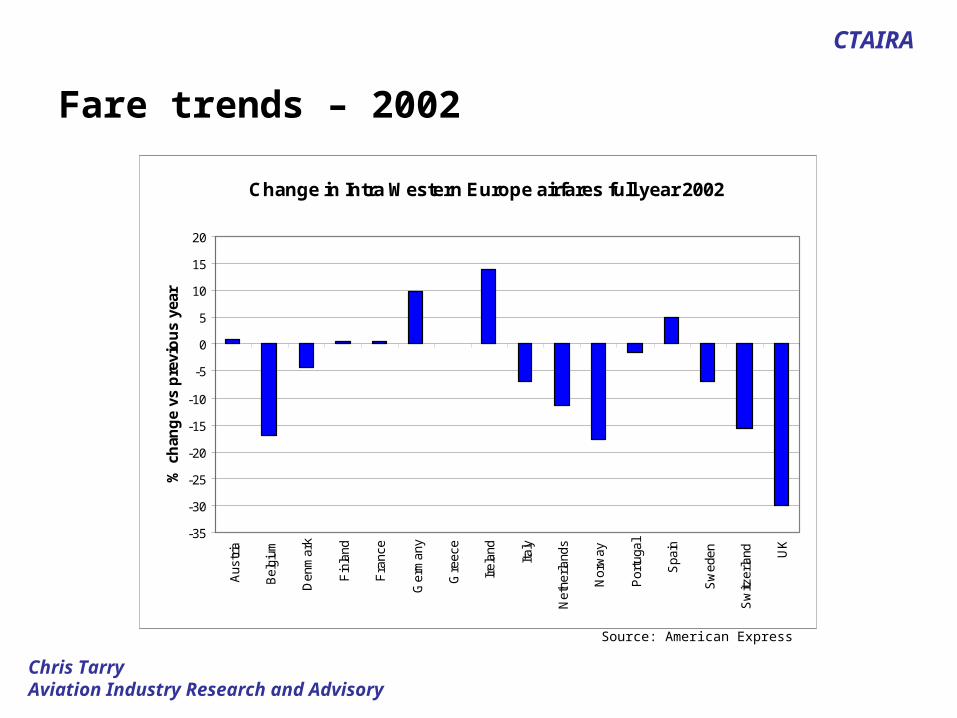
Fare trends – 2002
Source: American Express
Change in Intra Western Europe airfares full year 2002
-35
-30
-25
-20
-15
-10
-5
0
5
10
15
20A
ustr
ia
Bel
gium
Den
mar
k
Fin
land
Fra
nce
Ger
man
y
Gre
ece
Irel
and
Italy
Net
herla
nds
Nor
way
Por
tuga
l
Spa
in
Sw
eden
Sw
itzer
land U
K
% c
han
ge
vs p
revi
ou
s ye
ar

Chris TarryAviation Industry Research and Advisory
CTAIRA
AEA members overall
AEA Airlines all markets vs 2 years ago
-18.00
-16.00
-14.00
-12.00
-10.00
-8.00
-6.00
-4.00
-2.00
0.00
Jan-
02
Feb
-02
Mar
-02
Apr
-02
May
-02
Jun-
02
Jul-0
2
Aug
-02
Sep
-02
Oct
-02
Nov
-02
Dec
-02
Jan-
03
Feb
-03
Mar
-03
Apr
-03
% c
han
ge
Traff ic Capacity
Data: AEA
Chris TarryAviation Industry Research and Advisory
CTAIRA
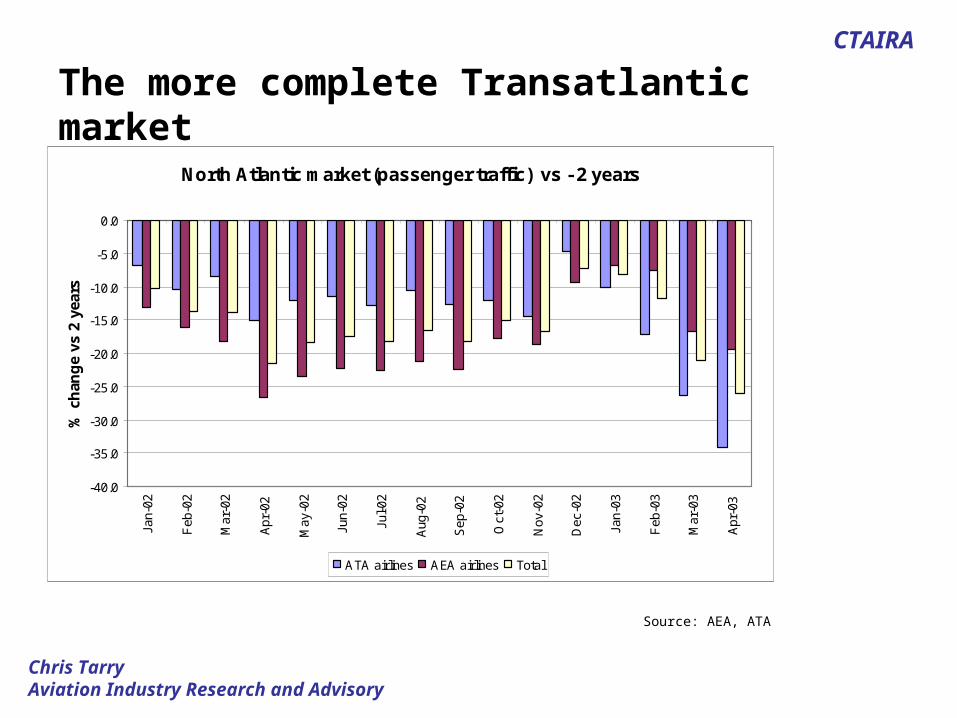
The more complete Transatlantic market
Source: AEA, ATA
North Atlantic market (passenger traffic) vs - 2 years
-40.0
-35.0
-30.0
-25.0
-20.0
-15.0
-10.0
-5.0
0.0
Jan-
02
Feb
-02
Mar
-02
Apr
-02
May
-02
Jun-
02
Jul-0
2
Aug
-02
Sep
-02
Oct
-02
Nov
-02
Dec
-02
Jan-
03
Feb
-03
Mar
-03
Apr
-03
% c
han
ge
vs 2
yea
rs
ATA airlines AEA airlines Total

Chris TarryAviation Industry Research and Advisory
CTAIRA
Forecasting issues –revenue and nominal GDP
Data: IMF, ICAO
Nominal GDP multiplier for Airline Industry revenue
-6.00
-5.00
-4.00
-3.00
-2.00
-1.00
0.00
1.00
2.00
3.0019
71
1973
1975
1977
1979
1981
1983
1985
1987
1989
1991
1993
1995
1997
1999
2001
X

Chris TarryAviation Industry Research and Advisory
CTAIRA
Economic Forecasts: Current Prices
1999 2000 2001 2002 2003E 2004E
AUSTRALIA 5.2 7.1 6.3 6.2 7.7 6.0
CHINA,P.R.:HONG KONG -2.6 3.4 -0.7 -0.6 1.3 2.5
FRANCE 3.7 4.7 3.3 2.9 3.0 3.9
GERMANY 2.6 2.6 2.0 1.8 1.6 3.2
ITALY 3.3 5.3 4.6 3.1 3.6 4.1
JAPAN -1.3 0.8 -1.2 -1.4 -0.5 0.1
KOREA 8.6 8.1 4.4 5.9 5.2 8.6
SINGAPORE 0.5 14.3 -3.6 2.4 3.9 5.3
SPAIN 7.1 7.8 6.9 6.5 6.1 6.0
UNITED KINGDOM 5.0 5.3 4.3 4.7 4.8 4.8
UNITED STATES 5.6 5.9 2.6 3.6 4.1 5.8
Source: IMF

Chris TarryAviation Industry Research and Advisory
CTAIRA
Europe: Changing market terminology
Low cost airlineLow fare airlineNew entrant airlineTravellerCustomer Business travellerProductCommoditySegment

Chris TarryAviation Industry Research and Advisory
CTAIRA
Product issues
What constitutes the product offer?The flight?
Flexibility?
Timing?
Frequency?
Airport attractiveness?
On board service?
On ground service
It depends – Each of us will value and price the attributes differently

Chris TarryAviation Industry Research and Advisory
CTAIRA
The London area experience
Source: CAA
% change in intra EU schduled passenger numbers
-20.00
-10.00
0.00
10.00
20.00
30.00
40.00
50.00
60.00
70.00
1998 1999 2000 2001 2002
% c
han
ge
LGW LHR LCY LTN STN
Chris TarryAviation Industry Research and Advisory
CTAIRA
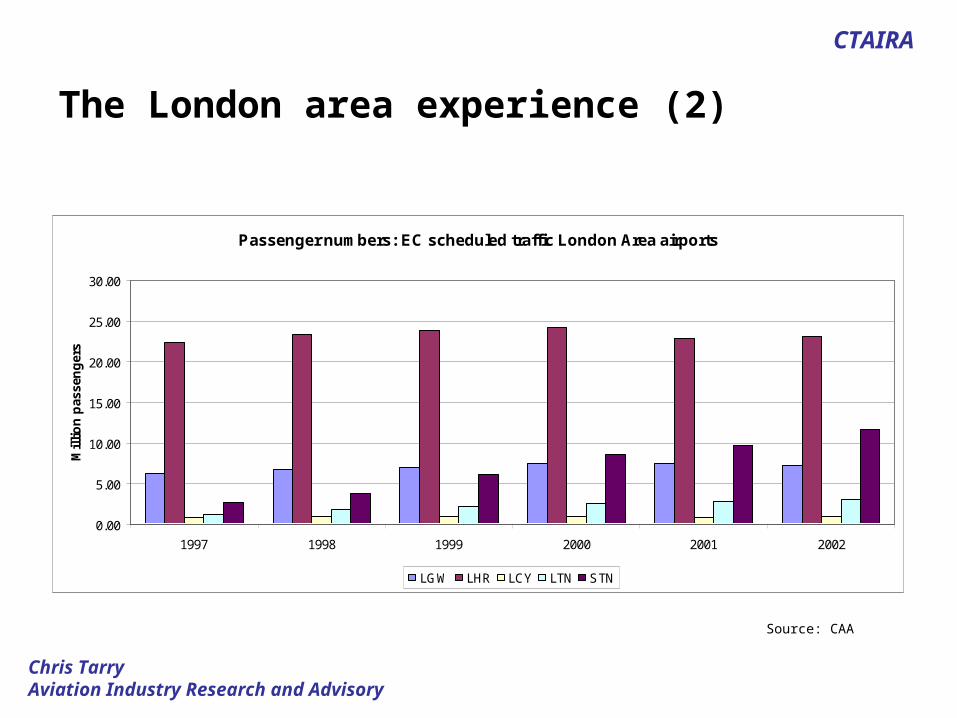
The London area experience (2)
Source: CAA
Passenger numbers: EC scheduled traffic London Area airports
0.00
5.00
10.00
15.00
20.00
25.00
30.00
1997 1998 1999 2000 2001 2002
Mil
lio
n p
asse
ng
ers
LGW LHR LCY LTN STN

Chris TarryAviation Industry Research and Advisory
CTAIRA
The London area experience (3)
Source: CAA
Changing shares: London area EC scheduled traffic
0.00
10.00
20.00
30.00
40.00
50.00
60.00
70.00
80.00
1997 1998 1999 2000 2001 2002
% o
f th
e to
tal
LGW LHR LCY LTN STN
Chris TarryAviation Industry Research and Advisory
CTAIRA
The Mainline response (1)
With a focus on:Price discriminators
Quality discriminators
Now able to offer “more options”Club to Full fare Economy
Full Fare Economy to Restricted Economy
Fundamentally changed “rules of engagement”

Chris TarryAviation Industry Research and Advisory
CTAIRA
Mainline response (2)
Fare structure simplification
Easier internet booking process
Raising awareness of value proposition
Chris TarryAviation Industry Research and Advisory
CTAIRA
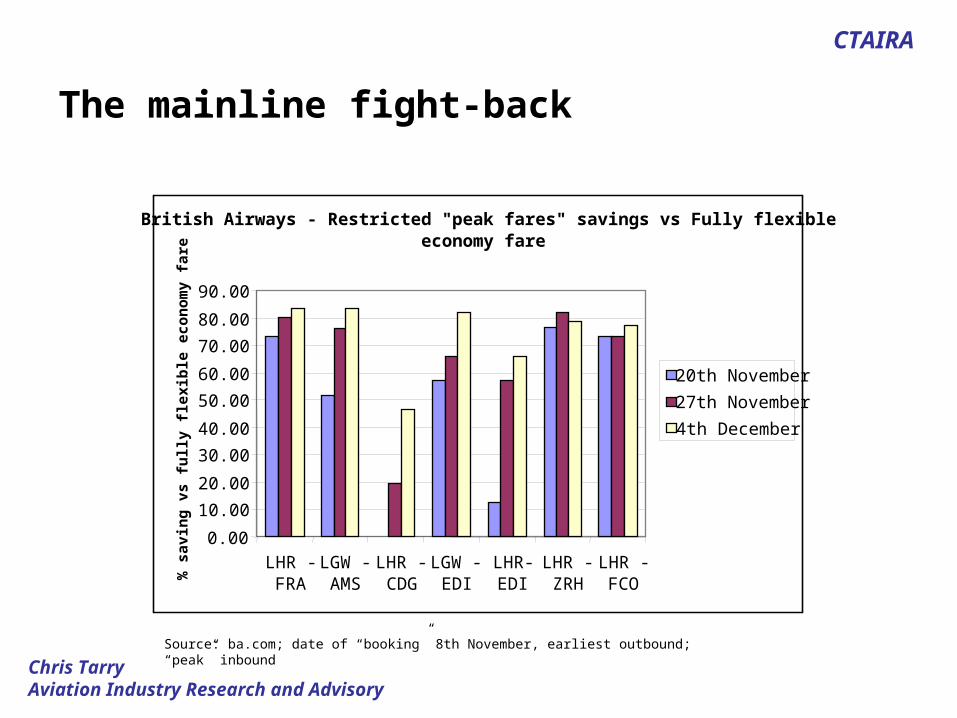
The mainline fight-back
Source: ba.com; date of “booking” 8th November, earliest outbound; “peak” inbound
British Airways - Restricted "peak fares" savings vs Fully flexible economy fare
0.00
10.00
20.00
30.00
40.00
50.00
60.00
70.00
80.00
90.00
LHR -FRA
LGW -AMS
LHR -CDG
LGW -EDI
LHR-EDI
LHR -ZRH
LHR -FCO
% s
avin
g v
s fu
lly
flex
ible
eco
no
my
fare
20th November
27th November
4th December

Chris TarryAviation Industry Research and Advisory
CTAIRA
The mainline fight-back
British Airways: lowest restricted "peak fares" + fully flexible one way - saving or loss vs fully flexible return
-60.00
-50.00
-40.00
-30.00
-20.00
-10.00
0.00
10.00
20.00
30.00
40.00
LHR -FRA
LGW -AMS
LHR -CDG
LGW -EDI
LHR-EDI
LHR -ZRH
LHR -FCO
% s
avin
g o
r lo
ss v
s fu
lly f
lexi
ble
eco
no
my
fare
20th November
27th November
4th December
Source: ba.com; date of “booking” 8th November, earliest outbound; “peak” inbound

Chris TarryAviation Industry Research and Advisory
CTAIRA
The UK in an intra-European context
Source: American Express
Intra European economy fares as % of European average Q4 2002
0.0
20.0
40.0
60.0
80.0
100.0
120.0
140.0
160.0
180.0S
witz
erla
nd
Aus
tria
Bel
gium Ita
ly
Ger
man
y
Den
mar
k
Fra
nce
Fin
land
Net
herla
nds
Sw
eden U
K
Gre
ece
Irel
and
Spa
in
% o
f E
uro
pea
n a
vera
ge
Economy Leisure
Economy

Chris TarryAviation Industry Research and Advisory
CTAIRA
Traffic experience at British Airways
Source: Company reports
British Airways: UK and Europe RPKs and ASKs vs - 2 years
-18.00
-16.00
-14.00
-12.00
-10.00
-8.00
-6.00
-4.00
-2.00
0.00
Apr-02
May-02
Jun-02
Jul-02 Aug-02
Sep-02
Oct-02
Nov-02
Dec-02
Jan-03
Feb-03
Mar-03
Apr-03
% c
han
ge
vs -
2 y
ears
Traff ic Capacity

Chris TarryAviation Industry Research and Advisory
CTAIRA
Traffic mix issues - overall
Source: British Airways
British Airways Premium traffic trends index 1996=100
0.00
20.00
40.00
60.00
80.00
100.00
120.00
140.00A
pril
May
June
July
Aug
ust
Sep
tem
ber
Oct
ober
Nov
embe
r
Dec
embe
r
Janu
ary
Feb
ruar
y
Mar
ch
Ind
ex 1
996
= 1
00
FY2001 FY2002 FY 2003 FY 2004

Chris TarryAviation Industry Research and Advisory
CTAIRA
Traffic mix issues - overall
Source: British Airways
British Airways non-Premium traffic index 1996 = 100
0.00
20.00
40.00
60.00
80.00
100.00
120.00
140.00
Apr
il
May
June
July
Aug
ust
Sep
tem
ber
Oct
ober
Nov
embe
r
Dec
embe
r
Janu
ary
Feb
ruar
y
Mar
ch
1996
= 1
00
FY2001 FY2002 FY 2003 FY 2004

Chris TarryAviation Industry Research and Advisory
CTAIRA
British Airways: Operating profit and margin
British Airways: Operating profit and margin trends
-100
0
100
200
300
400
500
600
700
800
900
1989
1990
1991
1992
1993
1994
1995
1996
1997
1998
1999
2000
2001
2002
2003
£m
-2.00
0.00
2.00
4.00
6.00
8.00
10.00
12.00
14.00
16.00
18.00
%
Operating profit Margin

Chris TarryAviation Industry Research and Advisory
CTAIRA
British Airways: Capacity and traffic trends (1)
Changes in capacity and traffic 1984 - 2003
-20.00
-15.00
-10.00
-5.00
0.00
5.00
10.00
15.00
20.00
25.00
1984
1985
1986
1987
1988
1989
1990
1991
1992
1993
1994
1995
1996
1997
1998
1999
2000
2001
2002
% c
han
ge
vs p
revi
ou
s ye
ar
ATK RTK

Chris TarryAviation Industry Research and Advisory
CTAIRA
British Airways: Capacity and traffic trends (2)
British Airways: Traffic, capacity and revenue 1984-2003
0.0
50.0
100.0
150.0
200.0
250.0
300.0
350.0
400.0
1984
1985
1986
1987
1988
1989
1990
1991
1992
1993
1994
1995
1996
1997
1998
1999
2000
2001
2002
2003
Ind
ex 1
984
= 1
00
Yield per RTK Yield per ATK ATK RTK

Chris TarryAviation Industry Research and Advisory
CTAIRA
British Airways: Load factors and profit margins
British Airways - load factors and margins
-5.00
0.00
5.00
10.00
15.00
20.00
1993 1994 1995 1996 1997 1998 1999 2000 2001 2002 2003
% m
arg
in
56.00
58.00
60.00
62.00
64.00
66.00
68.00
70.00
72.00
load
fac
tor
%
Op margin Load factor B/E load factor

Chris TarryAviation Industry Research and Advisory
CTAIRA
Changes in break even load factors
Source: company data
British Airways: Breakeven and yield
-10.0
-8.0
-6.0
-4.0
-2.0
0.0
2.0
4.0
6.0
8.0
10.0
1985
1986
1987
1988
1989
1990
1991
1992
1993
1994
1995
1996
1997
1998
1999
2000
2001
2002
2003
Yield per ATK Break even Load Factor % change

Chris TarryAviation Industry Research and Advisory
CTAIRA
British Airways: Average revenue per passenger
British Airways; Passenger revenue per passenger
0.00
20.00
40.00
60.00
80.00
100.00
120.00
140.00
160.00
180.00
200.00
1989 1990 1991 1992 1993 1994 1995 1996 1997 1998 1999 2000 2001 2002 2003
£

Chris TarryAviation Industry Research and Advisory
CTAIRA
British Airways: Volume sensitivities
Source: company data
British Airways; Costs revenues and capacity
20
22
24
26
28
30
32
34
36
38
40
1985 1986 1987 1988 1989 1990 1991 1992 1993 1994 1995 1996 1997 1998 1999 2000 2001 2002 2003
pen
ce
-20.00
-15.00
-10.00
-5.00
0.00
5.00
10.00
15.00
20.00
% c
han
ge
Cost per ATK Revenue per ATK ATK change

Chris TarryAviation Industry Research and Advisory
CTAIRA
British Airways: Revenues and Costs (index)
British Airways: Cost and Revenue per ATK
0.0
20.0
40.0
60.0
80.0
100.0
120.0
140.0
1984
1985
1986
1987
1988
1989
1990
1991
1992
1993
1994
1995
1996
1997
1998
1999
2000
2001
2002
2003
Ind
ex 1
984=
100
Cost per ATK Revenue per ATK

Chris TarryAviation Industry Research and Advisory
CTAIRA
British Airways: Productivity measures compared
Source: Company data
British Airways; Measures of employee productivity
0.0
50.0
100.0
150.0
200.0
250.0
300.0
350.0
400.0
450.0
1993 1994 1995 1996 1997 1998 1999 2000 2001 2002 2003
AT
Ks
per
em
plo
yee
(000
)
0.00
0.50
1.00
1.50
2.00
2.50
3.00
3.50
4.00
4.50
Em
plo
yee mu
ltiplier (x)
ATKs per employee Employee multiplier

Chris TarryAviation Industry Research and Advisory
CTAIRA
British Airways : Productivity measures compared
Source: Company data
British Airways: Productivity measures compared (1992=100)
0.00
20.00
40.00
60.00
80.00
100.00
120.00
140.00
1992 1993 1994 1995 1996 1997 1998 1999 2000 2001
Ind
ex F
Y 1
992=
100
ATKs per employee Employee multiplier

Chris TarryAviation Industry Research and Advisory
CTAIRA
British Airways: Total performance measurement
Data:: British Airways
British Airways: Total performance measurement
60.00
70.00
80.00
90.00
100.00
110.00
120.00
1993 1994 1995 1996 1997 1998 1999 2000 2001 2002 2003
Ind
ex 1
993
= 1
00
Traff ic revenue per ATK Revenue per f lying hour Net operating cost per f lying hour

Chris TarryAviation Industry Research and Advisory
CTAIRA
For the mainline airlines - what needs to be done? Reduce of structural excess supply
Differentiate increasingly commoditised products
Address the gap between “customer and the traveller”
React to changing market structures
Structurally reduction of cost
Improve shareholder returns

Chris TarryAviation Industry Research and Advisory
CTAIRA
Will airlines make sufficient profits?
It depends, but the consequences of failure include:
– Increased perception of financial risk increases
– Increased cost of capital
– Falling asset values
– Greater separation between “haves and have-nots”
– Survivability

Chris TarryAviation Industry Research and Advisory
CTAIRA
This report has been prepared and issued by Chris Tarry Aviation Industry Research and Advisory Limited a business that is not registered to give investment advice.
This report is for information purposes only and should not be construed as giving investment advice. Chris Tarry Aviation Industry Research and Advisory Limited accepts no responsibility or liability whatsoever for any expense, loss or damage arising out of or in any way connected with the use of all or any part of this report.
No part of this report may be reproduced or distributed in any manner without permission of Chris Tarry Aviation Industry Research and Advisory Limited.
Chris Tarry Aviation Industry Research and Advisory Limited [email protected] +44 1892 512034