Embed Size (px)
Citation preview
The fact that we can m d e l a PFR with a
large number of CSTRs is an
imporrant result.
58 Conversion and Reactor Sizing Chap. 2
Conversion, X
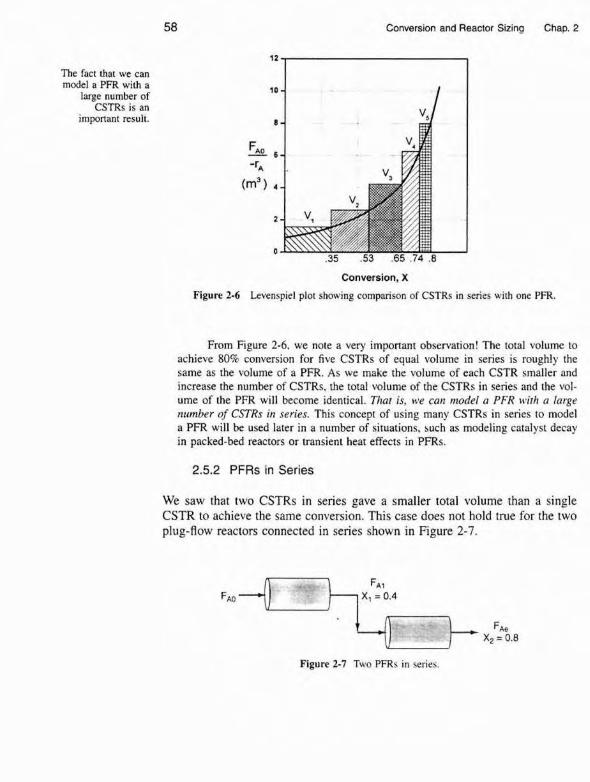
Figure 2-6 Levenspiel pla showing cornpanson of CSTRs in series with one PFR.
From Figure 2-6. we note a very important observation! The total volume to achieve 80% conversion for five CSTRs of equal volume in series is roughly the same as the volume of a PFR. As we make the volume of each CSTR smaller and increase the number of CSTRs, the total vofume of the CSTRs in series and the vol. ume of the PFR will become identical. That is, we can mdri a PFR urirln o large number of CSTRs in series. This concept of using many CSTRs in series to model a PFR will be used later in a number of situations, such as modeling catalyst decay in packed-bed reactors or transient heat effects in PFRs.
2.5.2 PFRs in Series
We saw that two CSTRs in series gave a smaller total volume than a single CSTR to achieve the same conversion. This case does not hold true for the two plug-flow reactors connected in series shown in Figure 2-7.
Figuw 2-7 Two PFRf in series,
Sec. 2.5 Rsactors In Series
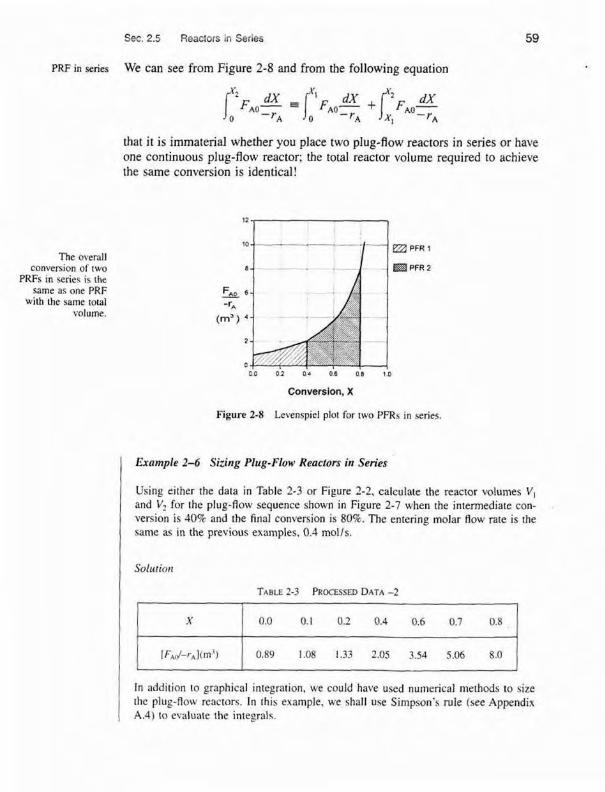
PRF in series We can see from Figure 2-8 and from the following equation
The overall conversion of twa
PRFs in series rs the same as one PRF
with the same total volume.
that it is immaterial whether you place two plug-flow reactors in series or have one continuous plug-flow reactor; the total reactor volume required to achieve the same conversion is identical!
Converslon. X
Figure 2.8 Levenspiel plot for two PFRs in series.
I Exarnple 2-6 Sizing Plug-Flow Reacfors in Series
Using either the data in Table 2-3 or Figure 2-2, calculate the reactor voIumes V, and V2 for the plug-flow sequence shown in Figure 2-7 when the intermediate con- \?ersion is 40% and the final conversion is 80%. The entering molar flow rate is the same as in the previous examples, 0.4 molts.
In addition to graphical integration, we could have used numerical methods to size the plug-flow reactors. In [his example, we shall uqe Stmpson's rule (see Appendix A.4) to evalnate the integral%.
60 Conversion and Reactor Sizing Chaa.
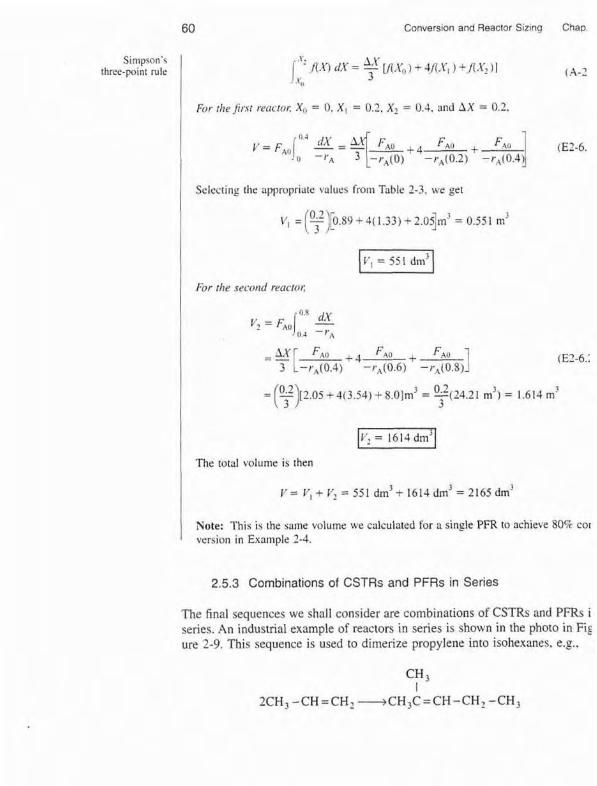
Simpson's three-pvint rule
For thefi,:rt recrctur: X,, = 0. X, = 0.2, X 2 = 0.4, and AX = 0.2.
Selecting the appropriate vatue5 from Table 2-3. we get
For the second renctnr;
p i c q The rotill volume i s then
Note: This is the same volume we calculated for a single Pl% to achieve 8809 ror version in Example 2-4.
2.5.3 Combinations of CSTRs and PFRs in Series
The final sequences we shall consider are combinations of CSTRs and PFRs i series. An industrial example of reactors in series is shown in the photo in Fig ure 2-9. This sequence is used to dimerize propylene into isohexanes. e.g..
Sec. 2 5 Reactors in Serie? 61
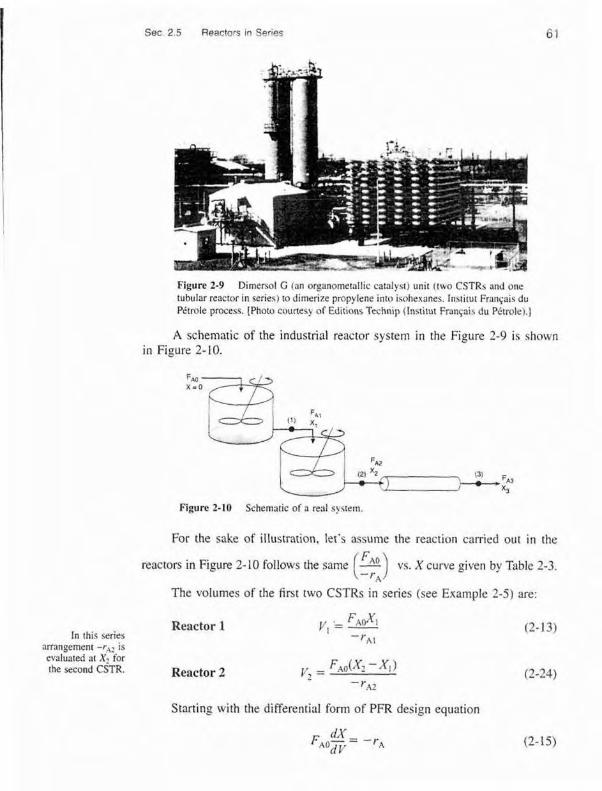
Figure 2-9 Dimtrsol C; (an orgdnometall~c catnly~t) unlt ~ t * o CSTRs and one tubular reactor in serler) to d~merize pmpylene ~ n t o isohesanes. In%tltut Fmnqaic du Pitrole process. [Photo courtesy of Ed~t~nns Technip (Insntut Fran~ais du Pitrole) ]
A schematic of the industrial reactor system in the Figure 2-9 is shown in Figure 2-10,
Figure 2-10 Schematic of a real system.
For the sake of illustration, let's assume the reaction carried out in the
reactors in Figure 2- 10 fo~lows the same vs. X curve given by Table 2-3.
The voIumes of the first two CSTRs i n series (see Example 2-51 are:
Reactor 1 In this series
arranpement -r,, is - r,\ l
eva1;ated at xZ'?or the second CSTR. Reactor 2 v, = f'~o(X2 - XI 1 (2-24)
Staning with the differential form of PFR design equation
62 Conversion end Reactor Sizing Chap. 2
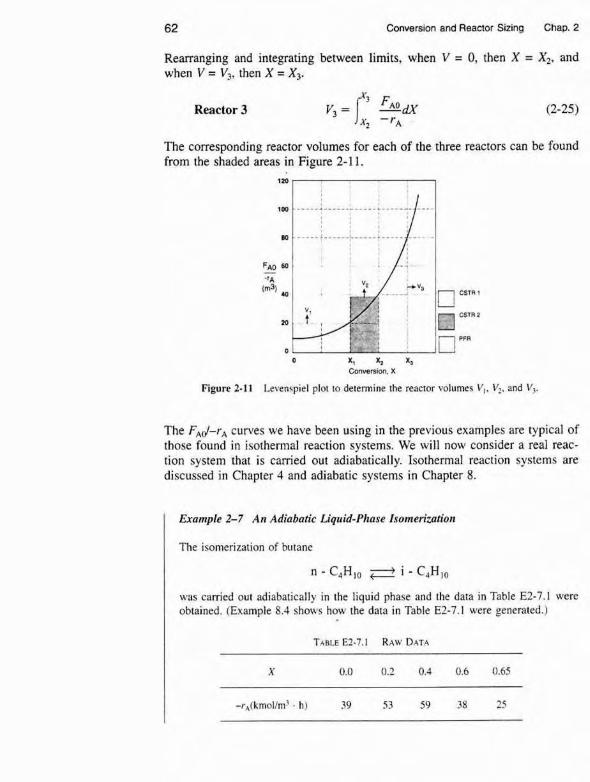
Rearranging and integrating between limits, when V = 0, then X = X2, and when V = V3. then X = X,.
Reactor 3
The corresponding reactor volumes for each of the three reactors can he found from the shaded areas in Figure 2-1 1,
CSTR l
Csm 2
PFR
0 X, X I xu Conversion. X
Figure 2-11 Leven~piel plot to determine the reactor volumes V,. V:, and V,.
The FAd-rA curves we have been using in the previous examples are typical of those found in isothermal reaction systems. We wilt now consider a real reac- tion system that is camed out adiabatically. Isofherma1 reaction systems are discussed in Chapter 4 and adiabatic systems in Chapter 8.
Exomple 2-7 An Adiabatic tiquid-Phase lsomeniation
The isomerization of butane
was carried out adiabatically in the liquid phase and the data in Table E2-7.1 were obtained. (Example 8.4 shows how the data in Table E2-7.1 were generated.)
See. 2.5 Reactors in Series 63
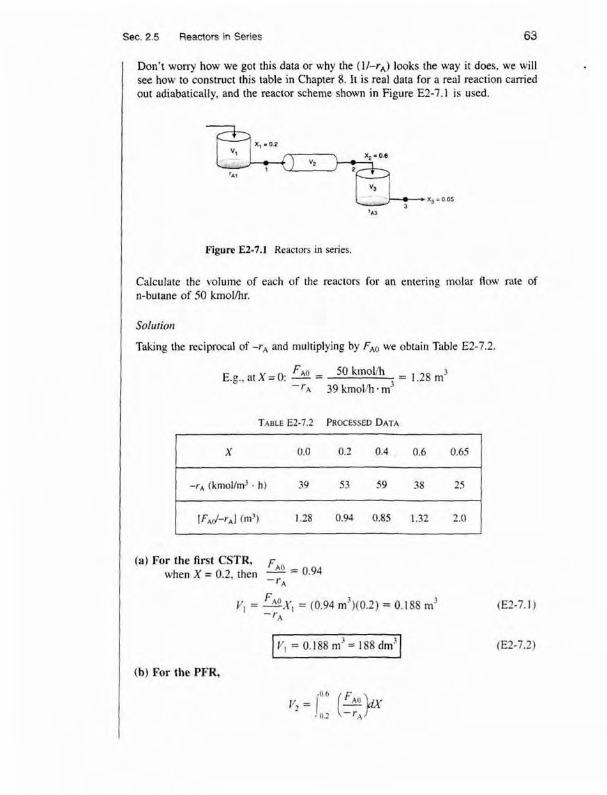
Don's worry how we got this data or why the (11-rA) looks the way i t does, we will see how to construct this table in Chapter 8. It is real data for a real reaction carried out adiabaticaliy, and the reactor scheme shown in Figure E2-7.1 IS used.
Figure E27.I Reac~ors in series.
Calculate the ~olurne of each of the reactors for an entering molar flow rrtre of n-butane of 50 kmollhr.
Soluriori
Taking the reciprocal of -r, and multiplying by FAo we obtain Table E2-7.2.
(a) For the first CSTR, F ~ o - 0.94 when X = 0.2, then - - - I-*
I I
(b) For the PFR,
64 Conversion and Reactor Sizing Chap.
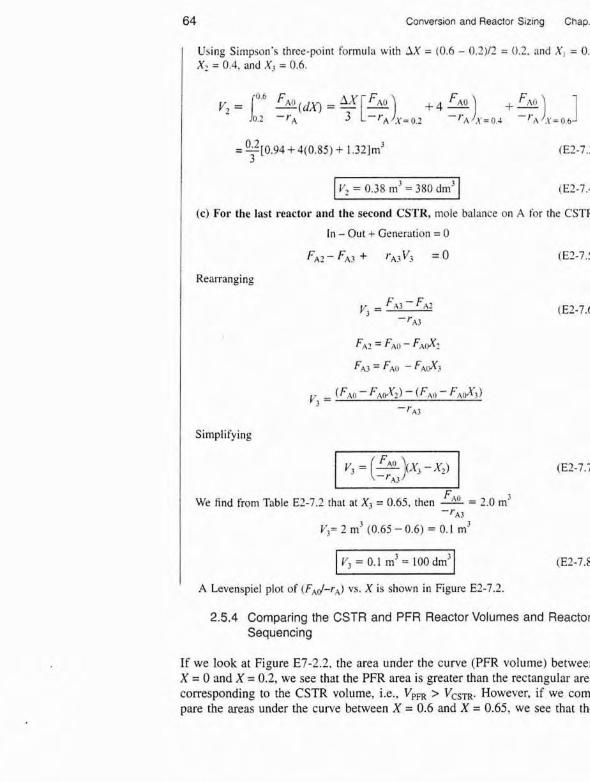
Using Simp.;onVs three-pclint formula with IX = 10.6 - 0.7)/2 = 0 .2 . and X , = 0. X: = 0.4, and X3 = 0.6.
I V2 = 0.38 m'= 380drn31 (El-7..
(c) For the Iast reactor and the second CSTR, moIe balance on A for the CSTF
In - Out + Generation = 0
F*z-F*3+ ~*3V3 = Q
Rearranging
1 Simplifying
We find from Tnble E?-7.2 that at X3 = 0.65, then = 2.0 tn' - r ~ ~
V3= 2 rn3 (0.65 - 0.6) = 0.1 m'
A Levenspiel plot of (FAd-rA) vs. X i s shown in Figure E2-7.2
2.5.4 Comparing the CSTR and PFR Reactor VoIurnes and Reactor Sequencing
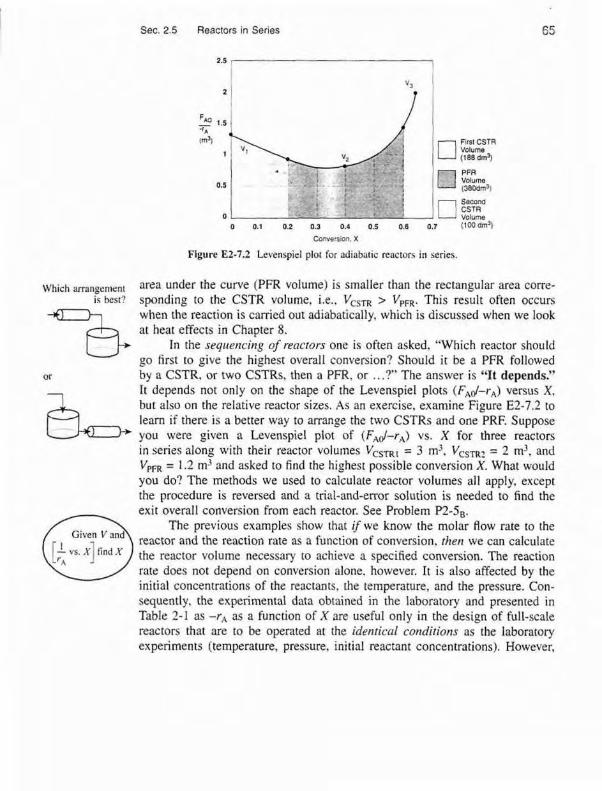
If we look at Figure E7-2.2, the area under the curve (PFR volume) betwee X = 0 and X = 0.2, we see that the PFR area is greater than the recranguIar are corresponding to the CSTR volume, i.e., V,, > Vcm. However, if we corn pare the: areas under the curve between X = 0.6 and X = 0.65, we see that th
Sec. 2.5 Reactors in Series 65
0.5
0 o 0.1 o 2 0.3 0.4 0 5 o 6 0.7 1100 dm3)
Cwe'slon X
Figure Et-7.2 Levenspiel plot for ndiabatic reactors in series.
llrhich arrangement area under the curve (PFR volume) is smaller than the rectangular area corre- is bestq sponding fo the CSTR volume, i.e., Vcsm 4 VPFR. This result often occurs
3 when the reaction is carried out adiabatically, which is discussed when we Iook at heat effects in Chapter 8.
In the sequencing of renctors one is often asked. "Which reactor should go first to give the highest overalI conversion? Should it be a PFR folIowed
or by a CSTR, w two CSTRs, then a PFR, or ...?*' The answer is "It depends." It depends not only on the shape of the Levenspiel plots (FA',d-rA) versus X ,
L but also on the relative reactor sizes. As an exercise, examine Figure E2-7.2 to learn if there is a better way to mange the two CSTRs and one PRF. Suppose you were given a Levenspiel plot of (FA&-r,) vs. X for three reactors in series dong with their reactor volumes VCSTRl = 3 m3, VCSTRI = 2 m3* and VPFR = I .2 r d and asked to find the highesr possible conversion X. What would you do? The methods we used to calculate reactor volumes all apply, except the procedure is reversed and a trial-and-ermr solution is needed ro find the exit overall conversion from each reactor. See Problem P2-5,.
The previous examples show that if we know the molar flow rate to the reactor and the reaction rate as a function of conversion. then we can calculate the reactor volume necessary to achieve a specified conversion. The reaction rate does not depend on conversion alone, however. It is also affected by the initial concentrations of the reactants, [he temperamre, and rhe pressure. Con- sequently, the experimental data obtained in the laboratory and presented in Table 2-1 as -r, as a function of X are useful only in the design of full-scale reactors that are ro be operated at the identical conditions as the laboratory experiments (temperature, pressure, initial reactant concentrations), However,
66 Conversion and Reactor Sizfng Chap. 2
such circumstances are seldom encountered and we must revert to the methods we describe in Chapter 3 to obtain -rA as a function of X.
It is important to understand that if the rate of reaction is available or can be obtained solely as a function of conversion, -r, = flX), or if it
reactors can be generated by some intermediate calculations, one can design a variety of reactors Or 8 combination of reactors.
Ordinarily, laboratory data are used to formulate a rate law, and then the Chapter 3 shows
how to find reaction rate~onversion functional dependence is determined using the rate -r, =RW. law. The preceding seaions show that with the reaction rate-conversion rela-
tionship, different reactor schemes can readily he sized. In Chapter 3, we show how we obtain this relationship between reaction rate and conversion from rate law and reaction stoichiometry.
2.6 Some Further Definitions
Before proceeding to Chapter 3, some terms and equations commonly used in reaction engineering need to be defined. We also consider the special case of the plug-flow design equation when the volumetric flow rate is constant.
2.6.1 Space Time
The space time, z. is obtained by dividing reactor volume by the volumetric flow rate entering the reactor:
7 is an imponant quantity!
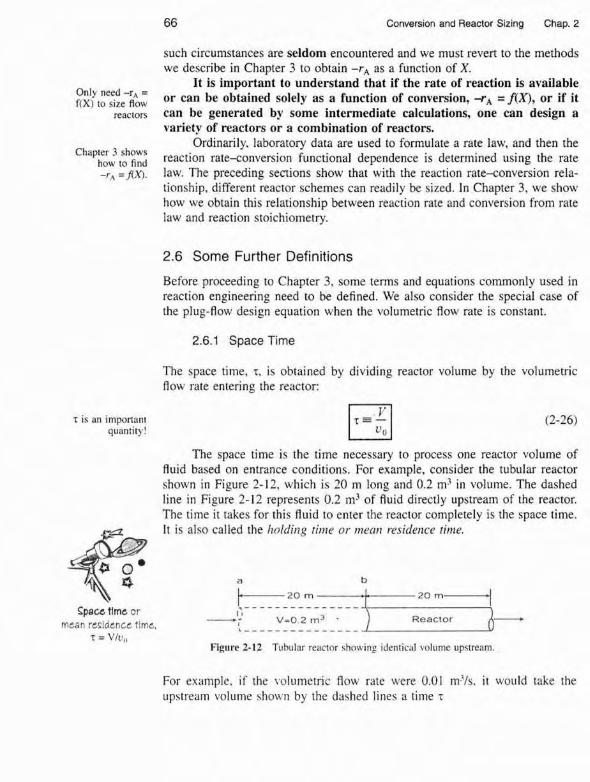
The space time is the time necessary to process one reactor volume of fluid based on entrance conditions. For example, consider the tubular reactor shown in Figure 2-1 2, which is 20 m long and 0.2 m V n volume. The dashed line in Figure 2-12 represents 0.2 m b f fluid directly upstream of the reactor. The time it takes for this fluid to enter the reactor completely is the space time. 1t i s also called the holding rinw or llzeiil~ tvsidence rime.
-
3 b
1-20rn+20rn-j
Spa- Time or - - - - - - - - - - - - - - - - J I I
-< V-0 2 m3 - Reactor mean residence time,
I - - - - - - - - - - - - - - -
t = VFu,, Figure 2-12 Tubular reactor chnwing den tical volumc upstream.
For example. if rhe iolumetric flow rate were 0.03 m3/s. it would take the upstream volume rhoun by the dashed lines a time r
Sec. 2.6 S m e Further Definitions 67
to enter the reactor. In other words, it would take 20 s for the fluid at point a to move to point b, which corresponds to a space time of 20 s.
In the absence of dispersion, which is discussed in Chapter 14, the space time is equal to the mean residence time in the reactor, t,. This time is the average time the molecules spend in the reactor. A range of typical processing times in terms of the space time (residence time) for industrial reactors is shown in Table 2-4.
Mean Re.ridcnce Rtacrur Tvpc Time Range P d u c r i o n Copacitr.
Batch 15 min to 20 h Few kglday to 100,000 tondyes
CSTR 10 min to 4 h 10 to 3,000.000 tondyear
Tubular 0.5 s to I h $0 to 5,000,000 tonslyear
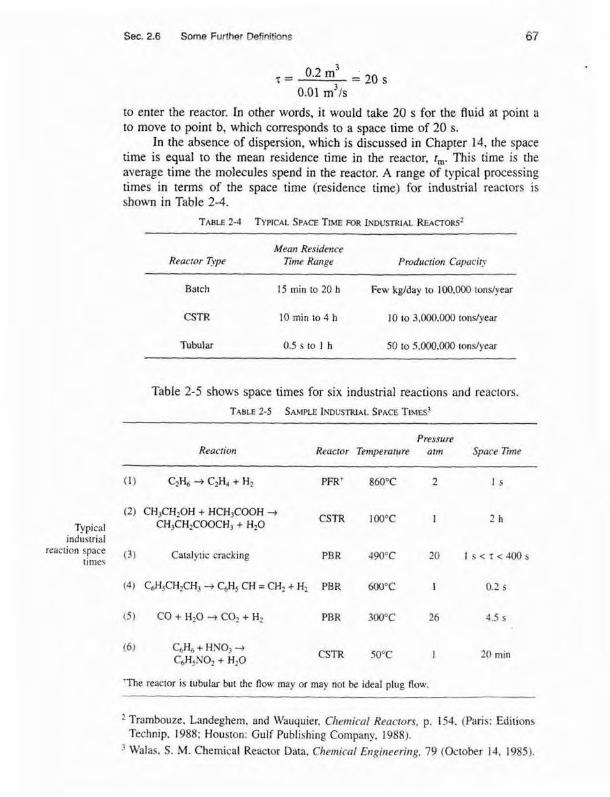
Table 2-5 shows space times for six industrial reactions and reacrors.
Pres~um Reaction Reacfor Temperoruw arm Space Time
11) C T H ~ + C ~ % + H ~ PFRt 860°C 2 I s
(2) CH3CH10H + HCHICOOH -+ CH,ICH~COOCH~ + H1O CSTR 100DC 1 2 h
'hpical indus1rial
reactron space (3) Catalytic cracking time$
PBR 490°C 20 1 s c ~ < 4 0 0 s
(51 CO+HzO+CQ2+HZ PBR 300°C 26 4.5 s
CSTR 50°C I 20 min
reactor i s tubular but the Row may or may not be ideal plug Row.
' Trambouze, Landeghem, and Wauquier, ChcrnicoI Reac~nrs, p. 154, (Pans: Editions Technip, 1988: Houston: Gulf Publishing Company, 1988). ' %'alas, S . M. Chemical Reactor Data, Chemicnl E~lgirleerin~. 79 (October 14, 19851.
Conversion and Reactar Sizing Chap.
2.8.2 Space Velocity
The space velocity (SV). which is defined as
might be regarded at first sight as the reciprocal of the space time. Howeve there can be a difference in the two quantirles' definitions, For the space tim the entering volumetric flow rate is measured at the entrance conditions, bl for the space velocity, other conditions are often used. The two space velocitit commonly used in industry are the liquid-hourly and gas-hourly space veloc ties, LHSV and GHSV, respectively. The entering volumetric flow rate, u,, i the LHSV is frequently measured as that of a liquid feed rate at 60°F or 75". even though the feed to the reactor may be a vapor at some higher temperatun Strange but true. The gas volumetric flow rate. un, in the GHSV is normnll measured at standard temperature and pressure (STP).
[ Erample 2-8 Reactor Space Times arrdSpace Velocities
Calculate the space time, T. and space velccities for each of the reactors in Exan ples 2-2 and 2-3
From Example 2-1, rve recar1 the entering votumetric Row rate was given r 2 dm% /s10.002 m'ls), and we calculnted the concentration and rnolar flow rates fc the conditions given to k CAn = 0.2 mol/dm3 and F,, = 0.4 moVs.
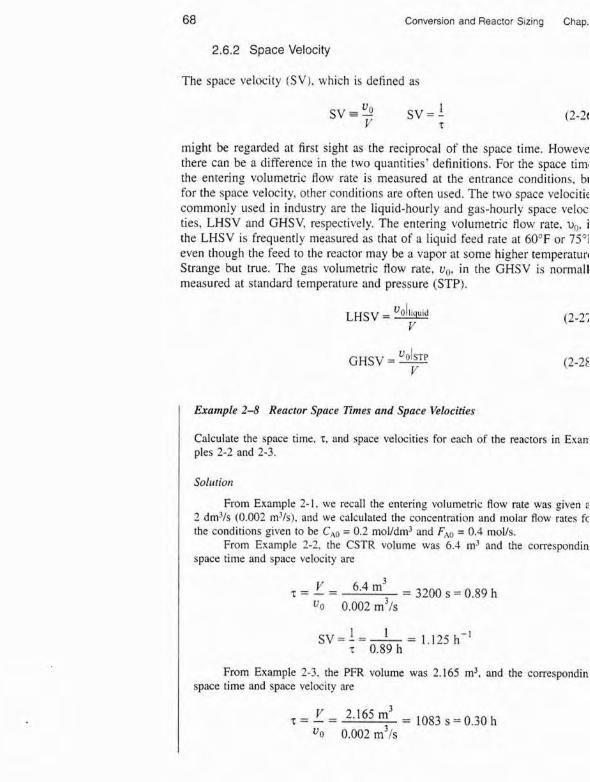
From Example 2-2, the CSTR volume was 6.4 m%nd the correspondin space time and space velocity are
From Example 2-3, the PFR volume was 2.165 m3, and the correspondin space time and space velocity are
Chap. 2 Summary 69
These space times are the times For each uf the reactors to take one reactor volumc of fluid and put it into the reactor.
To summarize these last examples, wc have seen that in the design of reactors that are to be operated at conditions (e.g., temperature and initial con- centration) identical to those at which the reaction rate data were obtained, we can size (determine the reactor volume) both CSTRs and PFRs alone or in var- ious combinations. In principle, it may he possible to scale up a labora- tory-bench or piIot-plant reaction system solely from knowledge of -r, as a function of X or C,. However. for most reactor systems in industry, a scale-up process cannot be achieved in this manner because knowledge of -r, solely as a function of X is seldom. if ever. available under identical conditions. In Chapter 3, we shall see how we can obtain -r, = AX) from information obtained either in the laboratory or from the literature. This relationship will be developed in a two-step process, In Step 1 , we will find the rate law that gives the mte rts a function of concentration and in Step 2. we will find the concen- trations as a function of conversion. Combining Steps I and 2 in Chapter 3, we obtain -r, =AX). We can then use the methods developed in this chapter along with integral and numerical methods to size reactors.
The CRE Algonthrn -Mole Balance. Ch 1 .Rate Law. Ch 3 C~OSUR Stoichiomeuy. Ch 3
*Combine, Ch 4 In this chapter, we have shown that rr you are given the rate of reaction *Evaluate, Ch 4 as a function of conversion. i.e., -r, =AX>, you will be able to size CSTRs -Energy Balance. Ch 8 and PFRs and arrange the order of a given set of reactors to determine the
3esr overa ible to
a.
11 conversion. After completil
define the parameter comers1 terms of conversion show that by expressing -TA i
ber of reactors and reaction s calculated fmm a given react arrange re a given tl
!actors in series to a evenspiel plot
ng this cb,
ion and re
is a functi ystems ca or size
apter, the
write the
on of con. m be size{
reader shl
mole bala
version X 3 or a con
nces in
m conversion for
For batch systems:
For flow syterns: Fi.0 - F A ,Y= - FA,
a num- version
S U M M A R Y
1. The conversion X is the moles of A reacted per mole of A fed.
70 Conversion and Reactor Sizing Chap. 2
For reactors in series with no side streams, the conversion at point i is
X, = Total moles of A reacted up to point i (S2-3) ' Moles A fed to the first reactor
2. In terms of the conversion, the differential and integral. forms of the reactor design equations become:
- -
Diffewnrial Form Algcbmic Form hllgral Form
dX - Batch NAo- - - rAY dl
CSTR
PBR FAO- dX = -rr dW A
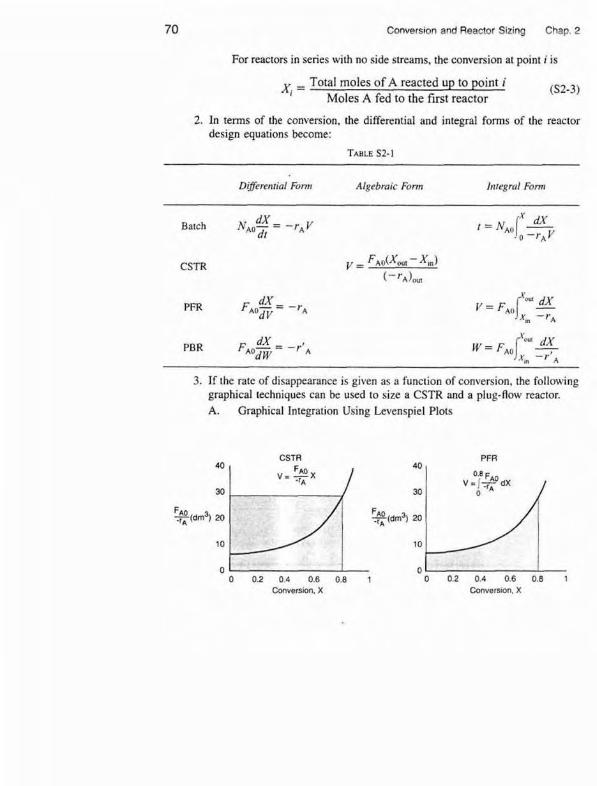
3. If the rate of disappearance is given as a function of conversion, the following graphical techniques can be used to size a CSTR and a plug-flow reactor.
A. Graphical Integration Using Levenspiel Plots
CSTR
Conversion, X
Chap. 2 CD-ROM Materials 71
The PFR integral could also be evaluated by
B. Numerical Integration See Appendix A.4 for quamtuE formulas such as the five-point quadrature formula with AX = 0.8/4 of five equally spaced points, X, = 0, X2 = 0.2, X, = 0.4, X4 = 0.6, and X5 = 0.8.
4. Space time. T, and space velocity, SV, are given by
sv = 3 (at STP) v
C D - R O M M A T E R I A L S
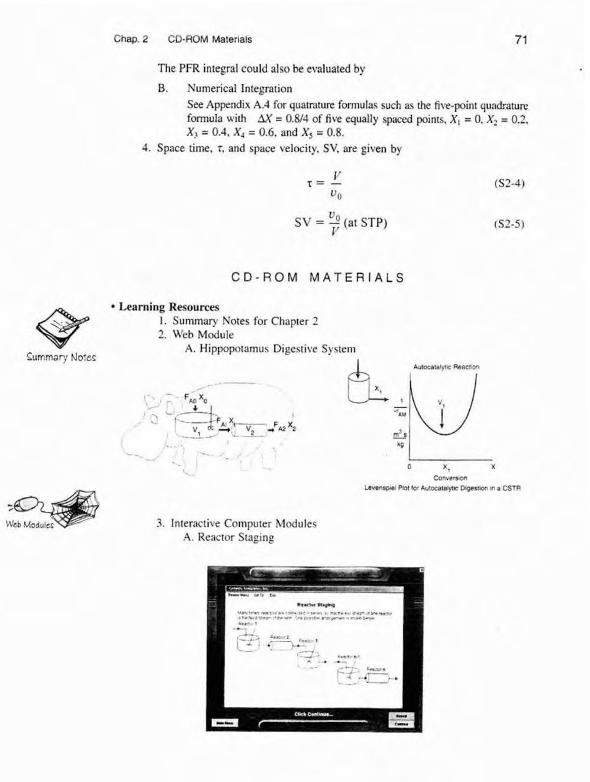
Learning Resources I . Summary Notes for Chapter 2 2. Web Module
A. Hippopotamu~ Dige5tiue System Surnma~y Motes
Lavenrporal PIM b r eiulo~alayc D~gesr~m m a CSTR
3. Interactive Computer Modules A. Reactor staging
Conversion and Reactor Sizing Chap.
4. Solved Problem? A. CDP2-As More CSTR and PFR Calculations-No Memorization
= FAQ [Frequently Asked Questions]
Professional Reference Shelf R2.1 ~Wodified Levenspiel Plots
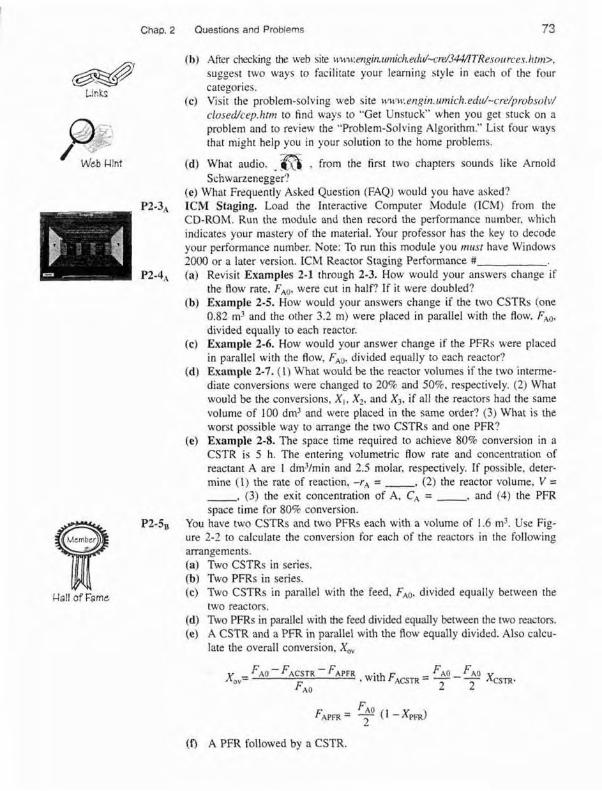
Solved Prohlfirns For hquids and constant volume batch reactors, the mole balance equatior can be modified to
A plot of (l/-r,) versus CA gives Figure CD2-1
Reference Chelf
LA!
Flgure CD2-1 Determining the space time, 7.
One can use this plot m study CSTRs. PFRs. and batch reactors. This materia using space time as a variable is given on the CD-ROM.
Q U E S T I O N S A N D P R O B L E M S
The subscript to each of the problem numbers indicates the Ievel of difficulty: A, leas1 difficult; D. most difficult.
P2-IA Without referring back, make a list of the most important items you leamec in this chapter. Nlat do you believe was the overall purpose of the chapter?
P2-2, Go to the web site www.engcncsu.edu/Iearnin~s~Iedil~~eb. html - ClomeworR ~r3hlems (a) Take the Inventory of Learning Style test, and record your learning style
Before solving the accordine to the SolomonFelder inventow. problems, state or
sketch qualitativefy the expected results
or trends.
Chap. 2 Questions and Problems 73
(h) Atter checking the web 51te 1c~~~~!~ng in .un~ iche~IrJ -c re /3~TRe . r0~1 rces. htm>. suggest two ways to facilitate your learning style in each of the four
Links categories. (c) Visit the problem+solving web site ww~t:en~in.s~nich.eriu/-rre/probroit'/
closed/cep.htm to find way? to "Get Unstuck" when you get stuck on a 0,~: problem and to review the "Problem-Solving Algorithm." List four ways
/ that might help you in your solution to the home problems.
hkb Mint (d) What audio, *fiL . from the first two chapters sounds like Arnold Schwarzenegger '
(e) What Frequently Asked Question (EAQ) would you have asked7 P2-3, ICM Staging. Load she Interactive Computer Module (ICM) from the
CD-ROM. Run the module and then record the performance number, which indicates your mastery of the material. Your professor has the key to decode vour performance number. Nore: TO mn this module you must have Windows i0a0 or a later version. ICM Reactor Staging Performance #
P2-4, (a) Revisit Examples 2-1 through 2-3. How would your answers change if the flow rate, FAo, were cut in half? If i t were doubled?
(b) Example 2-5, How would your answers change if the two CSTRs (one 0.82 m3 and the other 3.2 rn) were placed in parallel with the flow, FA*, divided equally to each reactor.
(c) Example 2-6. How would your answer change if the PFRs were placed in parallel with the flow, FA*, divided equally 10 each reactor?
{d) Example 2-7. (11 What wouid be the reactor volumes if the two interme- dlate conversions were changed to 208 and 50%. r'espe~fively, (2) What would be the conversions, XI, X?, and X3. if a11 the reactors had the same volume of 100 dm3 and were placed in the same order? (3) What i s the worst possible way to m n g e the two CSTRs and one PFR?
(e) Example 2-8. The space time required to achieve 806 conversion in a CSTR i s 5 h. The entering volumetric flow rate and concentration of reactant A are 1 ddlmin and 2.5 molar, respectiveiy. IF possible. deter- mine (1) the n t e of reaction, -r, = , (2) the reactor volume, V = , (3) the exit concentratron of A. C, = , and (4) the PFR space time for 80% conversion.
P2-iTD You have two CSTRs and two PFRs each with a volume of 1.6 m3. Use Fig- ure 2-2 to cnlcuhte the conversion b r each of the reactors in the following arrangements. (a) Two CSTRs in series. (bj Two PFRs in series.
Hal o f Fame (c) Two CSTRs in parallel with the feed, FAIl, divided equally between the two reactors.
(d) Two PFRs in parallel with h e feed divided equally between the two reactors. (e) A CSTR and a PFR in p d I e I with the Row equally divided. Also calcu-
late the overall conversion, Xm
FRO FA,= - ( 1 - X m ) 2
(4 A PFR followed by a CSTR.
Conversion and Reactor Sizing Chap. 2
(g) A CSTR followed by a PFR. Ih) A PFR followed by two CSTRs. Is this arrangement a good one or i s there a better one?
P2-6, Read the chemical reaction engineer of hippopotamus on the CD-ROM or on the web. [a) Write five sentences summarizing what you learned from the web
module. (b) Work problems ( I ) and (2) on the hippo module. (c) The hippo has picked up a river fungus and now the effective volume of
the CSTR ctornach compartment is onl? 0.2 &. The hippo needs 30% conversion to sunlive? Will the hippo survi\~e.
(d) The hippo had to have surgery to remove a blockage. Unfonunately, the surgeon. Dr. No, accidentally reversed the CSTR and the PER during the operation. Oops!! What will be the conversron with the new digestive arrangement? Can the hippo survive?
P2-7R The exothermic reaction
was carried out adiabatically and the following data recorded:
The entering molar Row rate of A was 300 mollmin. (a) What are the PFR and CSTR volumes necessary to achieve 40% conves-
sion? (VPFR = 72 dm.'. V,,,, = 24 dm') (b) Over what range of conversions would the CSTR and PFR reactor vol-
umes be identical? (c) What i\ the maximum conversion that can be achieved in a 10.5-dm.'
CSTR7 Ed) What conr*ersion can be achieved if a 72-dmVPF is followed in series
by a 24-dm3 CSTR? (e) What conversion can be achieved if a 24-dm" CSTR i q followed in a
series by a 77-dm' PFR? (fl PIor the cnnversion and rate of reaction as a function of PFR reactor vol-
ume up lo a volume of 100 dm.'. P2-8, In bioreactors. rhe growth is autocatalytic in that the more cells you have, the
greater the gro\vth rate
Cells + n u t r i ~ n ~ r cells, more cells + product
The cell prnuth rate, s,. and the rate of nutrient consumption, r:,, are direcrly pmponional to the concenrration of cells for a given 5et of condirions. A
Chap. 2 Questions and Problems 75
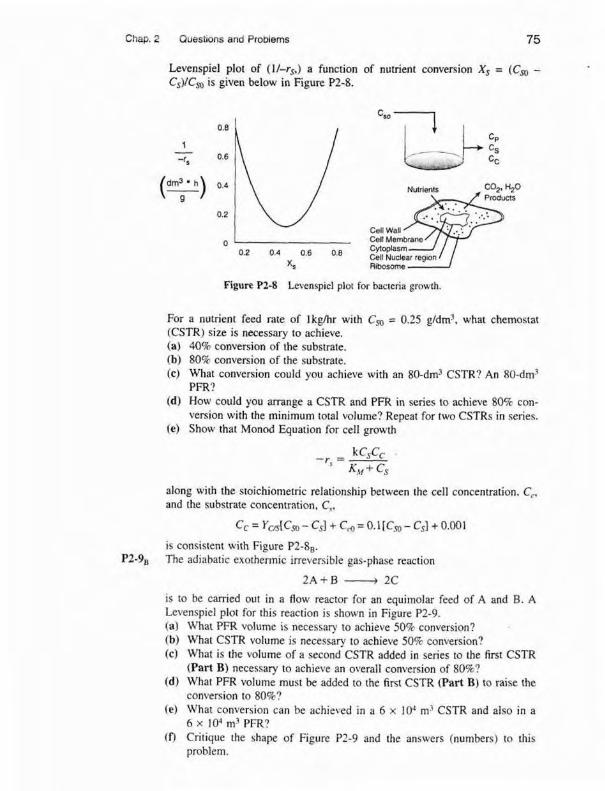
Levenspiel plot of (11-r,,) a function of nutrient convenion X, = (Cm - C3)/Cm is given below in figure P2-8.
Figure P2-8 Levenspiel plot for bacteria growth.
For a nutrient Feed rate of lkghr with Cm = 0.25 g/drn3. what chernostat (CSTR) size is necessary to achieve. (a) 40% conversion of the substrate. (h) 80% corlversion of the substrate. (c) What conversion could you achieve with an SO-dm"STR? An 80-dm3
PFR? i d ) How could you arrange a CSTR and PFR in series to achieve 80% con-
version with the minimum total volume? Repeat for two CSTRs in series. (e) Show that Monod Equation for celI growth
along with 'the stoichiometric relationship between the cell concentrarion. C, and the substrate cancentntio~, C,,
is consistent with Figure P2-8,. P2-9, The adiabatic exothermic irreversible gas-phase reaction
2 A + B + 2C
i s to he carried out in a flow reactor for an equimuiar feed of A and B. A Levenspiel plot for this reaction i s shown in Figure P2-9. (a) What PFR v~ lume is necessary ro achieve 508 conversion? (b) What CSTR volume is necessary to achieve 50% canversion? (c) What is the volume of a second CSTR added in series to the first CSTR
(hrt B) necessary to achieve an overall conversion of 80%? Id) What PFR volume must be added to the first CSTR (Part B) to raise the
conversion to 80%? (el What conversion can be ach~eved in a 6 x lo4 rn3 CSTR and also in a
h x 10" m3 PFR? (fl Critique the shape of Figure P2-9 and the answers [numbers) to this
problem.
Convmrs~on and Reactor Sizing Chap :
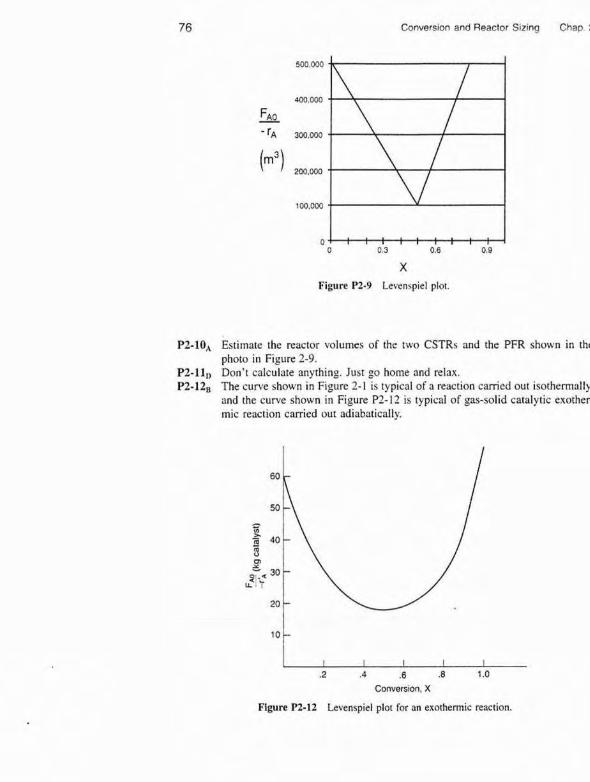
Figure P2-9 Levenspiel plot.
P.2-10, Estimate the reactor volumes of the two CSTRs and the PFR shown in t h ~ photo in Figure 2-9.
P2-lID Don'[ calculate anything. Just go home and relax. P2-12, The curve shown in Figure 2- 1 is typical of a reaction carried out isothermallq
and the curve shown in Figure P2-12 is typical of gas-solid catalytic exother mic reaction carried out adiabatically.
.2 .4 .5 .8 1.0
Conversion, X
Figure PZ-12 Levenspiel plot for an exothermic reaction.