Embed Size (px)
Citation preview

May 2018
Research InstituteThought leadership from Credit Suisse Research
and the world’s foremost experts
Research InstituteThought leadership from Credit Suisse Research
and the world’s foremost experts
The Future of GDP

Editorial
Across the globe, a continuous increase in Gross Domestic Product (GDP) ranks on top of political and regulatory agendas. GDP’s power as an indica-tor of economic health and performance is based on
of the respective society. Accordingly, central banks set monetary policies based on the gap between actual and potential GDP, and governments validate their decision-making in line with GDP growth. It has been argued for some time, however, that decision-
which tends to be imprecise in considering assets and often fails to account for liabilities.
This report, commissioned by the Credit
concerns around measuring progress based on -
eration for long-term effects of economic growth. Indeed, GDP metrics provide no indication of societies damaging their capital, such as by with-holding education from certain groups, or by depleting natural resources for immediate
methods behind GDP have been questioned since
household activities. Simultaneously, modern economies are increasingly driven by technologi-cal innovation, which can have a disruptive impact on statistics. For instance, digital intermediation or user- and peer-driven substitution of marketed
data, such as price indices.
consensus on an internationally acceptable alter-native to GDP, although encouraging progress is being made toward a more holistic way of think-ing about economic activity. In fact, decision- makers in both private and public sectors now have tools to make highly sophisticated and sustainable choices. On the investor side, the demand for environmental, social and gover-nance data is rising steeply. On the public side, organizations such as the World Bank already consider metrics other than GDP to
birth or access to education.As several authors in this report point out, we
should focus on a number of issues going forward. First, the weaknesses of GDP metrics continue to
stakeholders need to closely follow those debates and take corresponding measures. Second, public and private decision-makers have a multitude of instruments at hand which need to be
superior assessment of actions and their impact on societies and the environment. Ultimately, in business, we learn not to let the great become the enemy of the good. We have not solved all the challenges, but we have come a long way in reducing many of the distortions of current metrics.
We hope this report furthers the currently ongoing discussions around GDP and wish you an insightful read.
Urs Rohner Chairman of the Board of Directors Credit Suisse Group AG

Cov
er p
hoto
: shu
tters
tock
, Ser
gey
Nive
ns
The Future of GDP 3
For more information, contact: Richard Kersley, Head of Global Thematic Research, Credit Suisse Investment Banking,[email protected], or
International Wealth Management, Credit Suisse,michael.o’[email protected], paulaphoto
02 Editorial
04 Introduction to GDP
International Wealth Management at Credit Suisse
17
31 Alternatives to GDPCSRI Academy Members
46 How GDP fails the environment and how
Pooran Desai, co-founder of Bioregional Development GroupNicholas Schoon, senior researcher and writer at Bioregional Development Group
64 References
66 About the authors
67 Disclaimer
06 Measuring the modern economy with 1940s methodsProfessor Diane Coyle, University of Cambridge
Main challenges to GDPNicholas Oulton, member of the Centre for Macroeconomics at the London School of Economics
59 Switzerland: Outperforming GDP dataClaude Maurer, Head Swiss Macro Analysis & Strategy at Credit Suisse
Introduction to GDP
Gross Domestic Product (GDP) is under attack. This attack is two-pronged. Some feel that GDP is not an appropriate measure to capture the many policy issues facing societies. Others,
and low productivity, all of which are undermining the traditional business cycle. In developed
a different way of examining an economy. Further, the impact of technology, and especially disruptive technology on macroeconomic reporting, is not yet well understood.
The problem with GDP is that it is the measure through which the economics and policy commu-nity communicates with the outside world. Most international policy institutions continue to lead their lengthy and detailed policy outlooks with forecasts of GDP. Media institutions also play this game and give far greater emphasis to these GDP forecasts than more arcane analyses of topics like debt. In turn, analysts and economists are then asked to re-act to new GDP forecasts. To this end, GDP says as much about how the policy community interacts with the civilian world as it does about the analyti-cal models used by economists, and the relevance of their mathematical underpinnings. So, to some
not mean that there are not better or alternative approaches to measuring economic growth and well-being.
“It is fair to say that very few investors make investment decisions on the basis of GDP”
In this respect, one element in the GDP debate that deserves more attention is the way in
information. It is fair to say that very few investors make investment decisions on the basis of GDP. Indeed, there is no coincident relationship between stock market returns and GDP (see the Credit
economic data tells us something about the perceived
First, while there is an intuitive relationship between asset returns and the business cycle, higher frequency data (such as purchasing manager indices) rather than GDP tend to be used by inves-tors to pinpoint the direction of the economic cycle. GDP tends to be backward-looking, and in many ways tells us little about the output gap. Second,
higher frequency and more idiosyncratic data – from app download statistics to micro level hiring trends to oil rig counts, there is a growing number of data items that markets focus on. Some institutions, such as the Atlanta Federal Reserve, have embraced this spirit and produce “nowcast” GDP measures that
If the use of the traditional GDP measure is on the wane, its appropriateness is also called into question, and in this report we discuss the main criticisms of GDP as well as possible alternative measures. Here, rather than reiterating the arguments for this, we want to highlight some of the studies and proprietary databases that the Credit Suisse Research Institute (CSRI) has established, and that help to highlight other less traditional perspectives on the world in which we live and work.
One notable category here is wealth. Most people, when confronted by a major spending decision, tend
International Monetary Fund, but rather on their own wealth outlook. The CSRI’s Global Wealth Report, now in its eighth edition, measures the wealth of the world’s
of all, we can measure wealth inequality with some accuracy and, in the last edition of the Wealth Report, we highlighted how wealth inequality is at a historic high. Second, the analysis of the wealth pyramid and of wealth trends in the emerging world in particular helps to delineate the rise of the emerging consumer.
4 The Future of GDP

Another related perspective is the CSRI’s
of consumers throughout the emerging world. The survey is based on detailed interviews with
emerging economies. Its role is to provide a granu-lar account of one of the component parts of GDP, consumption, and to track the change in consump-tion patterns and material aspirations as the level of GDP rises across emerging nations.
“Another important economic cohort is women and, again, the contribution of women to economies is underestimated”
Three other CSRI reports are worth mention-ing in the light of the debate on GDP because they shed light on underestimated, and arguably under-researched aspects of the world economy. To
largest family businesses. Family businesses make up the lion’s share of many economies, though receive relatively little analytical attention. This is a pity given that they tend to be more long-term in their investment horizons, tend to invest more and take on less debt than non-family companies and, according to our database, outperform broad equity markets. Another important economic cohort is women and, again, the contribution of women to economies is underestimated. One reason for this is the lack of good quality gender-relevant data. The
--
nies, and in particular analyzing the positive contri-bution that greater female representation makes,
success of small countries. Our aim here was to determine the factors that drove small advanced economies like Ireland, Switzerland, Sweden and Singapore to have consistently high levels of GDP growth. Small open economies are of particular interest because to a large degree they act as the canaries in the coal mine of the world economy in that economic and policy trends tend to show up in them before they do in larger countries. In that respect, keeping an eye on GDP and econom-ic trends in small open economies can be more instructive than a global view.
Our sense is that other perspectives, and the
question of bringing these more forcefully into the
The Future of GDP 5
Shutterstock, Cisper

Measuring the modern economy with 1940s methodsThe past few years have seen great interest in how the economy is measured – not what the statistics say, but rather how they are constructed. This is surprising, perhaps: the technicalities of economic statistics only occasionally come under the spotlight, but the recent interest has been sustained. The reason seems to be a growing gap between what the aggregate statistics say about the economy and the actual experience of many of the people who scrutinize them. One prominent example of this wedge between published statistics and word on the street is the well-known “productivity puzzle.”
Professor Diane Coyle, University of Cambridge
The productivity puzzle
Productivity growth, measured either as output per worker hour or as total factor productivity accounting for capital input as well, has slowed substantially in the advanced economies since
if the earlier trend had continued. In Canada and the USA, the pace of growth has slowed, but not
-enced a slowdown over time.
Why is this a puzzle? After all, there are several contributing factors to weaker productivity,
demographic change, and a decreasing intensity of competition in key sectors. Another prominent argument, strongly made by Robert Gordon in his book “The Rise and Fall of American Growth,” is that the pace of meaningful technological inno-vation has slowed. He argues that current digital innovations are trivial, and bear no comparison with productivity-improving technologies of the past, including the early stages of computerization.
This argument about technology is debatable, however, and challenged by the tech industries.
has been accelerating progress in compression and
usage. A number of technologies such as electric and autonomous vehicles and associated innova-
to rapid growth in commercial applications in the near future. There have been pick-ups in automa-tion in some sectors of manufacturing and distri-bution. Applications of AI in the management of electricity grids and medical diagnostics are being tested, as are new applications of genetic medicine.
due to innovation is one reason the question about measurement techniques has come to prominence. There are others. The conventional approach makes a sharp distinction between businesses and govern-ment, which are deemed productive, and households, which are not. The growth of the “gig economy,” (characterized by an increasing prevalence of short-term contracts or freelance work as opposed to perma-nent jobs) is eroding that boundary. The failure of con-
critique, but one that has growing salience.
Constant price GDP per hour worked, G/ countries; 1997–2015
Canada France Germany Italy
Japan UK USA
6 The Future of GDP

The stakes are high because of the importance of the conventional statistics in determining policy. Central banks set monetary policy according to the gap between actual and potential Gross Domestic Product (GDP) – but what if both these sets of statis-tics are too uncertain to be meaningful? Governments justify politically contentious policies in terms of likely contribution to GDP growth. What if what we think we know about the economy is a chimera?
“Central banks set monetary policy according to the gap between actual and potential GDP – what if both are too uncertain to be meaningful?”
To understand the issues, and consider how the measurement of the economy needs to evolve, it is important to start with why we use the framework in place today, its strengths, and its long-understood shortcomings. This sets the stage for understanding why the shortcomings are increasingly profound and wide-ranging. Statistics are both a lens for observ-ing the economy – etymologically, the way the state sees the world – and an instrument shaping the economy as policymakers, businesses and individ-uals change their behavior in reaction to the picture they see through that lens. The lens has become so distorting that it is time to think about fundamental change to the statistical framework.
The origins of today’s economic statistics
All economic statistics are devised in a partic-
substantially between different epochs. There are also long lags between change in the structure of the economy and the response in the statistical
annual statistical abstract contained page after page of detailed agricultural statistics and just a handful on steam, mines, cotton, rail and coal, although these leading technological sectors dominated news and conversation, not to mention literature.
Today’s framework, the System of National Accounts and associated macroeconomic statis-tics such as unemployment and consumer price indices, has its origins in the Depression and World War II.2 The early research by economists such as Simon Kuznets in the USA and Colin Clark in the UK was a response to a political need to under-stand the scale of the economic catastrophe in the
majority of working men. After the start of the war, the imperative was the need to calculate the scale
diversion of enough resources for war production.
2. A fuller account is available in Diane Coyle, “GDP: A Brief But Affectionate History,” Princeton University Press, 2nd
The Future of GDP 7

The combination of this urgent need and Keynes’s new macroeconomic theory decisively shaped the construction of Gross National (and later Domestic) Product as the sum of consumer spend-ing, investment spending, government spending
generation of economics students since.
was built on the pre-war work, it differs philosoph-ically in an important way. Kuznets and Clark had
his US counterparts wanted to measure production
have deducted government spending on defense as a regrettable necessity not contributing to welfare. This was irrelevant to the wartime measurement need and would have been a public relations goal anyway. This wedge between welfare and output
critiques of conventional GDP.
-ized into the current framework and established as an international standard through the United Nations committee that still oversees statistical norms. The British economist Richard Stone, a pupil of Keynes and later a Nobel Prize winner, played a leading role. The advantage of a standard is the ability to compare (albeit with caution) different countries’ economies.
-
since the very start. The treatment of both govern-ment activity and household work were hotly debated in the early years, in discussions of the “production boundary,” or in other words the line between what is and is not counted in GDP. Simon Kuznets argued that, although some government spending such as education or health spending amounted to collective rather than individual consumption, much of it should be counted as intermediate spending and netted
business, like raw materials. As GDP counts added value, these costs should all be netted off the total to avoid double counting (a different aggregate, Gross Output, measures all activity including the production of intermediate goods). The distinction proved too
Keynes’s equation.There was also much debate about “household
production,” i.e. goods and services produced in the home. The decision was made to count production of goods such as food and clothing as people could choose whether to consume or produce these them-selves, or trade them in the market. Services such as
being that the market for these was minimal, and it
Feminists naturally objected, as women were the main providers of these services. At any rate, the market for such services is now far larger than the market for homemade food and clothes, although statisticians have little appetite for the data collec-tion that would be needed. This issue may become
however, as discussed below.
and real GDP, have been contested since the very start”
The environmental critique was another of the earliest. Although Keynes’s concern had been the level of national output and associated employment, the policy target soon became the growth of GDP. The Cold War involved an economic as well as a military arms race, as both the USA and USSR wanted to demonstrate the superior standard of living of their own citizens. Targets for growth were set in the founding charter of the Organisation for Economic Co-operation and Development, the successor to the body administering US Marshall Fund aid. Environmentalists were quick to point out the implications of continual economic growth set in terms of a target for a measure that omit-
greenhouse gas emissions, and took no account of depreciation of the stock of environmental assets, treating natural resources as free.
-sures economic activity in the current time period,
social costs. There are balance sheets in the System of National Accounts, but they are incom-plete – for instance, the contingent liabilities of governments are omitted. So too are the stocks of natural assets, with just a handful of countries starting to try to measure natural capital stocks. For that matter, GDP does not distinguish between a dollar of investment and a dollar of consumption, so it does not provide any guidance at all on the time trade-off between growth rates in different periods.
Such concerns have led to many proposed -
able Economic Welfare and the Genuine Prog-ress Indicator.4 However, their strength is also their weakness. In using market prices to value real output, GDP has the democratic strength
4. See “Measuring Progress? A Review of ‘Adjusted’ Measures of Economic Welfare in Europe,” by Tim Jackson and Nat McBride, CES Working Paper, University of
-
8 The Future of GDP
Pric
e pe
r uni
t of c
ompu
ting
their behavior. All the alternative indices make ad hoc assumptions about how to weight different
Devised by environmentalists, these put such a
resource use that they show there has been
improvements since then in ultimate indicators such as health, longevity, infant mortality, and quality of life for most people in the OECD econ-omies. So how to account for the environment in a rigorous way is a puzzle yet to be solved.
“How to account for the environ-ment in a rigorous way is a puzzle yet to be solved”
another basic shortcoming in GDP, however. That is its inability to measure the economic welfare or well-
people place on a new product or service is almost always far higher than the price they have to pay when it is commercialized and available in the market. GDP is calculated using the market price. To see this, con-sider the fact that Nathan Mayer Rothschild, thought to be the richest person in the world at the time, died in
had not been invented. What might he have paid for a
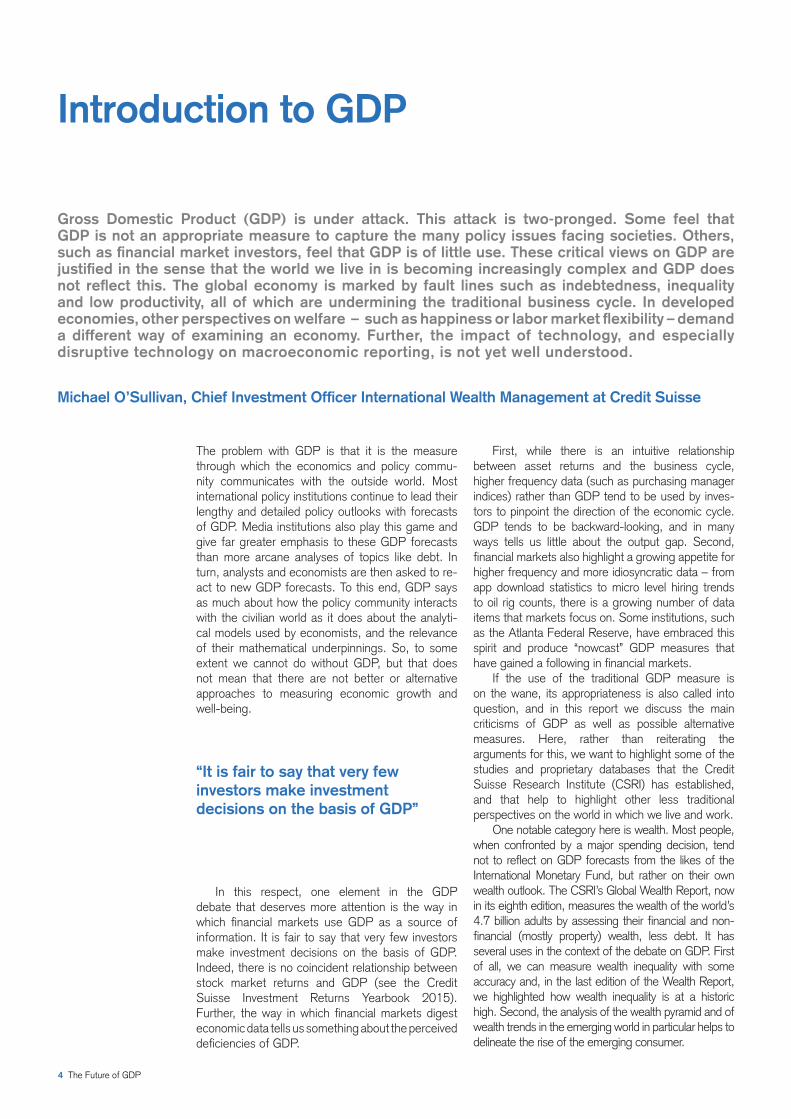
Figure 2
US GDP per capita & GPI per capita, USD 2000, 1950–2004
indices described above, subtracting environmen-tal costs, seem so odd. Economists have tried to
-
Nordhaus has constructed indices for lighting and for computation. These calculate the unit costs of physical output such as lumens or computations per second and, not surprisingly, their pace of decline is
for technology-driven quality changes in some key products such as televisions and computers, calculating prices in terms of underlying physical characteristics such as processing speed, screen resolution and so on. However, during periods of rapid technological change – and changes in a broader range of goods and services building on the technologies – there is bound to be a large innova-
question to be addressed at the moment, particularly in light of the productivity puzzle.
Digital disruption of statistics
Digital technologies are manifestations of a “General Purpose Technology,” computation power driven by Moore’s Law, and resulting in a cluster of informa-tion and communication technologies (ICTs). These
Growth in Computing,” The Journal of Economic History,
The Future of GDP 9
Manual
Thomas arithmometer
Abacus (novice)
EDSAC
IBM PC
Dell XPS

include the internet and web, wireless communi-cation networks, devices from supercomputers to smartphones, AI and robotics. Digital technology
information and communication technology thanks to cheap and large-scale computational power, such as genetics. General Purpose Technologies (such as
the whole economy. This can be a process with long and variable lags.
The economic historian Paul David showed that it
productivity effects of electricity to appear because so much complementary investment and organiza-tional or social change was needed.in measuring innovation means profound techno-logical changes also have surprisingly little effect on measured GDP. Nicholas Crafts has shown that the impact of steam on measured labor productivity
than a quarter of the estimated impact of ICTs on
-quences of the steam revolution.7
-
absence of any productivity impact was widely
-
economic growth: Lessons from economic history,” Revista -
commented on. Robert Solow famously remarked, “You can see the computer age everywhere but in the productivity statistics.”
-tion in productivity growth then has evaporated. Yet digital technology is far more pervasive now
many countries are able to be online constantly thanks to broadband and smartphones. Chips are embedded in a growing number of products.
“You can see the computer age everywhere but in the productivity statistics” – Robert Solow
Work patterns are changing substantially, with much more work mediated through digital platforms. Automation is spreading to some routine service sector activities such as legal search, company reporting, and medical diagnosis. Yet –
statistics now. There are multiple ways digital tech-nology is disrupting the statistics. The table at the end of this article provides a typology attempting to capture these. To start with the production bound-ary, it is clear that more productive activity is now
10 The Future of GDP
Shutterstock, Iaremenko Sergii

taking place inside households, but – as alluded to There
Digital intermediation, whereby people no longer visit high street intermediaries such as travel agents, banks or insurance brokers, but interact with alternative online intermediaries. They use their home devices and broadband and some of their own time, but save time compared with the past, have more choice and the ability to customize, and probably pay low-er prices. Some of the new intermediaries are
substitution of digital for traditional services. The “sharing economy” involves the use of
household assets such as a room or a car, or human capital skills, to earn income. Participants also provide labor – such as cleaning the room or driving. In principle, this activity should be
sampled. Nor have the lower prices consum-
included in price indices. Home production of digital goods ranges from
Wikipedia entries, personal blogs and videos to innovative medical services and open source software and computer services. These will all
products, yet the zero price paid for them is not captured in price indices and therefore in real GDP.
Statisticians would agree it is worth keeping an eye on the scale of these activities, but argue that they do not pose any substantive problems for the
non-productive. If instead we are seeing the start
boundary will – like national boundaries for economic activity – become inherently blurred. In terms of scale, however, digitally driven substitutions within GDP are
this chapter suggests, there are many of these. One substantial set of problems relates to the
borderless and intangible nature of digital activity. As noted, consumers are increasingly using over-seas platforms and e-commerce vendors. These may themselves locate different activities in different places – research & development, servers, pay-ments, sales and marketing, support – as well as sourcing supplies and serving customers in many countries. It is also absolutely unclear how to attribute value in digital-value chains to different territories or indeed what happens in current statistics. “Factoryless production,” whereby all production is outsourced overseas, has become
“Do it Yourself Digital: The Production Boundary and the
The Future of GDP 11
Source: ONS
Figure 4
Data usage
Source: Ofcom
Mobile data (PB)
Dat
a us
age
(PB
)

electronic components manufacturers in the S&P
Conventional statistics for imports of certain goods such as smartphone handsets or washing machines already do not net off
a relatively new database is beginning to collect this value-added data). Still less do they account for the intangible value of the research & development
all might be embedded in an intra-company email of blueprints.
“There are problems related to the measurement of intangibles, or rather the lack of it”
There are problems related to the measurement of intangibles, or rather the lack of it. A big issue is the value of databases, not formally measured at all. Companies clearly believe their data to be valuable. Statisticians sometimes argue it nevertheless depreci-ates so quickly that their failure to measure it is not too serious. But many data-intensive companies disagree, and attribute high option value to data. The fact that
The most important category of issues, certainly in terms of scale and implications for GDP, relates to calculating price indices and therefore real GDP.
GDP in nominal dollar or euro terms, this would be a
do to adjust for innovation and the improving quality of certain ICT-related goods is small in scope. The effects of digital technology are far wider. The biggest challenges are likely to prove to be:
New goods: conventional price indices bring in new goods as a new item rather than an
item. Thus generic pharmaceuticals are not counted as cheaper versions of their branded predecessors. This (well-known) bias is poten-tially large when there are many new goods: music streams or downloads rather than CDs, Airbnb rooms not hotel prices.
Zero prices are not included at all, such as free news online rather than newspapers, or free software or games.
A large category of zero prices for digital products in place of non-zero prices for physical products has been created by smartphones and apps. Many people no longer purchase: cameras, diaries, radios, maps, calculators, watches, voice recorders, GPS devices, guidebooks, and so on.
-ed, whereas bundling has become a common business strategy, especially in sectors such as communications and entertainment.
Of course, not everything that appears to be free -
sonal data) is not captured in the statistics either, nor the imputed value of the associated advertising. At present, it is simply not known how big a difference any
the calculation of real GDP, but, even if each of them is small, their scope is broad. When the US Boskin Commission considered the problem innovation posed
This led statisticians to start to quality-adjust some prices and was also followed by a move to “chain linking” or, in other words, updating the basket of goods used to
years, to better capture the rapid pace of innovation. However, this spreads the new-goods problem over time rather than eliminating it.
One way to appreciate the potential scale is to consider mobile telecommunications charges. This accounts for a reasonable proportion of the price
varies between countries and indeed will depend on
2017 projections for GDP based on market interest rate expectations
12 The Future of GDP
Bank estimates of past growth
4
2
-
-2
Percentage increases in output on a year earlier
ONS data
Projection

Yet, over that period, there have been massive improvements in engineering, such as the bit rate
not know how much value consumers attribute to each bit (and this is a disadvantage with hedonic adjustment based on physical characteristics), the price reduction is manifest in the dramatic increase in data usage. Work in progress to calculate an alternative commu-
-
tion thanks to digital innovation is far lower than -
cations. One is that the path of real GDP, and there-fore the economic narratives built on it, will have to change. The conundrum of setting monetary policy in an economy characterized by major structural change will be still more troubling. The distributional implica-
a smartphone, but for people on low incomes, the services and goods that can be accessed online are less important proportionally than the basics of food, clothing and shelter.
The way forward
This discussion will have made clear that GDP is not a natural object, but a social construct. It has come to be regarded as the ultimate measure of an
-
-
“A Comparison of Demand Side and Supply Side Approaches
economy’s success or failure. Countries compare their levels and growth rates of GDP in international
how many billions or percentage points they might add. This single-minded focus on one number has always been more than it could bear, given how
to data collection challenges, sampling error in -
indicate the margins of error.
“GDP is not a natural object, but a social construct”
quarterly “fan charts” showing the probabilities its forecasters attach to different growth outcomes, indicate the past as well as the future. For instance,
which is a huge margin. Nevertheless, GDP has real strengths, above all
that, in using market prices to value outputs, it makes
economy. It can be adjusted to take account of the different leisure choices made in different countries,
The Future of GDP 13
Shutterstock, Arkhipov Aleksey

and for income distribution considerations. It would be straightforward in principle to take account of the depreciation of natural capital or other assets not currently included in the national accounts. It is also still essential for macroeconomic policy: in thick fog, some light is better than none. For such purposes, GDP serves us reasonably well.
However, a growing number of researchers, as well as technologists and business people aware of the scope and pace of digitally driven change,
statistical framework for measuring the modern economy. There is an active research program under way, engaging economists and statisticians from many countries. The change may be slow, and not only because the UN process is rather
Collecting new statistics is costly, and the whole
to remain in place for the time being. New data sources and techniques will become available, but the process of developing these is still in its early days – again, there is an active research program. Standards also have a strong magnet-ic force: nobody wants to change until everybody changes. Statisticians, reporters, policymakers and
“The most obvious kinds of change happening in people’s lives now are
statistics”
Still, it is possible to see what needs to be done and the outlines of a future statistical framework. It will be important to collect more descriptive statis-tics on all the digital changes, including cross-border
obvious kinds of change happening in people’s lives
Given budget constraints on statistical agencies, this will almost certainly involve online data sources and big data techniques. There are some private
are starting to follow suit.
work to be done in thinking about cross-border activity. This is rather urgent at a time when trade has become much more prominent in policy
the rise of nationalism in trade policy. If the US
artefact, the sooner we understand what is hap-
GDP? Welfare across Countries and Time,” American Eco-
“Within and Beyond GDP: Progress in Economic Measure-ment,” forthcoming.
to multinationals, including intangible assets and data, is not obvious. Nor is it obvious how to map
statistical framework.
The most important conceptual shift will be to move from a framework centered on short-term
measurement of sustainable economic activity, or, in other words, the use of resources today without depleting capital and the possibilities for tomorrow. The most urgent task here is to develop measures of natural capital and appropriate depreciation rates, and this has barely started. Nor is it straightforward to calculate the rates at which renewable assets need to be restored to keep the stock constant or increasing. But that makes the need to start all the more pressing. The statistics enabling other parts of the national balance sheet to be put into place are more often available, but another important gap is
arguments about the need or not for “austerity” will not be settled without this long-run perspective.
“Economic growth is more than important – it is a moral imperative”
Keynes famously said, “In the long run, we are all dead.” He was arguing that the urgency of the moment meant it was no time to worry about the
long run has come, and along with it the bills for living for the day and not worrying about the future. Economic growth is more than important – it is a moral imperative. Growth is driven by innovations that ultimately improve and lengthen people’s lives and well-being, reduce infant mortality, and create
is one where people have a sense of possibility for the future, of hope. However, the increase in
a narrow measure of what matters for people’s economic welfare. The statistical framework of the future will need to measure prosperity and potential prosperity over a longer horizon, to capture people’s access to resources that will enable them to live the kind of life they want to lead. This will take some time. Developing the current System of National Accounts and
understood that the gap between the character of
describe it has broadened so much that the
years ago is no longer an adequate measure of
14 The Future of GDP

Scope of digital changes raising measurement issues
I Activities in the Household Satellite Account (HHSA) – substitution across the production boundary
DIY digital intermediationuse of household capital. Should be treated symmetrically with owner-occupier housing services if of suffi-cient scale?
Sharing economy
Voluntary household production of digital products Measurement of household capital and resultant capital services.
II Activities in GDP – affected by digital business models
Sampling
Composition effects Shift in industry composition especially to hard-to-measure sectors.
Intangibles
Digitization
services). Cloud computing.
Second-hand goodssubstituting for some new purchases.
Ad-funded free goods Same in principle as commercial TV, bigger in scale. Deduct an imputation for cost of watching ads? Substitution between ad-funded vs. subscription vs. purchase to own consumption.
Cross-border effects Substitution between different national GDP totals as consumers switch to overseas intermediaries – data collection issues. Attribution of value added in digital value chains.
ICT hardware Sector is small, no acceleration.
Other price strategies.
ICT services Not hedonically adjusted, but there has been significant scope and quality change. Free goods e.g. operating systems.
New goods Old problem:
d. Boundary between consumer surplus and quality change, i.e. when does it make sense to try to measure value at the margin?
The Future of GDP 15

16 The Future of GDP

Main challenges to GDP
was up 1.4% in March 2018 compared to the previous March.” Any scanner of websites that cover business news can read statements like these on any day of the week. Each statement relies on modern economic statistics using the System of National Accounts (SNA) as their basis.
Further, it discusses some of the many criticisms leveled at the SNA, and particularly at Gross
doubts about how accurately GDP is measured. The second is more about the relevance of GDP (and the SNA) as a guide to policy. Even if GDP is measured accurately, is it measuring anything which thoughtful people should be interested in?
Nicholas Oulton, member of the Centre for Macroeconomics at the London School of Economics
GDP and the SNA: A brief historySimon Kuznets was one of the founders of nation-al income accounting (he was awarded the Nobel
a study that revealed perhaps the most important
His discovery was that economic growth, i.e. the growth rate of GDP per capita, was much higher after the industrial revolution than it had been at any earlier time. So the countries fortunate enough to have passed through the industrial revolution
growth and (eventually) in living standards.
“The advent of great inventions does not necessarily lead to faster growth of per capita GDP on a sustained basis”
The industrial revolution therefore marks a new epoch in human history. To non-economists, the industrial revolution is usually characterized by the great inventions accompanying it, such as steam power and railways. But the advent of great inventions does not necessarily lead to faster growth of per capita GDP
invention of printing and improvements in shipbuild-ing and navigation such as the magnetic compass, which in turn led to the conquest and settlement of the Americas. But we now know that these great discoveries did not lead to an appreciable increase in the European growth rate.
How did Kuznets reach his dramatic conclusion?
and these data only stretched back in most cases
before the industrial revolution. The answer is that he
rates of GDP per capita, which he had measured in his
per year), and then asked the question: suppose these growth rates had prevailed in earlier centuries,
of living would have been so low that no-one could have survived. But if they could not have survived, then we would not be around to do these calcula-tions today. Therefore, growth rates must have been lower before the industrial revolution than after it. One can easily convince oneself of Kuznets’ point by calculating what sum would grow to say USD
-al poverty standard for annual income today) if
Clearly, these income levels are impossible. Kuznets’ conclusions have subsequently been amply
and growth rates in pre-modern economies (e.g.
Uses of GDP
During World War II, pioneering estimates of GDP were used by the UK and US governments for planning the war. Estimates of GDP in current
question was how much could be spent on the armed
an unacceptable level. After the end of World War
The Future of GDP 17

II, the national income accounting revolution spread rapidly across the world. The United Nations, under the guidance of other pioneers like Richard Stone
took up the challenge of producing an international-
Union employed and enforced a rival system on its satellites, the Material Product System (MPS),
the Soviet Union has meant the disappearance of the MPS too, even in countries run by communist parties like China.
The post-war development of the SNA met the needs of Keynesian macroeconomic management, support for which was spreading rapidly. For this purpose, GDP is necessary in constant as well as current prices. Quarterly as well as annual estimates of GDP started to appear. Keynesian notions of macroeconomic management are now less popular than they once were, but central banks with a remit
quality and frequent estimates of GDP and its main components such as consumption and investment.
“Keynesian notions of macroeco-nomic management are now less popular than they once were”
In parallel with the needs of monetary and
SNA has arisen due to increasing interest in the problems of long-run growth and development, both in developing and developed countries. And
such as the capital and productivity manuals of the Organisation for Economic Cooperation and
-
capital enshrined the fundamental distinction between capital stocks and capital services,
showed how it could be incorporated into the SNA. Building on the pioneering contributions of
employed the concept of capital services to show how theoretically consistent measures of total factor productivity growth could be derived within the framework of the SNA.
With the rise of major new economic powers like China and more recently India, there has also been increasing interest in international comparisons of the size of different economies (GDP) and their relative standards of living (GDP per capita). The
crucial institution here is the International Comparison Program (ICP) run by the World Bank in conjunction
-
-tical agencies (NSAs) track prices over time for their domestic price programs such as the Consumer Price
-rative and coordinated network of NSAs. The prices of the individual products and the overall averages for aggregates like household consumption or GDP, all measured relative to US dollar prices in the USA, are known as Purchasing Power Parities (PPPs). In both the national and international programs, broadly the same methodology is used: “matched models” under which the agencies try to track the prices of identical models either over time or across space. The results can be controversial in some cases. China (and Asia generally) turned out to be considerably poorer
China’s and Asia’s rankings rose substantially in the
How accurately is GDP measured?At least in countries with well-developed statisti-cal systems, GDP in current prices (nominal GDP) is considered to be measured reasonably well (it may be a different matter in poor countries (Jerven
in volume terms, i.e. real GDP, because moving
two major issues with price indices. First, they may not make adequate allowance for quality change and for new goods. Second, for some components
Bias in price indices
There has long been concern that price indi-ces may understate quality change and not make adequate allowance for the appearance of new goods,
understatement of real economic growth (very few researchers have advocated the opposite position, though it may be true for individual products2). Most of this evidence is for the USA, but there is no reason to think that other developed countries are any better.
-duced hedonic methods to measure commercial rents, it found
used “matched apartments” to measure rents. But, over time, the apartments being matched were getting older and less de-
and hence overstating growth in the real volume of housing
18 The Future of GDP

Perhaps the strongest advocate of this view is Robert Gordon. His earlier work uncovered a huge underestimate of quality change in durable
annum too high. He reached this result by replicating the methods used by the US Bureau
-
the Sears mail order catalogs. These gave prices together with descriptions of items like lawnmow-ers, sometimes accompanied by photographs, so he was able to apply the “matched models” meth-od of statistical agencies. The “matched models” method involves tracking the price of the same model over time, thus holding quality constant.
he has argued strongly that growth in the US standard of living since the Civil War and up to the
because of the revolutionary new products that became available to the typical family over these
travel, etc.) are not given full credit in the national accounts. The Advisory Commission to Study the
as the Boskin Commission (of which Gordon was a member), argued that the Consumer Price
inadequate allowance for new goods and quali-ty change. Other factors were substitution bias, outlet bias and formula effects.
“Economic theory has long known how to cope with new goods (or vanished old goods) in calculating a price index”
There are two problems with incorporating the
of its newness, it may be some time before it is
effect on the standard of living will be understated since only price changes after its introduction will
does not lead to an impact on real income. The
one. The second is more conceptual.
The Future of GDP 19
Shutterstock, VanderWolf Images

In fact, economic theory has long known how to cope with new goods (or vanished old goods) in
consumer good (or a new input), we should treat it as
for it is reduced to zero, i.e. its reservation price, also called its virtual price. More precisely, the reserva-tion price is the minimum price at which there is zero
the new good’s reservation price should be included
makes it clear why ignoring new goods leads to an overestimation of price rises and a consequent underestimation of real growth. For the price of the new good has in fact fallen from its reservation level to its observed level, which is necessarily lower.
The problem is how to estimate the reservation price. Researchers have done this for individual prod-
of breakfast cereal (Apple Cinnamon Cheerios), see -
sial since they are dependent on particular assump-tions about demand and on econometric methods
approach, based on a Constant Elasticity of Substitution
about the pattern of demand and has the unpalatable
to the point, no statistical agency currently uses the reservation price approach to measure the impact of new goods. So the problem has been parked and we must wait for further research to see whether a practical method can be developed (here “practical” means, in part, “within the budget that governments are willing to allot to statistical agencies”).
“It is probably no coincidence that there has been renewed interest recently in the possible understate-ment of GDP growth”
How much difference improved methods would
sometimes mentioned. It is probably no coincidence that there has been renewed interest recently in the possible understatement of GDP growth since GDP and productivity growth seem to have slowed down at least since the Great Recession began at the end
reason to ascribe the slowdown to mismeasurement since the latter was at least as great a problem prior to the appearance of a slowdown (Byrne et al.
Statistical agencies will no doubt implement improved methods as time goes on and research delivers new solutions. But a point to bear in mind is that price indices are almost never revised. So the shortcomings of earlier methods will remain in the historical record, even if the most recent years are better measured.
Missing or inappropriate price indices
Real GDP can be measured either from the
GDP(O). Consistency requires that the two measures
Private consumption (C) typically accounts for
CPI program is the largest and best-funded of all
have to rely on the much less well-funded Producer
account for a large fraction of GDP (in some small countries a multiple of GDP), but what matters for GDP is the balance, typically a small proportion of
these days tend to trade mainly with each other and
cancel out.
“The shortcomings of earlier methods will remain in the historical record, even if the most recent years are better measured”
That leaves government consumption (G) – defense and public administration, education, and health – as the remaining major component of GDP(E) and
countries measured real government output by real government input (essentially hours worked adjusted for the composition of the labor force), which left very little room for productivity improvement and allowed for no improvements in quality. Nowadays, some countries try to do better by using a collection of output measures
the education sector can be measured by a weighted average of the numbers passing through each stage of the school system, weighted by the costs of providing each stage. This is better than measuring education output by hours worked in this sector, but hardly addresses the quality issue. The quality issue is perhaps greatest in health, where there have been large improvements in health outcomes, sometimes achieved
-dations tailored to the British case for improving economic statistics.
20 The Future of GDP

and strokes has been greatly reduced by statins and aspirin. It is clear that these improvements are not
On the output side, GDP is the sum of value added across industries. Here the appropriate price indices are Producer Price Indices and (where
outputs, but this is not always the case). In practice, statistical agencies tend to put much more weight
The reason is that the bulk of GDP(E) is private consumption, where price indices are comparative-
--
mates of the growth of real GDP(O) so that they
the growth rates of private service industries. The reason, no doubt, why the adjustment falls on private services is that this is where price indices are either inadequate or missing, so that they have to be
A large fraction of the output of a modern economy (often larger than the proportion account-ed for by manufacturing) is made up of industries supplying mainly intermediate services to business,
(accountancy, advertising, contract cleaning, de-sign, legal, management consultancy, computer and
software services, etc.). Here price indices are often of low quality or missing altogether (Timmer
care just about GDP, this does not matter since these
business services are an intermediate product so drop out of GDP(E). But, if we also care about what is happening in individual industries, say because we want to trace the origins and impact of the Great Recession, then we will also need better price
business services.
Cross-country comparisons of price and income levels
Although it has attracted far less attention than
indices, the accuracy of PPPs is just as pressing an issue. There are conceptual problems that are yet to
income levels yielded by successive rounds of the ICP
studied. Whether this should be treated as a fact of life or adjusted for in some way is still a matter of debate.
and base international comparisons solely on succes-
The debate continues here and also in regard to
The Future of GDP 21
Shutterstock, hareluya

GDP and globalization
year’s growth and certainly putting China in the
any revisions to underlying data nor from method-ological changes but instead was due to application
measures output generated by residents (persons and corporations) of a given economic territory. But globalization has made residence a somewhat slippery concept. And this has been compound-ed by the rising importance of income accruing to intellectual property, e.g. royalties and fees for the use of technology and brands. Often these payments are made between subsidiaries of a multinational company. So where the subsidiary
difference to GDP, particularly if it is located in a small country. And it is no secret that location is
“Future versions of the SNA will
What seems to have happened in the Irish case is that one or more large multinationals moved the subsidiary which licenses technology and brands to the rest of the group to Ireland, causing the large
little or no difference to the Irish standard of living (real household disposable income in Ireland rose
point of view it was just a redistribution of, rather than an increase in, global output. Nevertheless it makes the interpretation of Ireland’s GDP, and that of any other country in the future subject to such shifts of residence, problematic. It may well be the case that the Irish subsidiaries generating
but managed from Ireland. But it is also very likely
were not created in Ireland but elsewhere, proba-bly mostly in the USA. Future versions of the SNA
4
Should we still care about GDP? The commonest criticisms of GDP as a target of policy are the following:
It ignores leisure and women’s work in the home. 2. GDP ignores distribution. In the richest country in the world, the United States, the typical person
inequality has risen sharply.
But the evidence is that, above a certain level, a higher material standard of living does not make people any happier. So we should stop looking for policies to raise GDP and look instead for policies that promote happiness. 4. Even if higher GDP were a good idea on other grounds, it is not feasible because the environ-mental damage would be too great. The planet
are to be allowed to raise their standard of living by a modest amount, then consumers in the rich countries will have to accept a lower standard of living, i.e. lower not higher GDP per capita should be the aim for them.
precludes a discussion of the fourth.
welfare”
GDP is and always was intended to be a mea-sure of output, not of welfare. In current prices, it measures the value of goods and services produced
GDP includes output of investment goods. Convert-ing to constant prices allows one to calculate growth of GDP over time (or differences between countries
and leisure is not due (I believe) to prejudice against women, but to the desire on the part of national income accountants to avoid imputations wherever
values for leisure and home production provided the necessary data on time use are available and provid-ed one can decide on an appropriate wage rate to value time spent in non-market activities.
“One can imagine a social welfare function that has GDP as one of its components along with health,
Though not a measure of welfare, GDP can be considered as a component of welfare. The volume of goods and services available to the average person clearly contributes to welfare in the wider sense, though of course it is far from
22 The Future of GDP
being the only component. So one can imagine a social welfare function that has GDP as one of its components along with health, inequality, human rights, etc. (see comments below on the Stiglitz-Sen-Fitoussi Report).
GDP is also an indicator of welfare. In prac-tice, in cross-country data, GDP per capita is highly correlated with other factors that are important for human welfare. In particular, it is positively cor-
with infant mortality, and negatively correlated with inequality. at the end of this chapter
plot household consumption per capita rather than
but the picture for GDP would be very similar). In other words, richer countries tend to have greater life
-ity (although this last relationship is not a linear one: some middle-income countries have high inequal-ity, but nonetheless the richest countries are also the most equal ones). Correlation is not necessarily causation, though one might certainly make the case that higher GDP per capita causes improved health
century. This means that people have more years in which to enjoy the higher consumption they now receive, an aspect of welfare which is not captured just by the GDP statistics. But, recently, the USA has seen a rise in mortality among less-educated, middle-aged whites due it seems to self-harming behavior – drug and alcohol dependency, accidents
appear in other developed countries remains to be seen. According to the Commission on the Measure-
ment of Economic Performance (the Stiglitz-Sen- Fitoussi Commission), policy should be concerned with well-being, and well-being is multi-dimension-
be used. Based on academic research and a number of concrete initiatives developed around the world,
dimensions that should be taken into account. At least in principle, these dimensions should be consid-ered simultaneously:
nature.”
Few will disagree that these dimensions of life are important for human welfare and no-one can object to improved measurement. There is clearly a role for government in measuring and tracking these
like “social connections and relationships” should be objects of government policy is open to question. It is doubtful in my view that effective policy levers
The Future of GDP 23
Shutterstock, Lonely Walker

If one sticks to measurement and is some-what less ambitious than the Stiglitz-Sen-Fitoussi Report, then further progress is possible. Jones and
consumption to construct what they call a consump-tion-equivalent welfare measure for a large sample of countries. Their measure turns out to be highly correlated with GDP per capita.
2. “Growing GDP is pointless since most people
This claim is most often made in relation to the USA. Many people assert that real household income levels there have stagnated since the
capita growing quite rapidly. It is non-controversial that income inequality has been rising for decades in the USA, but does this mean that the typical
reveal quite a different picture.
are superior to GDP as a measure of household welfare: Comprehensive Disposable Income (CDI), Post Fiscal Income (PFI), and their preferred measure, the Levy Institute Measure of Econom-ic Well-Being (LIMEW). CDI is household income, including property income (on an annuitized basis),
to this individual public consumption (e.g. public-ly provided health and education, but not things like defense). Finally LIMEW adds the value of house-hold production. These measures are all per house-hold. For LIMEW they also report equivalent median
for changing household size and composition. They estimated each of these income measures over the
measuring economic welfare over time is the objective, they convert each measure to real terms using the CPI and consider the median household values.
“It is non-controversial that
rising for decades in the USA, but does this mean that the typical household has received
-alyzed by age, gender and educational level, have stagnated
standards have also stagnated since the composition of the labor force might have shifted to better-paying jobs. And
account too.
The growth rates of these four concepts of house- at the end
of this chapter, with the last column showing growth
if we look at the sub-periods in the table, we can see
supposedly the golden age of economic growth, was actually a comparatively poor one for households. Far and away, the best period for households was
The second take-away from is that
all these measures grew much less rapidly than
measures grew at anything like this rate, e.g. their preferred measure, median LIMEW, grew at only
for this huge gap? Wolff et al. do not discuss this
Household size and composition have been changing: there are fewer children and more
equivalent median LIMEW grew faster than
household income is spread over a smaller number of people).
If the distribution of income had stayed the same, then mean LIMEW would have grown at the same rate as the median. In fact, the
p.a. According to my estimates, equivalent
-
raises the growth of equivalent mean LIMEW to
Methodologically, the PCE is superior to the CPI
the CPI is a bi-annually chained Laspeyres.7 Line
-
-ences in relative weights due to the use of different surveys.
24 The Future of GDP

Much of the remaining gap between median LIMEW and GDP per capita can
investment has grown faster than consumption over this period, pulling up GDP in relation to consumption. Second, household production is included in LIMEW, but not in GDP: household production grows slowly because, by assumption, there is zero technical prog-ress. These factors may account for the
-tween the growth rates of median LIMEW and
These remarks are not meant to suggest that GDP per capita is a better measure of welfare than
how there can be such a large difference between the growth rates of the two.
The conclusion is that the median US house-
median household would have gained more (to the
However, most of the gap between the growth in GDP per capita and in median LIMEW is not due to rising inequality, but to the other factors detailed above. Furthermore, and contrary to the common
“One can move “beyond GDP” to explain how household welfare relates to GDP”
The above analysis is an attempt to show how, while still making use of the SNA, one can move
relates to GDP. The main point is that rising inequality has certainly reduced the gains from higher productivity that would otherwise have accrued to the typical US household, but has not eliminated these gains completely.
boom. The median household has certainly done worse during the Great Recession and its aftermath, mainly because of lower productivity growth and declining labor force participation. Whether these adverse headwinds will continue to operate is an important question. On the one hand, there are
who argue that developments in AI are about to open a cornucopia of productivity growth. On the other hand,
have been falling in relation to consumption goods, i.e. technical progress has been more rapid in investment goods. To keep the capital output ratio constant in current price terms, investment has to grow faster than consumption in steady state.
The Future of GDP 25
Shutterstock, Beautiful landscape

argue the opposite: the great innovations are all in
intelligence and information technology will be much
support in Fernald’s work on the growth of total factor
before the onset of the Great Recession. But else-where I have argued that this pessimism is overdone
-
Europe, is due to the Great Recession itself. So when the Western economies are fully recovered productivity
There have been a number of suggestions for discarding GDP in favor of a measure that takes
where y is the income of the i-th person (or household), N is the number of people (or house-holds) and is a parameter measuring “inequality aversion.” If inequality, in which case the Atkinson measure reduces to GDP per capita (or per household).
In the standard treatment, of which the Atkinson
inequality averse. I would argue that our moral
captured by this formulation. In particular, the crucial
Sen approach were the whole story, then social welfare would be raised by abolishing two institutions (among others): the national lotteries run in many countries and the Nobel prizes. Both increase inequality unam-biguously. Indeed Nobel prizes must be the most un-equally distributed of all forms of income: only a dozen or so individuals receive one each year out of a world
grounds: monetary incentives are needed to induce
everyone, including the worst off. But suppose that it could be conclusively shown that the monetary rewards are not necessary, and that the prize winners (and their less-successful colleagues) would have
and glory alone? I suspect that most people would still be quite happy to see the winners receive a monetary reward, even if it was not economically required. This is because they are perceived to deserve it. With national lotteries, a different form of desert comes into
million or more and, in one sense, no-one is worth this amount. But anyone can buy a lottery ticket and, as long as the lottery process is perceived as fair, most people are quite happy with the outcome.
be that people’s views are not entirely consis-tent. Who gets the money and for what may well make a difference. The large rewards paid to professional footballers may be seen by many
playing well), in contrast to the similar-sized rewards paid to some bankers, especially after the
Then there is the issue of redistribution, particularly welfare payments. Here it is obvious that notions of merit or desert play a major role in
former soldier with post-traumatic stress disorder
amount to a drug addict with addiction-induced mental health problems may seem quite another.
democracy, they should be taken into account. In summary, it is not clear that the Atkinson
setting aside the issue of varying “taste” for inequal-ity (the parameter ). There is certainly a case for
-nately, we do not need to choose between GDP and
to use and argue for both.
3. “Raising GDP per capita is pointless as it doesn’t make people any happier”
Surveys of well-being or happiness repeatedly show that, within any given country at any point in time, richer people report themselves to be happier than poorer people. But, when the same survey is repeated in the same country over time, there is no rise in the average level of happiness despite the fact that per capita income has gone up. Most of the time series evidence is for the USA. This result
and the one suggested by Easterlin himself is that, at least above a certain level of income, people care more about their relative position in the income scale than they do about their absolute position. They are motivated by envy of those more successful than themselves and also by the satisfaction obtained by looking down on the less successful, rather than by
reconciles the cross-section and time-series evidence. But it leaves the implication that stopping growth would have no effect on happiness. Also, more redistribu-tion from rich to poor would raise overall happiness, given that the rich are less numerous than the poor. At least this would follow if we take a utilitarian view and provided that redistribution did not reduce GDP too much through adverse incentive effects.
I must admit that I am puzzled by these survey results, mainly because they are inconsis-tent with other facts about people’s behavior. First,
26 The Future of GDP
1/(1 )1
1
1 , 0 1Nii
Z yN

one might ask if people care mainly about their relative position, why has there been so much fuss
in most countries, the drop in income has been
and, furthermore, it fell disproportionately on the rich (at least initially). Second, if people care about their relative position, why does this have to be
many workers in developed countries today can work part time if they want to. Consider two work-ers, A and B. A has a higher daily rate of pay, but chooses to work only three days a week.
a week, so his annual income is higher than A’s. So why can’t A boast that his daily rate of pay is higher than B’s even if his annual earnings are lower? That way he can satisfy his desire to lord it over B while still enjoying a leisurely lifestyle. In other words, a concern for relative position does not necessarily force people to work harder or lon-ger than they would otherwise wish to do. But per-haps B-types are commoner than A-types. Surveys of part-time workers regularly show that many would like to work longer hours if only they could.
“People’s leisure choices provide powerful evidence against the view that only relative position matters”
In fact, people’s leisure choices provide powerful evidence against the view that only relative position matters. The classical economists argued that the amount of time people were prepared to work depended on the range of goods and services available for consumption. This was the basis for Adam Smith’s “vent for surplus” theory of interna-tional trade, which was elaborated by John Stuart
“A people may be in a quiescent, indolent, uncultivated state, with all their tastes either
may fail to put forth the whole of their productive
The opening of a foreign trade, by making them acquainted with new objects, or tempting them by the easier acquisition of things which they had not previously thought attainable, sometimes works a sort of industrial revolution in a country whose resources were previously undeveloped for want of energy and ambition in the people: inducing those
new tastes, and even to save, and accumulate capital, for the still more complete satisfaction of those tastes at a future time.”
since the beginning of the Industrial Revolution in Britain, process innovation has taken place at the
The Future of GDP 27
historically observed rate, but there has been no product innovation in consumer goods (though I allow product innovation in capital goods). The UK’s GDP
So people today would have potentially vast-ly higher incomes than they did then. But they can only spend these incomes on the consumer goods
or coal), lighting (candles) and clothing (mostly made
carriages were available to the rich and would now in this imaginary world be available to everyone. But there would be no cars, refrigerators, washing machines, dishwashers or smartphones, no radio, cinema, TV or Internet, no rail or air travel, and no modern health care (e.g. no antibiotics or antisep-tics). How many hours a week, how many weeks
-ed lifetime would the average person be willing to work? My guess is that, in this imaginary world, people would work a lot less and take a lot more leisure time than people do today. After all, most consumer
“Policy should take people as they are, not as others would have them”
Overall, the proportion of time devoted to market work has not changed much in the last century, though this masks differences between women whose contribution has been rising, while that of men has
leisure choice may be somewhat of an accident, produced by a battle between product and process innovation. There is no guarantee that this constan-cy will persist. If consumer product innovation falters,
factors are at work here too: increased longevity, itself probably a product of economic growth, is generating pressure for increased work effort.
In summary, people’s choice between labor and leisure demonstrates that they value higher consumption in an absolute and not just a rela-tive sense. So rising GDP per capita would be in accordance with people’s desires and preferences. Philosophers and social critics may object that the average person’s desires and preferences are trivial, ill-informed and misguided (an attitude which can be traced back at least as far as Plato’s Republic), but policy should take people as they are, not as others would have them.
nowadays and, even within the food basket, many items

Conclusion: Not fade away?
another one. Assume that technical progress
ever-increasing leisure? If so, consumers would be increasingly satiated with the goods and services that GDP measures. So, in this era of material abundance, GDP might come to be viewed as not wrong, but increasingly irrelevant. Such societies would probably have their share of problems due to the uses to which some people might put their ever-more-abundant leisure. But the analysis of such problems would not be helped much by the GDP statistics.
goods or services. We know that the two centuries
consumer goods invented and made available on the market. It seems to me very unlikely that this inventiveness will simply come to a dead halt in the
to appear in a steady stream. On this count alone, GDP and the SNA will continue to be useful. Also much of the rest of the world outside the magic circle of Western societies remains poor. Today’s poorer countries will likely retain an interest in GDP for many decades to come.
The “core” SNA is now buttressed by satellite accounts covering interactions between the economy and the environment and household
deepen as international discussions proceed toward
28 The Future of GDP
Figure 2
Life expectancy vs. household consumption per head (log scales)
(log scale for household consumption)
Infant mortality vs. household consumption per head (log scales)

The Future of GDP 29
Notes: CDI: Comprehensive Disposable Income. CDI equals LIMEW less the value of household production and public individual consumption, per household. PFI: Post Fiscal Income. PFI equals LIMEW less the value of household production, per household.
with property income valued on an annuity basis, per household. Equivalent median LIMEW: median LIMEW per equivalent household, i.e. after adjusting for household size and composition. Equivalent mean LIMEW: calculated as growth of equivalent median LIMEW plus growth of mean LIMEW minus growth of median LIMEW.
Sources:
1959–1972 1972–1982 1982–1989 1989–2000 2000–2004 2004–2007 1959–2007
Deflated by CPI-U
2. Median PFI
4. Equivalent median LIMEW
Deflated by GDP or PCE deflator
7. Equivalent mean LIMEW
(deflated by GDP deflator) 2.74
(deflated by PCE deflator)
Memo items
Real income measures, per capita and per household, in the USA: annual percentage rates of growth, 1959–2007

30 The Future of GDP Photo: Shutterstock, Pinosub30 The Future of GDP Shutterstock, Mykola Mazuryk

Alternatives to GDP
Thinkers as far back as Aristotle have claimed that wealth is a means to achieving objectives,
happiness, economic development can nevertheless be used to achieve positive social impact that can broaden an individual’s spectrum of choices and give everyone greater capacity and
other areas that are essential to human well-being – a healthy environment and technological progress.
Authored by CSRI Academy Members1
It is no surprise that improved health, as well as reduced economic and gender inequality, can enable individuals to achieve a positive social impact. Assessments of economic development should therefore also consider social indicators such as health, economic and gender inequality in order to evaluate if increasing wealth is also enhancing societal well-being. Furthermore, healthier, more equal, and more inclusive societies are likely to be more productive economically.
Environmental pollution is harmful to human health, while climate change tends to dispropor-tionately affect the poor. Measures of economic development should therefore account for environ-mental impact and sustainability. In the long run, ensuring environmental sustainability will be good for economic growth as healthier soils, cleaner seas, and living forests will produce much more than if they were degraded or polluted. Furthermore, healthy ecosystems provide a range of ecological
-ing established economic measures.
“Measures of economic development should account for environmental impact and sustainability”
Historically, technological progress has been a crucial factor in driving economic development and improving human well-being. Innovative inventions can spur economic growth. Productivity increases thanks to new technologies have also helped humani-ty to better meet its material needs and wants through improved agriculture and manufacturing. Technolog-
ical progress has reached an unprecedented stage of advancement. The ongoing Fourth Industrial Revolution and its associated technologies such
on economies and societies, and potentially affect human well-being. Measures of economic develop-ment should therefore also account for technological change and its potential impacts.
Environmental issues, social impact, and tech-nological progress are vital to people’s everyday lives, and thus should be properly incorporated into measures of societal well-being and economic wealth. While GDP is the most widely used standard metric, it might not be comprehensive enough to be universal. Alternative measures to GDP attempt to
so that countries around the world can better track their progress and world leaders can make better decisions for their people.
Accounting for the environmentEnvironmental aspects of economic develop-ment indicators have been discussed widely, as sustainability concerns gain traction. There is
costs associated with cleaning it up are often counted in GDP, thus inflating GDP figures and making the oil spill look like growth. However, even putting environmental costs aside, many have argued that measuring sustainability in addition to growth is important when talking about economic development since sustainability is integral to long-term progress.
Such concerns have given rise to a slew of alternative growth measures. One group focuses
represented by green GDP measures, an umbrella term that has gained considerable popularity among economists and policymakers. By factoring in the
The Future of GDP 31

environmental consequences of growth and produc-
calculations, which focus solely on capital and labor, while taking land, or in other words the environment,
GDP can help policymakers make more informed decisions regarding the economy as well as environ-mental regulations and standards. On the other hand, an inherent challenge is the reliable measurement and monetary valuation of changes in environmen-tal quality. However, the importance of incorporating environmental concerns into development measures has kept green GDP popular despite such concerns.
Sustainable National Income
While there are numerous approaches to green GDP, one of the most popular ones is Sustainable National Income (SNI), an indicator that takes into account to
if we want to keep our current level of welfare.2 Unlike GDP, not only does SNI incorporate sustainability in its income measures, but it can also be used to measure environmental degradation through a simple calculation of the difference between actu-al and sustainable income. However, this informa-tion comes at a cost – to be able to measure these sustainable levels, one must make assumptions. These include absolute sustainability preferences among the public and variables such as technology and employment being stable. However, techno-logical and labor changes have been very rapid in recent years.
“SNI could be used as a good supplement to GDP, especially when trying to measure whether economic growth has come at an environmental cost”
Moreover, while economists often make use of homogeneous preferences or keeping certain variables stable, such assumptions can make for an indicator that is less accurate than GDP, main-ly because opinions on sustainability vary widely. Considering the lack of consensus on welfare measurement, it can be hard to pick the assumptions that will lead to the most accurate measurement. Additionally, SNI implies that there is a trade-off between production and sustainability, which is not necessarily the case. Given the current state of most economies, such a trade-off can seem logical. However, green technology glosses over this trade-off in some cases, especially when it comes to energy generation.
income and multiple indicators for sustainable development
Furthermore, a major downside to SNI as a measure of sustainable production levels is its
production level considering technology, environ-mental functions should be available “forever.”4 Assuming that this can happen with any produc-tion level is highly optimistic, especially considering
--
tions. Nevertheless, whereas SNI might appear as more of a theoretical indicator rather than a practi-cal one, it can be used in measuring how far away from the level of sustainable income a country is. However, without making the difference between sustainable and actual income, SNI by itself offers little usability and comparability. It could be used as a good supplement to GDP, especially when trying to measure whether economic growth has come at an environmental cost.
Genuine Progress Indicator
A second group of indicators takes into consider-ation both environmental and social aspects, which are neglected by GDP. A promising alternative to GDP is the Genuine Progress Indicator (GPI). The GPI starts with consumption data similar to that used in GDP calculations. It then adjusts this by
costs of crime, environmental degradation, and loss of leisure, while (2) adding the impact of items like services from consumer durables and public infra-
housework.
and as such has the same scale as GDP. The GPI can thereby serve as a per capita measure of economic performance that can be compared across nations and regions. Taking a closer look at
,7 which shows the GPI and GDP per capita for the USA, we can see that while GDP per
capita has remained relatively stable. This would imply that the costs of economic growth, which are not
-
did not. As it deducts for environmental degradation, among other “costs of economic growth,” the GPI will decrease the larger these deductions become. In , we can see that these deductions have actually become so large that they neutralize the
4. Ibid-
San Francisco.
7. Kubiszewski, I., Costanza, R., Franco, C., Lawn, P., Tal-
Measuring and achieving global genuine progress. Ecological
32 The Future of GDP

One of the most cited critiques of the GPI is that it requires subjective value judgments over which items to include and how to value them. Additionally, the GPI is a weak measure of sustain-ability as it assumes perfect substitutability among different forms of capital. For instance, the depletion of natural resources can be masked by substitution of human-built capital since all items
terms. However, human-built and natural capital are in fact not interchangeable. Even if we have
substitute vital natural capital attributes such as,
-ability differences into account is traded off for the
Adjusted Net Savings
Another recognizable alternative to GDP, result-ing from the vast amount of criticism over GDP’s limitations concerning sustainable growth, is the Adjusted Net Savings (ANS) indicator (also known
percentage of Gross National Income (GNI). ANS encompasses the standard national accounting
estimates of natural resource depletion, and (4)
particulate emissions. The interpretation of ANS is straightforward: a negative ANS denotes that we are depleting capital stocks, whereas a positive ANS means that we are building wealth.
The ANS indicator has earned a strong recognition due to its coherence and simplic-ity, but also because it has been adopted to
including the World Bank, the United Nations and the European Union.
Sustainable Economic Welfare. Social indicators research,
Elgar Publishing.
Environment Department, World Bank: Washington DC.
Development Report. New York: United Nations Department of Economic and Social Affairs, Division for Sustainable De-
-tors for the Lisbon Agenda.European Parliament, Policy Department, Economic and
to Gross Domestic Product (GDP) as a Means towards Sustainable Development, Study requested by the EU Parliament’s Committee on the Environment”, Public Health
Since ANS can be used on a national, regional and global scale, and because the calculation involves corrections for human and natural capital, its employ-ment appears to be a desired policymaking instrument for the qualitative measure of growth. Among other shortcomings, ANS suffers from the same drawback of being a weak sustainability measure just like the GPI discussed earlier, as it allows natural resources to be compensated by production and human capital. Thus, despite promising efforts, the ANS indicator itself appears to be a step in the right direction, rather than a ready-made alternative for GDP.
Accounting for social factorsThe most important assets of a nation are arguably its people rather than the sum of its material wealth since human beings are both the means and the ends of economic development. Growing awareness of the importance of improving human welfare through development has led to various indices being created that assess human and societal well- being by considering social indicators such as health, education, economic inequality, and gender inequal-ity. These indicators are particularly important since improved health and education, as well as reduced economic and gender inequality can enhance the range and capabilities of individuals to make choices
--
Real GDP and GPI per capita, 1950–2004 (in 2000 USD)
sustainable development. Redefining progress
The Future of GDP 33
GPI per capita GDP per capita

DIMENSIONS
INDICATORS
DIMENSIONINDEX
Long and healthy life Knowledge A decent standard of living
of schoolingMean years of schooling
GNI per capita (PPP USD)
Human Development Index
be gained from using national wealth to achieve social impact. For instance, research suggests that reducing gender inequality could potentially boost
-
and educational levels, as well as economic and gender inequality. Alternative indices can serve as a useful tool for policymakers by providing insights about
how economic resources could best be used to achieve the desired social impact.
Figure 2
Human Development Index (HDI)
Human Development Index
As an alternative to GDP, the United Nations Development Programme (UNDP) launched the
measures the development of countries not only through economic growth, but also in terms of people’s capabilities, longevity, and quality of life. The HDI was created to put emphasis on how peo-ple live and develop throughout their lives, and how the different levels of human development can affect macroeconomic variables important to the economic growth of a country such as GNI and GDP.
The three dimensions comprising the HDI are long and healthy life, knowledge, and a decent standard of living. The HDI is a geometric mean of normalized indices for each of the three dimensions, as shown in Figure 2an indicator for health since people born into healthier
-ed and mean years of schooling are the indicators the HDI uses to measure how knowledgeable the society is. The third component, “a decent standard of living,” is gathered from the GNI per capita. Due to its holistic approach, the HDI can stimulate discussion about why countries with similar levels of income still have varying degrees of human development.
is a color-coded map of the world according to HDI levels. The darker the shading, the higher is the level of human development for that given country. When compared to Figure 4, a color-coded
-ment Programme Human Development Reports, accessed
-
Global HDI Levels 2016
Very high human development
High human development
Medium development
Low human development
34 The Future of GDP

map of the world according to wealth, one can observe that wealthier countries tend to have higher levels of human development. This makes perfect sense, given that a decent standard of living is one of
-tance of material standards of living for overall well- being. Meanwhile, higher levels of wealth result in more resources being available to improve health and education, thereby contributing to higher levels of human development as measured in the HDI.
by human development, economic growth, and sustainability. As economic growth and advance-ment have slowed down over the last decade, it is of increasing importance for individuals and countries to gain competitive advantages through living healthier lives, reducing healthcare costs, increasing productivity, and raising the levels of societal well-being. shows the relation-
world GDP growth based on World Bank data from
of GDP has remained at rates of between
According to the World Bank, the large gap between these two indicators shows the increasing inability of GDP growth to keep up
Policymakers will face the challenge of how to pay for
Figure 4
Wealth levels (USD)
No data
Source: World Bank database
The Future of GDP 35
7

slowing down. Indices that provide information about average societal health levels, such as the HDI, are thus likely to become ever more relevant than before.
“A well-educated and skilled labor force is necessary for countries to diversify their economies”
Education is also critical to human and economic development. The widely adopted view is that education increases skills and knowledge and provides greater opportunities in life. Also, higher levels of education can stimulate innovation, which boosts economic productivity. A well-educated and skilled labor force is necessary for countries to diversify their economies and move up produc-tion value chains, which is crucial for prolonged economic development. GDP does not consid-er health indicators or educational levels. A focus on GDP alone may lead to policies that promote economic development, but that leads to increased pollution or elevated stress levels, which can all trigger the onset of non-communicable diseases (NCDs) that are long-lasting and have high treat-ment costs. More holistic development measures like the HDI that emphasize health and education can help policymakers strike a balance between promoting more sustainable economic growth and increasing human well-being by building up a healthier and better educated workforce.
Inclusive Development Index
Despite the widespread adoption and utilization of the HDI as a holistic measure of national progress, analysts have continually attempted to redefine development in yet more meaningful and nuanced ways. These attempts often strive to quantify economic well-being in a manner that captures more relevant information than pure-ly GDP per capita. The HDI as it was originally created has certain limitations. It does not account for the environmental impact on human well-being, nor does it consider the influence of inequality on human development. Therefore, several alternative metrics such as the Inequal-ity-Adjusted HDI have been created to account for this shortcoming.
-ment Programme: Human Development Reports, accessed
-mizing Healthy Life Years: Investments that Pay Off,” World
-
36 The Future of GDP
Shutterstock, Pattarika Sisombat

-
inclusion, and intergenerational equity.Deepening inequality as a consequence of
pro-growth policies such as free trade agreements has been cited as a key cause of the recent global surge in support for populist politicians.22 The political disruptions engendered by inequality as well as grow-ing awareness of the economic consequences of inequality have spurred a broader focus on equity and inclusive growth, and led to the development of indices that include indicators for inequality. To evaluate the three pillars of economic prosperity, namely growth and development, inclusion, and intergenerational equity, the IDI uses a range of indicators. In addition to GDP per capita, the IDI
of income and wealth inequality, dependency ratios and public debt levels to better assess an economy’s overall standing.society’s bottom-line measure of economic progress, namely broad-based living standards. Living standards are a multidimensional phenomenon that encom-passes income, employment opportunity, economic security, and quality of life. The IDI’s bottom-line approach allows it to serve as a useful complement to GDP, which can be understood as a top-line metric of national economic performance.24
Since the IDI’s varying component indicators are frequent and logical targets of policymakers, the
kept GDP per capita a popular indicator. The IDI aims to both provide an impetus for policymakers
-ously creating a practical framework within which they may do so. has been constructed with the most recent HDI and IDI values available,
correlation with the HDI.
-
--
-
Netherlands, Ireland, Australia, Austria, Finland, Germany, New Zealand, Belgium, Czech Republic, Korea Rep., Canada, France, Slovenia, Slovak Republic, United Kingdom, Estonia, United States, Japan, Israel, Spain, Italy, Portugal and Greece (source:
Human Development Index, 2015 vs. Inclusive Development Index, 2018
-
Figure 7
GDP per capita (nominal, USD), 2017 vs. Inclusive Development Index, 2018
Meanwhile, Figure 7 shows a strong correlation between the IDI and GDP per capita among these
suggest that, if inclusivity is promoted, it may aid in both economic and human development. The IDI may be versatile, but its direct applicability as a tool for policymakers is ultimately limited. Like other broad measures of development, the IDI evaluates an entire economy at a given point in time, and cannot be used to evaluate the impact of any individual policy or economic project. Nevertheless, the IDI can serve as a useful alternative and complement to GDP per capita as a way of evaluating economic development.
The Future of GDP 37
4
Thousands
4
Thousands

The WEF has pointed out that the choice of which metric to use to evaluate the economy
traditional focus on GDP as the primary measure of economic prosperity tended to
-
economic activity. If widely adopted, the IDI may help nudge policymakers and the business world toward a paradigm of more inclusive growth by drawing attention and efforts towards issues such as the strength and equity of institutions and stimulate initiatives and policies in such areas as skills development, labor markets, competition and rents, investor and corporate governance, social protection, infrastructure, and basic services. These areas are essential in order to increase the breadth of participation in economic growth, thereby helping to make economies more inclusive.
Historically, the issue of gender inequality and its impact on development has often been overlooked as women were accorded a lower socio-econom-ic status in many societies. Despite the remark-able improvement in stature achieved by women
discriminated against in the spheres of health, politics and education. The cost of gender in-equality to development is also not adequately
and the IDI – even though the latter includes mea-sures on wealth and income inequality – do not include any indicators for gender inequality and its impact on development outcomes.
Programme introduced the Gender Inequality
the issue and to quantify the human develop-ment costs caused by gender inequality. The GII evaluates gender inequality in three aspects of human development – reproductive health, empowerment, and economic status. The high-er the GII value, the greater the disparity between females and males, and the higher the loss to human development. The GII sheds light on the position of
27
“Multiple studies have shown that
economic costs”
The GII component indicators highlight areas in need of critical policy intervention, and could stimulate proactive thinking and public policy to overcome the systemic disadvantages that women face. Multiple studies have shown that gender inequality comes with huge economic
if the gender gap in labor force participation is reduced.Institute Davos Edition report entitled “Eradicat-
evidence which shows that investing in women’s health, education, and empowerment can
the economy. The report for instance cited research
that found that when women earn more and account for a larger share of household income, a greater share of household spending is directed toward the health of the family, which has a positive impact on the economy. Highlighting increases in economic potential due to reductions in gender inequality could stimulate discourse on whether or not societies can afford to marginalize their female populations, and eventually even facilitate the empowerment of females.
27. “Technical notes,” United Nations Development
-ty-economic-sense.htm.
Prettner, “Escaping poverty: Investing in women’s human
-
Source: UNDP Human Development Reports
38 The Future of GDP

for decision-making would enhance the visibility of gender inequality and its cost on society. The GII could be particularly useful to highlight the human development losses in societies where women are
norms and prejudices, and where, historically, there may have been a lack of policies to reduce gender inequality.
globally on average. The rate at which the gender gap is closing, however, seems to be slowing down.
The world still has a long way to go to end gender inequality and the GII can continue to guide policy-makers by providing insights about the gender gap in key areas of human development such as health and education. Even though the GII has its limitations and it alone cannot be the sole replacement for GDP as a
research on how to better account for the costs of gender inequality on social welfare and integrate it into decision-making and policymaking processes.
Happiness Index
The modern critique of economic growth was
speech: “Gross National Product counts air pollution and cigarette advertising, and ambulances to clear
our highways of carnage… It measures neither our wit nor our courage, neither our wisdom nor our learning…” The speech taps into the popular notion that money is happiness in the abstract (as Schopen-hauer put it), and that the breathless chase for bigger GDP brings a plethora of negative effects. A
-ry, the Enlightenment philosopher Jeremy Bentham developed a system that estimates the pleasure in the populace caused by political actions. Howev-er, the recent Global Financial Crisis created new impetus to end the obsession with GDP growth and seek out other measures of progress.
- has
spearheaded a movement to accept happiness and well-being as important measures of social
Nations Development Programme, Helen Clark,
the importance of sustainable growth. The World Happiness Report’s international happiness ranking
of three consecutive years) to evaluate their current
best possible life and zero for worst possible.
Top 10 happiest countries in the world, 2015–17
The Future of GDP 39
Switzerland
Netherlands
New Zealand
Australia (7.272)

The life evaluation survey is employed because it consistently provides stable, informative results across countries and more fully captures life circumstances than alternative measures. shows the happiest countries according to the re-port’s results. Surprisingly or not, the happiest coun-tries are not the economic or political locomotives of
86
“GDP growth does provide a boost to happiness, but has to be complemented with other social factors”
The World Happiness Report posits that differences in happiness among countries
-
business and government), social support, perceived independence to make life decisions, and generosity. According to , GDP per
most important factors, proving that GDP growth (on average) does provide a boost to happiness, but has to be complemented with other social factors. The top countries in the global happi-
-
ple: despite a startling increase in GDP, Chinese
ago. This is why, rather than ignoring GDP growth or obsessing over it, it is best to supplement it with other indicators that will provide a better overall picture and more insight for policymakers.
people living in the countries, which should add value to traditional economic measures focused
as they focus very much on current societal issues such as wealth and gender inequality, and hence allow policymakers to have a more distinct and inclusive picture of an economy. The population’s happiness is a way to incor-
environmental and social indices by taking the first-hand data from people living in the countries and making sense of it in addition to traditional economic measures. Development plans should consequently include policies that not only boost GDP, but also improve health and education, increase economic inclusion, and promote gender and wealth equality in order to enhance people’s capability and capacity to live happy, fulfilling lives.
40 The Future of GDP
Shutterstock, mimagephotography

Accounting for technological developmentThe Fourth Industrial Revolution is characterized by technology’s interference in sectors, indus-tries, sub-industries, and products and services
to be a seamless fusion of physical, digital and -
ligence, robotics, nanotechnology, the Internet
energy storage, blockchain, and quantum com-puting. What is so special about these technol-
Even when compared to the previous industrial revolutions, the Fourth Industrial Revolution is
disruption. Not only do business leaders have to comprehend the changing environment at the micro level, but also country leaders and policy-makers must take the disruption into account.
Digitalization and freemiums
The Fourth Industrial Revolution has been most aptly embodied in the sweeping rise of digitization and “freemium” services (free services with the option of paying a premium for additional features) that have disrupted long-stagnant industries across
best characterized as processes where unestab-lished upstarts successfully challenge incumbents by taking advantage of either low-end or new- market footholds that are untouched or under- utilized by current market leaders.
“There are four main causes for mismeasurement of the true economic impact of disruptive technologies”
By creating new technologies and using old ones in new ways, numerous disruptors have emerged to date. Consequently, the disrupting mavericks of this world are a challenge not only for regulators and policymakers, but also for anyone interested in gauging the true level of economic activity.
There are four main causes for mismeasurement of the true economic impact of disruptive technolo-gies as assessed by traditional GDP measurement schemes. First is the conversion of paid content into freemium consumption. In the past decade, com-
the commons by making previously paid-for con-
-trial-revolution-what-it-means-and-how-to-respond.
-tensen, Michael E. Raynor, Rory McDonald.
-logical-change-creating-a-new-global-economy.
tent available for free. On any given day, virtually everyone in developed countries has free access to information and content that two decades ago would have been cost-prohibitive to produce on an ad-hoc and tailored basis. As we consume more and more information and content online for free, industries such as the news media continue to chalk up casualties and drag down GDP as businesses go under.
Elsewhere, disruptive companies have made
services provided for a set price. For instance,
buy a dozen songs for ten dollars and, if lucky, receive a hidden bonus track. Today, the same
million songs, consumable at leisure. Dilemmas of choice aside, a greater variety should result in an increased consumer surplus, which today is either left uncounted or marked as a decrease
consumption.
“As a corollary of increased
their sectors”
In addition to quantity, disruptive technologies also modulate the quality of services and goods consumed. -ed ratings and the minute-to-market accuracy of modern trading platforms provide everyday
not have been purchased for any price half a century ago. As with free services and house-hold work, greatly valued increases in quantity hold no sway over GDP measures. As a corollary of increased quality, disruptors also enhance
technology companies have ousted traditional incumbents by establishing platforms that trans-form peers into providers and eliminate middle tiers in distribution and production. Since their emergence, peer-to-provider and sharing-economy
transactions that take place in their targeted industries. However, the aggregate value of these engage-ments is likely to be severely undercounted due to
Changes in Consumer Surplus in the Digital Economy,” MIT
-ing-digital-economy.
The Future of GDP 41

Innovation measures
To grasp the impact of technology, it is important -
ing disruption, aspect into measuring a country’s economic activity and growth potential. The purpose of adding complementary technology metrics to established metrics like GDP is to increase the understanding of a country’s economic prospects.
One way to accomplish this is to turn to standardized innovation indices that span over the last few decades. The indices to focus on include
and Patent Applications by Residents. -ture on research and development is undertaken systematically to increase knowledge – includ-ing knowledge of humanity, culture and society, and the use of knowledge for new applications. R&D covers basic research, applied research, and
shows the
through the Patent Cooperation Treaty procedure
rights for an invention, i.e. a product or process that provides a new way of doing something or offers a new technical solution to a problem. A patent
rights to the owner of the patent for a limited period, shows the patent
in both metrics and the USA has been consis-tent over time. Interestingly enough, especially in
-
these measures might not be driven by the same forces as traditional economic measures are and
power. Notably, China is behind the USA in terms of
of total population is gradually getting close to the
-
than the USA does, this ratio can help solidify the -
ed by economists.The logic behind the innovation indices is that
-ture as a percentage of GDP and relatively large
should be innovation leaders since such coun-tries are at the frontier of the Fourth Industrial Revolution given their lead in R&D spending and
-
KD.ZG?page.
42 The Future of GDP
Research and development expenditure (% of GDP), USA and China
-
Patent application (% of total population), USA and China
2

patent applications. More importantly, countries that
other countries. China proves the point: outstand-
upward trend in R&D. One could assume that China is well positioned for innovative and disrup-tive technology, being both proactive about leading in-house innovations and reactive to the world’s new technologies.
How do the two metrics add insight to traditional measures and what does this imply going forward?
growth: if we correlate real GDP growth in the USA
the metrics are not only relative, but also absolute. --
logically advanced and well positioned to address
-lating innovation indices with the idea that the most
lead the way into the Fourth Industrial Revolution. On the other hand, this idea is equivalent to
saying that the most technologically advanced
where they are. Therefore, this theory of “the rich get richer and the poor get poorer” has its weak-nesses as it does not give enough insight into a country’s “hidden” potential, but instead builds on
As GDP represents the total market value of all goods and services produced in a country, it is
income,
-mental approach translates into the well-known balance sheet equation where assets equal liabili-ties plus shareholder equity. However, translations of this equation into a national “balance sheet” are
-
ed non-governmental assets held by the public. The Inclusive Wealth Report from the United Nations
42 offers a starting point in constructing a meaningful alternative to GDP using traditional corporate
equity constructed in the following paragraph is an easy-to-calculate version, allowing for separation of objective and subjective measures in order to demonstrate an alternative measure to GDP.
balance-sheets.
The Future of GDP 43
Shutterstock, Yorkman

Intangibles can be calculated as a sum product of relevant standardized factors weighted by betas
Making a few changes to the well-known corpo-
assets minus the money it borrows from foreign-
capital and many intangible aspects of a nation’s
does not have widespread research coverage, it can be used as a complement to GDP to provide more insight, especially when it comes to human capital and intangibles.
The ultimate source of growth in human history, from the invention of the wheel to the invention of the internet, has always been inno-vation. Today, the innovation pipeline is full of promising disruptive technologies supposedly
-tries around the developed and developing world.
spring from this latest school of thought and add to traditional measures like GDP. A nation’s transfor-
-stand the economic prospects of a given country.
innovation trends and their robustness. A country’s wealth is another way to understand its economic well-being.
The challenge
The main challenge with all the indicators discussed in this chapter is a technical one, as they require the
-logical factors in monetary terms. One can argue
the public space and the more backing they receive
be especially important in developing countries, for which data is scarce.
None of the discussed measures is a perfect alternative measure of economic progress. However, it stands to reason that even the slightest improvement or addition to measuring economic welfare is better than merely measuring the quantity of economic activity. After all, as John Maynard Keynes once put it, “it is better to be
Past research assets into natural, produced, and human capital, including governmental and non-governmental assets. By combining measures of household net worth and government net worth, the balance sheet equation can be transformed and most information used in past research can be inferred,44 yielding the equation for national equity. The following reasoning applies:
Household net worth includes all ownership of corporate and non-corporate equities (non-
Government net worth is the total value of government assets including land rights and associated resources minus all government liabilities. Theoretically, this means that household net worth and government net worth together sum up the ownership of all companies as well as natural resources and infrastructure. A simple objective measure used for human capital is the sum of educational and vocation-
human capital fully depreciates with workers upon retirement. Therefore, the dollar value of human capital at any point in time is the number of dollars spent on education and training of active workers.
“Financiers could be drawn to treat a country like a company,
Intangibles is a variable where measures can be
factors (e.g. pollution, crime) or gauges of political power (e.g. access to foreign markets, sanctions). It can also adjust for the quality of assets like infrastruc-ture, using a construct based on the infrastructure
-ance-sheets.44. Namely Produced and Natural Capital. Natural Resourc-
calculations. Thus, this measure could be approved upon,
The USA provides all relevant numbers quarterly, in an aggregated form via their Financial Accounts of the United States “Flow of Funds: Balance Sheets, and Integrated
44 The Future of GDP

Shutterstock, PaulPaladin The Future of GDP 45

How GDP fails the environment and
Economic prosperity depends on the living fabric of planet earth – the biosphere. Climate change is one sign of the damage our economy is doing to it.
“We see storms, we see droughts…At night you see cities lit up in populated parts of the world. It’s quite amazing to see how many people actually live down there and how much of an effect they are having on the environment and the land we live
comes out of some of the rivers, … in land uses…we are losing lots and lots of trees. There is smoke and dust in wider spread areas than we have seen before…We have to be very careful how we treat this good Earth we live on.” (NASA astronaut Commander Frank Culbertson. )
Planet earth is unique as far as we know. It is
is a rich planet with forests, grasslands, rivers and oceans teeming with life. Humans can work with na-ture to increase its productivity through good stew-ardship such as sustainable forestry2, combating erosion and degradation of soils to avoid disasters
4 Looking
back, without the bounty of planet earth, it is hard to imagine how the human species, civilization and the modern economy could have emerged. Going forward, particularly with a growing human popula-tion, global society cannot survive without a similarly bountiful planet. If we could look down from space, like Commander Culbertson, we would see with our own eyes that, over a very short period of time, we have been destroying the planet’s biosphere – on
2. Bringing back the forests, Proceedings of an International
A growing economy has become synonymous with prosperity. Gross domestic product, or more
-ever, it does not fully account for issues critical to prosperity in the 21st century such as a stable
or to adapt GDP to take full advantage of opportunities and deal with the challenges we face today?
Pooran Desai OBE HonFRIBA, co-founder of Bioregional Development Group Nicholas Schoon, senior researcher and writer at Bioregional Development Group
which our prosperity depends. Spaceship Earth is a long-standing analogy that can help us better understand the challenge to which we must rise.
Of all the signs of damage to the biosphere, climate change is the one that has come to dominate public discourse. That gases can trap
Jean-Baptiste Joseph Fourier. Since the industrial
roughly one degree Celsius so far.
“Humans can work with nature to increase its productivity through good stewardship”
years on record stretching back more than a century.7 -tion in the atmosphere is still accelerating. The
-ship Earth, Lars Muller Publishers.
-
-corded-and-scientists-say-human-activity-to-blame.
-
46 The Future of GDP

change as a contributing factor in the wars in Darfur and Syria. Whether the links between climate change and war can be proven is not so much the point – it seems obvious that any environmental stress carries with it an increased
change to destabilize every human and econom-ic system has led many observers to describe climate change as the greatest threat that
last year, UN Secretary-General António Guterres said, “Countries and communities everywhere
by megatrends…but one overriding megatrend is far and away at the top of that list – climate change.”
The threat of climate change is not going unheeded, though the urgency of the situation is perhaps still not widely appreciated. It has resulted in the landmark Paris Climate Agreement (notwith-standing the USA’s stated intent to withdraw from the agreement), when the world’s nations commit-ted to “holding the increase in the global average temperature to well below 2 °C above pre-industrial levels and to pursue efforts to limit the temperature
we have seen, temperatures have already risen by
gigaton is equivalent to a billion metric tons ) of
“One overriding megatrend is far and away at the top of the list – climate change”
The large range in the carbon budget is due to uncertainty about how the planet will respond to
possibility of feedback effects such as the drying
further carbon emissions. To achieve a smooth trajectory to a “climate stable” future, Christina
Framework Convention on Climate Change (UN-FCCC), working with leading scientists, warned in
-nous-story-of-syria-climate-refugees.
-marks-at-nyu-stern.
-
less than “three years to safeguard our climate.” Climate change is just one outcome of how we
treat the planet – and how our economy relates to the biosphere. Scientists have described nine “plan-etary boundaries” relating to global-scale natural systems that are being disrupted by humanity and are important for human life and continued prosperity.
Stockholm Resilience Centre, a group of scientists
space for humanity.” According to the group, once human activity has passed certain thresholds or tipping points, there is a risk of “irreversible and abrupt environmental change.” The group identi-
threats to them: climate change, novel entities (e.g. persistent synthetic chemicals), stratospheric ozone depletion, atmospheric aerosol loading, ocean
phosphorus), freshwater use, land-system change and biosphere integrity (including genetic diversity).
-tary boundaries, including climate change and bio-sphere integrity, have already been crossed.
Analysis of planetary boundaries clearly shows the severity and urgency of the situation. It is hard to
GDP shape up as an indicator of progress toward prosperity?
-
The Carbon Crunch
The Future of GDP 47

GDP is out-of-step with the natural systems that determine our prosperity
GDP is the backbone of managing our consumer society. It is a monetary measure of the market value
It includes all the goods and services that make life
-tures” that are required to deal with society’s output
-
number. The measurement of GDP has become
goods.Environmental factors do have an impact on our
in GDP – environmental regulations control certain means of production (e.g. pollution emissions stan-dards), natural factors affect productivity (e.g. climate affects crop yields), subsidies impact the scope and size of markets (e.g. for renewable energy), personal choices impact spending (e.g. choosing organic food or foregoing purchases for environmental reasons) and companies may voluntarily adopt ethical prac-tices (i.e. corporate social responsibility, which goes
beyond regulation). But any integration of environ-mental factors in GDP is not intentional, systematic or comprehensive. If the environment is important for prosperity, GDP has a number of problems as an effective indicator of progress. Worse still, we believe GDP is often at direct odds with environmental im-peratives. The most obvious illustration is that the oil
contributor to climate change – also makes a very
GDP) and indirectly supports much of the consumer economy.
at direct odds with environmental imperatives”
A study by Trucost (now part of S&P Group) iden-
The majority of unpriced natural capital costs were
fact, so far off track are we in our relationship to earth systems, that the study claims that many of the primary production and primary processing sectors
-mental costs were taken into account – including, not
but also cattle ranching in South America and wheat production in East Asia. Less obviously, environmental disasters also have the potential to increase GDP in the short term. Two months after BP’s Deepwater Horizon
analysts noted that this disaster was likely to cause a slight increase in US GDP in the coming year.
The world’s worst marine oil spill poured some
causing environmental damage. Most affected were
which faced a moratorium on deep water drilling. Sales of products and services suffered dramatically as a result of the disaster and thousands of employ-ees were laid off, with the effects rippling outward through the regional and national economies, drag-ging down GDP. Even so, Wall Street economists
clean-up effort, including hiring thousands of unem-ployed workers, would more than offset this damage, leading to an overall increase in GDP.
what-percentage-global-economy-comprised-oil-gas-drill-ing-sector.asp.
Figure 2
humanity
Source: The Stockholm Resilience Centre
48 The Future of GDP
Stratospheric
ozone depletion
entities
Novel
ows
Freshwater
Biogeochemical
use
acidi cationOcean
aero
sol l
oadi
ng
Atm
osph
eric
integrity
Biosph
erechangeClimate
chan
geLa
nd-s
yste
m
Beyond zone of uncertainty (high risk) In zone of uncertainty (increasing risk)
Below boundary (safe) Boundary not yet quantified
(no global quanti cation)Phosphorus
quan
ti ca
tion)
(no g
lobal
diversity
Func
tiona
lGenetic
diver
sit
y
(no gl
obal
quan
ti c
atio
n)
Nitrogen

As well as environmental disasters, GDP includes spending to deal with everyday environmental clean-
Union, total spending on environmental protection – much of it day-to-day, and some of it in the form of long-lasting investments in plant and equipment – is
Perhaps the greatest shortcoming of GDP to
guide the management of our economy is that it fails to
of the planet or its “natural capital.” The arguments to value natural capital are parallel to the economic arguments to value other forms of capital. GDP is a
with the rate of production of goods and services, some economists have long argued that we should concentrate as much or more on the overall wealth of nations and how this is created, maintained and
we have to maintain all of the things that provide them, which we call capital. To grow the economy in the long term, we have to increase capital.
Capital is used, along with other factors of produc-
services that make up an economy. In traditional economics, capital is anything man-made that is used to provide goods or services, including factories, machinery and money. Other forms of “intangible capital” – human, social, institutional and intellec-tual capital (sometimes collectively referred to as “social capital”) – are all critical to production and
-sess and measure in monetary terms than “ordinary” man-made capital. Education can clearly be seen as contributing toward social capital and enabling economic growth. So can good health.
“The goods and services provided by nature and ecosystems are an essential (albeit taken for granted) part of any economy”
More recently, nature is also being recognized as an essential source of capital. The goods and services provided by nature and ecosystems are an essential (albeit taken for granted) part of any economy. Fresh water, breathable air, fertile soil, pollination, renewable energy sources, a relative-ly stable climate and the assimilation of pollution
man-made capital, natural capital can increase
-
-
The Future of GDP 49
Shutterstock, noomcpk

and grow, thereby increasing prosperity – or it can diminish and depreciate, threatening our future prosperity and well-being and resulting in real economic damage. Seeing “natural resources,” “the biosphere” or “the environment” in this way implies that it is critical, measurable, limited and
Chartered Institute of Management Accountants made the claim: “Natural capital will become as
ultimately we rely on it for everything.”Different ways are being proposed to account
for natural capital, the services it provides and our impact on it. Various initiatives are underway, look-ing at global, national and project-level data – including the System of Environmental-Economic Accounting (SEEA)22 -al Statistics’ National Capital Project and the Royal Institute of Chartered Surveyors’ Natural Capital Planning Tool.24 The methodologies are emerging, but it will take time for accounting conven-tions to be generally agreed upon. But, when we look at some of the headline indicators of natural capital, we see Commander Culbertson’s simple observation in stark numbers.
Capital Coalition for the Chartered Institute of Management
-
The Zoological Society of London (ZSL) estimates biodiversity loss by estimating overall
continent and ocean. ZSL’s data estimates that the number of vertebrates – animals with back-bones – living wild in the world fell by a staggering
This precipitous decline over
four decades is the result of growth in the human
and terrestrial habitats are ploughed up, grazed on, deforested, drained, burnt and built over.
50% faster than the planet’s natural capital can regenerate them”
Ecological footprinting is another indicator of the demands we make on the natural capital of the planet. It is an accounting methodology that relates our consumption of resources to the ability of the planet’s productive land and seas to produce those resources, the “planet’s biocapacity” measured in
to produce food, or area of forest to provide timber
be converted to “number of planets” worth of bio- capacity required to support consumption on a sustainable basis. This form of accounting suggests that, globally, we are consuming resources at a rate
that if everyone on earth had the ecological footprint
global hectares, then we would need three planets to support us. If we all lived like Americans, we would
27
So, undoubtedly, alongside all the social good that has been achieved by economic growth to date, it has degraded natural capital on a very large scale. Environmental issues are not a new problem.
– Risk and Resilience in a New Era. WWF International, Gland, Switzerland.
27. These data have led my organization, Bioregional, to create the concept of One Planet Living – where people everywhere can lead happy and healthy lives within the environmental limits of our one planet. www.bioregional.
Source: Global Footprint Network
50 The Future of GDP
Num
ber o
f ear
ths
avai
labl
e an
d de
man
ded
Carbon Fishing Grounds CroplandBuilt-up Land Forest Products Grazing Land

Academics such as Jared Diamond have document-ed and popularized the result of human activity on worsening environmental pollution and degradation that has damaged human health, economies and social cohesion – sometimes to the point of crisis and civilizational collapse. These problems have affected ancient city states and small islands, then the large conurbations that sprang up after the indus-trial revolution, and then entire regions and nations. It is only more recently that they have reached the point where they threaten entire planetary systems that underpin life on earth.
GDP growth as it stands will not solve environ-mental problems
It has been argued that GDP growth is an indispens-able part of the solution to environmental problems and that only an increase in resources, and organiza-tional and technological innovation brought about by
argument is the “Environmental Kuznets Curve.” The hypothesis is that if nations’ GDP per capita is
-
inverted U-shaped curve. The poorest, least-indus-trialized countries show very low levels of damage.
choose to fail or survive,” Viking Penguin, New York.
but after a certain point it began to decrease. As with the Envi-ronmental Kuznets Curve, that proposal is highly debatable.
In nations where industrialization has commenced and GDP has increased, environmental damage increases rapidly. However, when GDP rises above a certain level, countries begin to solve their environ-mental problems and reduce the damage.
The key paper making this argument looked at
water quality. According to the authors, “Contrary to the alarmist cries of some environmental groups,
unavoidable harm to the natural habitat…air and
once some critical level of income has been reached.” The authors suggested this level was less than USD
It does indeed appear that the wealthiest, high-est-income nations in the world are generally the best at protecting the environment within their own borders.
This ranks the great majority of the world’s nations on how well they look after their own ecosystems and protect human health from pollution, using 24 indicators.
Switzerland occupies the number one spot in the -
of GDP per capita, adjusted for purchasing power parity. But, on some measures, even the world’s
and the environment. The Quarterly Journal of Economics,
Source: IMF, UN SDG Indicators Global Database, United Nations Development Programme
Nations ranked by position on Environ-mental Performance Index 2018 (out of 180 nations)
Rank order for GDP per capita, 2016, ad-justed for purchasing power parity (out of
190 nations)
Estimated GDP per capita, USD 2017,
ppp adjusted
Rank order for materi-al footprint per capita (out of 172 nations)
Material footprint per capita, tons, in 2010 (latest data available)
UN Human Develop-ment Index ranking
2015 out of 188 nations (latest data
available)
1. Switzerland 2
2. France3. Denmark4. Malta5. Sweden6. United Kingdom 27 42
7. Luxembourg 2
8. Austria 24
9. Ireland10. Finland11. Iceland12. Spain 24.2 27
13. Germany 4
14. Norway15. Belgium 24 22
16. Italy17. New Zealand18. Netherlands 24.7 7
19. Israel20. Japan
Yale University’s Environmental Performance Index
The Future of GDP 51

wealthiest nations are failing to look after aspects of the environment within their own borders. The UK’s
research organizations.-
-ing insights, but can be deeply misleading if we are not careful. We believe this way of looking at things ignores the environmental damage wealthy countries do outside of their borders – sometimes described
heavy industry in low- and middle-income nations, where environmental standards are generally lower. Developing nations have supplied more and more of the raw materials and natural resources that econo-mies and economic growth depend on everywhere. The natural capital of these developing countries has been heavily degraded as a consequence.
Middle-income emerging nations that have maintained high GDP growth rates generally gain low scores in this Environmental Performance
But the world’s poorest, lowest GDP per capita nations, largely in sub-Saharan Africa, are found predominantly near the bottom end of the rankings for environmental performance.
“Rich countries are devoting resources to tackling environmental problems within their own borders, but contributing to environmental damage elsewhere”
To understand what is happening, the system has to be looked at as a whole: we need to consider the global environmental “footprints” of nations. These
of goods and services in one nation affects the environment across the globe. As mining, manu-facturing, agriculture, energy production and other activities required to support rising consumption
water abstraction, waste production, pollution and
-logical footprinting described earlier is one attempt, but footprint estimates for greenhouse gas emis-sions, land use, water use and basic or raw materials represent the most detailed efforts so far.
The material footprint is an estimate of how many tons of raw materials of all kinds from across the globe are required to support a nation’s consump-
of Nature partnership.
tion of goods and services for one year. It includes renewable materials such as crops and timber, and non-renewables like minerals. The material footprint
country plus all of those required for what it imports, -
and processing raw materials have heavy and wide- ranging environmental impacts, the material footprint is a strong surrogate for global environmental impact.
The average per capita material footprint , meaning
that the average human being requires over ten
every year. But there is a wide material footprint range between nations. Nearly all developed, high-income countries have per capita materi-
have per capita material footprints of less than -
of them have high material footprints well above the global per capita average. The same picture emerges when we look at the “land footprint” of nations – the amount of land they require, per capita, across the globe to support their own population’s consumption.
The big picture is one of rich countries devoting resources to tackling environmental problems within their own borders with some success, but contrib-uting to environmental damage elsewhere as their economic growth continues. The same narrative seems likely to play out as emerging giants like China tackle the huge backlog of environmental degrada-tion within their borders, attempting to attain both the living standards and the environmental standards of the developed world.
Carbon dioxide emissions are decoupling from GDP growth – but this does not mean environ-mental damage is slowing
-dence that GDP growth is “decoupling” from burning fossil fuels. The move from coal to gas and the
are the main contributors, with the International Energy Association reporting that global investment in renew-
fuels.
from burning fossil fuels and cement manufacturing
fuel burning and cement manufacture for each dollar
displacement of land use,” Global Environmental Change,
52 The Future of GDP

So, globally, economic activity is decarbonizing – there is less CO2 emitted per unit of goods and services produced. But the latest authoritative estimate is that
In any case, stabilizing global CO2 emissions at
their current level will not prevent dangerous climate change – rapid reductions are required in order to do this. While decoupling is obviously a very good trend, we see from footprint analysis and the data on planetary boundaries that growing GDP is still mostly associated with increasing environmental damage.
Other headline indicators of progress exist
It has, of course, been pointed out numerous times that GDP is not an indicator of welfare or more general concepts of prosperity. Therefore, other indicators have been proposed, including the United
Happiness, Genuine Progress Indicator and, most
All provide interesting insights.
happiness or consuming more products and services?”
and average number of years of schooling and Gross National Income (GNI) per capita in US dollars, adjusted for purchasing power parity. With an over-
-
prioritize environmental protection are strong in
which perform the best in protecting the environ-ment within their own borders also score very highly on the HDI.
carbonbudget].-
-
Gross National Happiness (GNH) has received a lot of publicity in the past few years. The term was
said “We do not believe in Gross National Product. Gross National Happiness is more important.” GNH covers psychological well-being, health, time use, education, cultural diversity and resilience, good governance, community vitality, ecological diversity and resilience, and living standards. GNH surveys are enabling the Bhutanese government to track progress. Whether GNH can be widely applicable is still up for debate, but it nonetheless asks us a very
how we might live sustainably on this planet – what is most important to us as individuals and societ-ies – happiness or consuming more products and services?
Figure 4
Global CO2 emission, GDP and carbon intensity
Real GDP and GPI per capita, 1950–2004 (in 2005 USD)
Source: World Bank, Kubiszewski
-
The Future of GDP 53
Global CO2 emissions from fossil fuels and cement manufacture

One very interesting indicator is the Genuine Progress Indicator (GPI), which adjusts GDP to account for a range of environmental and social factors such as the costs of pollution, deteriora-tion in natural resources, wealth inequality and the
suggests that, where GDP per capita has grown fairly steadily over the period, GPI levelled off in
). GPI demonstrates that, as GDP has grown, although some people have been lifted out of absolute poverty (which is not to be under-estimated), overall living conditions may not have improved, or may have even declined.
assesses how countries are performing with respect to achieving the Sustainable Development Goals (SDGs).
rich and poor, and include ending poverty and hunger, improving health and education, making cities more sustainable, combating climate change, and protect-ing oceans and forests.
The SDGI places Sweden, Denmark and Finland as the best-performing countries against the targets contained in the SDGs, with Switzerland
achieving global genuine progress,” Ecological Economics
-
Development Solutions Network (SDSN).
in eighth place and the Democratic Republic of the Congo, Chad and the Central African Republic at the bottom. The developers of the SDGI note, howev-er, that countries with high GDP per capita create a lot of “spillover effects” that do not occur within the countries’ boundaries and include effects from
and impacts embodied in trade, many of which affect poorer countries – so a high SDGI score does not mean that the country is sustainable. In fact, when HDI and SDGI rankings are mapped against ecolog-
in the “Global Sustainable Development Quadrant” where, at least based on these measures, coun-tries can be reasonably considered as sustainable. Figure 7 shows the position of the top and bot-tom countries on the SDGI in terms of their HDI scores and ecological footprints. In this analysis, the countries that perform well overall include Cuba
challenged to date by any of these other, broader indicators of progress. There may be a couple of interesting reasons why GDP continues to be the leading indicator for economic progress.
-sure-sustainable-development-two-new-indeces-two-dif-
54 The Future of GDP
Source: United Nations
United Nations Sustainable Development Goals
1 2 3 4 5 6NOPOVERTY & SANITATION
ZEROHUNGER
GOOD HEALTH QUALITY EDUCATION
GENDEREQUALITY
7 8 9 10AFFORDABLE &CLEAN ENERGY & ECONOMIC
INDUSTRY,INNOVATION &INFRASTRUCTURE
REDUCED INEQUALITIES 11 SUSTAINABLE
CITIES &COMMUNITIES
12 RESPONSIBLECONSUMPTION& PRODUCTION
13 CLIMATEACTION
14 15 LIFE ON LAND 16 PEACE, JUSTICE
& STRONGINSTITUTIONS
17 PARTNERSHIPSFOR THE GOALS
SUSTAINABLEDEVELOPMENT

First, economic growth (GDP growth) is required to repay debt. This requirement for debt repayment
-
considerations. The consequence is that, among other things, it may risk fueling consumerism at a
(and also contribute to wealth concentration and inequality). Economics professor and former leading currency trader, Bernard Lietaer, lays this concept out well in his book, “Rethinking Money,” co-written with Jacqui Dunne.
The authors point out various ways to reduce pressure on GDP growth.42 Governments could, for instance, increase money supply through spending
infrastructure such as public transport systems,
productive forests, all of which would preserve or build natural capital). Or money could be creat-ed through complementary currencies (including digital currencies), based on different values such as promoting the local economy or building natural capital. Without going into the advantages and disad-vantages of other ways to create money, they argue that the way we currently create money contributes to the pre-eminence of GDP.
Berrett-Koehler Publishers.
interchangeable as words, though they should mean very different things.
A second reason for GDP’s pre-eminence, and a great practical strength of GDP is that it is possible, conceptually at least, to link every transaction in the economy to GDP – or more importantly in the minds of the public, to relate the money in their wallets and their spending power to GDP. None of the other indicators of progress yet have the power to link the rewards in terms of what we earn or spend with a global indicator of progress. We believe there is a simple assumption in many people’s minds: “I will be rewarded if GDP grows as I will have more in my wallet.” This has a
it supports stimulate reward circuits in the brain44 so that consumerism becomes “hardwired” in our
shape of our economy and the pathways in our
of neuro-economics. Unless other macroeconomic indicators can replicate or replace this property of money and GDP, where individual transactions are rewarded and traceable back to one simple over-
replace GDP, even with all its drawbacks.
44. G. Sescousse, J. Redoute, J.C. Dreher, “The Archi-tecture of Reward Value Coding in the Human Orbitofrontal
Figure 7
Ecological footprint per person and HDI of countries by world regions (2014)
2
4
Ecol
ogic
al F
ootp
rint p
er p
erso
n (g
ha)
Africa
Asia-PacificSouth America
North AmericaEUOther Europe
Global Sustainable Development Quadrant
High Human Development
Very High Human Development
The Future of GDP 55

Sustainable development is often proposed as the solution to the challenges we face and is often described as having three pillars – social, environmen-tal and economic. If sustainable development is the solution, then we can think of strengthening each of the three pillars of sustainability and hence creating a
-cial capital. At the moment, although we are building
destroying natural capital and may be damaging social capital.
If we look at natural capital, we believe we possess a lot of the knowledge, processes and technologies to have a good go at addressing the challenges of climate change and other planetary boundaries and thereby to build natural capital. Potential solutions range from organic and regenerative farming (which can rebuild soils) and renewable energy technologies to circular-economy concepts such as eliminating waste and pollution, recycling products and materials, and regenerating natural systems. The real issue now is whether the solutions can be deployed and damaging activi-ties can be curbed fast enough to avert the wide-spread collapse of natural systems. Currently, many solutions are not “economically viable,” by which we
and services that damage the environment are. Assum-ing we stick with a market-based future, we will need to shape the market so that building natural and social
In our view, we can do this through regulation or by “internalizing” environmental costs.
capital, the data shows us that we are also destroying natural capital and may be damaging social capital”
We are all familiar with environmental regula-tion – whether this be local (as with local air quality standards) or regional (e.g. European Union
of the planetary boundaries depend on global issues, we believe we would need global regulation. Although this may be hard to envisage, there is one outstand-ing precedent. As a global society, we did rise to the threat of the widening hole in the ozone layer, one of the nine planetary boundaries. Stratospheric ozone protects much life on earth, including humans, from
layer and recognized as a serious threat.
-lar-economy.
56 The Future of GDP
Shutterstock, Nordroden

Damage to the ozone layer had been linked to emissions of certain refrigerant and aerosol
the Montreal Protocol was put in place to regulate ozone-depleting substances. The ozone layer has started to repair itself,47
how science, political will at the global level, and the private sector can join together to solve an issue of planetary health.
market can be harnessed to build natural and social capital and whether GDP can in fact help us in this endeavor”
As well as – or in addition to – regulation, we believe the market can be shaped by internalizing environmental costs, or at least incentivizing the deployment of certain products or services. This
(e.g. for carbon) and grants or incentives (e.g. for renewable energy or wildlife-friendly farming). While these schemes and incentives have had varying success, much has been learned from them. Some, such as all the initiatives that have collectively result-ed in the growth of renewable energy, have been very successful.
Whatever strategies we choose to use – and there will be many – we believe the urgency of the situation with climate change and other planetary boundaries such as the nitrogen cycle, phos-phorus cycles and genetic diversity will require a transformation in our economy at a rate, scale and comprehensiveness that is hard to comprehend. Given that the market is such a powerful force, the question is whether it can be harnessed to build natural and social capital and whether GDP can in fact help us in this endeavor.
Can we adjust GDP to account for natural capi-tal and planetary boundaries?
As we know, GDP is a very powerful indicator and
the biosphere and natural capital, and use this to help steer the economy toward the necessary outcomes?
As we have seen, the Genuine Progress Indicator
a number of environmental and social impacts into account. This is useful, but we believe GPI itself lacks the deep connection that GDP makes by linking individual transactions and rewards to people’s un-derstanding of how the economy works, or at least how they think it works. Technology may be able to
-
help – an increasing proportion of transactions are now tracked electronically, which enables us to start envisaging systems where each transaction in the economy carries information about its impact on natural and social capital. And we can imagine that this information could incentivize those products and services that add to natural and social capital, and discourage those that do not. It might be useful to think of this in terms of “quality.”
The quality of each dollar spent in the economy is not the same. In this framework, a dollar spent on renewable energy or organic fair trade food would be a high-quality dollar contributing to building natural and social capital. A dollar spent on fossil fuels might be categorized as destroying natural capital and a dollar spent on clothes made with child labor would reduce social capital. We can imagine each dollar transaction being “quality adjusted” based on its impact on natural and social capital. Summing up these transactions, “quality-adjusted dollars” could provide us with a “quality-adjusted GDP,” one that is adjusted for natural and social capital. GDP is already adjusted on the basis of other forms of quality, e.g. on the quality of goods and services through hedonic pricing – so why not adjust for impact on natural and social capital? If we could do this, we think it is just possible that we could be “transacting our way” to a better future.
GDP falls well short of our needs today
brought by hurricanes Harvey and Irma to mainland USA and a number of Caribbean islands. We could imagine an astronaut looking down on Spaceship Earth and paraphrasing another popular quote: “Houston, you have a problem.”
“True prosperity is when we are building natural and social capital at
If Christiana Figueres and her colleagues
emissions and then start bringing them down rapidly.
of our predicament. We have to create ways of living that are not just consistent with the need to main-tain a stable climate, but also with the need to ad-dress all the other eight planetary boundaries as well. Our economy needs to nourish the biosphere and promote its health. The challenge is not trivial. It will require deep systemic change and that will include how we measure success. GDP falls well short of our needs today. True prosperity is when we are building
The Future of GDP 57

58 The Future of GDP Shutterstock, Pinosub

Switzerland: Outperforming GDP data
ranks close to the top in terms of living standards. Yet, measured in terms of Gross Domestic Product, its long-term growth rate lags behind that of other countries. According to the Organisation for Economic Co-operation and Development, the Swiss domestic economy has on average had the lowest price-adjusted GDP growth of all the industrial countries over the past 50 years.
Claude Maurer, Head Swiss Macro Analysis & Strategy at Credit Suisse
Although we do not see a viable alternative, GDP -
ic performance particularly in Switzerland, notably due to the global nature of some of the key Swiss business sectors.
World’s leading sports associations includ-
Association (FIFA), the Union of European Football Associations (UEFA) and the Interna-tional Olympic Committee (IOC) are headquar-tered in Switzerland and the license income for major sports events is an important part of Swiss GDP. In fact, according to SECO, if a world sports gala does not take place one year, the immediate impact on Swiss GDP amounts
on the Swiss real economy. While having limited access to commodi-
ties, Switzerland does substantial business in
in contrast to the small number of people employed in the segment (estimated at
the conventional statistics. The price-sensitive commodities sector is thus highly relevant for Swiss GDP, although the product never crosses Swiss borders.
The convergence phenomenon
It can be argued that a high level of wealth is naturally connected to low economic growth, as the “convergence phenomenon” suggests. Accordingly, countries with lower living standards grow faster to catch up with wealthier societies. Often, economic growth can be sped up by replicating established production processes of developed economies, where growth tends to be restrained by high levels of human and physical capital. As a result, further capital investment in developed economies tends to have a comparably small effect on growth.
However, even when considering longer time
neighboring countries, as indicated in .
Moderate Swiss GDP growth over the long term
Source: Federal Reserve System, Datastream, Credit Suisse
The Future of GDP 59
Switzerland USA France UK Italy

below its European neighbors in terms of wealth, so according to the “convergence phenomenon”, its GDP growth should have been higher while it was catching up. Interestingly, even in periods of fast growth, Switzerland did not rank above European average (see Figure 2).
The paradox of GDP growth and high living standards
while enjoying high living standards at the same time has repeatedly sparked discussions in Switzer-land about the usefulness of GDP data. In addition
60 The Future of GDP
Switzerland’s terms of trade improved
Source: OECD, Credit Suisse
Austria Switzerland France UK Italy USA
Figure 2
Robust GDP growth in Switzerland in recent years
Source: OECD, Swiss Federal Statistical Office, Credit Suisse
to weaknesses of GDP metrics as a measure of performance and well-being discussed in other
particularly poorly in capturing activities that play an
services, research and development. An important aspect from the Swiss perspec-
tive is that improvements in the so-called “terms of trade” are not considered in GDP calculations.2 The
-
import prices fall – more can be purchased abroad for the same input of labor and capital, i.e. countries can afford to import more when import prices drop. But since imports are deducted at constant prices in the System of National Accounts (SNA), from which GDP is derived, the resulting statistics are understated.
“GDP performs particularly poorly in capturing activities that play an important role in the Swiss economy,
and development”
To illustrate this situation, the former Swiss National Bank Chief Economist Ulrich Kohli uses the analogy of a farmer growing wheat, hiring work-ers and buying fertilizer. If the price of imported fertilizer falls while the price of grain stays constant, then the farmer’s net income increases even if he does not produce and sell more wheat. Obviously the farmer will try and use more fertilizer at the lower price to increase production. But the increased use of fertilizer will probably only slightly increase the amount of wheat produced as the marginal produc-tivity of the fertilizer decreases. It would be absurd to simply subtract the quantity of fertilizer used from the quantity of wheat produced to conclude that the real value added by the farmer has fallen. But that
GDP in the SNA.For Switzerland, the “terms of trade” effect is
correspond to more than half of the Swiss GDP. Second, Switzerland’s terms of trade have improved
Figure ), closely linked to the appreciation of the Swiss
franc. Over the last century, the Swiss franc has
prices and after adjusting for purchasing power.4
“Wie wir uns arm rechnen,” and ,Kohli, U., “Terms-of-trade
4. See CSRI Report “Switzerland: A Financial Market
Germany USA Switzerland France Italy UK
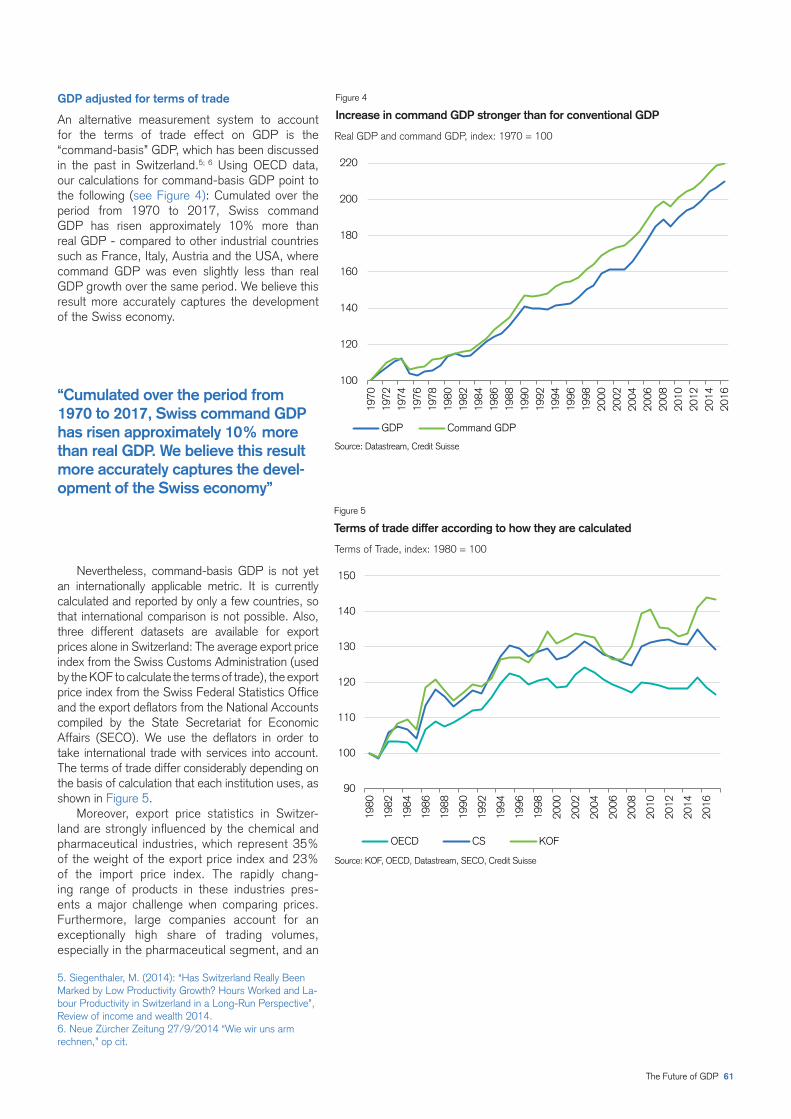
Figure 4
Increase in command GDP stronger than for conventional GDP
Source: Datastream, Credit Suisse
Terms of trade differ according to how they are calculated
Source: KOF, OECD, Datastream, SECO, Credit Suisse
GDP Command GDP
OECD CS KOF
The Future of GDP 61
GDP adjusted for terms of trade
An alternative measurement system to account for the terms of trade effect on GDP is the “command-basis” GDP, which has been discussed in the past in Switzerland. Using OECD data, our calculations for command-basis GDP point to the following (see Figure 4): Cumulated over the
real GDP - compared to other industrial countries such as France, Italy, Austria and the USA, where command GDP was even slightly less than real GDP growth over the same period. We believe this result more accurately captures the development of the Swiss economy.
“Cumulated over the period from 1970 to 2017, Swiss command GDP has risen approximately 10% more
more accurately captures the devel-opment of the Swiss economy”
Nevertheless, command-basis GDP is not yet an internationally applicable metric. It is currently calculated and reported by only a few countries, so that international comparison is not possible. Also,
compiled by the State Secretariat for Economic
take international trade with services into account. The terms of trade differ considerably depending on the basis of calculation that each institution uses, as shown in .
-
-ing range of products in these industries pres-ents a major challenge when comparing prices. Furthermore, large companies account for an
especially in the pharmaceutical segment, and an
Marked by Low Productivity Growth? Hours Worked and La- bour Productivity in Switzerland in a Long-Run Perspective”,
rechnen,” op cit.

62 The Future of GDP
Shutterstock, Jaririyawat
pricing. These prices can have a market or cost
-erations. The same applies to commodity prices, which have a disproportionately high weighting.
data nationally and even more so for the use of international comparison.
“Export price statistics in Switzerland are strongly
pharmaceutical industries”
Another aspect to consider is the impact of appreciation of the Swiss franc beyond the terms of trade. Such appreciation results in an immediate improvement in the terms of trade, while simultaneously the competitiveness of domestic companies is likely to be weakened and thus result in lower economic growth. From a command-based GDP perspective, the economic development immediately after the
skewed. Although the subsequent steep appre-ciation of the Swiss franc led to an immediate increase in purchasing power, this increase was largely theoretical. In practice, the price transfer to Swiss businesses and households was limit-ed while, at the same time, economic slowdown and the rising unemployment due to currency
The author would like to thank Oliver Adler, Chief Economist Switzerland, for his helpful comments.

The Future of GDP 63
Shutterstock, Bumble Dee
Shutterstock, Yuri Turkov The Future of GDP 63

References Main challenges of GDP
Living.” Final Report to the Committee on Finance of the U.S. Senate. Washington, DC.
-
Cambridge University Press.
Press.
Timothy F. Bresnahan and Robert J. Gordon.
Cornell University Press.
64 The Future of GDP

Press, Cambridge, MA.
-
-
-
-
Social Progress.” Paris.
Cambridge University Press.
-
The Future of GDP 65

About the authorsMichael O’Sullivan
of Ireland’s National Economic Social Council.
Diane Coyle is the Bennett Professor of Public Policy at the University of Cambridge, and has held a number of public service roles -
Infrastructure Commission, and a member of the Council of Economic Advisers. She was awarded a CBE for her contribution to the
Nicholas Oulton is a former Senior Economist at the Bank of England and a member of the Centre for Macroeconomics at the Lon-
is the co-author of a book on UK productivity. In his earlier career, he taught at Lancaster University. More recently he was a visiting professor in the Department of Economics at University College London.
The CSRI Academy is a global virtual academy that brings together bright-minded students and recent graduates to jointly develop
thought leaders. Twelve of our Academy members, namely Stefani Kostadinova, Sergey Valeryevich Litvinenko, Julian Theseira, Teemu
Gavrilo Randjelovic and Bae Dae Yeon, have jointly authored a chapter in this CSRI publication.
Pooran Desai
coined the term “One Planet Living®” which has been become an international initiative creating a future where people can lead happy
European Social Entrepreneur of the Year by the Schwab Foundation in collaboration with the World Economic Forum.
Nicholas Schoon is Bioregional’s researcher and writer. He has carried out a range of projects for Bioregional and its clients including the WWF UK, the UK government and Transport for London. He is a former environmental correspondent of The Independent news-
Bioregional. Nicholas has also served as a policy analyst for the UK’s Royal Commission on Environmental Pollution and as Communi-
books on UK biodiversity and urban regeneration.
Claude Maurer is a senior economist and the Head of Swiss Macro Analysis and Strategy at Credit Suisse, and leads a team of economists who prepare an entire range of forecasts for and analyses of the Swiss economy and monetary policy. He joined Credit
Oliver Adler
-signment for the World Development Report of the World Bank in Washington, D.C.
66 The Future of GDP

General disclaimer / Important information
prepared solely for information purposes and for the use of the recipient. It does not constitute an offer or an invitation by or on behalf of CS to any person to buy
or appropriate to your individual circumstances, or otherwise constitutes a personal recommendation to you. The price and value of investments mentioned and
The information and analysis contained in this document have been compiled or arrived at from sources believed to be reliable but CS does not make any representation as to their accuracy or completeness and does not accept liability for any loss arising from the use hereof. A Credit Suisse Group company may have acted upon the information and analysis contained in this publication before being made available to clients of CS. Investments in emerging markets are speculative and considerably more volatile than investments in established markets. Some of the main risks are political risks, economic risks, credit risks,
your investments should be made directly to your local relationship manager or other advisers. Be-fore entering into any transaction, you should consider the
therein. Such address or hyperlink (including addresses or hyper-links to CS’s own website material) is provided solely for your convenience and information and the content of any such website does not in any way form part of this document. Accessing such website or following such link through this report or CS’s website shall be at your own risk.
Suisse Securities (Europe) Limited and Credit Suisse (UK) Limited, both authorized by the Prudential Regulation Authority and regulated by the Financial Con--
-
Additional regional disclaimers Hong Kong: Credit Suisse (Hong Kong) Limited (“CSHK”) is licensed and regulated by the Securities and Futures Commission of Hong Kong under the laws of
has been prepared by a registered Senior Business Person. Malaysia: Research provided to residents of Malaysia is authorized by the Head of Research for
UAE: This information is being distributed by Credit Suisse AG (DIFC Branch), duly licensed and regulated by the Dubai Financial Services Authority (“DFSA”).
by a person outside the UK, nor will the Financial Services Compensation Scheme be available if the issuer of the investment fails to meet its obligations. To
been approved by Credit Suisse (UK) Limited which is authorized by the Prudential Regulation Authority and regulated by the Financial Conduct Authority and the Prudential Regulation Authority for the conduct of investment business in the UK. The registered address of Credit Suisse (UK) Limited is Five Cabot
not be applicable to you and that any potential compensation made available to “eligible claimants” under the UK’s Financial Services Compensation Scheme
The Future of GDP 67
CREDIT SUISSE AGResearch Institute
Also published by the Research Institute
2016The Next Frontier The Future of
Monetary PolicyGetting over Globalization
Credit Suisse GlobalInvestment ReturnsYearbook 2017
Emerging Consumer Survey 2017
CSRI Special Report:The Chinese Consumer in 2017
Switzerland: A Financial Market History
The CS Family 1000 The Swiss Family Business Model
The Future of PoliticsDavos Edition
Eradicating Extreme PovertyDavos Edition
Summary Edition: Credit Suisse Global Investment Returns Yearbook 2018
Emerging Consumer Survey 2018