Embed Size (px)
Citation preview
CSR RESULTS
2015
02
SAINT-GOBAIN – CSR RESULTS 2015
1. CSR results
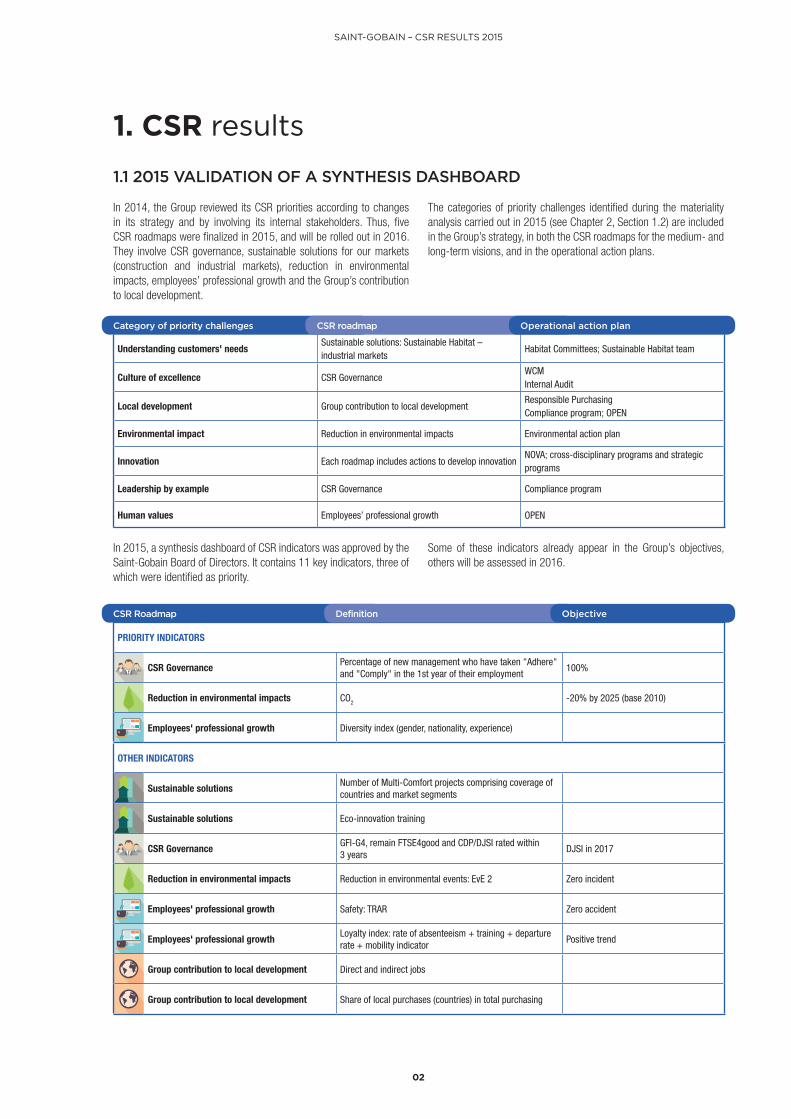
1.1 2015 VALIDATION OF A SYNTHESIS DASHBOARD
In 2014, the Group reviewed its CSR priorities according to changes in its strategy and by involving its internal stakeholders. Thus, five CSR roadmaps were finalized in 2015, and will be rolled out in 2016. They involve CSR governance, sustainable solutions for our markets (construction and industrial markets), reduction in environmental impacts, employees’ professional growth and the Group’s contribution to local development.
The categories of priority challenges identified during the materiality analysis carried out in 2015 (see Chapter 2, Section 1.2) are included in the Group’s strategy, in both the CSR roadmaps for the medium- and long-term visions, and in the operational action plans.
Understanding customers' needsSustainable solutions: Sustainable Habitat – industrial markets
Habitat Committees; Sustainable Habitat team
Culture of excellence CSR GovernanceWCMInternal Audit
Local development Group contribution to local developmentResponsible PurchasingCompliance program; OPEN
Environmental impact Reduction in environmental impacts Environmental action plan
Innovation Each roadmap includes actions to develop innovation NOVA; cross-disciplinary programs and strategic programs
Leadership by example CSR Governance Compliance program
Human values Employees’ professional growth OPEN
Category of priority challenges CSR roadmap Operational action plan
PRIORITY INDICATORS
CSR GovernancePercentage of new management who have taken "Adhere" and "Comply" in the 1st year of their employment
100%
Reduction in environmental impacts CO2 -20% by 2025 (base 2010)
Employees' professional growth Diversity index (gender, nationality, experience)
OTHER INDICATORS
Sustainable solutionsNumber of Multi-Comfort projects comprising coverage of countries and market segments
Sustainable solutions Eco-innovation training
CSR GovernanceGFI-G4, remain FTSE4good and CDP/DJSI rated within 3 years
DJSI in 2017
Reduction in environmental impacts Reduction in environmental events: EvE 2 Zero incident
Employees' professional growth Safety: TRAR Zero accident
Employees' professional growthLoyalty index: rate of absenteeism + training + departure rate + mobility indicator
Positive trend
Group contribution to local development Direct and indirect jobs
Group contribution to local development Share of local purchases (countries) in total purchasing
CSR Roadmap Definition Objective
In 2015, a synthesis dashboard of CSR indicators was approved by the Saint-Gobain Board of Directors. It contains 11 key indicators, three of which were identified as priority.
Some of these indicators already appear in the Group’s objectives, others will be assessed in 2016.
03
SAINT-GOBAIN – CSR RESULTS 2015
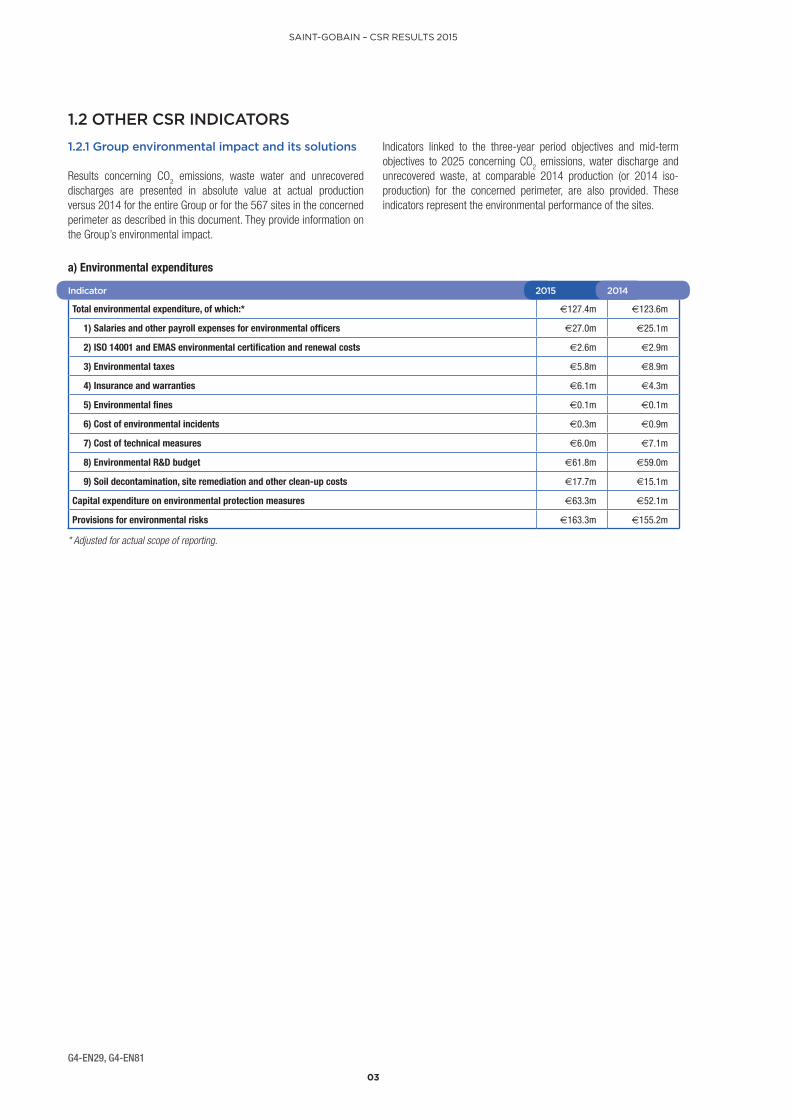
1.2 OTHER CSR INDICATORS
1.2.1 Group environmental impact and its solutions
Results concerning CO2 emissions, waste water and unrecovered
discharges are presented in absolute value at actual production versus 2014 for the entire Group or for the 567 sites in the concerned perimeter as described in this document. They provide information on the Group’s environmental impact.
Indicators linked to the three-year period objectives and mid-term objectives to 2025 concerning CO
2 emissions, water discharge and
unrecovered waste, at comparable 2014 production (or 2014 iso-production) for the concerned perimeter, are also provided. These indicators represent the environmental performance of the sites.
Total environmental expenditure, of which:* €127.4m €123.6m
1) Salaries and other payroll expenses for environmental officers €27.0m €25.1m
2) ISO 14001 and EMAS environmental certification and renewal costs €2.6m €2.9m
3) Environmental taxes €5.8m €8.9m
4) Insurance and warranties €6.1m €4.3m
5) Environmental fines €0.1m €0.1m
6) Cost of environmental incidents €0.3m €0.9m
7) Cost of technical measures €6.0m €7.1m
8) Environmental R&D budget €61.8m €59.0m
9) Soil decontamination, site remediation and other clean-up costs €17.7m €15.1m
Capital expenditure on environmental protection measures €63.3m €52.1m
Provisions for environmental risks €163.3m €155.2m
* Adjusted for actual scope of reporting.
Indicator 2015 2014
a) Environmental expenditures
G4-EN29, G4-EN81
04
SAINT-GOBAIN – CSR RESULTS 2015
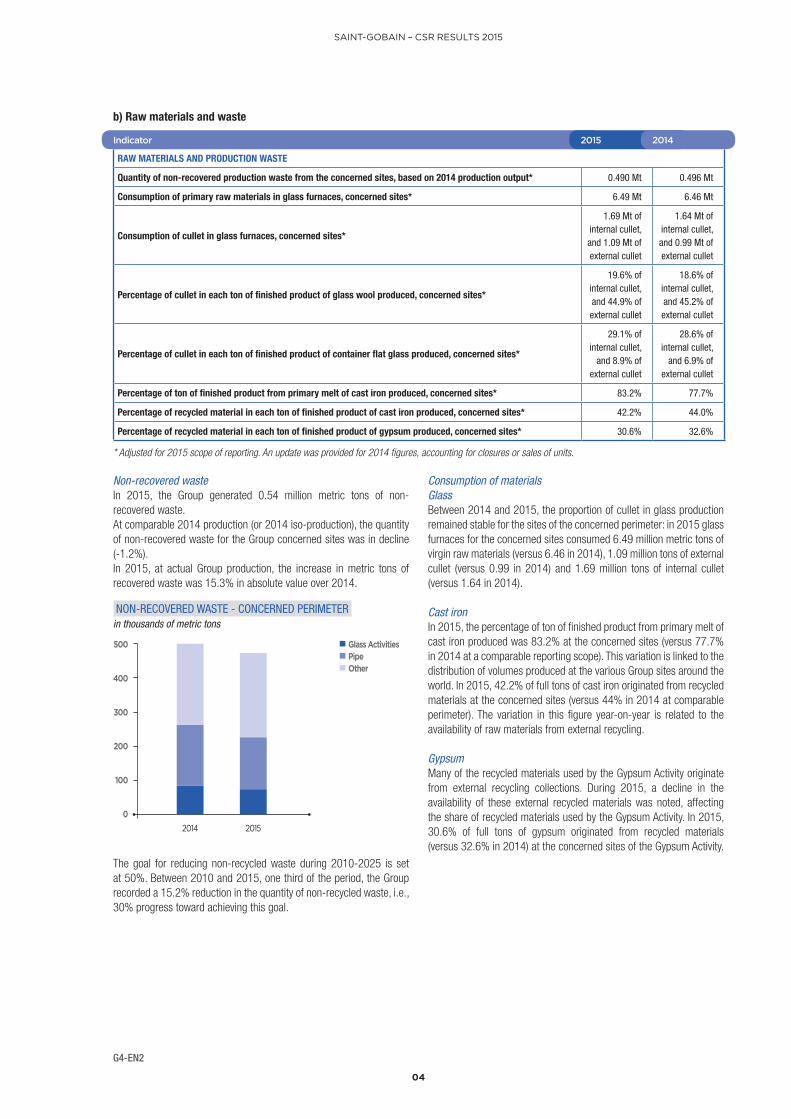
Non-recovered wasteIn 2015, the Group generated 0.54 million metric tons of non-recovered waste.At comparable 2014 production (or 2014 iso-production), the quantity of non-recovered waste for the Group concerned sites was in decline (-1.2%).In 2015, at actual Group production, the increase in metric tons of recovered waste was 15.3% in absolute value over 2014.
2014 2015
500
400
300
200
100
0
NON-RECOVERED WASTE - CONCERNED PERIMETER in thousands of metric tons
Glass ActivitiesPipe Other
The goal for reducing non-recycled waste during 2010-2025 is set at 50%. Between 2010 and 2015, one third of the period, the Group recorded a 15.2% reduction in the quantity of non-recycled waste, i.e., 30% progress toward achieving this goal.
Consumption of materials Glass Between 2014 and 2015, the proportion of cullet in glass production remained stable for the sites of the concerned perimeter: in 2015 glass furnaces for the concerned sites consumed 6.49 million metric tons of virgin raw materials (versus 6.46 in 2014), 1.09 million tons of external cullet (versus 0.99 in 2014) and 1.69 million tons of internal cullet (versus 1.64 in 2014).
Cast iron In 2015, the percentage of ton of finished product from primary melt of cast iron produced was 83.2% at the concerned sites (versus 77.7% in 2014 at a comparable reporting scope). This variation is linked to the distribution of volumes produced at the various Group sites around the world. In 2015, 42.2% of full tons of cast iron originated from recycled materials at the concerned sites (versus 44% in 2014 at comparable perimeter). The variation in this figure year-on-year is related to the availability of raw materials from external recycling.
Gypsum Many of the recycled materials used by the Gypsum Activity originate from external recycling collections. During 2015, a decline in the availability of these external recycled materials was noted, affecting the share of recycled materials used by the Gypsum Activity. In 2015, 30.6% of full tons of gypsum originated from recycled materials (versus 32.6% in 2014) at the concerned sites of the Gypsum Activity.
RAW MATERIALS AND PRODUCTION WASTE
Quantity of non-recovered production waste from the concerned sites, based on 2014 production output* 0.490 Mt 0.496 Mt
Consumption of primary raw materials in glass furnaces, concerned sites* 6.49 Mt 6.46 Mt
Consumption of cullet in glass furnaces, concerned sites*
1.69 Mt of internal cullet, and 1.09 Mt of external cullet
1.64 Mt of internal cullet, and 0.99 Mt of external cullet
Percentage of cullet in each ton of finished product of glass wool produced, concerned sites*
19.6% of internal cullet, and 44.9% of external cullet
18.6% of internal cullet, and 45.2% of external cullet
Percentage of cullet in each ton of finished product of container flat glass produced, concerned sites*
29.1% of internal cullet,
and 8.9% of external cullet
28.6% of internal cullet,
and 6.9% of external cullet
Percentage of ton of finished product from primary melt of cast iron produced, concerned sites* 83.2% 77.7%
Percentage of recycled material in each ton of finished product of cast iron produced, concerned sites* 42.2% 44.0%
Percentage of recycled material in each ton of finished product of gypsum produced, concerned sites* 30.6% 32.6%
Indicator 2015 2014
* Adjusted for 2015 scope of reporting. An update was provided for 2014 figures, accounting for closures or sales of units.
b) Raw materials and waste
G4-EN2
05
SAINT-GOBAIN – CSR RESULTS 2015
ENERGY
Total energy consumption of entire Group at actual scope of reporting** 156,308 TJ 202,840 TJ
Total indirect energy consumption of entire Group at actual scope of reporting** 33,289 TJ 39,826 TJ
Electricity consumption of entire Group at actual scope of reporting** 32,501 TJ 38,767 TJ
Steam and hot water consumption of entire Group at actual scope of reporting** 789 TJ 1,060 TJ
Direct total energy consumption of entire Group at actual scope of reporting** 123,019 TJ 163,014 TJ
Coal and coke consumption of entire Group at actual scope of reporting** 21,485 TJ 27,550 TJ
Natural gas consumption of entire Group at actual scope of reporting** 87,322 TJ 114,783 TJ
Petroleum products consumption of entire Group at actual scope of reporting** 12,037 TJ 20,454 TJ
CO2 EMISSIONS
Direct emissions of CO2 of the concerned sites at 2014 production* 8.9 Mt 9.2Mt
Direct emissions of CO2 for the entire Group at actual scope of reporting** 9.5 Mt 12.4 Mt
Direct emissions of CO2 per ton of finished product of glass at the concerned sites*624 kg CO2/
full metric tons of glass
618 kg CO2/
full metric tons of glass
Direct emissions of CO2 per full ton of finished product of cast iron at the concerned sites*1,102 kg CO2/
full metric tons of cast iron
1,248 kg CO2/
full metric tons of cast iron
Direct emissions of CO2 per full ton of finished product of plaster at the concerned sites*120 kg CO2/
full metric tons of plaster
120 kg CO2/
full metric tons of plaster
Other relevant indirect emissions (entire Group or scope of reporting concerned) of greenhouse gases, by weight (tons-equivalent of CO2)***
Not applicable Not applicable
Indirect emissions of greenhouse gases (purchases of electricity, steam, hot water) for the entire Group at actual scope of reporting**
3.5 Mt CO2-eq. 4.2 Mt CO2-eq.
AIR EMISSIONS
SO2 emissions per ton of finished product of glass at the concerned sites* 1.53 kg 1.49 kg
SO2 emissions per ton of finished product of cast iron at the concerned sites* 1.66 kg 2.90 kg
SO2 emissions from the concerned sites in the Pipe and Glass Activities* 12,974 t 15,224 t
NOx emissions per ton of finished product of glass at the concerned sites* 2.57 kg 2.57 kg
NOx emissions per ton of finished product of cast iron at the concerned sites* 0.95 kg 1.84 kg
NOx emissions from the concerned sites in the Pipe and Glass Activities* 18,309 t 20,004 t
Dust emissions per ton of finished product of glass at the concerned sites* 0.55 kg 0.56 kg
Emissions of dust per ton of finished product of cast iron at the concerned sites* 1.58 kg 2.16 kg
Dust emissions from the concerned sites of the Pipe and Glass Activities* 6,559 metric tons 7,820 metric tons
Indicator 2015 2014
* Adjusted for 2015 scope of reporting. An update was provided for 2014 figures, accounting for closures or sales of units.** The actual scope of reporting refers to all sites open in the Gaïa reporting tool at December 31 of the reporting year.
*** Saint-Gobain activities generate no greenhouse gas emissions other than CO2.
c) Energy, atmospheric emissions and climate
G4-EN3, G4-EN15
06
SAINT-GOBAIN – CSR RESULTS 2015
2014
2014
2014
2015
2015
2015
125,000
10
4
100,000
75,000
7.5
3
50,000
5
2
25,000
2.5
1
0
0.0
0
DIRECT ENERGY - CONCERNED PERIMETER in TJ
Glass Activities
Glass Activities
Pipe
Pipe
Other
Other
Glass ActivitiesPipeOther
(1) Electricity and heat purchased.
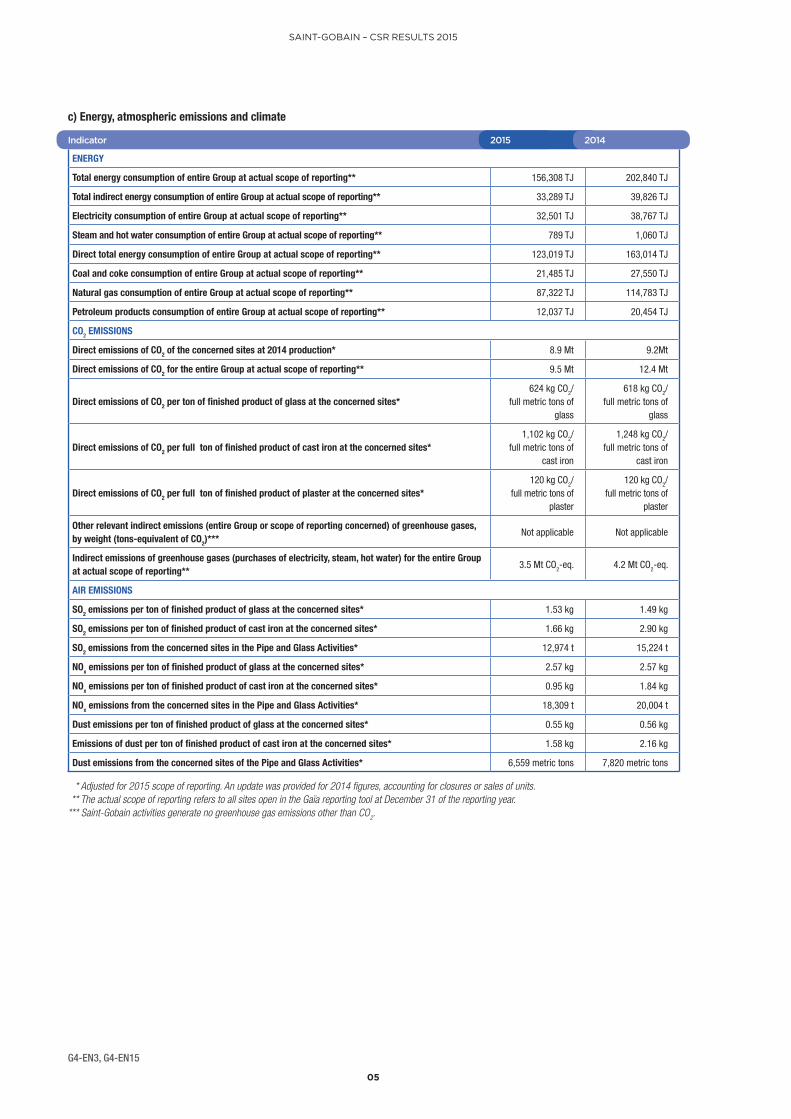
EnergyThe energy consumption of the sites of the concerned perimeter, at iso-production, reduced by 0.7% between 2014 and 2015.In 2015, energy consumption of the Group’s sites was 156,308 TJ (2014: 204,840 TJ). The percentage of indirect energy (1) remained stable, at around 20% of total energy consumed.
The goal for reducing energy consumption during 2010-2025 was set at 15%. Between 2010 and 2015, one third of the period, the Group recorded a 1.6% reduction in energy consumption, i.e., progress of 11% toward achieving this goal.
DIRECT CO EMISSIONS - CONCERNED PERIMETER in millions of metric tons
INDIRECT CO EMISSIONS - CONCERNED PERIMETER in millions of metric tons
Emissions of CO2 At iso-production, total CO
2 emissions from the sites of the concerned
perimeter reduced by 3.3% between 2014 and 2015.At actual production, CO
2 emissions from the concerned sites of the
Group in 2015 were:• at scope 1 (direct emissions), 8.91 Mt of CO
2, i.e. minus 3.2% in
absolute value over 2014;• at scope 1 and 2 (direct and indirect emissions), 12.2 Mt of CO
2, i.e.
minus 3.8% in absolute value over 2014.At iso-production, CO
2 emissions from the sites of the concerned
perimeter in 2015 were:• at scope 1, 8.95 Mt of CO
2, i.e. minus 2.8% from 2014;
• at scopes 1 and 2 (direct and indirect emissions), 12.3 Mt of CO2, i.e.
minus 3.3% from 2014.
The priority areas for the reliability of the Scope 3 indicators were defined in 2015: energy, raw materials and transportation. They will be the subject of specific programs for imminent rollout.The goal for reducing CO
2 in 2010-2025 is set at 20%. Between 2010
and 2015, one third of the period, the Group recorded a 5.7% reduction in CO
2 emissions, i.e., progress of 28% toward achieving this goal.
G4-EN6, G4-EN15, G4-EN16
07
SAINT-GOBAIN – CSR RESULTS 2015
2014
2014
2014
2015
2015
2015
25
20
15
15
20
15
20
10
10
10
5
5
5
0
0
0
Glass Activities
Glass Activities
Glass Activities
Pipe
Pipe
Pipe
Other
Other
Other
SO EMISSIONS - CONCERNED PERIMETER In thousands of metric tons
NO EMISSIONS - CONCERNED PERIMETER In thousands of metric tons
DUST EMISSIONS - CONCERNED PERIMETER In thousands of metric tons
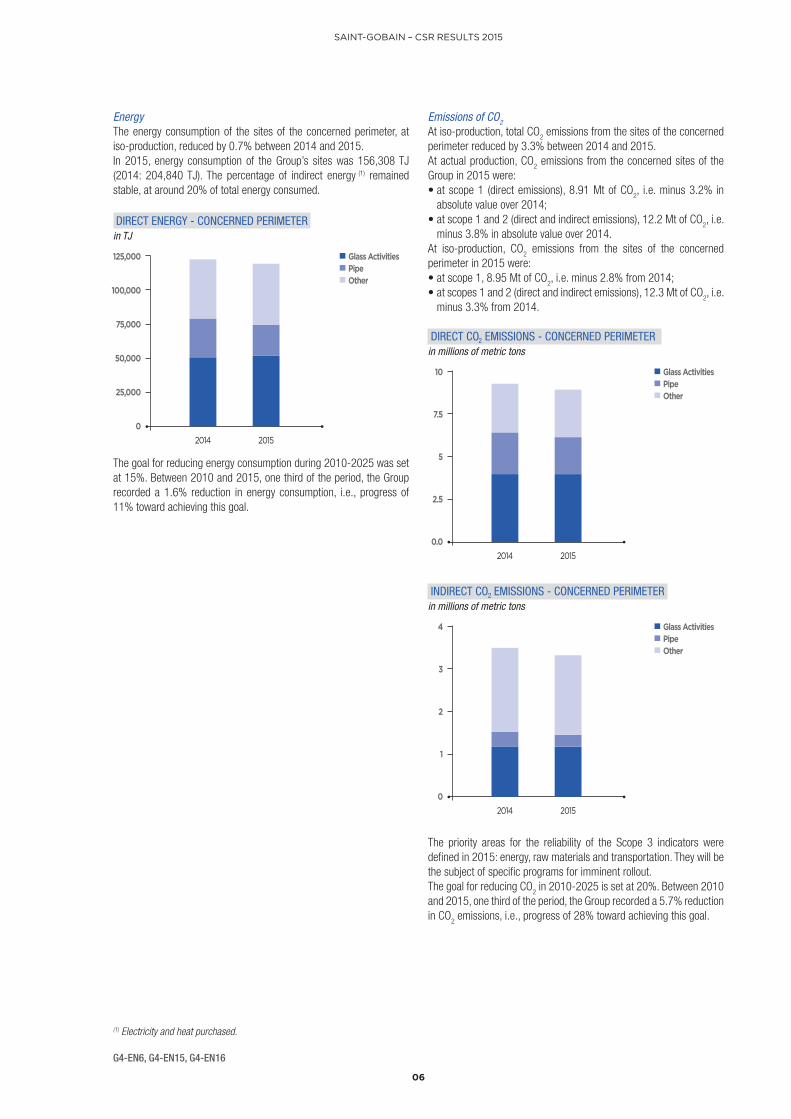
Emissions of NOx, SO2 and other significant atmospheric emissions A decrease in NO
x emissions (-6.3%), in dust emissions (-6.2%),
and a significant decrease in SO2 emissions (-20.4%) at comparable
production, between 2014 and 2015, is noted for the sites in the concerned perimeter.
08
SAINT-GOBAIN – CSR RESULTS 2015
(1) Actual 2014 production.
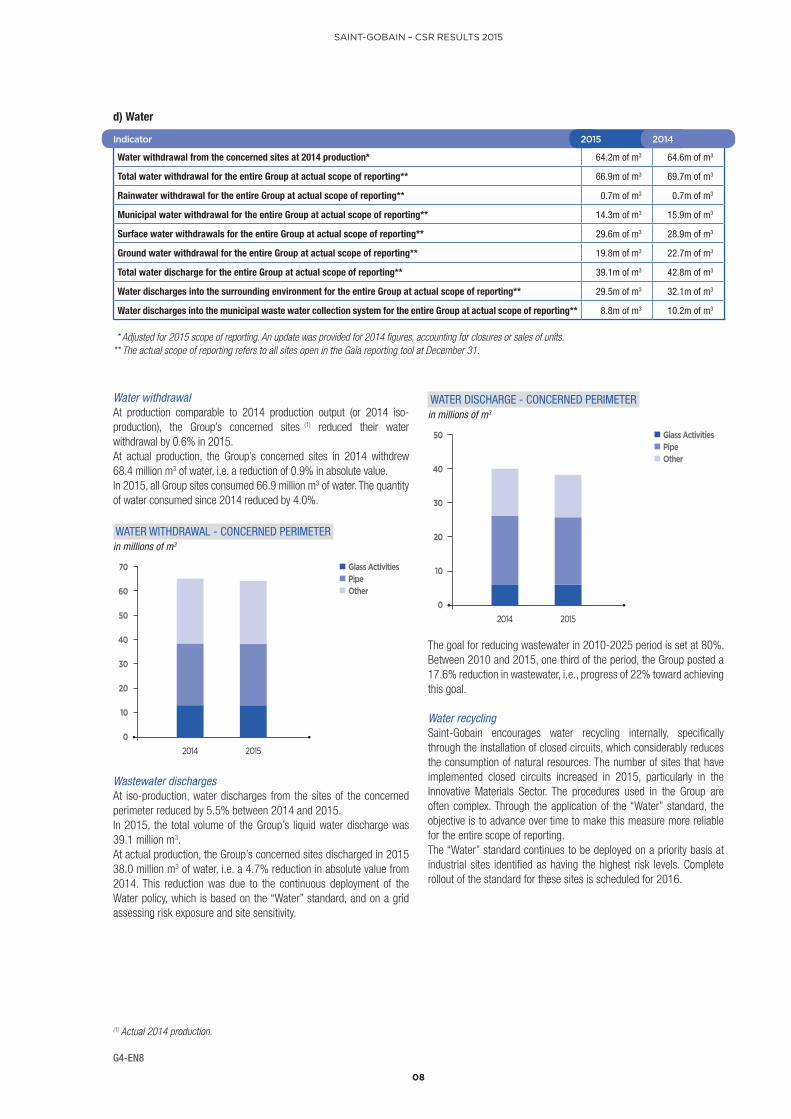
Water withdrawalAt production comparable to 2014 production output (or 2014 iso-production), the Group’s concerned sites (1) reduced their water withdrawal by 0.6% in 2015.At actual production, the Group’s concerned sites in 2014 withdrew 68.4 million m3 of water, i.e. a reduction of 0.9% in absolute value. In 2015, all Group sites consumed 66.9 million m3 of water. The quantity of water consumed since 2014 reduced by 4.0%.
2014 2015
70
30
40
50
60
20
10
0
Glass ActivitiesPipe Other
WATER WITHDRAWAL - CONCERNED PERIMETER in millions of m3
Wastewater dischargesAt iso-production, water discharges from the sites of the concerned perimeter reduced by 5.5% between 2014 and 2015.In 2015, the total volume of the Group’s liquid water discharge was 39.1 million m3.At actual production, the Group’s concerned sites discharged in 2015 38.0 million m3 of water, i.e. a 4.7% reduction in absolute value from 2014. This reduction was due to the continuous deployment of the Water policy, which is based on the “Water” standard, and on a grid assessing risk exposure and site sensitivity.
2014 2015
50
30
40
20
10
0
Glass ActivitiesPipeOther
WATER DISCHARGE - CONCERNED PERIMETER in millions of m3
The goal for reducing wastewater in 2010-2025 period is set at 80%. Between 2010 and 2015, one third of the period, the Group posted a 17.6% reduction in wastewater, i.e., progress of 22% toward achieving this goal.
Water recyclingSaint-Gobain encourages water recycling internally, specifically through the installation of closed circuits, which considerably reduces the consumption of natural resources. The number of sites that have implemented closed circuits increased in 2015, particularly in the Innovative Materials Sector. The procedures used in the Group are often complex. Through the application of the “Water” standard, the objective is to advance over time to make this measure more reliable for the entire scope of reporting.The “Water” standard continues to be deployed on a priority basis at industrial sites identified as having the highest risk levels. Complete rollout of the standard for these sites is scheduled for 2016.
d) Water
Water withdrawal from the concerned sites at 2014 production* 64.2m of m3 64.6m of m3
Total water withdrawal for the entire Group at actual scope of reporting** 66.9m of m3 69.7m of m3
Rainwater withdrawal for the entire Group at actual scope of reporting** 0.7m of m3 0.7m of m3
Municipal water withdrawal for the entire Group at actual scope of reporting** 14.3m of m3 15.9m of m3
Surface water withdrawals for the entire Group at actual scope of reporting** 29.6m of m3 28.9m of m3
Ground water withdrawal for the entire Group at actual scope of reporting** 19.8m of m3 22.7m of m3
Total water discharge for the entire Group at actual scope of reporting** 39.1m of m3 42.8m of m3
Water discharges into the surrounding environment for the entire Group at actual scope of reporting** 29.5m of m3 32.1m of m3
Water discharges into the municipal waste water collection system for the entire Group at actual scope of reporting** 8.8m of m3 10.2m of m3
* Adjusted for 2015 scope of reporting. An update was provided for 2014 figures, accounting for closures or sales of units.** The actual scope of reporting refers to all sites open in the Gaïa reporting tool at December 31.
Indicator 2015 2014
G4-EN8
09
SAINT-GOBAIN – CSR RESULTS 2015
(1) Indicators cover permanent and temporary employees.
1.2.2 Human capital
a) Health and safety
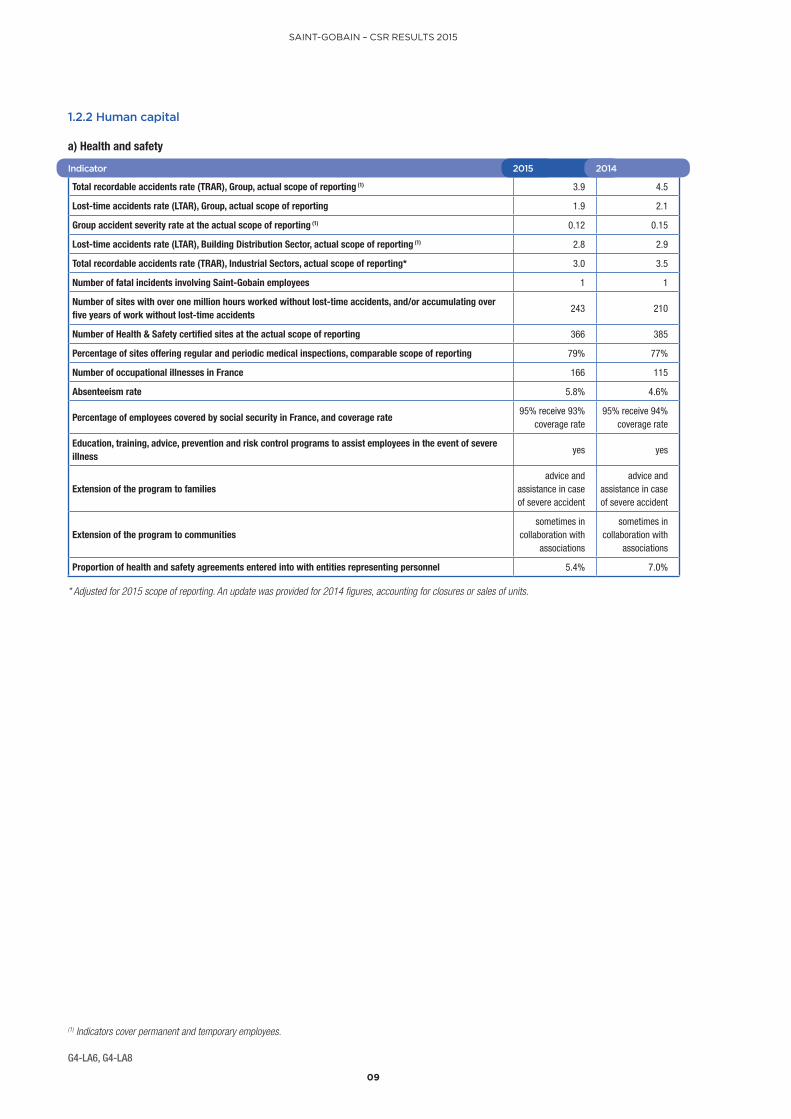
Total recordable accidents rate (TRAR), Group, actual scope of reporting (1) 3.9 4.5
Lost-time accidents rate (LTAR), Group, actual scope of reporting 1.9 2.1
Group accident severity rate at the actual scope of reporting (1) 0.12 0.15
Lost-time accidents rate (LTAR), Building Distribution Sector, actual scope of reporting (1) 2.8 2.9
Total recordable accidents rate (TRAR), Industrial Sectors, actual scope of reporting* 3.0 3.5
Number of fatal incidents involving Saint-Gobain employees 1 1
Number of sites with over one million hours worked without lost-time accidents, and/or accumulating over five years of work without lost-time accidents
243 210
Number of Health & Safety certified sites at the actual scope of reporting 366 385
Percentage of sites offering regular and periodic medical inspections, comparable scope of reporting 79% 77%
Number of occupational illnesses in France 166 115
Absenteeism rate 5.8% 4.6%
Percentage of employees covered by social security in France, and coverage rate95% receive 93%
coverage rate95% receive 94%
coverage rate
Education, training, advice, prevention and risk control programs to assist employees in the event of severe illness
yes yes
Extension of the program to familiesadvice and
assistance in case of severe accident
advice and assistance in case of severe accident
Extension of the program to communitiessometimes in
collaboration with associations
sometimes in collaboration with
associations
Proportion of health and safety agreements entered into with entities representing personnel 5.4% 7.0%
Indicator 2015 2014
* Adjusted for 2015 scope of reporting. An update was provided for 2014 figures, accounting for closures or sales of units.
G4-LA6, G4-LA8
10
SAINT-GOBAIN – CSR RESULTS 2015
Reduction in occupational accidents
2016 OBJECTIVE TRAR < 4.8
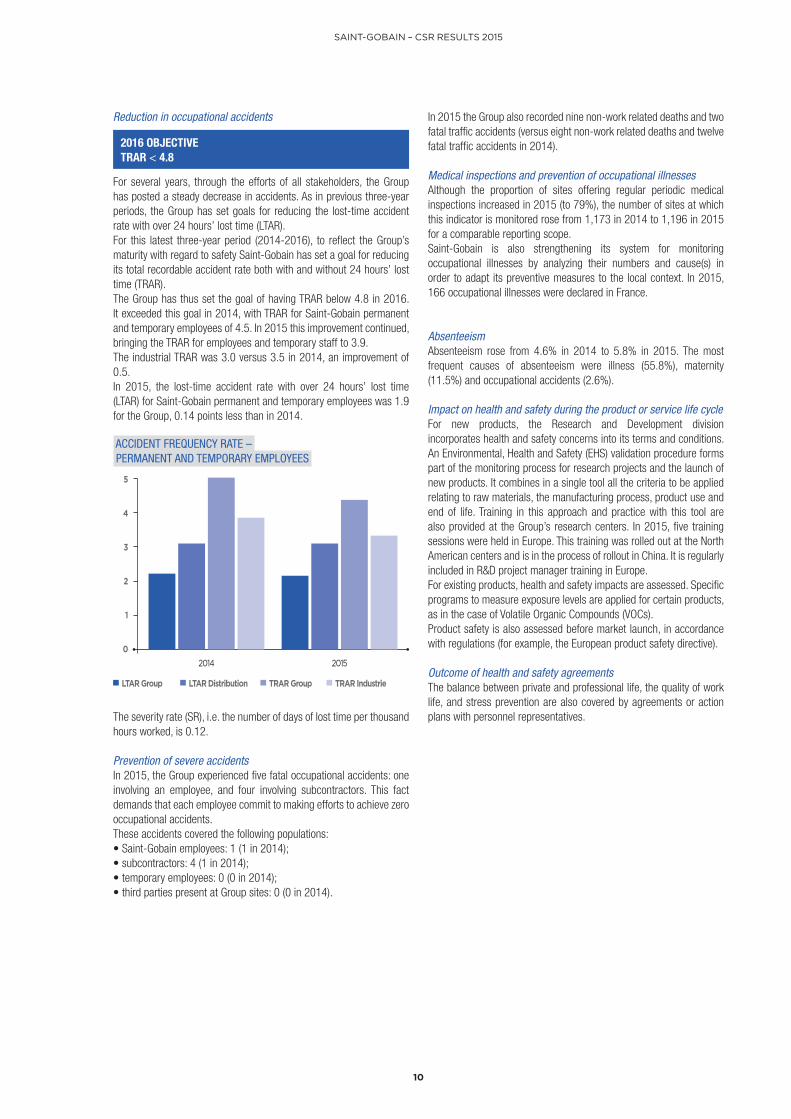
For several years, through the efforts of all stakeholders, the Group has posted a steady decrease in accidents. As in previous three-year periods, the Group has set goals for reducing the lost-time accident rate with over 24 hours’ lost time (LTAR).For this latest three-year period (2014-2016), to reflect the Group’s maturity with regard to safety Saint-Gobain has set a goal for reducing its total recordable accident rate both with and without 24 hours’ lost time (TRAR).The Group has thus set the goal of having TRAR below 4.8 in 2016. It exceeded this goal in 2014, with TRAR for Saint-Gobain permanent and temporary employees of 4.5. In 2015 this improvement continued, bringing the TRAR for employees and temporary staff to 3.9.The industrial TRAR was 3.0 versus 3.5 in 2014, an improvement of 0.5.In 2015, the lost-time accident rate with over 24 hours’ lost time (LTAR) for Saint-Gobain permanent and temporary employees was 1.9 for the Group, 0.14 points less than in 2014.
2014 2015
5
3
4
2
1
0
LTAR Group LTAR Distribution TRAR Group TRAR Industrie
ACCIDENT FREQUENCY RATE – PERMANENT AND TEMPORARY EMPLOYEES
The severity rate (SR), i.e. the number of days of lost time per thousand hours worked, is 0.12.
Prevention of severe accidentsIn 2015, the Group experienced five fatal occupational accidents: one involving an employee, and four involving subcontractors. This fact demands that each employee commit to making efforts to achieve zero occupational accidents.These accidents covered the following populations:• Saint-Gobain employees: 1 (1 in 2014);• subcontractors: 4 (1 in 2014);• temporary employees: 0 (0 in 2014);• third parties present at Group sites: 0 (0 in 2014).
In 2015 the Group also recorded nine non-work related deaths and two fatal traffic accidents (versus eight non-work related deaths and twelve fatal traffic accidents in 2014).
Medical inspections and prevention of occupational illnessesAlthough the proportion of sites offering regular periodic medical inspections increased in 2015 (to 79%), the number of sites at which this indicator is monitored rose from 1,173 in 2014 to 1,196 in 2015 for a comparable reporting scope.Saint-Gobain is also strengthening its system for monitoring occupational illnesses by analyzing their numbers and cause(s) in order to adapt its preventive measures to the local context. In 2015, 166 occupational illnesses were declared in France.
AbsenteeismAbsenteeism rose from 4.6% in 2014 to 5.8% in 2015. The most frequent causes of absenteeism were illness (55.8%), maternity (11.5%) and occupational accidents (2.6%).
Impact on health and safety during the product or service life cycleFor new products, the Research and Development division incorporates health and safety concerns into its terms and conditions. An Environmental, Health and Safety (EHS) validation procedure forms part of the monitoring process for research projects and the launch of new products. It combines in a single tool all the criteria to be applied relating to raw materials, the manufacturing process, product use and end of life. Training in this approach and practice with this tool are also provided at the Group’s research centers. In 2015, five training sessions were held in Europe. This training was rolled out at the North American centers and is in the process of rollout in China. It is regularly included in R&D project manager training in Europe.For existing products, health and safety impacts are assessed. Specific programs to measure exposure levels are applied for certain products, as in the case of Volatile Organic Compounds (VOCs).Product safety is also assessed before market launch, in accordance with regulations (for example, the European product safety directive).
Outcome of health and safety agreementsThe balance between private and professional life, the quality of work life, and stress prevention are also covered by agreements or action plans with personnel representatives.
11
SAINT-GOBAIN – CSR RESULTS 2015
(1) Basis of calculation: excluding North America, i.e. 91.8% of the scope of reporting.
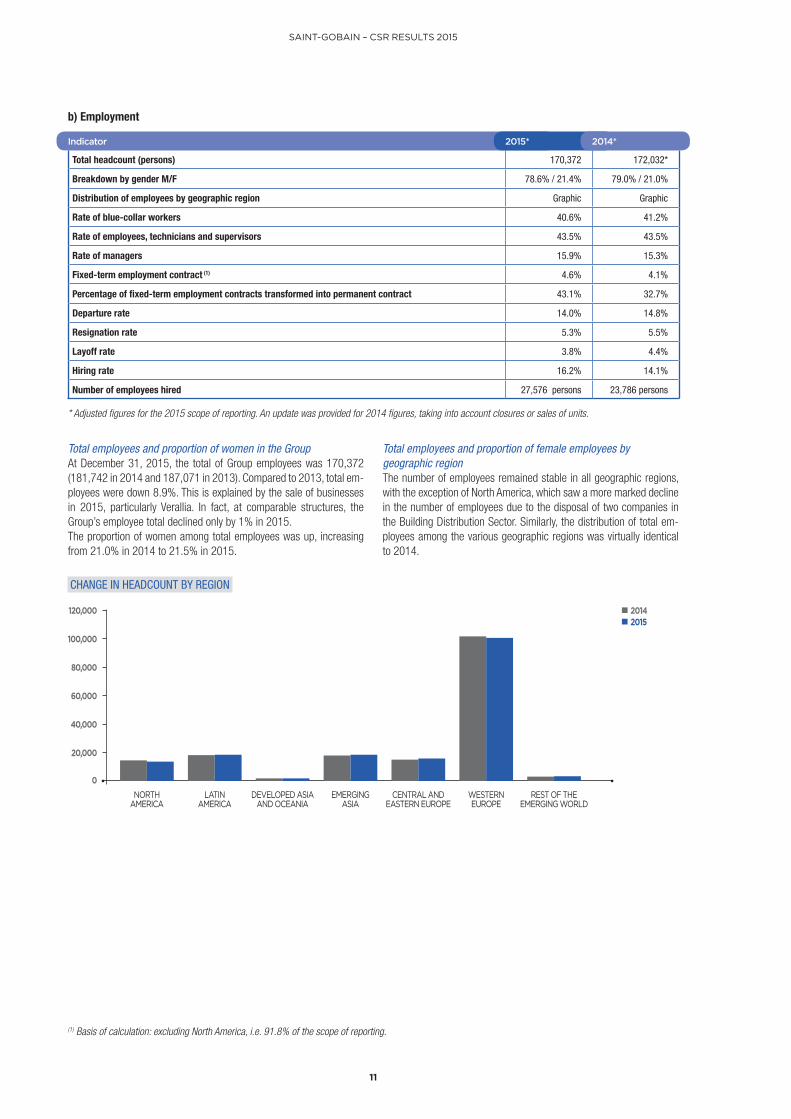
Total employees and proportion of women in the GroupAt December 31, 2015, the total of Group employees was 170,372 (181,742 in 2014 and 187,071 in 2013). Compared to 2013, total em-ployees were down 8.9%. This is explained by the sale of businesses in 2015, particularly Verallia. In fact, at comparable structures, the Group’s employee total declined only by 1% in 2015.The proportion of women among total employees was up, increasing from 21.0% in 2014 to 21.5% in 2015.
Total employees and proportion of female employees by geographic regionThe number of employees remained stable in all geographic regions, with the exception of North America, which saw a more marked decline in the number of employees due to the disposal of two companies in the Building Distribution Sector. Similarly, the distribution of total em-ployees among the various geographic regions was virtually identical to 2014.
b) Employment
Total headcount (persons) 170,372 172,032*
Breakdown by gender M/F 78.6% / 21.4% 79.0% / 21.0%
Distribution of employees by geographic region Graphic Graphic
Rate of blue-collar workers 40.6% 41.2%
Rate of employees, technicians and supervisors 43.5% 43.5%
Rate of managers 15.9% 15.3%
Fixed-term employment contract (1) 4.6% 4.1%
Percentage of fixed-term employment contracts transformed into permanent contract 43.1% 32.7%
Departure rate 14.0% 14.8%
Resignation rate 5.3% 5.5%
Layoff rate 3.8% 4.4%
Hiring rate 16.2% 14.1%
Number of employees hired 27,576 persons 23,786 persons
* Adjusted figures for the 2015 scope of reporting. An update was provided for 2014 figures, taking into account closures or sales of units.
Indicator 2015* 2014*
NORTH AMERICA
LATIN AMERICA
DEVELOPED ASIA AND OCEANIA
EMERGING ASIA
CENTRAL AND EASTERN EUROPE
WESTERN EUROPE
REST OF THE EMERGING WORLD
120,000
100,000
80,000
60,000
40,000
20,000
0
CHANGE IN HEADCOUNT BY REGION
20142015
12
SAINT-GOBAIN – CSR RESULTS 2015
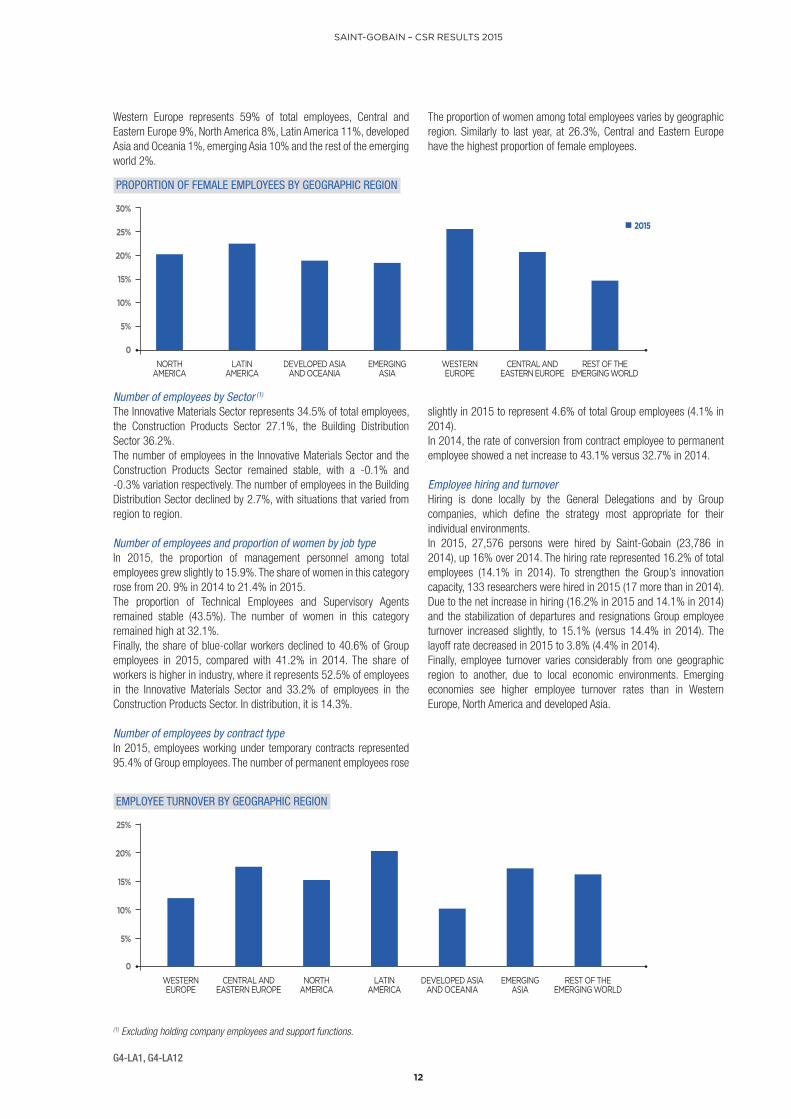
Western Europe represents 59% of total employees, Central and Eastern Europe 9%, North America 8%, Latin America 11%, developed Asia and Oceania 1%, emerging Asia 10% and the rest of the emerging world 2%.
The proportion of women among total employees varies by geographic region. Similarly to last year, at 26.3%, Central and Eastern Europe have the highest proportion of female employees.
(1) Excluding holding company employees and support functions.
PROPORTION OF FEMALE EMPLOYEES BY GEOGRAPHIC REGION
NORTH AMERICA
LATIN AMERICA
DEVELOPED ASIA AND OCEANIA
EMERGING ASIA
WESTERN EUROPE
CENTRAL AND EASTERN EUROPE
REST OF THE EMERGING WORLD
30%
25%
20%
15%
10%
5%
0
Number of employees by Sector (1)
The Innovative Materials Sector represents 34.5% of total employees, the Construction Products Sector 27.1%, the Building Distribution Sector 36.2%.The number of employees in the Innovative Materials Sector and the Construction Products Sector remained stable, with a -0.1% and -0.3% variation respectively. The number of employees in the Building Distribution Sector declined by 2.7%, with situations that varied from region to region.
Number of employees and proportion of women by job type In 2015, the proportion of management personnel among total employees grew slightly to 15.9%. The share of women in this category rose from 20. 9% in 2014 to 21.4% in 2015. The proportion of Technical Employees and Supervisory Agents remained stable (43.5%). The number of women in this category remained high at 32.1%.Finally, the share of blue-collar workers declined to 40.6% of Group employees in 2015, compared with 41.2% in 2014. The share of workers is higher in industry, where it represents 52.5% of employees in the Innovative Materials Sector and 33.2% of employees in the Construction Products Sector. In distribution, it is 14.3%.
Number of employees by contract typeIn 2015, employees working under temporary contracts represented 95.4% of Group employees. The number of permanent employees rose
slightly in 2015 to represent 4.6% of total Group employees (4.1% in 2014).In 2014, the rate of conversion from contract employee to permanent employee showed a net increase to 43.1% versus 32.7% in 2014.
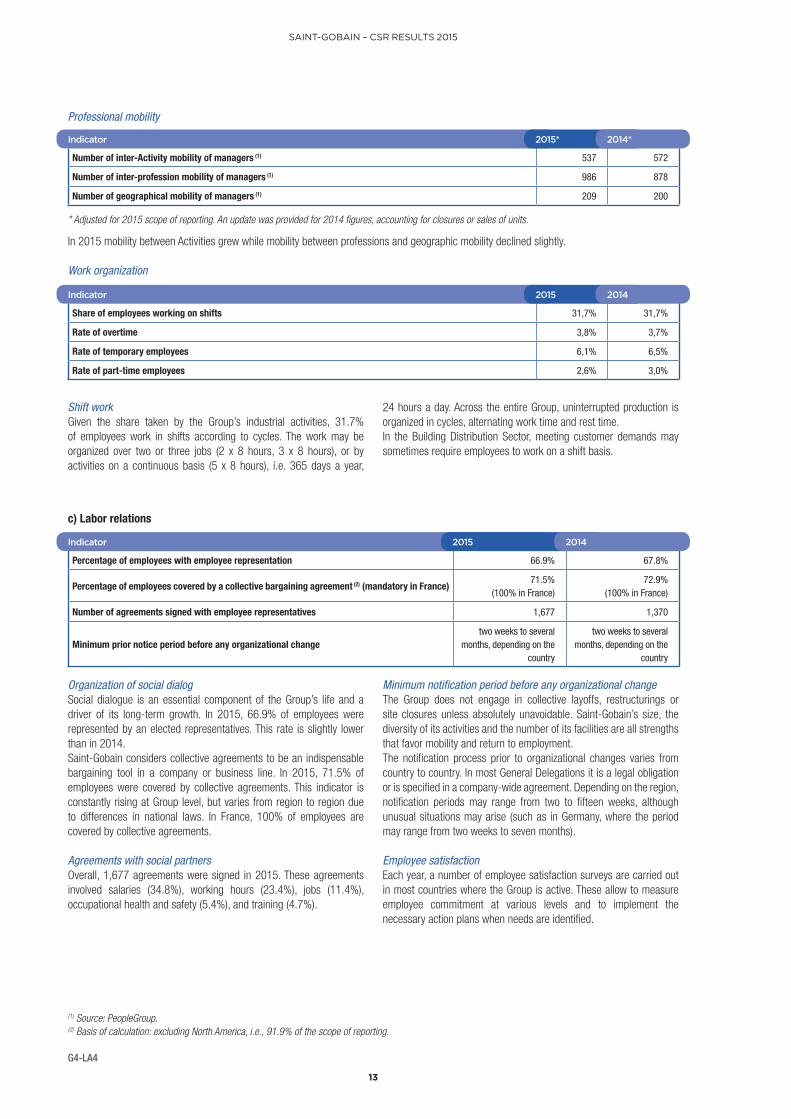
Employee hiring and turnoverHiring is done locally by the General Delegations and by Group companies, which define the strategy most appropriate for their individual environments.In 2015, 27,576 persons were hired by Saint-Gobain (23,786 in 2014), up 16% over 2014. The hiring rate represented 16.2% of total employees (14.1% in 2014). To strengthen the Group’s innovation capacity, 133 researchers were hired in 2015 (17 more than in 2014).Due to the net increase in hiring (16.2% in 2015 and 14.1% in 2014) and the stabilization of departures and resignations Group employee turnover increased slightly, to 15.1% (versus 14.4% in 2014). The layoff rate decreased in 2015 to 3.8% (4.4% in 2014).Finally, employee turnover varies considerably from one geographic region to another, due to local economic environments. Emerging economies see higher employee turnover rates than in Western Europe, North America and developed Asia.
EMPLOYEE TURNOVER BY GEOGRAPHIC REGION
WESTERN EUROPE
CENTRAL AND EASTERN EUROPE
NORTH AMERICA
LATIN AMERICA
DEVELOPED ASIA AND OCEANIA
EMERGING ASIA
REST OF THE EMERGING WORLD
25%
20%
15%
10%
5%
0
2015
G4-LA1, G4-LA12
13
SAINT-GOBAIN – CSR RESULTS 2015
(1) Source: PeopleGroup.(2) Basis of calculation: excluding North America, i.e., 91.9% of the scope of reporting.
Shift workGiven the share taken by the Group’s industrial activities, 31.7% of employees work in shifts according to cycles. The work may be organized over two or three jobs (2 x 8 hours, 3 x 8 hours), or by activities on a continuous basis (5 x 8 hours), i.e. 365 days a year,
24 hours a day. Across the entire Group, uninterrupted production is organized in cycles, alternating work time and rest time.In the Building Distribution Sector, meeting customer demands may sometimes require employees to work on a shift basis.
Organization of social dialogSocial dialogue is an essential component of the Group’s life and a driver of its long-term growth. In 2015, 66.9% of employees were represented by an elected representatives. This rate is slightly lower than in 2014.Saint-Gobain considers collective agreements to be an indispensable bargaining tool in a company or business line. In 2015, 71.5% of employees were covered by collective agreements. This indicator is constantly rising at Group level, but varies from region to region due to differences in national laws. In France, 100% of employees are covered by collective agreements.
Agreements with social partners Overall, 1,677 agreements were signed in 2015. These agreements involved salaries (34.8%), working hours (23.4%), jobs (11.4%), occupational health and safety (5.4%), and training (4.7%).
Minimum notification period before any organizational changeThe Group does not engage in collective layoffs, restructurings or site closures unless absolutely unavoidable. Saint-Gobain’s size, the diversity of its activities and the number of its facilities are all strengths that favor mobility and return to employment.The notification process prior to organizational changes varies from country to country. In most General Delegations it is a legal obligation or is specified in a company-wide agreement. Depending on the region, notification periods may range from two to fifteen weeks, although unusual situations may arise (such as in Germany, where the period may range from two weeks to seven months).
Employee satisfactionEach year, a number of employee satisfaction surveys are carried out in most countries where the Group is active. These allow to measure employee commitment at various levels and to implement the necessary action plans when needs are identified.
Professional mobility
In 2015 mobility between Activities grew while mobility between professions and geographic mobility declined slightly.
Work organization
c) Labor relations
G4-LA4
Number of inter-Activity mobility of managers (1) 537 572
Number of inter-profession mobility of managers (1) 986 878
Number of geographical mobility of managers (1) 209 200
* Adjusted for 2015 scope of reporting. An update was provided for 2014 figures, accounting for closures or sales of units.
Indicator 2015* 2014*
Share of employees working on shifts 31,7% 31,7%
Rate of overtime 3,8% 3,7%
Rate of temporary employees 6,1% 6,5%
Rate of part-time employees 2,6% 3,0%
Indicator 2015 2014
Percentage of employees with employee representation 66.9% 67.8%
Percentage of employees covered by a collective bargaining agreement (2) (mandatory in France)71.5%
(100% in France)72.9%
(100% in France)
Number of agreements signed with employee representatives 1,677 1,370
Minimum prior notice period before any organizational changetwo weeks to several
months, depending on the country
two weeks to several months, depending on the
country
Indicator 2015 2014
14
SAINT-GOBAIN – CSR RESULTS 2015
(1) In 2015, these indicators were calculated based on the number of training sessions.
Training hours and employees trainedOver 4.4 million hours of training were dispensed within the Group in 2015. The Group’s training initiatives represent 2% of the payroll.The proportion of employees who received training in 2015 was 83.7%. This figure includes 100% of management personnel and 78.2% of non-management personnel. In 2015, employees received an average of 26.3 hours of training per year. For management personnel, average hours of training per year were 33.2 hours, and for non-management, 20.2 hours.In total, technical training represented 35.4% and EHS training 40.3%. The breakdown of training by topic was as follows: environment (3.4%), health and hygiene (3.5%), safety (22.3%), and general EHS (11.2%).In 2015, in a process of continuous improvement, training data for France, Italy, Belgium, Spain, Portugal, United Kingdom, Germany, Brazil, Canada and the United States were audited by an independent third-party firm. Within this scope of reporting, the data was as follows:• total number of training hours: 2.7 million;• proportion of payroll dedicated to training: 2.3%;
• proportion of employees who received training: 73.1%;• average number of training hours per employee per year: 25.5.According to the new Group Training Doctrine adopted in 2014, in foreign countries in-person training courses are only counted if their duration exceeds five hours. However, training hours recorded in certain countries include a portion of in-person training of fewer than five hours due to the lack of maturity in application of the new Doctrine.
Annual reviews and career advancementIn 2015, the Group increased the number of annual reviews carried out for all employees. Thus, 65% of Group employees received annual reviews (63.9% in 2014). This rate was 90.5% for management employees and 60.1% for non-management employees. Saint-Gobain has set the goal of holding annual reviews for all management personnel. In 2015, over 1,000 annual people reviews were held to promote careers and create opportunities for executive-level employees.
d) Training
G4-LA9, G4-LA11
Proportion of payroll of training investment 2.0% 1.8%
Employees who have received training during the year 83.7% 72.9%
Average number of training hours per employee per year 26.3 hours 23.3 hours
Share of technical and EHS training (1)
35.4% of technical training
40.3% of EHS training
36.1% of technical training
43.0% of EHS training
Share of Group employees who had an annual review 65.0% 63.9%
Share of non-management employees who had an annual review 60.1% 58.9%
Share of management employees who had an annual review 90.5% 91.0%
Indicator 2015 2014
15
SAINT-GOBAIN – CSR RESULTS 2015
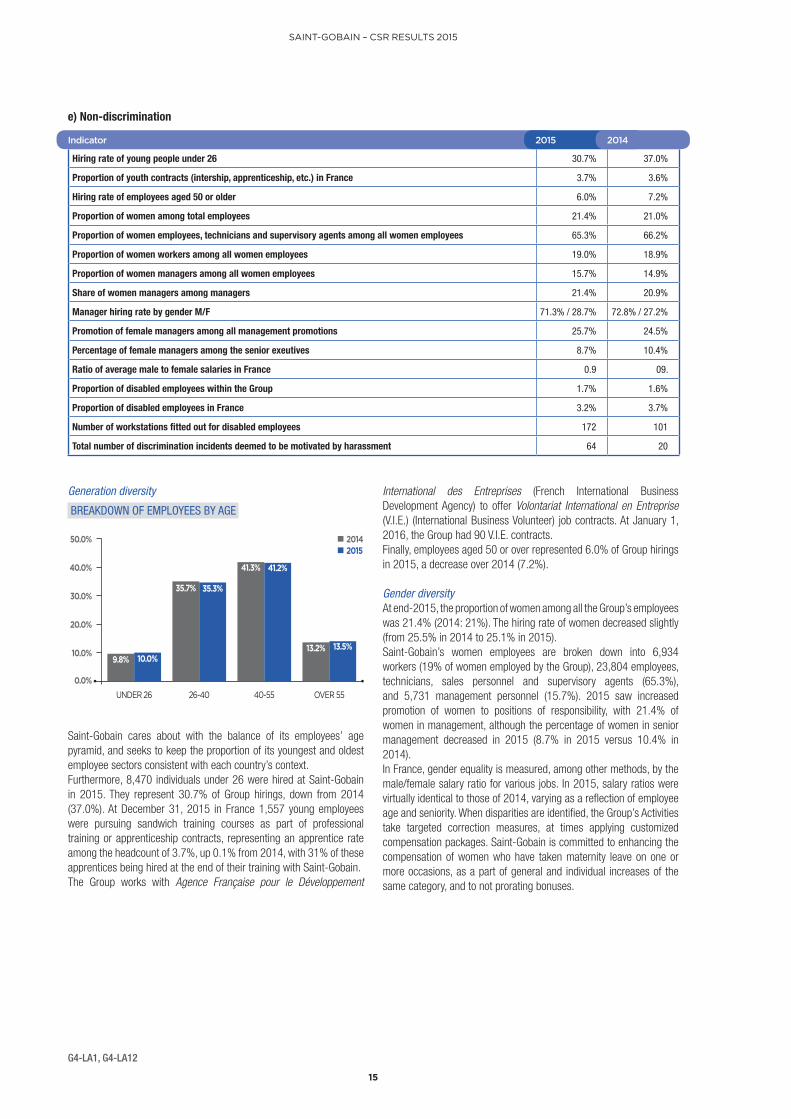
Saint-Gobain cares about with the balance of its employees’ age pyramid, and seeks to keep the proportion of its youngest and oldest employee sectors consistent with each country’s context. Furthermore, 8,470 individuals under 26 were hired at Saint-Gobain in 2015. They represent 30.7% of Group hirings, down from 2014 (37.0%). At December 31, 2015 in France 1,557 young employees were pursuing sandwich training courses as part of professional training or apprenticeship contracts, representing an apprentice rate among the headcount of 3.7%, up 0.1% from 2014, with 31% of these apprentices being hired at the end of their training with Saint-Gobain.The Group works with Agence Française pour le Développement
International des Entreprises (French International Business Development Agency) to offer Volontariat International en Entreprise (V.I.E.) (International Business Volunteer) job contracts. At January 1, 2016, the Group had 90 V.I.E. contracts.Finally, employees aged 50 or over represented 6.0% of Group hirings in 2015, a decrease over 2014 (7.2%).
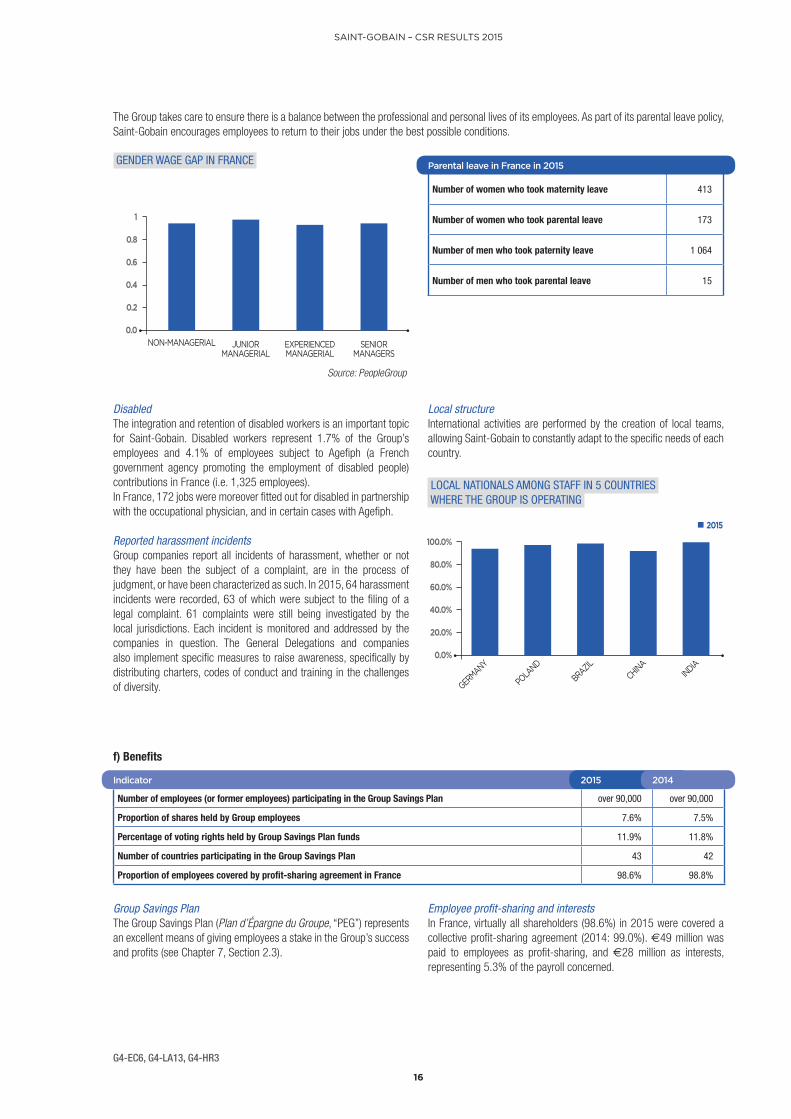
Gender diversityAt end-2015, the proportion of women among all the Group’s employees was 21.4% (2014: 21%). The hiring rate of women decreased slightly (from 25.5% in 2014 to 25.1% in 2015).Saint-Gobain’s women employees are broken down into 6,934 workers (19% of women employed by the Group), 23,804 employees, technicians, sales personnel and supervisory agents (65.3%), and 5,731 management personnel (15.7%). 2015 saw increased promotion of women to positions of responsibility, with 21.4% of women in management, although the percentage of women in senior management decreased in 2015 (8.7% in 2015 versus 10.4% in 2014). In France, gender equality is measured, among other methods, by the male/female salary ratio for various jobs. In 2015, salary ratios were virtually identical to those of 2014, varying as a reflection of employee age and seniority. When disparities are identified, the Group’s Activities take targeted correction measures, at times applying customized compensation packages. Saint-Gobain is committed to enhancing the compensation of women who have taken maternity leave on one or more occasions, as a part of general and individual increases of the same category, and to not prorating bonuses.
e) Non-discrimination
G4-LA1, G4-LA12
Hiring rate of young people under 26 30.7% 37.0%
Proportion of youth contracts (intership, apprenticeship, etc.) in France 3.7% 3.6%
Hiring rate of employees aged 50 or older 6.0% 7.2%
Proportion of women among total employees 21.4% 21.0%
Proportion of women employees, technicians and supervisory agents among all women employees 65.3% 66.2%
Proportion of women workers among all women employees 19.0% 18.9%
Proportion of women managers among all women employees 15.7% 14.9%
Share of women managers among managers 21.4% 20.9%
Manager hiring rate by gender M/F 71.3% / 28.7% 72.8% / 27.2%
Promotion of female managers among all management promotions 25.7% 24.5%
Percentage of female managers among the senior exeutives 8.7% 10.4%
Ratio of average male to female salaries in France 0.9 09.
Proportion of disabled employees within the Group 1.7% 1.6%
Proportion of disabled employees in France 3.2% 3.7%
Number of workstations fitted out for disabled employees 172 101
Total number of discrimination incidents deemed to be motivated by harassment 64 20
Indicator 2015 2014
Generation diversity
UNDER 26 26-40 40-55 OVER 55
50.0%
40.0%
30.0%
20.0%
10.0%
0.0%
BREAKDOWN OF EMPLOYEES BY AGE
9.8% 10.0%
35.7% 35.3%
41.3% 41.2%
13.2% 13.5%
20142015
16
SAINT-GOBAIN – CSR RESULTS 2015
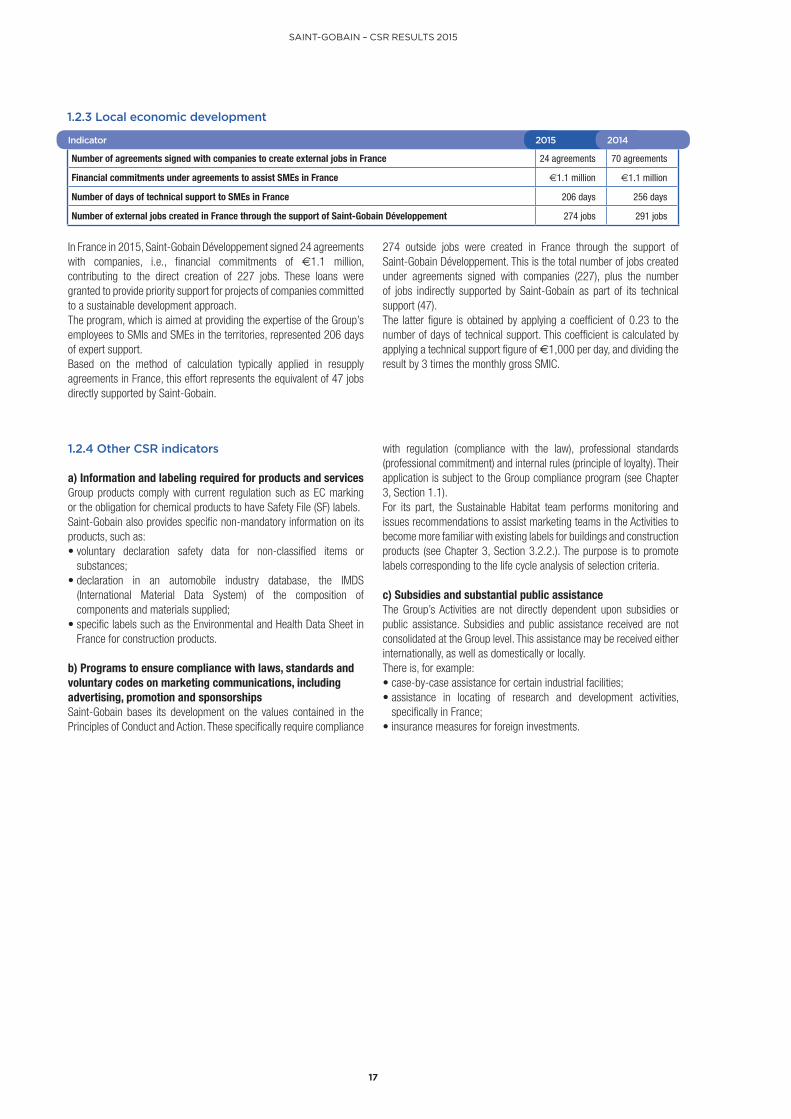
Local structureInternational activities are performed by the creation of local teams, allowing Saint-Gobain to constantly adapt to the specific needs of each country.
Number of women who took maternity leave 413
Number of women who took parental leave 173
Number of men who took paternity leave 1 064
Number of men who took parental leave 15
Parental leave in France in 2015
DisabledThe integration and retention of disabled workers is an important topic for Saint-Gobain. Disabled workers represent 1.7% of the Group’s employees and 4.1% of employees subject to Agefiph (a French government agency promoting the employment of disabled people) contributions in France (i.e. 1,325 employees).In France, 172 jobs were moreover fitted out for disabled in partnership with the occupational physician, and in certain cases with Agefiph.
Reported harassment incidents Group companies report all incidents of harassment, whether or not they have been the subject of a complaint, are in the process of judgment, or have been characterized as such. In 2015, 64 harassment incidents were recorded, 63 of which were subject to the filing of a legal complaint. 61 complaints were still being investigated by the local jurisdictions. Each incident is monitored and addressed by the companies in question. The General Delegations and companies also implement specific measures to raise awareness, specifically by distributing charters, codes of conduct and training in the challenges of diversity.
Group Savings PlanThe Group Savings Plan (Plan d’Épargne du Groupe, “PEG”) represents an excellent means of giving employees a stake in the Group’s success and profits (see Chapter 7, Section 2.3).
Employee profit-sharing and interestsIn France, virtually all shareholders (98.6%) in 2015 were covered a collective profit-sharing agreement (2014: 99.0%). €49 million was paid to employees as profit-sharing, and €28 million as interests, representing 5.3% of the payroll concerned.
The Group takes care to ensure there is a balance between the professional and personal lives of its employees. As part of its parental leave policy, Saint-Gobain encourages employees to return to their jobs under the best possible conditions.
f) Benefits
NON-MANAGERIAL JUNIOR MANAGERIAL
EXPERIENCED MANAGERIAL
SENIOR MANAGERS
1
0.8
0.6
0.4
0.2
0.0
GENDER WAGE GAP IN FRANCE
Source: PeopleGroup
GERMANY
POLA
ND
BRAZILCHINA
INDIA
100.0%
80.0%
60.0%
40.0%
20.0%
0.0%
LOCAL NATIONALS AMONG STAFF IN 5 COUNTRIES WHERE THE GROUP IS OPERATING
2015
Number of employees (or former employees) participating in the Group Savings Plan over 90,000 over 90,000
Proportion of shares held by Group employees 7.6% 7.5%
Percentage of voting rights held by Group Savings Plan funds 11.9% 11.8%
Number of countries participating in the Group Savings Plan 43 42
Proportion of employees covered by profit-sharing agreement in France 98.6% 98.8%
Indicator 2015 2014
G4-EC6, G4-LA13, G4-HR3
17
SAINT-GOBAIN – CSR RESULTS 2015
1.2.3 Local economic development
In France in 2015, Saint-Gobain Développement signed 24 agreements with companies, i.e., financial commitments of €1.1 million, contributing to the direct creation of 227 jobs. These loans were granted to provide priority support for projects of companies committed to a sustainable development approach.The program, which is aimed at providing the expertise of the Group’s employees to SMIs and SMEs in the territories, represented 206 days of expert support.Based on the method of calculation typically applied in resupply agreements in France, this effort represents the equivalent of 47 jobs directly supported by Saint-Gobain.
274 outside jobs were created in France through the support of Saint-Gobain Développement. This is the total number of jobs created under agreements signed with companies (227), plus the number of jobs indirectly supported by Saint-Gobain as part of its technical support (47).The latter figure is obtained by applying a coefficient of 0.23 to the number of days of technical support. This coefficient is calculated by applying a technical support figure of €1,000 per day, and dividing the result by 3 times the monthly gross SMIC.
1.2.4 Other CSR indicators
a) Information and labeling required for products and servicesGroup products comply with current regulation such as EC marking or the obligation for chemical products to have Safety File (SF) labels.Saint-Gobain also provides specific non-mandatory information on its products, such as:• voluntary declaration safety data for non-classified items or
substances;• declaration in an automobile industry database, the IMDS
(International Material Data System) of the composition of components and materials supplied;
• specific labels such as the Environmental and Health Data Sheet in France for construction products.
b) Programs to ensure compliance with laws, standards and voluntary codes on marketing communications, including advertising, promotion and sponsorshipsSaint-Gobain bases its development on the values contained in the Principles of Conduct and Action. These specifically require compliance
with regulation (compliance with the law), professional standards (professional commitment) and internal rules (principle of loyalty). Their application is subject to the Group compliance program (see Chapter 3, Section 1.1).For its part, the Sustainable Habitat team performs monitoring and issues recommendations to assist marketing teams in the Activities to become more familiar with existing labels for buildings and construction products (see Chapter 3, Section 3.2.2.). The purpose is to promote labels corresponding to the life cycle analysis of selection criteria.
c) Subsidies and substantial public assistanceThe Group’s Activities are not directly dependent upon subsidies or public assistance. Subsidies and public assistance received are not consolidated at the Group level. This assistance may be received either internationally, as well as domestically or locally.There is, for example:• case-by-case assistance for certain industrial facilities;• assistance in locating of research and development activities,
specifically in France;• insurance measures for foreign investments.
Number of agreements signed with companies to create external jobs in France 24 agreements 70 agreements
Financial commitments under agreements to assist SMEs in France €1.1 million €1.1 million
Number of days of technical support to SMEs in France 206 days 256 days
Number of external jobs created in France through the support of Saint-Gobain Développement 274 jobs 291 jobs
Indicator 2015 2014