Embed Size (px)
Citation preview
Loughborough UniversityInstitutional Repository
Crystal plasticity modellingof cyclic deformation for apolycrystalline nickel based
superalloy at hightemperature
This item was submitted to Loughborough University's Institutional Repositoryby the/an author.
Citation: LIN, B. ... et al., 2010. Crystal plasticity modelling of cyclic deforma-tion for a polycrystalline nickel based superalloy at high temperature. MaterialsScience and Engineering A: Structural Materials: Properties, Microstructureand Processing, 527 (15), pp. 3581 - 3587.
Additional Information:
• This article was published in the journal, Materials Science and En-gineering: A [ c© Elsevier] and the definitive version is available at:http://dx.doi.org/10.1016/j.msea.2010.02.045
Metadata Record: https://dspace.lboro.ac.uk/2134/10991
Version: Accepted for publication
Publisher: c© Elsevier
Please cite the published version.
This item was submitted to Loughborough’s Institutional Repository (https://dspace.lboro.ac.uk/) by the author and is made available under the
following Creative Commons Licence conditions.
For the full text of this licence, please go to: http://creativecommons.org/licenses/by-nc-nd/2.5/
1
Crystal Plasticity Modeling of Cyclic Deformation for a Polycrystalline
Nickel-Based Superalloy at High Temperature
B. Lin1, L.G. Zhao
1*, J. Tong
1, H.-J. Christ
2
1Department of Mechanical and Design Engineering, Anglesea Building, Anglesea Road
University of Portsmouth, Portsmouth, PO1 3DJ, The UK.
2The Institute of Materials Technology, University of Siegen, D-57068 Siegen, Germany.
Abstract
Cyclic deformation at elevated temperature has been modeled for a polycrystalline
nickel-based superalloy using the crystal-plasticity constitutive formulations. Finite element
analyses were carried out for a Representative Volume Element (RVE), consisting of
randomly oriented grains and subjected to periodic boundary constraints. Model parameters
were determined by fitting the strain-controlled cyclic test data at 650°C for three different
loading rates. Simulated results are in good agreement with the experimental data for both
stress-strain loops and cyclic hardening behavior. The model was utilized to predict the stress
relaxation behavior during the hold periods at the maximum and minimum strain levels, and
the prediction compares well with the experimental results. Localized stress and strain
concentrations were observed due to the heterogeneous nature of grain microstructure and the
mismatch of the mechanical properties of individual grains.
Keywords: Crystal plasticity, Cyclic deformation, Finite element, Representative volume
element, Heterogeneous deformation.
2
1. Introduction
At grain level, polycrystalline metals possess anisotropic plastic response during deformation
due to the random orientation of grain lattices. The physically-based crystal plasticity theory
has been successful for description of anisotropic deformation of single crystals and
polycrystals, including body-centered-cubic [1, 2], face-centered-cubic [3, 4] and
highly-closed-packed [5, 6] lattice structures. With the assistance of finite element method,
the theory is able to predict the global and local stress-strain response [1-3, 5-7], the
evolution of crystallographic grain texture [1, 4] and micro-structural crack nucleation [8-10]
in polycrystalline materials under monotonic, creep and fatigue loading conditions. The
essence of the crystal plasticity is to resolve the macroscopic stresses onto each slip system
following the Schmid’s law, where the shear strain rate can be expressed as a function of the
resolved shear stress [11]. Power law [2, 4-7, 10, 11], and exponential functions [1, 3, 8, 12]
are most commonly adopted in the formulation. Internal variables are also generally
introduced to represent the evolution of the micro-structural state during the deformation
process, such as the effects of dislocation interactions, hardening and strain gradient
phenomena [13, 14].
Nickel-based superalloys are used for rotating turbine blades and discs in the hot section of
gas turbine engines due to their exceptional high temperature mechanical properties. The
crystal plasticity theory has been applied for creep [15, 16], fatigue [15, 17],
thermal-mechanical fatigue [15], indentation deformation [18] and gradient-dependent
deformation [13, 14] analyses of single crystal nickel superalloys. Application of the theory
3
has also been extended to model stress-strain response and fatigue crack nucleation for
polycrystalline nickel superalloy [9, 19] where microstructure was considered as one of the
major factors influencing the fatigue and creep properties of the material. For instance,
Dunne et al. [9] used a simplified crystal plasticity model to study the low cycle fatigue crack
nucleation in a directionally solidified nickel alloy. The experimentally observed sites of
crack nucleation near a free surface match those of the persistent slip bands predicted from
the crystal plasticity model. Shenoy et al. [19] formulated a rate-dependent
microstructure-sensitive crystal plasticity model for correlating the mechanical behavior of a
polycrystalline Ni-based superalloy IN 100 at 650°C. The model has the capability to capture
the first order effects on the stress-strain response due to grain size, precipitate size
distribution, precipitate volume fraction and dislocation density for each slip system.
Alloy RR1000 studied here is one of the new generation polycrystalline nickel alloys,
developed at Rolls Royce, to meet the demand of increasing turbine entry temperatures and
rotational speeds for the latest Trent1000 aero-engines, which have been used to power the
new Boeing 787 aircrafts. The material was produced through a powder metallurgy route and
has a fine grain microstructure. In this study, the crystal-plasticity theory has been applied to
model the cyclic deformation for alloy RR1000 at 650°C in order to provide a
micro-mechanics based understanding of the material deformation and failure behavior at
grain level. The paper will present a description of the constitutive model in Section 2,
together with the formulations of internal variables. Section 3 gives the details of the RVE
construction at the grain level and the periodic boundary conditions required for finite
4
element analyses. Application of the constitutive model to alloy RR1000 and determination
of model parameters are given in Section 4, where parameter values were calibrated using
extensive finite element analyses to fit the measured stress-strain response of alloy RR1000
subjected to strain-controlled cyclic loading history. In Section 5, we present the simulated
results, including the fitted cyclic stress-strain response and the predicted stress relaxation
behavior during strain hold periods. Discussions were made regarding the heterogeneous
stress and strain distributions within the RVE and the mechanical behavior of individual
grains, followed by the conclusions.
2. Crystal plasticity constitutive model
The framework of crystal plasticity theory relies on the multiplicative decomposition of the
total deformation gradient F into an elastic (Fe) part and a plastic (F
p) part [11]:
pe
FFF = (1)
where Fe represents the elastic stretching and rigid-body rotation of the crystal and F
p
describes crystallographic slip along slip planes due to dislocation motion.
The component Fp is calculated from the inelastic velocity gradient [11]:
)(1
1 αα
α
αγ nmFFLn
ppp ⊗∑===
−&&
(2)
where αγ& is the shear strain rate on the slip system α, α
m and α
n are the slip direction
and the slip plane normal, respectively.
The flow rule is expressed in terms of two scalar state variables per slip system, slip
5
resistance (Sα) and back stress (B
α) [12]:
)sgn(/ˆ
/1exp
00
00
0
αα
ααα
α τµµτ
µµτ
κθγγ B
SBF
qp
−
−−
−−
= && (3)
where κ is the Boltzmann constant, τα is the resolved shear stress on the slip system α, θ the
absolute temperature, µ and µ0 the shear moduli at θ and 0 Kelvin, respectively, and F0, 0τ̂ , p,
q and 0γ& are material constants. The brackets imply that xx =⟩⟨ for 0>x and 0=⟩⟨x
for 0≤x .
The two internal variables, the slip resistance in each slip system, Sα, and the back stress, B
α,
are introduced at the slip system level, which represent the state associated with the current
dislocation network. The slip resistance on a generic slip system, associated with the
dislocation density along that slip system, is assumed to evolve according to the following
relation, starting at an initial value of 0S [15]:
[ ] αααα γ&& )( 0SSdhS DS −−= , (4)
where the first and second terms are static and dynamic recovery terms associated with the
material constants hS and dD, respectively.
The back stress is representative of the internal stress state arising due to dislocations bowing
between obstacles, either precipitates or other dislocations. The back stress evolves according
to a standard hardening-dynamic recovery format [15]:
αααα γγ &&& BrhB DB −= , (5)
6
where hB is a hardening constant, and rD is a dynamic recovery function which depends on
the constant value of the slip resistance and introduces the inherent dependency between the
slip resistance and back stress, which may be expressed as [12]:
1
00
−
−′
= µλ
µµα
c
BD
fS
hr , (6)
where fc is a coupling parameter between the internal slip variables and 0µ ′ the local slip
shear modulus at 0 Kelvin.
The crystallographic formulation was implemented numerically into the finite element (FE)
code ABAQUS [20] within the framework of large strain kinematics via a user-defined
material subroutine (UMAT), where the fully implicit (Euler backward) integration algorithm
was adopted [13, 14].
3. Finite element model
Polycrystalline alloy RR1000 may be viewed as an aggregation of single crystal grains with
random orientations, as shown in Fig.1a (from [21]), where the color designates
crystallographic orientation. The material has a fine grain structure with an average size of
4.76µm. To study the mechanical deformation at the grain level, a representative volume
element (RVE) consisting of a sufficient number of grains is necessary to statistically
represent the global material behavior. The RVE approach is capable of accounting for
equilibrium and compatibility in the microscopically heterogeneous structure. In the present
work, a two-dimensional geometry of grain microstructure was constructed using the Voronoi
7
tessellation technique [22], where the Sobol sequence [22] was used to generate the Voronoi
seeds randomly with an average grain size of 4.76µm. The coordinates of the vertices of the
Voronoi tessellations were used as the inputs in ABAQUS CAE [20], which were then
connected to generate the FE model of the polycrystalline grain microstructure. Each grain
was assumed to have a randomly assigned in-plane orientation [23, 24].
To realize repetitive deformation of the RVE, periodic boundary conditions are applied,
which enforce parallel deformation of opposite edges [25, 26], as sketched by dashed lines in
Fig.1b. The periodic boundary conditions were implemented in ABAQUS [20] by using the
multiple constraints option. To remove the rigid body motion, the vertex A was fixed in both
x and y directions, and B and C were fixed in the x and y direction, respectively.
Displacement was applied to vertex B in the y-direction to simulate the uniaxial
strain-controlled loading condition. To obtain the global response of the material,
homogenization based on averaging theorem over the RVE area was adopted to make the
transition from micro- to macro-variables of the RVE [27], which was programmed into a
post-processing numerical subroutine using computer language FORTRAN and interfaced
with ABAQUS [20].
To adequately describe the mechanical properties of a polycrystalline material, the size of the
RVE needs to be large enough to contain a sufficient number of grains. A series of FE
analyses were performed to assess the RVE size based on the convergence of stress-strain
curves. Five RVEs, containing 50, 100, 150 and 200 grains respectively, were created for the
8
FE analysis under monotonic tensile loading condition up to 5% strain at a strain rate of
0.005%/s. The results in Fig.2a show that the convergence of stress-strain curve is well
achieved at 150 grains, which is slightly more than the estimated 120 grains from the
anisotropic stiffness values of the material [28]. Further FE analyses also confirmed that, for
150 grains, the effects of random orientations on the stress-strain curves become negligible
(see Fig.2b).
The FE mesh consists of 1450 first-order four-node plane-strain elements with four Gauss
integration points (see Fig.1c) and a mesh-sensitivity study shows that the stress-strain curves
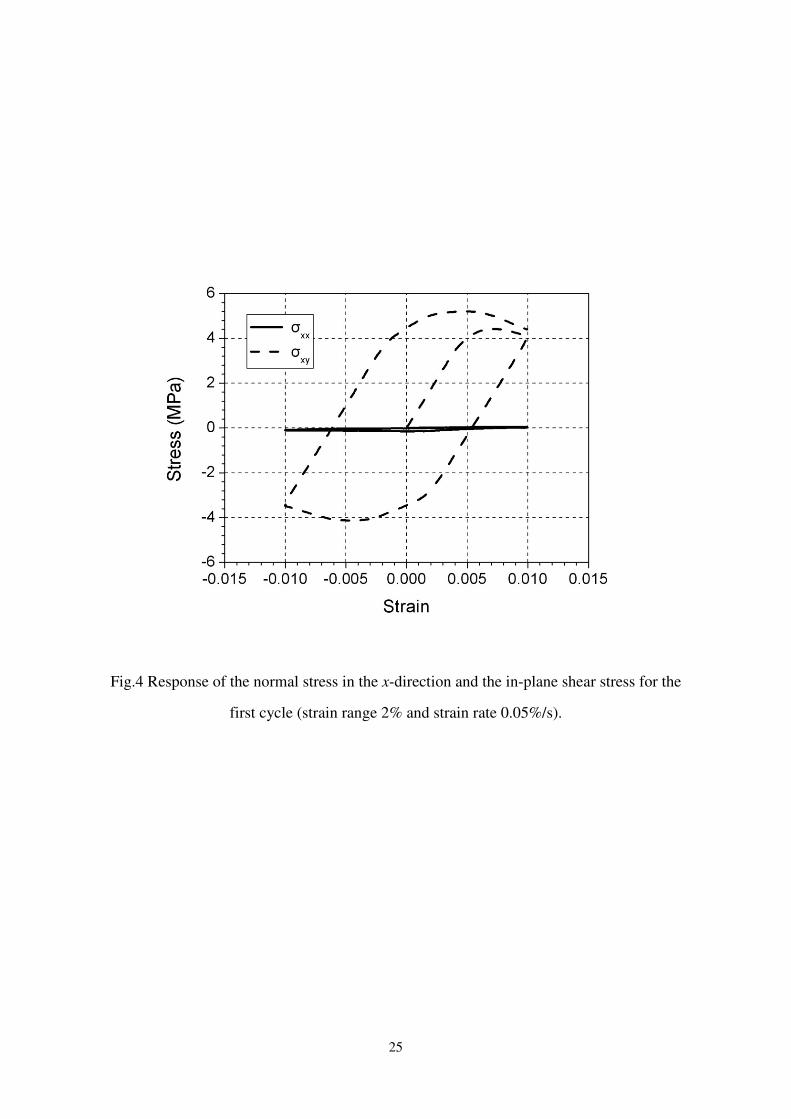
have reached a good convergence for the 1450-element mesh (see Fig.3). It was also verified
that the global stress in the x-direction and the global in-plane shear stress are negligible (see
Fig.4), which confirms the predominant uniaxial strain-controlled loading condition of the
RVE in the y-direction. In what follows, FE analyses were performed for the RVE with 150
grains and 1450 elements to evaluate the global and local cyclic deformation for alloy
RR1000 at 650°C.
A convergence study was also carried out at grain level, where both the stress/strain
distribution of the RVE and the stress-strain response for given grains (i.e., grain 1~4 in
Fig.12) were examined for three different meshes (921, 1450 and 4315 elements,
respectively). The results showed that a very good local convergence has been achieved for
the 1450-element mesh.
9
It should be pointed out that the RVE shown in Fig.1c does not satisfy the geometrical
periodicity [22], rather, the RVE represents the random nature of the microstructure of the
material (see Fig.1a). Nevertheless, FE analyses have been carried out for a RVE with
geometrical periodicity, and the results are almost identical to those presented in this work.
As long as a sufficient number of grains is contained in the RVE (150 grains for our case),
either model (i.e., with or without geometrical periodicity) can be used in the FE analyses.
4. Determination of model parameters
Both back stress B and slip resistance S were included in the formulation of the crystal
plasticity model, where 12 octahedral and 6 cubic slip systems were considered.
Consequently, a number of model parameters were introduced and need to be determined.
Model parameters were determined through extensive FE analyses using the complete
histories of cyclic experimental data at three different strain rates, following the procedures
below.
Anisotropic stiffness constants were first evaluated by simulating the elastic response of the
material from the FE analysis of the RVE subjected to monotonic loading. The constants were
taken as C11 = 166.2 GPa, C12 = 66.3 GPa and C44 = 138.2 GPa, which are close to those for a
nickel single crystal superalloy [15]. Using these elastic constants, FE analysis of the RVE
give a global Young’s modulus of 190 GPa for alloy RR1000 at 650°C, which matches the
experimental measurement [29].
10
The crystal-plasticity model was then calibrated by fitting the stress-strain response of the
strain-controlled cyclic tests at three different strain rates (0.5%/s, 0.05%/s and 0.005%/s)
[29]. Prior to the fitting process, some material constants, namely, F0, 0τ̂ , p, q and 0γ& , were
estimated from the literatures. For instance, the full model parameters are already available
for CMSX4 nickel single crystals [13-15], which serve as a general guideline on the initial
estimations. Following each simulation, the resulting stress values at each strain point were
compared with the experimental data, the magnitude of the difference was considered in an
error function (objective function) over the history. Optimization was carried out until the
error was minimized.
The calibration of material constants also involves certain constraints, which were imposed as
ranges of target values based on published work. For example, the value of p and q were
recommended to be 0 < p < 1 and 1 < q < 2 [1], which greatly facilitated the calibration
process. Also, to improve the efficiency of the fitting process, a sensitivity analysis of
parameters with respect to the stress-strain response was conducted in the first stage of
calibration. Given all of the crystal plasticity parameters that needed to be calibrated, it is
known that some of them have specific influence on the stress-strain response, such as that
the parameters p and q mainly influence the shape of the loops.
The whole process began with fitting the monotonic stress-strain curves and the first cyclic
loops for all three loading rates. During this process, the main target was to identify the
material parameters p, q and 0τ̂ , which control the rate sensitivity, and work out their sensible
11
values. Then efforts were made to improve the cyclic hardening simulation, which involves
re-calibration of some of the critical material parameters which control the cyclic hardening
behavior. In this process, the major influencing parameters were found to be a combination of
the parameters fC and hS. Extensive FE analyses were carried out to work out the best
parameter values which give a good description of material hardening behavior. Cyclic
hardening behavior is of great importance for materials under cyclic deformation, which has
been captured very well in continuum viscoplasticity simulation [29, 30]. In crystal plasticity,
simulation of cyclic hardening is a difficult task for polycrystalline materials, which has been
tackled in the present work through extensive FE analyses in the fitting process. The final
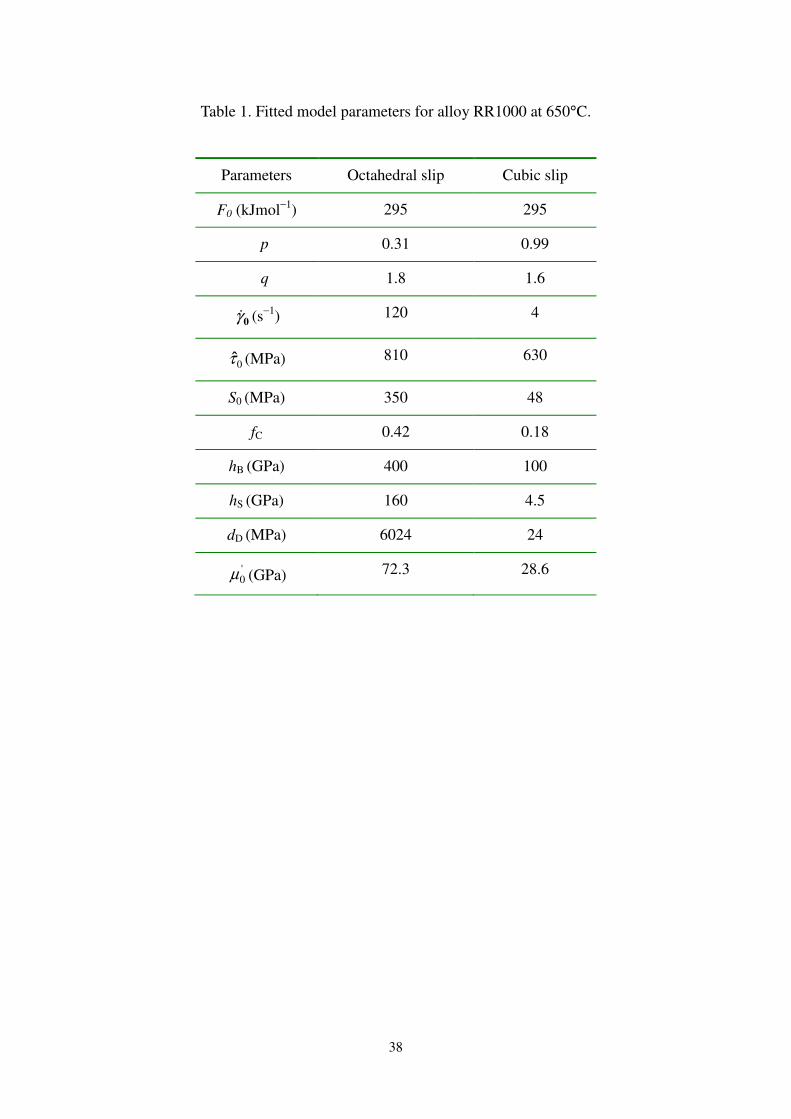
parameter values determined by the fitting process are listed in Table 1 for both octahedral
and cubic slip systems. Other fitted parameters include the coefficient λ = 0.85 and the shear
modulus at 0 Kelvin µ0 = 192 GPa.
5. Results and discussion
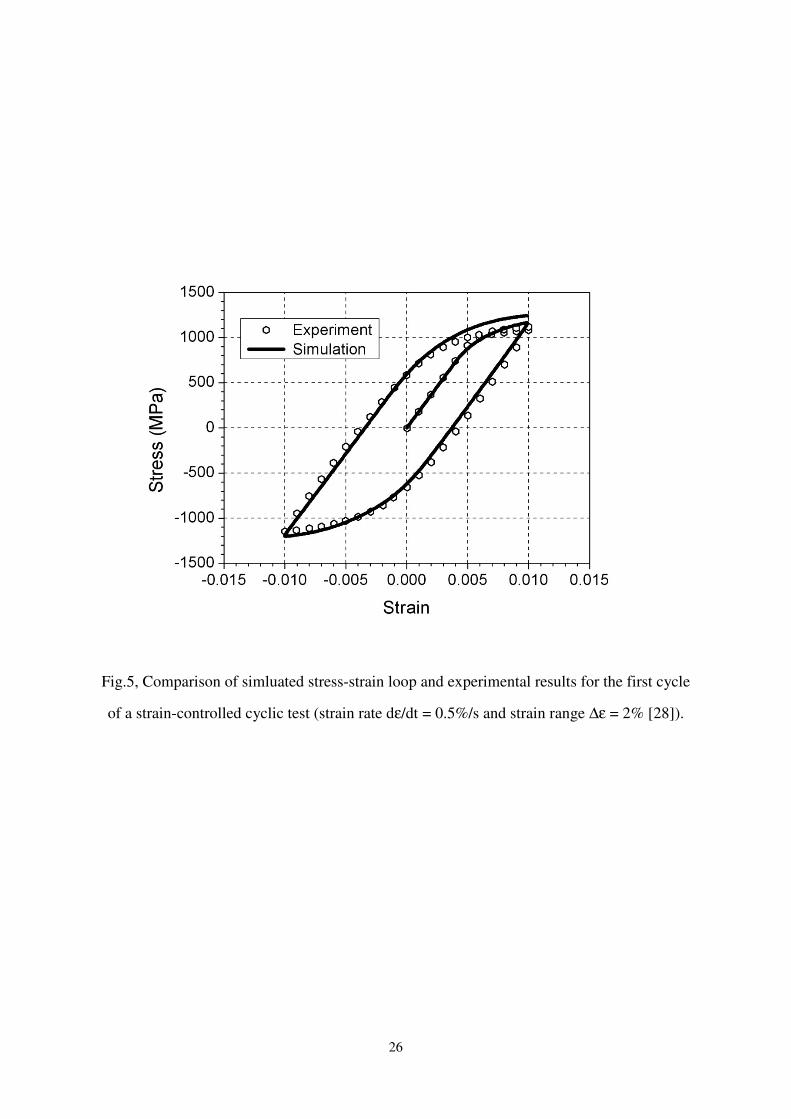
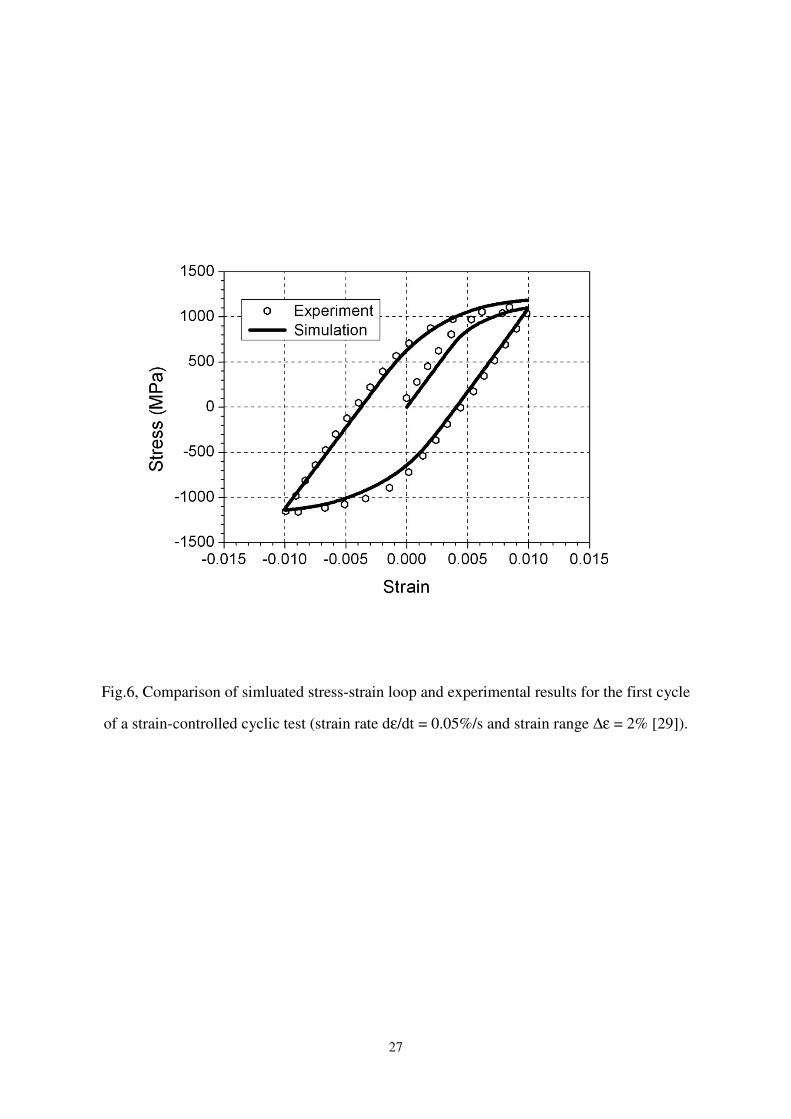
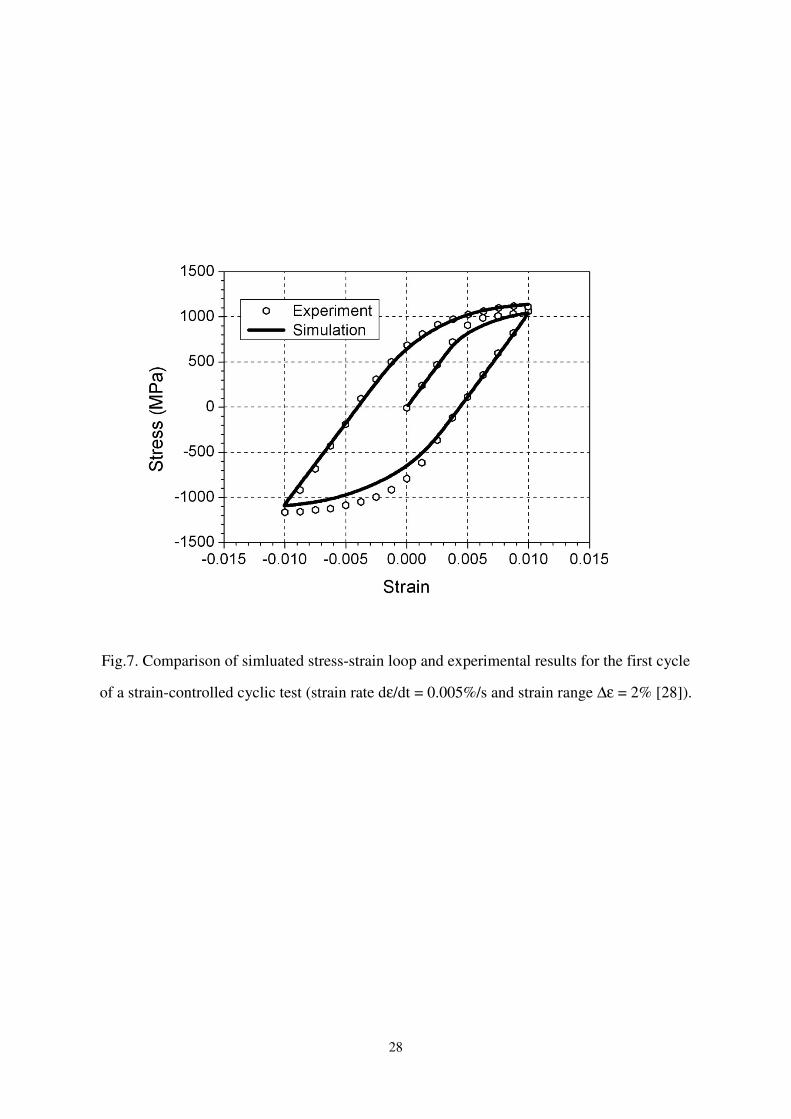
The simulated stress-strain response for monotonic and the first cycle of fatigue loading are
shown in Figs.5 to 7 for three different strain rates, with a direct comparison against the
corresponding experimental data [29, 30]. Clearly, the model simulations agree very well
with the test data for all three cases. The stress response and the shape of hysteresis loops
were both well captured by the crystal-plasticity-based FE analysis of the RVE.
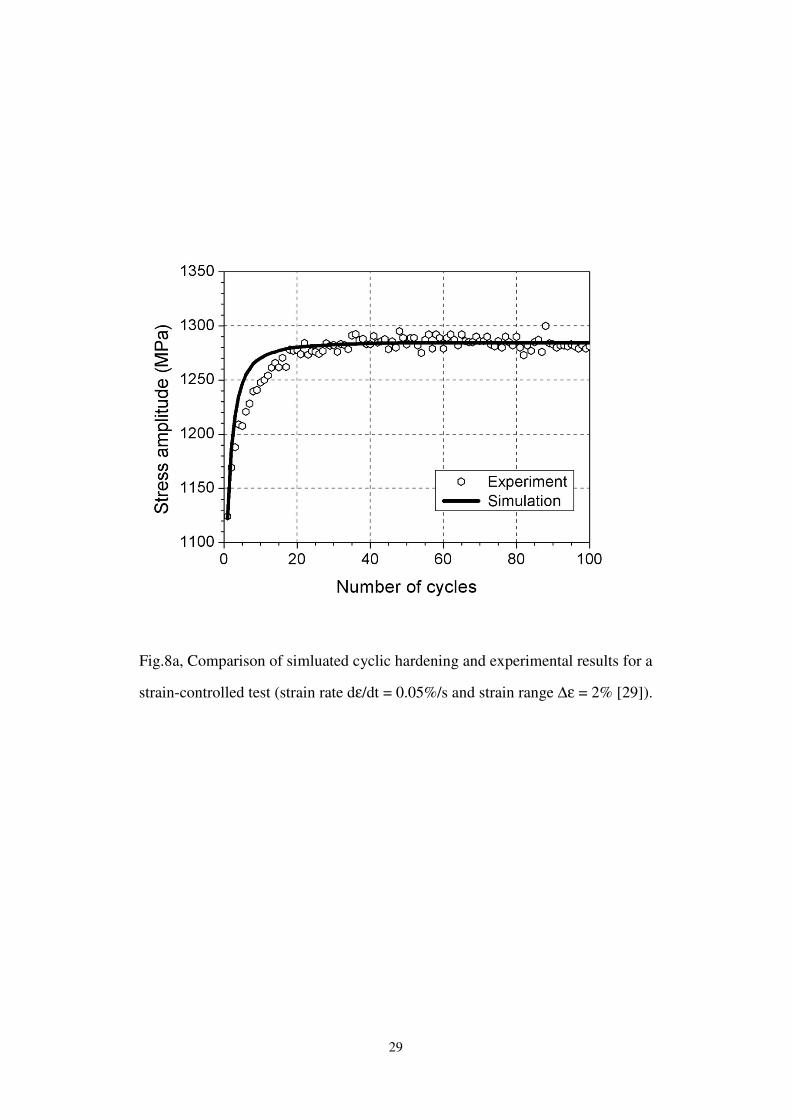
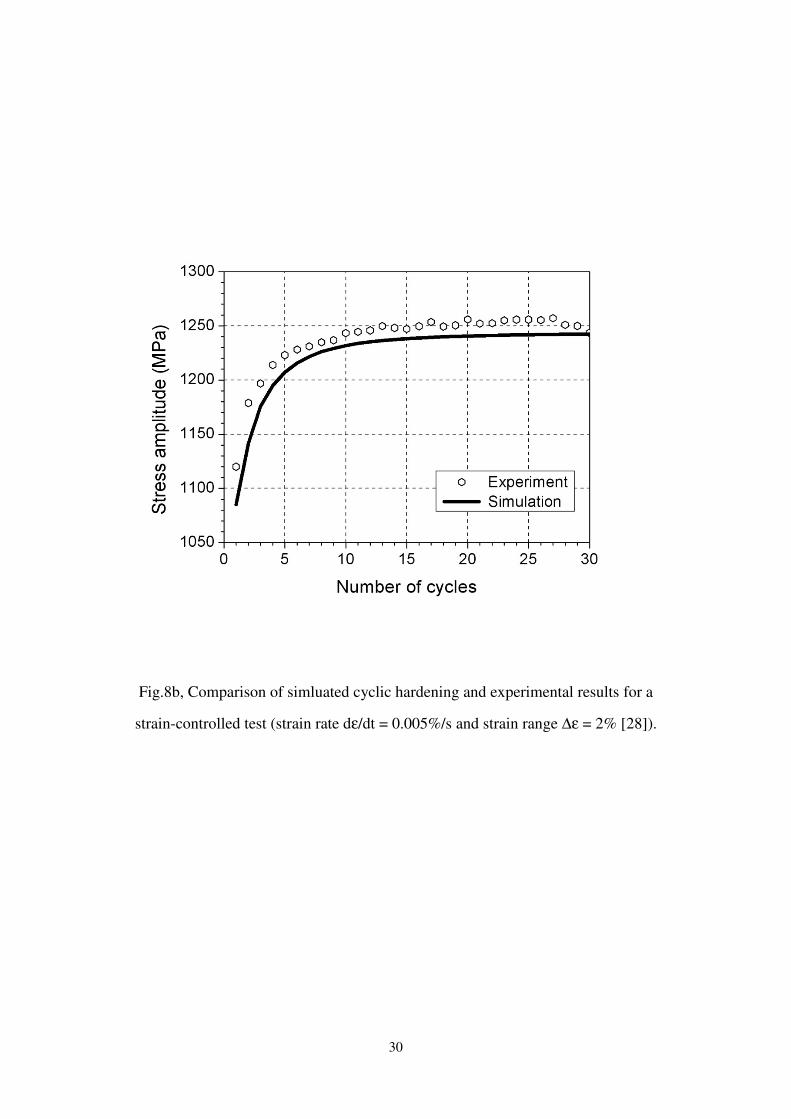
Cyclic hardening behavior was presented in Fig.8a and b by plotting the stress amplitude as a
function of the number of cycles for two different strain-loading rates (0.05%/s and
12
0.005%/s). Test data [29, 30] were included for a direct comparison, where a good match is
clearly demonstrated for both strain-loading rates. For the nickel alloy RR1000, cyclic
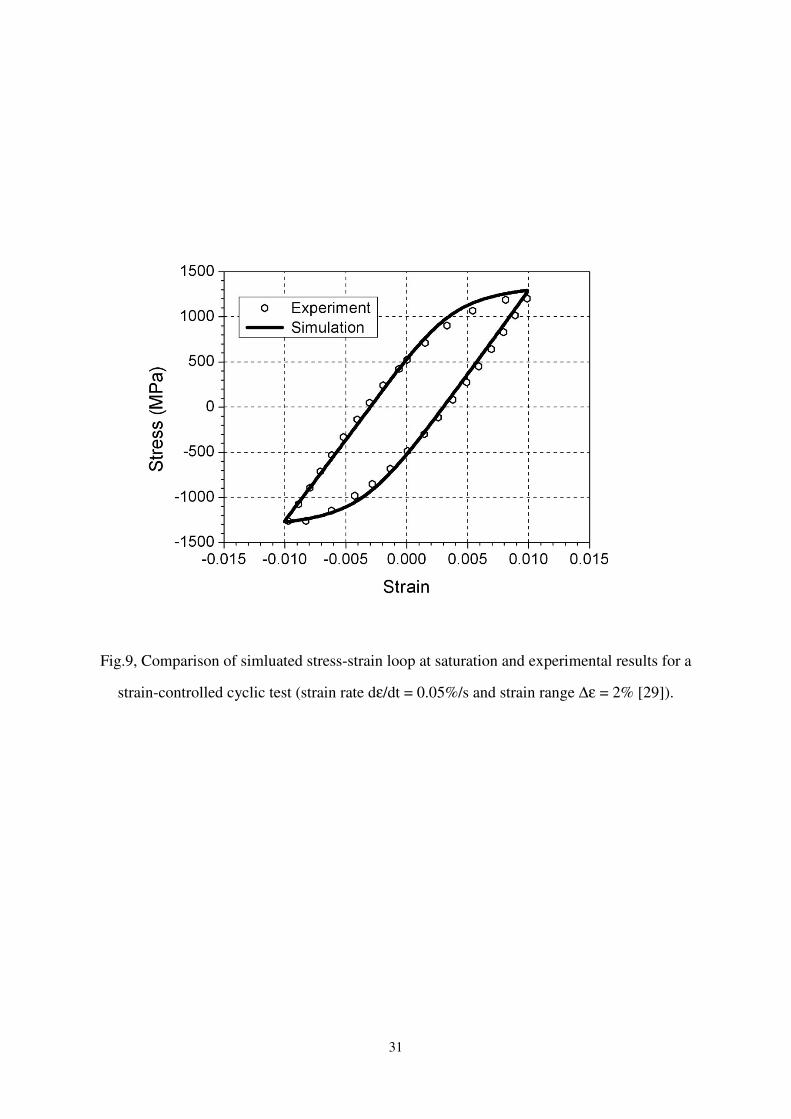
deformation seems to reach saturation after about 30 cycles. As shown in Fig.9, simulated
stress-strain loop at saturation also agrees very well with the experimental results.
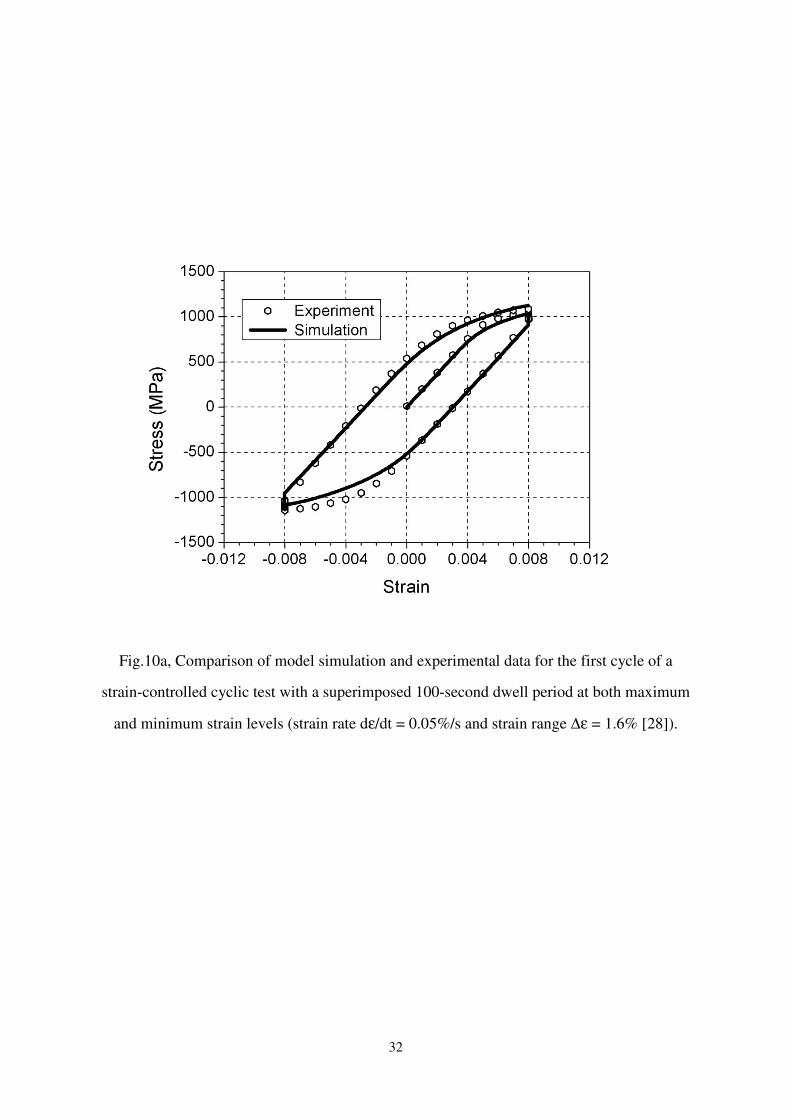
As an independent evaluation of the model, the same parameters were used to run simulations
for cyclic uniaxial strain-controlled histories with 100-second hold time superimposed at both
the maximum and minimum strain levels (strain range 1.6% and strain rate 0.05%/s). The
resulting stress-strain predictions and the stress relaxation during the strain hold periods are
shown in Fig.10a and b, which are again in good agreement with experimental data [29].
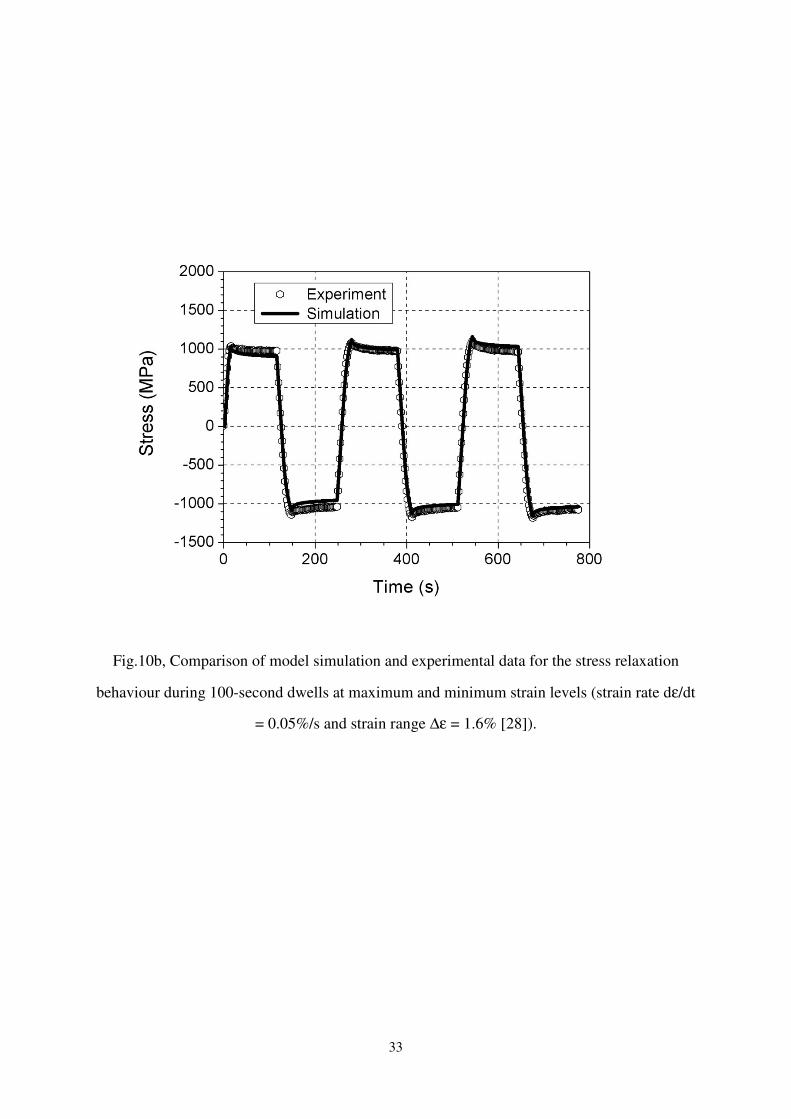
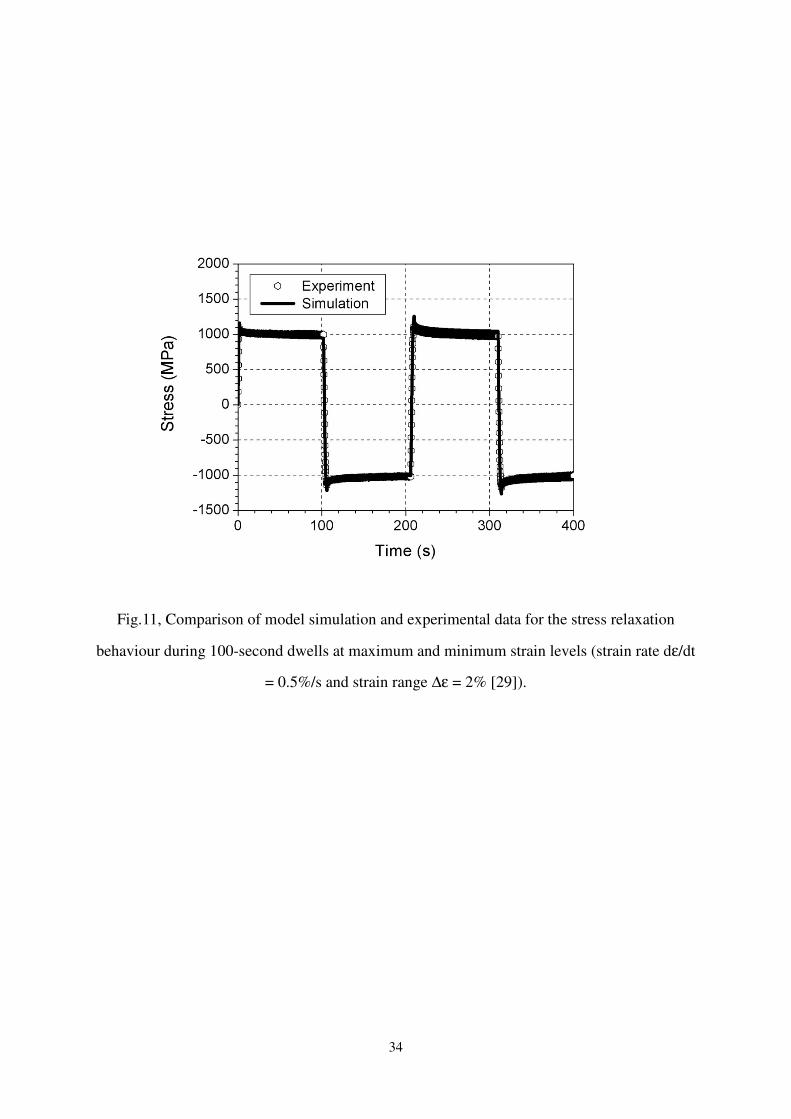
Simulation was also given for the stress relaxation behaviour during a 100-second hold
period for a strain range of 2% and strain rate of 0.5%/s. Again good agreement with the
experimental data[29] is obtained.
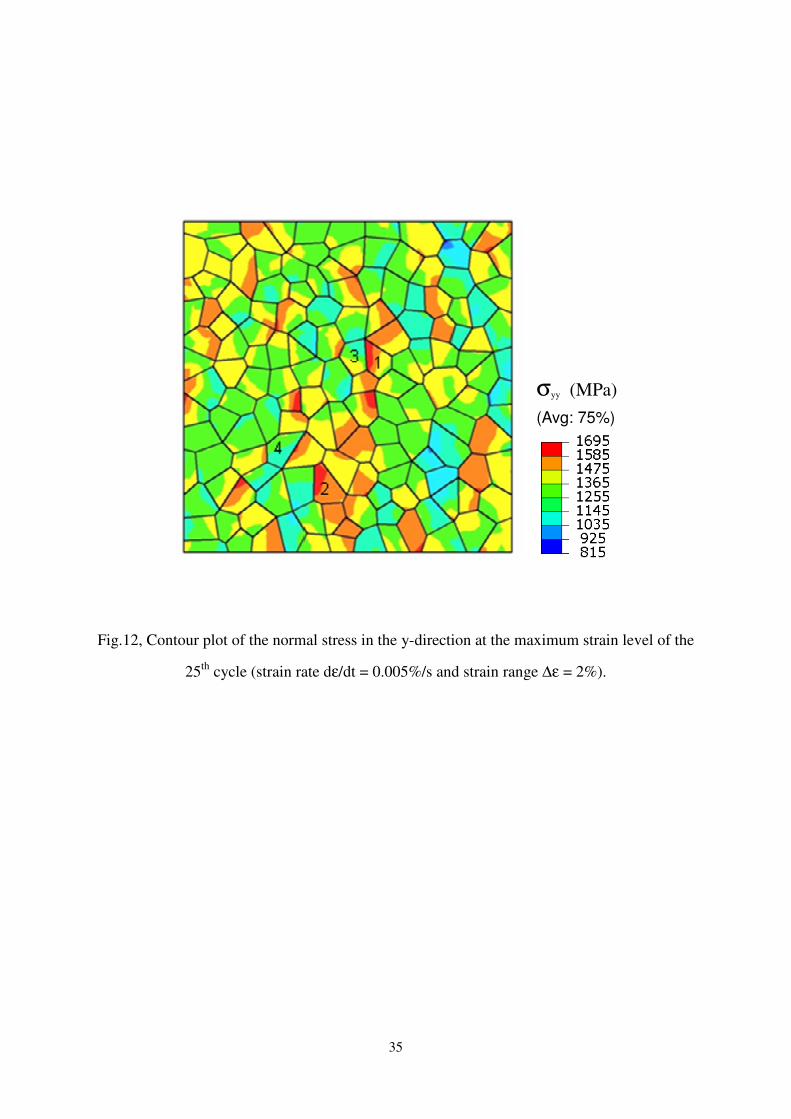
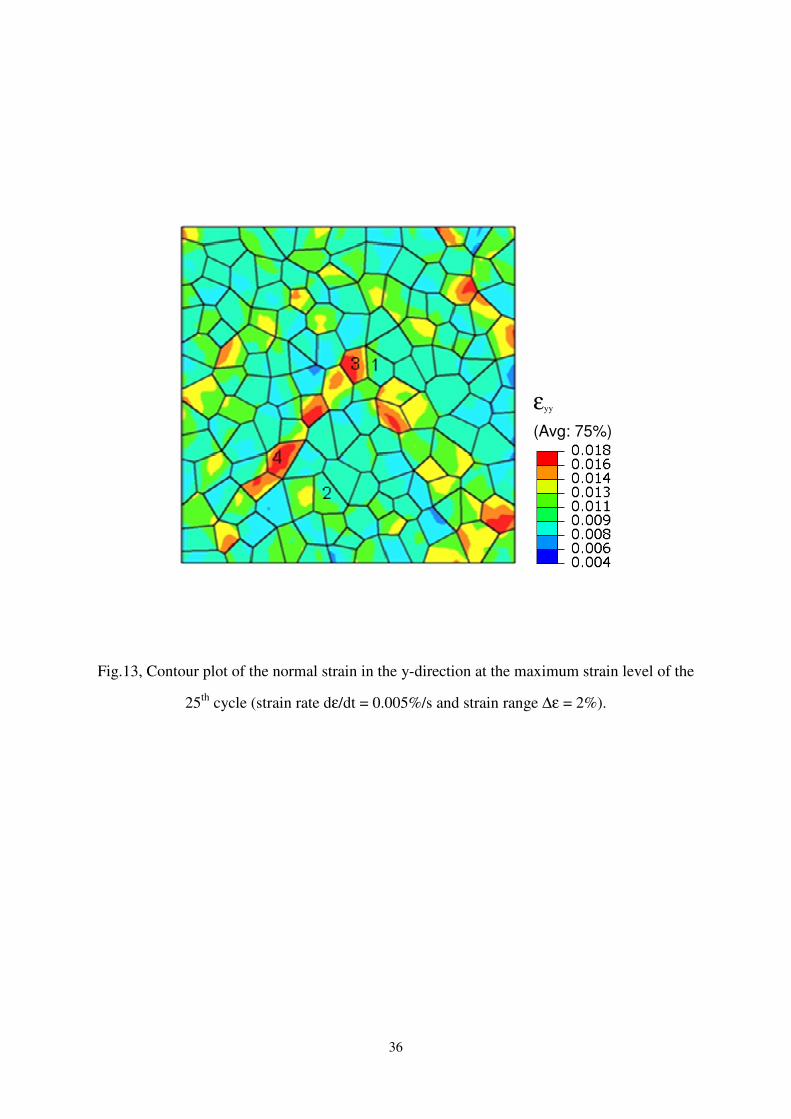
Figs.12 and 13 show the contour plots of the normal stress and strain in the y-direction at the
maximum strain level of the 25th
cycle (saturation stage) for the 0.005%/s loading rate case
(see Figs.7 and 8b), where heterogeneous stress and strain distributions can be clearly
observed. The maximum value of the local stress is about 1.4 times the global stress and the
maximum local strain is about 1.7 times the global strain. The pattern of stress concentration
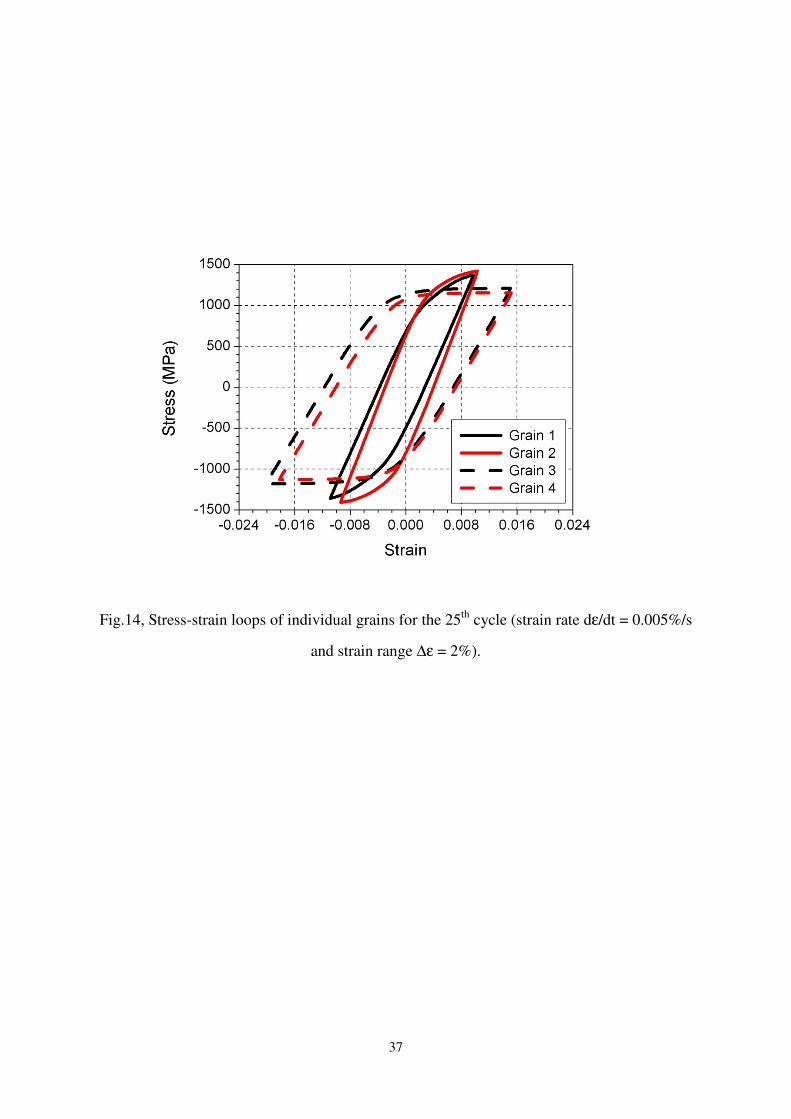
differs from that of strain concentration. Further investigations indicate that the highest strain
concentrations are located within the “soft” grains, which have low strain hardening in the
stress-strain response (see Fig.14). On the other hand, the highest stress concentrations are
13
typically located within the “hard” grains, which have high strain hardening in the
stress-strain response (see Fig.14). As demonstrated in Fig.14, the stress-strain loops are
much wider for the soft grains than those for the hard grains, indicating more inelastic
deformation in the soft grains.
A close inspection of Fig.12 and 13 shows that the hard grains with high stress concentration
tend to neighbor with the soft grains which have high strain concentration. This arrangement
of neighboring hard and soft grains introduces large mismatches of deformation and
generates pronounced stress and strain concentrations between the neighboring grains
[31-33]. Overall, the stress and strain heterogeneities remain similar for all three cyclic
loading histories. Specifically, strain concentrations are consistently located within the soft
grains while stress concentrations occur in the hard grains, which is also true for other sets of
randomly assigned grain orientations. Also, most stress and strain concentrations are located
at the triple or multiple points due to the mismatch of the mechanical properties of multiple
grains. The local convergence study shows that these are characteristics of the microstructure
and not artifacts of the finite element simulation.
6. Conclusions
Crystal plasticity modeling of cyclic deformation has been presented for a polycrystalline
nickel-based superalloy at elevated temperature. An RVE, consisting of a number of
randomly oriented single crystal grains, has been constructed using the Voronoi tessellation
and meshed for finite element analyses under periodic boundary constraints. The model
14
parameters were determined from strain-controlled cyclic test data at 650°C for different
loading rates using a fitting process. Simulations using fitted parameters showed good
agreement with experimental data for both stress-strain loops and cyclic hardening behavior.
The model predicted well the stress relaxation behavior during strain hold period.
Stress and strain contour plots of the deformed RVE showed heterogeneous distribution due
to orientation mismatch between neighboring grains. Strain concentrations are basically
located within soft grains, while stress concentrations are localized within hard grains,
particularly at the grain boundaries next to soft grains.
Acknowledgements
This work is funded by the EPSRC of the UK (grant EP/E062180/1) and in collaboration
with Rolls-Royce plc (Dr Mark Hardy). LGZ acknowledges the support from the Royal
Society and the Leverhulme Trust of the UK for a Senior Research Fellowship. We also
acknowledge the support by the Royal Society of the UK through a Joint International
Research Grant between the University of Portsmouth and the University of Siegen. The
UMAT was originally developed by Professor Esteban Busso and his associates while he was
with the Imperial College, London.
References
[1] M. Kothari, L. Anand, J. Mech. Phys. Solids 46 (1998) 51-83.
[2] M. Kavač, L. Cizelj, Nucl. Eng. Des. 235 (2005) 1939-1950.
15
[3] S. Balasubramanian, L. Anand, J. Mech. Phys. Solids (2002) 101-126.
[4] L. Anand, Comput. Meth. Appl. Mech. Eng. 193 (2004) 5359-5383.
[5] V. Hasija, S. Ghosh, M.J. Mills, D. Joseph, Acta Mater. 51 (2003) 4533-4549.
[6] M. Zhang, J. Zhang, D.L. McDowell, Int. J. Plast. 23 (2007) 1328-1348.
[7] J. Harder, Int. J. Plast. 15 (1999) 605-624.
[8] K.S. Cheong, M.J. Smillie, D.M. Knowles, Acta Mater. 55 (2007) 1757-1768.
[9] F.P.E. Dunne, A.J. Wilkinson, R. Allen, Int. J. Plast. 23 (2007) 273-295.
[10] K. Kirane, Ghosh, Int. J. Fatigue 30 (2008) 2127-2139.
[11] R.J. Asaro RJ, Adv. Appl. Mech. 23 (1983) 1-115.
[12] E.P. Busso, Cyclic deformation of monocrystalline nickel alluminide and high
temperature coatings. PhD Thesis, Massachusetts Institute of Technology, USA, 1990.
[13] E.P. Busso, F.T. Meissonnier, N.P. O’Dowd, J. Mech. Phys. Solids 48 (2000)
2333-2361.
[14] F.T. Meissonnier, E.P. Busso, N.P. O’Dowd, Int. J. Plast. 17 (2001) 601-640.
[15] R.J. Dennis, Mechanistic modelling of deformation and void growth behaviour in
superalloy single crystals. Ph.D. Thesis, Imperial College London, UK, 2000.
[16] L.G. Zhao, N.P. O’Dowd, E.P. Busso, J. Mech. Phys. Solids 54 (2006) 288-309.
[17] Y. Kiyak, B. Fedelich, T. May, A. Pfennig, Eng. Fract. Mech. 75 (2008) 2418-2443.
[18] C. Zambaldi, F. Roters, D. Raabe, U. Glatzel, Mater. Sci. Eng. A454-455 (2007)
433-440.
[19] M. Shenoy, Y. Tjiptowidjojo, D. McDowell, Int. J. Plast. 24 (2008) 1694-1730.
[20] ABAQUS 6.8. Hibbitt Karlsson and Sorensen Inc, Providence, RI, 2009.
16
[21] C. Stöcker, M. Zimmermann, H-J. Christ, Z.L. Zhan, C. Cornet, L.G. Zhao, M.C.
Hardy, J. Tong, Mater. Sci. Eng. A518 (2009) 27-34.
[22] A. Okabe, B. Boots, K. Sugihara, S.N. Chiu, Spatial tessellations: concepts and:
applications of Voronoi diagrams, 2nd Edition, 2000, John Wiley & Sons Ltd,
Chichester, UK.
[23] A. Haug A, P.R. Onck, E. van der Giessen, Int. J. Solids Struct. 44 (2007) 2066-2078.
[24] G.K. Sfantos, M.H. Aliabadi, Comput. Meth. Appl. Mech. Eng. 196 (2007) 1310-1329.
[25] R.J.M. Smit, W.A.M. Brekelmans, H.E.H. Meijer, Comput. Meth. Appl. Mech. Eng.
155 (1998) 181-192.
[26] O. van der Sluis, P.J.G. Schreurs, W.A.M. Brekelmans, H.E.H., Meijer, Mech. Mater.
32 (2000) 449-462.
[27] J.F.W. Bishop, R. Hill, Philos. Mag. 42 (1951) 414-427.
[28] M. Nygards, Mech. Mater. 35 (2003) 1049-1057.
[29] Z.L. Zhan, A study of cyclic plasticity and viscoplasticity in a new nickel-based
superalloy using unified constitutive equations. PhD thesis, University of Portsmouth,
UK, 2004.
[30] Z.L. Zhan, J. Tong, Mech. Mater. 39 (2007) 64-72.
[31] K.S. Cheong, E.P. Busso, J. Mech. Phys. Solids 54 (2006) 671-689.
[32] F.P.E. Dunne, A. Walker, D. Rugg, Proc. R. Soc. London Ser. A 463 (2007)
1467-1489.
[33] F.P.E. Dunne, D. Rugg, Fatigue Fract. Eng. Mater. Struct. 31 (2008) 949-958.
17
Figure Captions
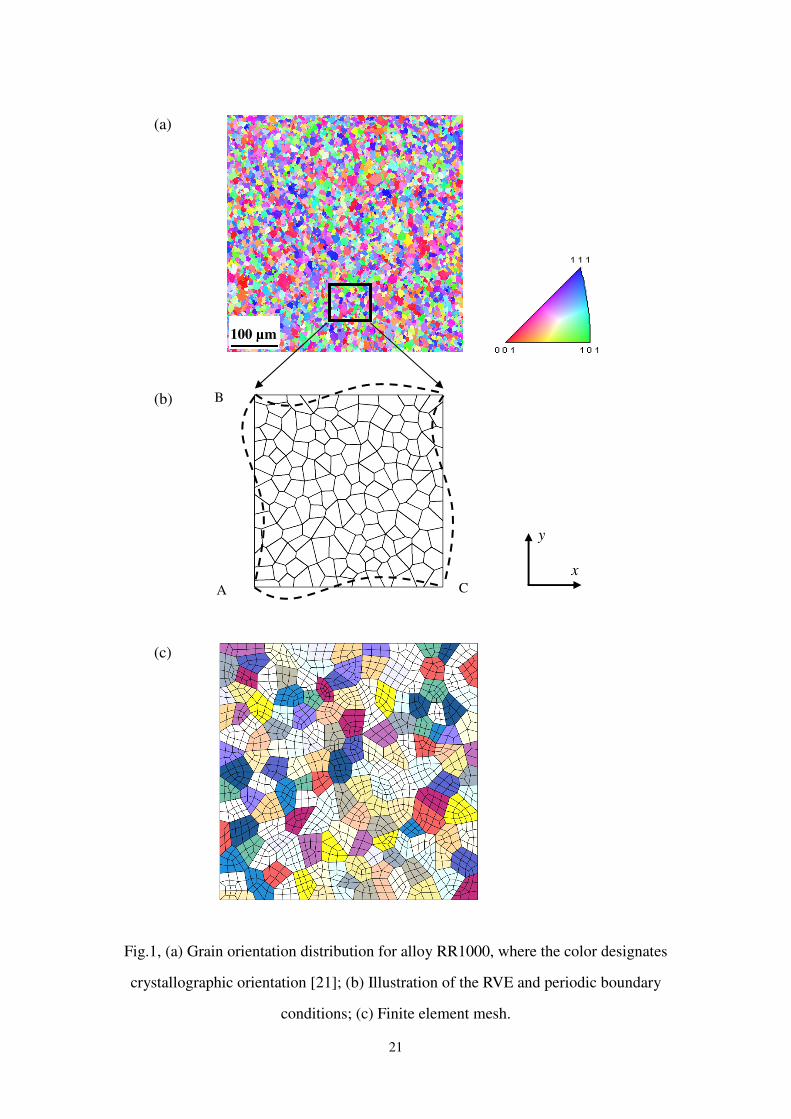
Fig.1, (a) Grain orientation distribution for alloy RR1000, where the color designates
crystallographic orientation [21]; (b) Illustration of the RVE and periodic boundary
conditions; (c) Finite element mesh.
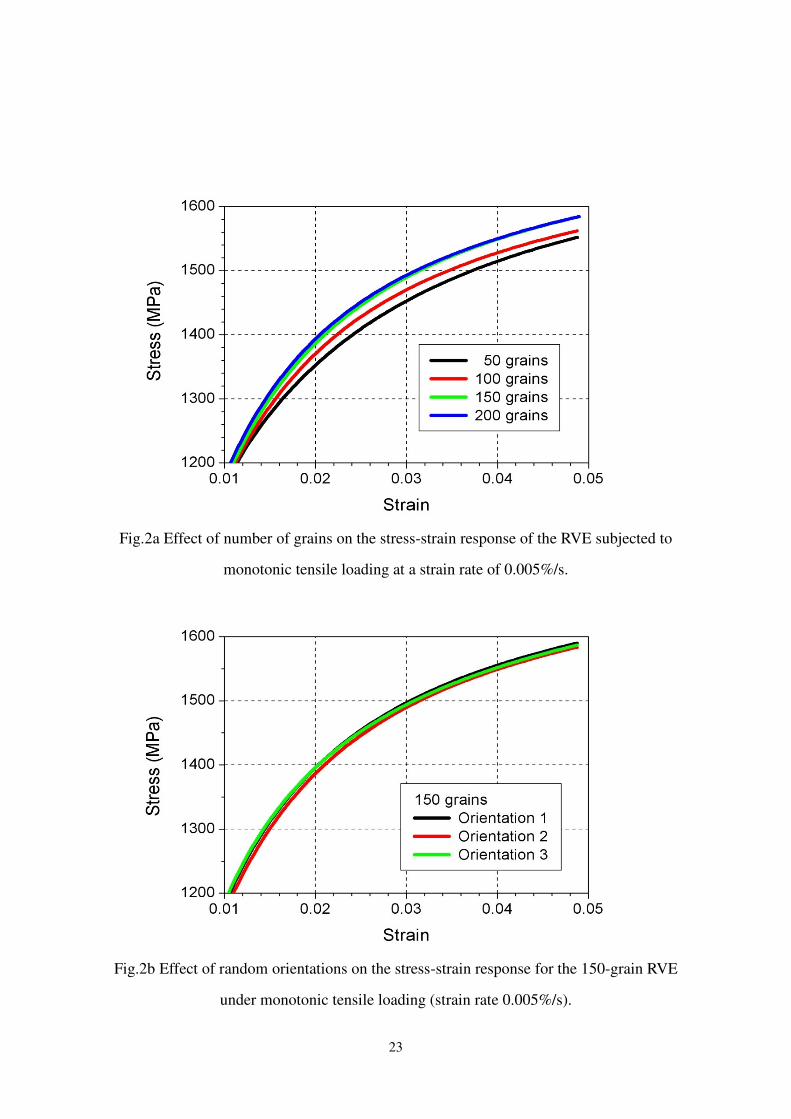
Fig.2a Effect of number of grains on the stress-strain response of the RVE subjected to
monotonic tensile loading at a strain rate of 0.005%/s.
Fig.2b Effect of random orientations on the stress-strain response for the 150-grain RVE
under monotonic tensile loading (strain rate 0.005%/s).
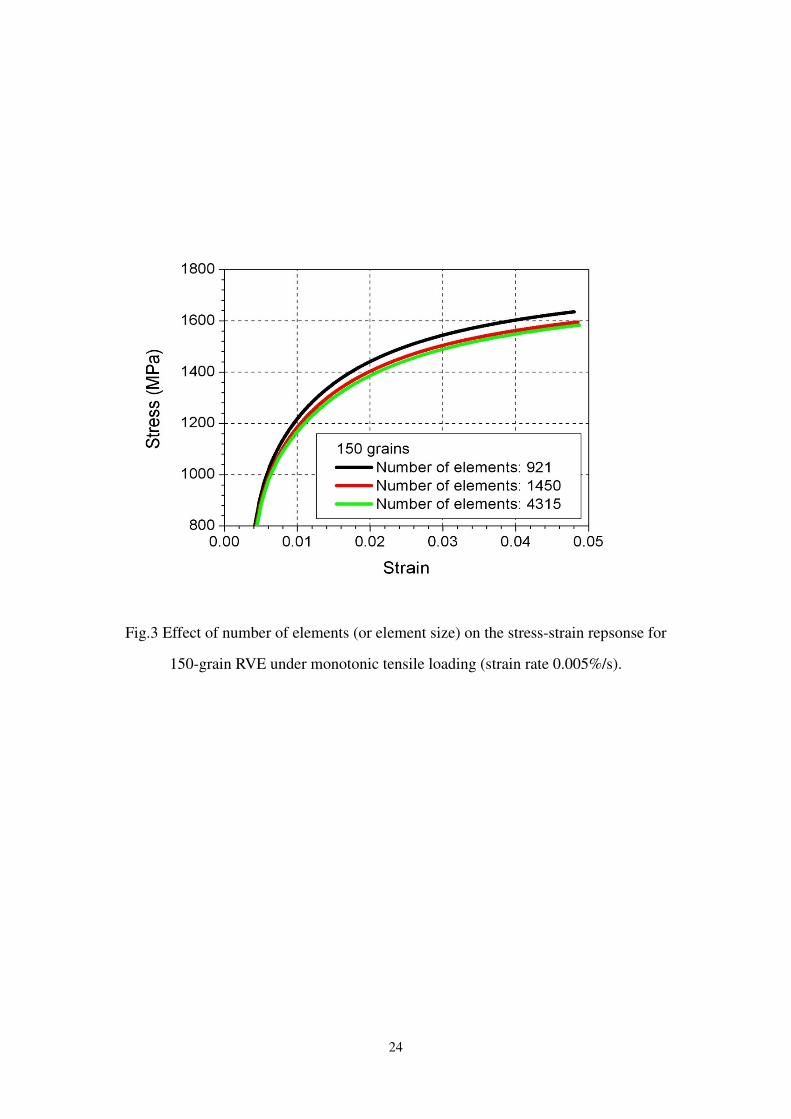
Fig.3 Effect of number of elements (or element size) on the stress-strain repsonse for
150-grain RVE under monotonic tensile loading (strain rate 0.005%/s).
Fig.4 Response of the normal stress in the x-direction and the in-plane shear stress for the
first cycle (strain range 2% and strain rate 0.05%/s).
Fig.5, Comparison of simluated stress-strain loop and experimental results for the first cycle
of a strain-controlled cyclic test (strain rate dε/dt = 0.5%/s and strain range ∆ε = 2%
[29]).
18
Fig.6, Comparison of simluated stress-strain loop and experimental results for the first cycle
of a strain-controlled cyclic test (strain rate dε/dt = 0.05%/s and strain range ∆ε = 2%
[30]).
Fig.7. Comparison of simluated stress-strain loop and experimental results for the first cycle
of a strain-controlled cyclic test (strain rate dε/dt = 0.005%/s and strain range ∆ε = 2%
[29]).
Fig.8a, Comparison of simluated cyclic hardening and experimental results for a
strain-controlled test (strain rate dε/dt = 0.05%/s and strain range ∆ε = 2% [30]).
Fig.8b, Comparison of simluated cyclic hardening and experimental results for a
strain-controlled test (strain rate dε/dt = 0.005%/s and strain range ∆ε = 2% [29]).
Fig.9, Comparison of simluated stress-strain loop at saturation and experimental results for a
strain-controlled cyclic test (strain rate dε/dt = 0.05%/s and strain range ∆ε = 2%
[30]).
Fig.10a, Comparison of model simulation and experimental data for the first cycle of a
strain-controlled cyclic test with a superimposed 100-second dwell period at both
maximum and minimum strain levels (strain rate dε/dt = 0.05%/s and strain range ∆ε
= 1.6% [29]).
19
Fig.10b, Comparison of model simulation and experimental data for the stress relaxation
behaviour during 100-second dwells at maximum and minimum strain levels (strain
rate dε/dt = 0.05%/s and strain range ∆ε = 1.6% [29]).
Fig.11, Comparison of model simulation and experimental data for the stress relaxation
behaviour during 100-second dwells at maximum and minimum strain levels (strain
rate dε/dt = 0.5%/s and strain range ∆ε = 2% [29]).
Fig.12, Contour plot of the normal stress in the y-direction at the maximum strain level of the
25th
cycle (strain rate dε/dt = 0.005%/s and strain range ∆ε = 2%).
Fig.13, Contour plot of the normal strain in the y-direction at the maximum strain level of the
25th
cycle (strain rate dε/dt = 0.005%/s and strain range ∆ε = 2%).
Fig.14, Stress-strain loops of individual grains for the 25th
cycle (strain rate dε/dt = 0.005%/s
and strain range ∆ε = 2%).

20
Table Caption
Table 1, Fitted model parameters for alloy RR1000 at 650°C.
21
Fig.1, (a) Grain orientation distribution for alloy RR1000, where the color designates
crystallographic orientation [21]; (b) Illustration of the RVE and periodic boundary
conditions; (c) Finite element mesh.
A C
B
100 µm
x
y
(a)
(b)
(c)

22
23
Fig.2a Effect of number of grains on the stress-strain response of the RVE subjected to
monotonic tensile loading at a strain rate of 0.005%/s.
Fig.2b Effect of random orientations on the stress-strain response for the 150-grain RVE
under monotonic tensile loading (strain rate 0.005%/s).
24
Fig.3 Effect of number of elements (or element size) on the stress-strain repsonse for
150-grain RVE under monotonic tensile loading (strain rate 0.005%/s).
25
Fig.4 Response of the normal stress in the x-direction and the in-plane shear stress for the
first cycle (strain range 2% and strain rate 0.05%/s).
26
Fig.5, Comparison of simluated stress-strain loop and experimental results for the first cycle
of a strain-controlled cyclic test (strain rate dε/dt = 0.5%/s and strain range ∆ε = 2% [28]).
27
Fig.6, Comparison of simluated stress-strain loop and experimental results for the first cycle
of a strain-controlled cyclic test (strain rate dε/dt = 0.05%/s and strain range ∆ε = 2% [29]).
28
Fig.7. Comparison of simluated stress-strain loop and experimental results for the first cycle
of a strain-controlled cyclic test (strain rate dε/dt = 0.005%/s and strain range ∆ε = 2% [28]).
29
Fig.8a, Comparison of simluated cyclic hardening and experimental results for a
strain-controlled test (strain rate dε/dt = 0.05%/s and strain range ∆ε = 2% [29]).
30
Fig.8b, Comparison of simluated cyclic hardening and experimental results for a
strain-controlled test (strain rate dε/dt = 0.005%/s and strain range ∆ε = 2% [28]).
31
Fig.9, Comparison of simluated stress-strain loop at saturation and experimental results for a
strain-controlled cyclic test (strain rate dε/dt = 0.05%/s and strain range ∆ε = 2% [29]).
32
Fig.10a, Comparison of model simulation and experimental data for the first cycle of a
strain-controlled cyclic test with a superimposed 100-second dwell period at both maximum
and minimum strain levels (strain rate dε/dt = 0.05%/s and strain range ∆ε = 1.6% [28]).
33
Fig.10b, Comparison of model simulation and experimental data for the stress relaxation
behaviour during 100-second dwells at maximum and minimum strain levels (strain rate dε/dt
= 0.05%/s and strain range ∆ε = 1.6% [28]).
34
Fig.11, Comparison of model simulation and experimental data for the stress relaxation
behaviour during 100-second dwells at maximum and minimum strain levels (strain rate dε/dt
= 0.5%/s and strain range ∆ε = 2% [29]).
35
Fig.12, Contour plot of the normal stress in the y-direction at the maximum strain level of the
25th
cycle (strain rate dε/dt = 0.005%/s and strain range ∆ε = 2%).
σyy (MPa)
(Avg: 75%)
36
Fig.13, Contour plot of the normal strain in the y-direction at the maximum strain level of the
25th
cycle (strain rate dε/dt = 0.005%/s and strain range ∆ε = 2%).
εyy
(Avg: 75%)
37
Fig.14, Stress-strain loops of individual grains for the 25th
cycle (strain rate dε/dt = 0.005%/s
and strain range ∆ε = 2%).
38
Table 1. Fitted model parameters for alloy RR1000 at 650°C.
Parameters Octahedral slip Cubic slip
F0 (kJmol−1
) 295 295
p 0.31 0.99
q 1.8 1.6
0γ& (s−1
) 120 4
0τ̂ (MPa) 810 630
S0 (MPa) 350 48
fC 0.42 0.18
hB (GPa) 400 100
hS (GPa) 160 4.5
dD (MPa) 6024 24
'0µ (GPa) 72.3 28.6


![A New Polycrystalline Co-Ni Superalloy · temperature) has been observed [4], however, most of the Co superalloys presented to date have relatively low solvus temperatures compared](https://img.pdfslide.us/doc/110x75/5b8389797f8b9a23668d3db5/a-new-polycrystalline-co-ni-superalloy-temperature-has-been-observed-4-however.jpg)