Embed Size (px)
Citation preview

1
Church Rock Uranium Monitoring Project
CRUMP Radiation Monitoring Results, 2003-2005Prepared by Chris Shuey, SRIC
presented to Navajo Abandoned Uranium Mines CollaborationJanuary 18, 2006; revised for NMTHRS, June 27, 2006
2
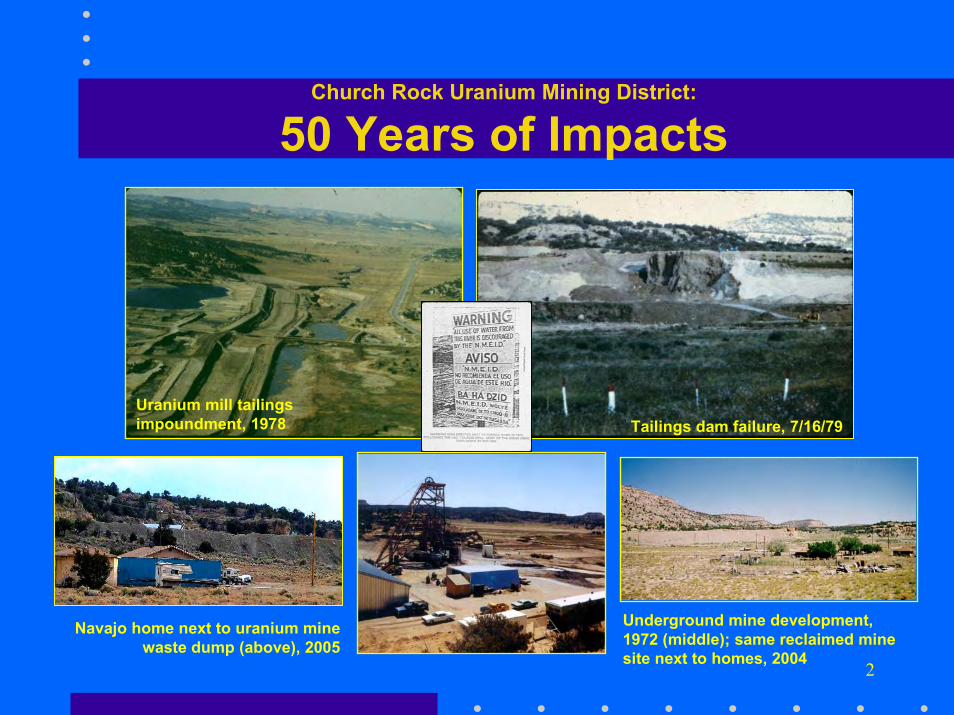
Church Rock Uranium Mining District:
50 Years of Impacts
Uranium mill tailingsimpoundment, 1978 Tailings dam failure, 7/16/79
Navajo home next to uranium minewaste dump (above), 2005
Underground mine development,1972 (middle); same reclaimed minesite next to homes, 2004
3
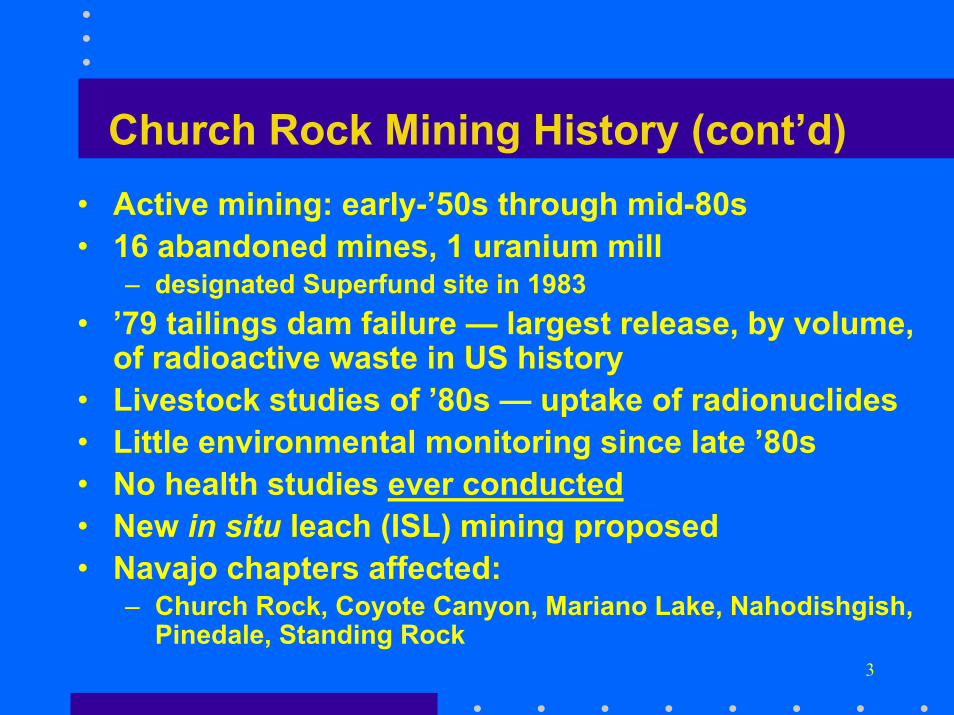
Church Rock Mining History (cont’d)• Active mining: early-’50s through mid-80s• 16 abandoned mines, 1 uranium mill
– designated Superfund site in 1983• ’79 tailings dam failure — largest release, by volume,
of radioactive waste in US history• Livestock studies of ’80s — uptake of radionuclides• Little environmental monitoring since late ’80s• No health studies ever conducted• New in situ leach (ISL) mining proposed• Navajo chapters affected:
– Church Rock, Coyote Canyon, Mariano Lake, Nahodishgish,Pinedale, Standing Rock

4
CRUMP History• Church Rock Chapter resolutions
– opposing new mining– requesting EH studies, ’00, ’03
• 900-home project proposed, ’01• Chapter staff in ENHB training• Needed environmental data for
decision-making• RESOLVE, Inc. grants, ’03 - ’06• In-kind technical support from
tribal, state, federal agencies• Data-sharing, air monitoring with
DiNEH Project, ’06
Top: Former Church RockChapter CSC Edward CarlisleMiddle: ENHB training 12/3/02
Bottom: CRUMP meeting, 6/24/03

5
CRUMP Goals• Assess contaminants in water,
on land, in air in residentialareas near abandoned uraniummines– Establish human exposures for
future health studies• Train, involve local people in
assessments• Ensure community oversight of
mine cleanup• Educate, report

6
CRUMP Collaborators• Church Rock Chapter, NN• Diné College UEP• Navajo AML, Navajo EPA,
Navajo Dept. Water Resources• NM Environment Department• Southwest Research &
Information Center• TAMS Center-NAU/ITEP• UNM/CEHP• USEPA-9, Las Vegas Lab

Study Area A
StudyArea B
Study Area C
Church RockUranium
MonitoringProject,
2003-2005Church RockChapter House
Church Rock Chapter
Coyote Canyon ChapterNahodishgish,Standing RockChapters
Pinedale Chapter

8
Gamma Radiation Monitoring• Gamma radiation levels measured
with hand-held instruments, USEPA“Scanner Van” in Oct ’03
• 20+ people from Church Rock,Navajo Nation, SRIC, TAMS Center,USEPA– community members trained in
instrument calibration, field use, datatranscription (left)
• Follow-up surveys around homeshaving high indoor Rn (Summer 2004)

9
Gamma Radiation Monitoring (cont’d)
Instrumentation
Hand-held Ludlum-19 detectors(above) loaned by NNEPA Superfund.
USEPA Las Vegas Lab loaned CRUMP its gammaradiation “Scanner Van” and two technicians for 3+ days.
Sodium iodide (NaI) detectors (above right, in cylinder)measure radiation levels within 200’ of van (top middle).On-board computers record and map radiation levels asthe van travels at 5 mph. Use of van valued at >$15,000.

10
Analysis of Gamma Radiation Data• Gamma data from Scanner Van, handheld instruments
compiled, analyzed, 2004-2005– Data files validated by USEPA-LV lab staff– Statistical analysis by M. Ronca-Battista, TAMS Center, C. Shuey,
SRIC, June 2005– Digital mapping by J. Begay, NNEPA-SFP
• “Background” gamma rates calculated for Church RockVillage, Springstead Estates
• Background rates compared with γ-rates at Section17/King Ranch (Study Area B)
• Significant difference w/ distance from SR 566• Old Churchrock Mine, ore hauling ID’d as sources

11
Gamma Radiation Monitoring (cont’d)Study Area C: Springstead Tract
• Scanner van, hand-heldmeter surveys limited toroads, arroyo throughSpringstead property
• Majority of radiation levelswithin background– small piles of red-pink
stones had slightly elevatedgamma levels
• More extensive studiesneeded before housingcomplex is built
Springstead was site of mobile homepark for miners in 1960s-early 1980s
12
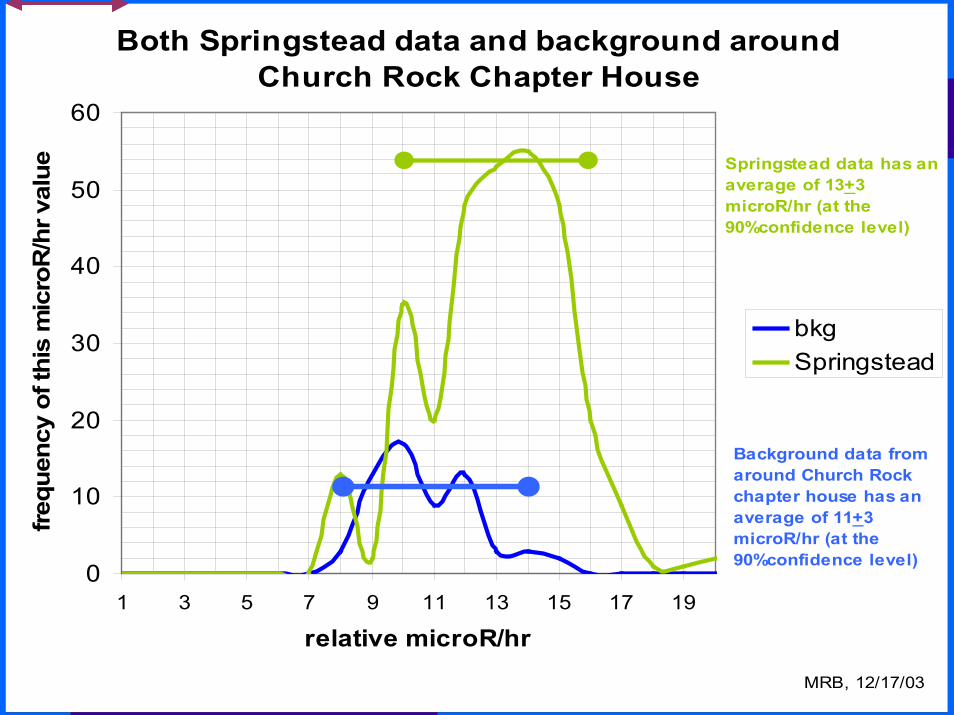
Both Springstead data and background around Church Rock Chapter House
0
10
20
30
40
50
60
1 3 5 7 9 11 13 15 17 19
relative microR/hr
freq
uenc
y of
this
mic
roR
/hr v
alue
bkgSpringstead
Springstead data has an average of 13+3 microR/hr (at the 90%confidence level)
Background data from around Church Rock chapter house has an average of 11+3 microR/hr (at the 90%confidence level)
MRB, 12/17/03

13
NaI data on Section 17 (<=8 m of 566 and >8 m of 566) and Church Rock Chapter House
0
10
20
30
40
50
60
70
80
1 11 21 31 41 51 61 71 81 91 101 111 121 131 141 151
relative microR/hr
freq
uenc
y of
this
µR
/hr v
alue
> 8 m of 566
<=8 m of 566
Church RockCh House
near-road data has an average between 32 and 41 microR/hr (at the 95%confidence level)
data from around Church Rock chapter house has an average 8 and 13 microR/hr (at the 95%confidence level)
off-road data has an average between 20 and 25 microR/hr (at the 95%confidence level)

14
Study Area BLand Status:•Sec. 17: Navajo tribaltrust surface, privateminerals subsurface;•Sec. 16: State (leasedto BIA for grazing)•Sec. 8, SE1/4: privatesurface, subsurface
King residences,grazing permit area
HRI License AreaBoundary
Contour onbase of mesa
Old ChurchrockMine (OCRM) area
OCRM(Sec.17)mine waterponds
King Ranch,residences

15
•Red dots indicategamma rates at least2x > background;
•Gamma rates onKing Ranch land upto 180 uR/hr; equatesto annual exposureof 106 mremassuming 11%occupancy rate
•Exposure exceedsUSNRC 100-mrem/yrlimit
•Gamma rates onmine site range up to460 uR/hr
Study Area BExposures

16
Gamma ratesmeasured along
SR 566 byscanner van and
hand-heldinstruments
mapped in area ofUNC mill, tailings
site to terminusof SR 566, and
along Red WaterPond Road
Study Area A
Pipeline CanyonRoad Residential
Area
Red Water Pond Road Residential Area
UNC Northeast Church RockMine (closed ’83)
Kerr-McGee Church Rock I and1E Mine (closed ’86)
UNC Uranium Mill,Tailings DisposalArea (closed ’82)

17
Radiation Sources:
UNC Northeast Church Rock Mine
Water in mine-water ponds atUNC NECR mine (right) in 11/04;
ponds open to local livestock,wildlife. Occupied homes located<500’ north of mine waste dump
(lower left, lower right).Mine water pond
Waste dumps
Mine wastes(UNC)
Mine wastes(Kerr-McGee)
18
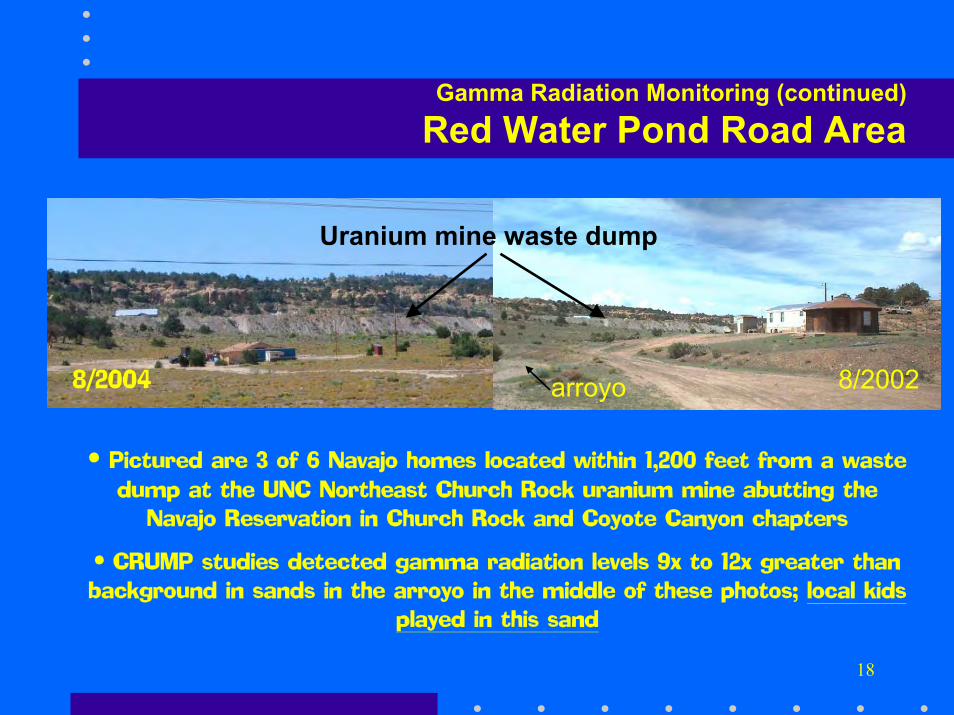
Gamma Radiation Monitoring (continued)
Red Water Pond Road Area
• Pictured are 3 of 6 Navajo homes located within 1,200 feet from a wastedump at the UNC Northeast Church Rock uranium mine abutting the
Navajo Reservation in Church Rock and Coyote Canyon chapters
• CRUMP studies detected gamma radiation levels 9x to 12x greater thanbackground in sands in the arroyo in the middle of these photos; local kids
played in this sand
Uranium mine waste dump
8/2004 8/2002arroyo

19
Gamma radiationlevels at the base
of mine-waste pileranged up to 30xbackground (300
uR/hr) atReservation line
ApproximateNavajo Rez
boundary
Uranium mine wastes
CRUMP radiation teammembers (below)
Contaminatedsoils in this
area

20
In the Red Water PondRoad area, 14 Navajo
residences aresandwiched betweentwo large abandoned
uranium mines; KMmine to north partiallyreclaimed in early ’90s;
UNC mine to southsubject to state-
required reclamation;gamma radiation levels>2x background shownby red dots and lines.
Map of GammaRadiation Levels
UNCMinesite
Kerr-McGee
Mine
NavajoReservationboundary
Map by J. Begay, NNEPA/Superfund
UNC milltailings area

21
Red Water Pond Road Area
Soil Sampling for Uranium, Heavy Metals
• Samples (n=45) collected in RWPR area by Stanfordstudent C. George, CRUMP Staff 12/04, 8/05
• Uranium Results:
– range: <1 ppm - 89 ppm– mean: 25 ppm– baseline (non-impacted sites): 0.9 ppm
• 83% exceeded upper limit of “average crustal” levelsof U in soil reported in literature (i.e., > 3 ppm)
• Confirmed findings of 2003 gamma radiation surveys
• As, Fe, Ni above soil reference levels at 3 locations

22
Approximate locationsof nearest residences
Northeast Church RockMine waste dump
23
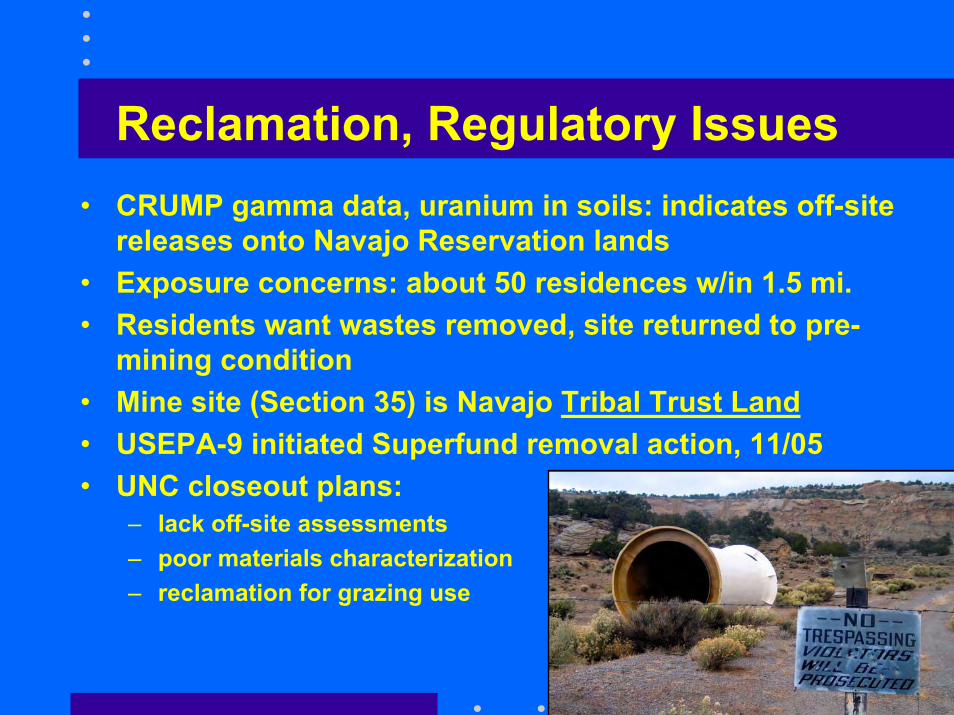
Reclamation, Regulatory Issues• CRUMP gamma data, uranium in soils: indicates off-site
releases onto Navajo Reservation lands• Exposure concerns: about 50 residences w/in 1.5 mi.• Residents want wastes removed, site returned to pre-
mining condition• Mine site (Section 35) is Navajo Tribal Trust Land• USEPA-9 initiated Superfund removal action, 11/05• UNC closeout plans:
– lack off-site assessments– poor materials characterization– reclamation for grazing use

24
RWPR Residents’ Actions• Church Rock, Coyote Canyon
resolutions adopted 2005• More assessment needed:
– extent of off-site releases
– materials characterization at NECR site
• Community objectives (7/17/05 meeting):– Clean site for productive grazing, future
residential use
– Plan, conduct health study
– Address cumulative effects of multiplemining, milling sites
Arthur Hood, local resident,discusses mining history withUNM Medical School students

25
Indoor Radon Monitoring• 7-day radon canisters placed
in 139 homes in Feb.-March ’04• 34 homes had radon levels
greater than the USEPA“action level” of 4 pCi/l-air*
• 90% homes with high Rnlocated on outcrop of uranium-bearing rock formation
• Mitigation measured shared• Retests anticipated Fall ‘06
*8-hr exposure = smoking 1-2 packs cigarettes per day
John Plummer, NNEPA RadonProgram, shows Pipeline Roadresident Alta Yazzie the charcoalinside a radon canister
26
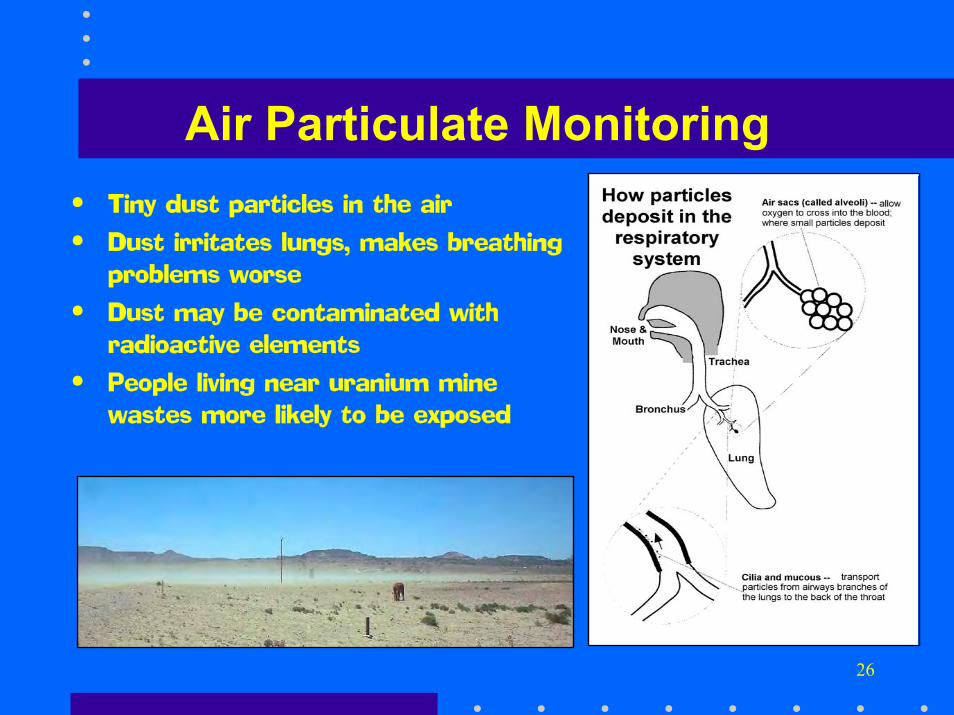
Air Particulate Monitoring• Tiny dust particles in the air
• Dust irritates lungs, makes breathingproblems worse
• Dust may be contaminated withradioactive elements
• People living near uranium minewastes more likely to be exposed

27
Air Particulate Monitoring (continued)Pipeline Road Site
The Boss The Crew
Trenching forelectric line
Air samplers were mounted on platforms built by Chapterand CRUMP staffers; fences installed for security;
trenches dug for electric lines to home

28
Air Particulate Monitoring (continued)Red Water Pond Road Site
Church Rock Chapter communityworkers built platform, security
fencing for second air sampler next toHood residence on Water Pond Road;
A. Allison calibrates sampler (right).

29
Air Particulate Monitoring (continued)
• Monitoring initiated May ‘06
• Need 1 year of air data
• USEPA-LV lab analyzing filtersfor PM-2.5, PM-10– CRUMP requesting radionuclide
analyses
• Compare levels with federal CAAparticulate limits
• Develop, validate predictivemodel of inhalation exposure
Rod Yazzie, NNEPA-Air, downloadsdata from air monitor

30
CRUMP Benefits• Capacities increased:
– CRUMP coordinator position created, staffed– Chapter CSC, staff received training– Extensive outreach, 6 community meetings– Fund-raising skills developed
• First environmental assessments since late-1980s• Human exposures to uranium documented• Environmental data generated policy changes
– DNRPA enacted by Navajo Nation Council April ’05– USEPA Superfund enforcement at NECR Mine, Nov. ’05
• Data sharing, air monitoring will inform DiNEHProject exposure model