Embed Size (px)
Citation preview
Potter, J., & Croxford, A. (2018). Characterization of nonlinearultrasonic diffuse energy imaging. IEEE Transactions on Ultrasonics,Ferroelectrics, and Frequency Control.https://doi.org/10.1109/TUFFC.2018.2816243
Peer reviewed version
Link to published version (if available):10.1109/TUFFC.2018.2816243
Link to publication record in Explore Bristol ResearchPDF-document
This is the author accepted manuscript (AAM). The final published version (version of record) is available onlinevia IEEE at http://ieeexplore.ieee.org/document/8316944/ . Please refer to any applicable terms of use of thepublisher.
University of Bristol - Explore Bristol ResearchGeneral rights
This document is made available in accordance with publisher policies. Please cite only thepublished version using the reference above. Full terms of use are available:http://www.bristol.ac.uk/red/research-policy/pure/user-guides/ebr-terms/

JOURNAL OF IEEE TRANSACTIONS ON ULTRASONICS, FERROELECTRICS AND FREQUENCY CONTROL 1
Characterization of nonlinear ultrasonic diffuseenergy imagingJack Potter and Anthony Croxford
Abstract—Nonlinear ultrasonic diffuse energy imaging is ahighly sensitive method for the measurement of elastic nonlin-earity. While the underlying principles that govern the techniqueare understood, the precise behavior and sensitivity have notpreviously been quantified. This article presents experimen-tal, theoretical and numerical modeling studies undertaken tocharacterize nonlinear diffuse energy imaging. The influence ofincoherent noise, elastic nonlinearity and instrumentation errorare quantified. This work enables prediction of spatial sensitivity,aperture and amplitude dependence of the measurement, all ofwhich moves the technique towards industrial viability. Further,while previous studies have focused on detection of closed cracks,the ultimate aim for nonlinear ultrasonic imaging in applicationto material testing is the detection of damage precursors, whichrequires a sensitivity to weak classical nonlinearity. This studyidentifies the experimental requirements necessary for this tobe achieved, greatly expanding the potential applicability ofnonlinear ultrasonic array imaging.
I. INTRODUCTION
The measurement of elastic nonlinearity is of importance toa number of fields. In application to the nondestructive testingof materials, the microstructural changes that form in advanceof macroscopic damage exhibit a weak, classical nonlinearelastic response[1]. Furthermore, other discrete defects suchas closed cracks and kissing bonds exhibit a strong non-classical nonlinear response as a consequence of contact-acoustic effects[2]. Detection of damage at earlier stages bothincreases safety and allows for cost reduction by increasingthe necessary length of inspection intervals. Great interestalso exists within the field of bio-medical imaging for whichnonlinearity has been found to be strongly correlated withpathological changes in tissue.
Regardless of the underlying mechanics, the effect of non-linear elasticity on a propagating ultrasonic field is someform of spectral distortion. The fundamental challenges ofnonlinear ultrasonic measurements come from the weaknessof this effect and from the difficulty of isolating the sourceof spectral distortion spatially. Many techniques have beendeveloped for nonlinear ultrasonic inspection. Classical tech-niques typically excite the field and measure distortions usingmonolithic transducers. The most prevalent of these methodsare harmonic generation[3] and wave mixing[4], [5]. Harmonicgeneration considers the self-interaction of a longitudinal waveand provides a measurement proportional to the integral ofelastic nonlinearity along the propagation path of the wave.Wave mixing techniques involve the interaction of two or more
The authors are with the Department of Mechanical Engineering, Universityof Bristol, Queen’s Building, University Walk, Bristol, BS8 1TR, UnitedKingdom. Email: [email protected]
incident waves. If the mode, frequencies and wave vectorsare selected to satisfy certain specific phase matching criteriathen a secondary scattered wave is generated at either thesum or difference frequencies of the incident waves. Since thesecondary wave is only generated at the intersection of theincident waves, a degree of nonlinear localisation is achieved.The effective imaging resolution is however limited by thesize of the interaction volume. Further, the complicated ex-perimental requirements of such methods limit their practicalapplicability.
A focus of much work in recent years has been on thedevelopment of techniques that use ultrasonic phased arraysfor imaging elastic nonlinearity. This has been motivatedprimarily due to the ability of ultrasonic arrays to easilygenerate specifically designed interference patterns within amaterial and to remotely isolate the source of scattered waves.The primary application of these techniques has been theimaging of discrete defects such as tightly closed cracks.Such defects exhibit a very strong localized nonlinear responseand consequently the imaging of which presents a much lesschallenging problem than the weak nonlinearity associatedwith damage precursors. The most common approach adoptedto this problem has been the detection of distortion within theportion of the field scattered coherently from the inspectionpoint. Most commonly sub- or superharmonic components ofthe signal are analyzed[6], [7], [8]. Other techniques seek tomodulate a parameter of the system and examine changeswithin the transmission bandwidth of the back scattered signal.These modulation parameters have included static load[9],temperature[10] and amplitude of the transmitted signal[11].These coherent scattering techniques recover only a smallproportion of the total information pertaining to elastic nonlin-earity that is encoded onto the field. This is because they canonly analyze the part of the field that happens to be scatteredback to the receiver from the inspection point. Informationcontained within the rest of the field is lost.
An array imaging technique has previously been proposedthat measures nonlinearity without a reliance on a backscat-tered signal and is known as nonlinear ultrasonic diffuseenergy imaging[12]. This technique infers the elastic nonlin-earity at a point in space by contrasting the diffuse energyof the ultrasonic fields produced by sequential and parallelfocusing at that point. This method has been shown to behighly sensitive to fatigue cracks, being capable of accuratedetection and sizing at very early stages of crack growth[13].Within the class of array imaging techniques, nonlinear dif-fuse energy imaging is uniquely positioned for applicationto damage precursor detection since there is no backscatter

JOURNAL OF IEEE TRANSACTIONS ON ULTRASONICS, FERROELECTRICS AND FREQUENCY CONTROL 2
associated with classical forms of nonlinearity. Further, thereis no fundamental physical reason to negate its applicationto these problems, limitations are instead due to practical ex-perimental considerations. As with any conventional imagingtechnique, in order to demonstrate industrial viability a processof characterization must be undertaken. A crucial part of thisis the determination of sensitivity to elastic nonlinearity, fromwhich the experimental requirements for damage precursormeasurement may be obtained. The purpose of this study isto obtain an understanding of the behavior and sensitivity ofnonlinear diffuse energy imaging.
II. NONLINEAR DIFFUSE ENERGY IMAGING
The theory of nonlinear diffuse energy imaging, as de-scribed by [12], will first be reviewed. An ultrasonic phasedarray may be operated in two main modes of transmission.Firstly there is classical physical beamforming, for whichelements are triggered in parallel with the application of somerelative phase delays. In this case some designed interferencepattern (often a steered or focused beam) is physically formedwithin a specimen. The second mode of transmission is whatis commonly referred to as full matrix capture [14]. In thiscase elements transmit sequentially and the responses for eachtransmitter-receiver pair are collated to form the so-called fullmatrix. The interference effects of the classically beamformedparallel transmission can be emulated by applying phase de-lays in post-processing of the full matrix, resulting in syntheticbeamforming. The parallel and sequential transmission modesare illustrated in Fig. 1. The sequential capture approach toarray imaging relies on an assumption of linear superpositionand for linear systems, in the absence of random noise, thetwo methods are exactly equivalent. In the presence of elasticnonlinearity the propagation of these parallel and sequentialfields differ, an effect which may be exploited in makingnonlinear measurements.
When a parallel field is focused, the material physicallysees higher stress at the focal spot than in any of the in-dividual transmission cycles of a sequential capture. Since,by definition, a nonlinear system loses proportionality, thereis a higher flux of energy from the transmission bandwidthdue to nonlinearity at the focal point for a parallel field.Since generally the inspection point is inaccessible to themeasurement system this relative nonlinear loss cannot bemeasured directly and must be inferred through some othermeasurement of the field.
Parallel and sequential fields have identical linear propaga-tion, identical transmission energy and, where there is no in-terference between element transmissions, identical nonlinearself-interaction effects. The only differences in propagationoccur as a consequence of interference between the fieldsproduced by different element transmissions, which is an effectdominated by the focal point. Consequently, after the focaltime, the difference in total system energy in the transmissionbandwidth between parallel and sequentially focused fields isapproximately equal to that which occurred through nonlinearlosses at the focal point. If the total energy (within thetransmission bandwidth) of the system could be measured for
the parallel and sequential focusing cases, then the differencebetween the two values would provide a measure of elasticnonlinearity at the focal point.
Measurement of total system energy for the early-time,coherent field is not feasible since it would require the fieldto be measured at every point. The total energy may howeverbe inferred through analysis of the subsequent diffuse field.Sometime after initial transmission of sound, the field willhomogenize as a consequence of multiple scattering. In thisstate energy is statistically uniform throughout the systemand the statistical diffuse energy measured at any point isproportional to the total energy in the system. Furthermore, therelative loss of energy that occurred at the focal point is spreaduniformly. Consequently, the relative diffuse energy of paralleland sequentially focused fields is proportional to the relativeenergy loss at the focal point which in turn is a function ofthe elastic nonlinearity at that location. This is the operatingprinciple of the nonlinear diffuse energy imaging technique,the metric for which is defined as the normalized differencein sequential and parallel diffuse energy. This metric, forinspection location rf , may be written as follows[12]
γ(rf ) =Es(rf )− Ep(rf )
Es(rf ), (1)
where Ep and Es are the parallel and sequential diffuse energyvalues respectively. Experimentally the sequential energy termis obtained through integration of diffuse energy across thetransmission bandwidth, averaged across all receiving ele-ments. For an array of N elements and center frequency ω0
this may be expressed as
Es(rf ) =
N∑j=1
∫ 43ω0
23ω0
∣∣∣∣∣N∑k=1
Fk,j(ω)e−iωδk(rf )
∣∣∣∣∣2
dω
, (2)
where Fk,j(ω) is the complex valued frequency spectra ofthe diffuse full matrix for which the indices k and j denotetransmission and reception elements respectively. δk(rf ) is thedelay applied to element k required to achieve focusing atpoint rf . The 2/3 ω0 evaluated bandwidth is the largest forwhich there is no internal movement of energy. Similarly, thediffuse parallel energy, Ep, is given by
Ep(rf ) =
N∑j=1
(∫ 43ω0
23ω0
|Hj(rf , ω)|2 dω
), (3)
where Hj(rf , ω) is the diffuse spectra of the signal receivedon the j element when all elements are transmitted in parallelwith delays δk(rf ).
In order to demonstrate the properties of the techniquean experimental imaging example is considered. A closedfatigue crack was grown within an aluminium test piece.A 5 mm diameter hole was machined behind the crack tipalongside a second hole to provide a reference. This testblock was designed to approximate fatigue crack growthinitiated at a fixing hole. Full details of its preparation areavailable[12]. Inspection was conducted using an Imasonic(Voray-sur-l’Ognon, France) 64 element ultrasonic array with

JOURNAL OF IEEE TRANSACTIONS ON ULTRASONICS, FERROELECTRICS AND FREQUENCY CONTROL 3
x
z
n
� 1
(a) (b)
��
n
��
Fig. 1. Schematic illustration of (a) parallel and (b) sequential field focusing.
a nominal centre frequency ω0 of 5 MHz and pitch of 0.63 mm,in conjunction with a Micropulse FMC model array controllermanufactured by Peak NDT Ltd (Derby, UK). To obtain adiffuse field a reception delay of 0.1 ms was applied andenergy was evaluated over a window length of 0.12 ms.
Selection of reception delay represents a compromise be-tween field diffusivity and signal to noise ratio. If the receptiondelay is too small then the statistical conditions that themeasurement requires (most importantly the spatial homo-geneity of the field) are not satisfied, resulting in imagingartefacts. Conversely, if the delay is too long then randomnoise dominates the received signal and the effective dynamicrange of the acoustic measurement is reduced. Longer windowlengths allow the statistical properties of a diffuse state to bereached at earlier times but increase the computational expenseof the measurement. In this case, the window length used is themaximum that the instrument can acquire in a single capture.
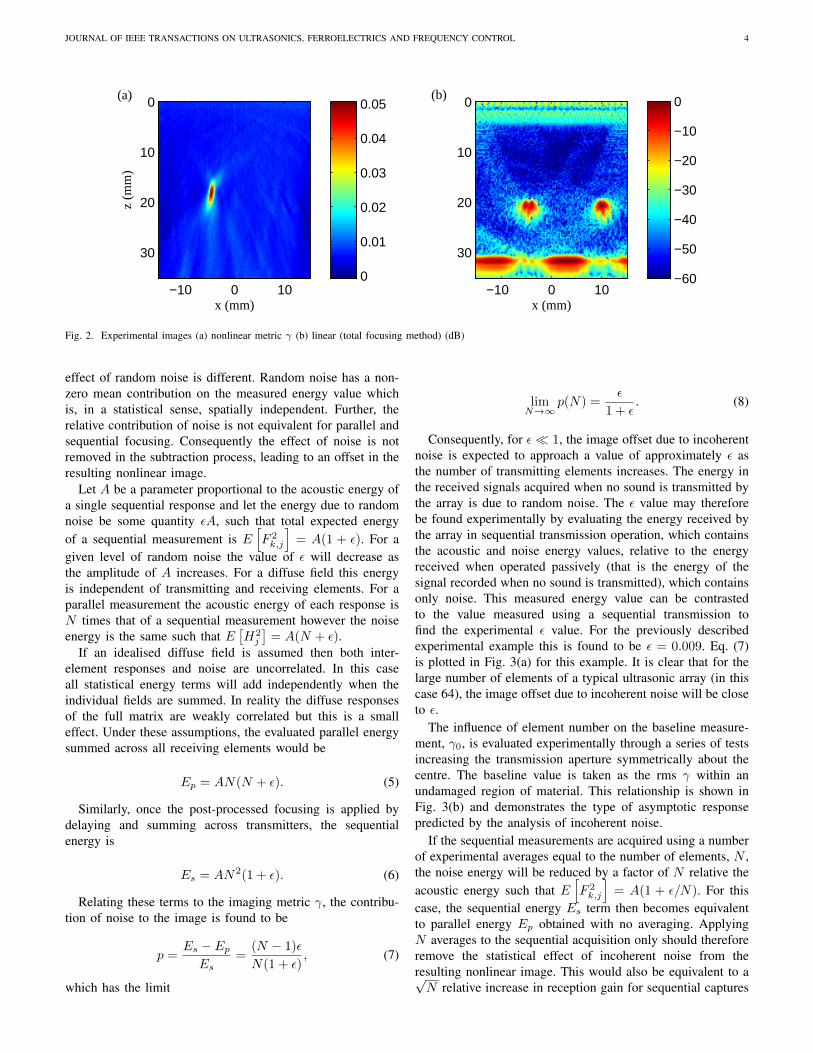
Typical nonlinear and linear images acquired for this sampleare shown in Fig. 2. The linear image can be seen to be dom-inated by the back wall and hole reflections. Some evidenceof the defect is provided by shadowing effects on the lefthole caused by diffraction at the crack tip. This shadowingeffect can be seen a slight null on the left hole reflectionin comparison with the undamaged hole. This is however anunclear indication and no sizing information is present. Thenonlinear image shows only a clear indication from the defectas a consequence of the local nonlinear elastic response. Notethe complete absence of back wall and hole reflections withinthe nonlinear image. This excellent linear suppression is adirect consequence of the diffuse energy measurement. Sinceimaging is not based upon a coherently scattered signal fromthe inspection point, instrument and material nonlinearity donot produce artifacts from linear features as is the case withcoherent nonlinear imaging techniques. This is important sincea geometric feature which acts as a stress raiser to initiate crackgrowth is itself inherently a strong linear scatterer. Conse-quently, without separation of linear and nonlinear modalities,a small defect can be masked by the feature it grows from.
The high sensitivity of the nonlinear metric is derived fromtwo aspects of the measurement. Firstly, by measuring the
energy flux from the transmission bandwidth, the movementof energy to any frequency component is captured making themetric broadly sensitive to any underlying nonlinear mechan-ics. Secondly, the nature of the diffuse measurement is suchthat regardless of spatial directivity of energy flux (be it purelya distortion of the forward propagating field or some nonlinearscattering phenomena), it contributes to the measured value.This implicitly provides a full reception aperture around everyinspection point.
The measurement is predicated on the hypothesis thatinformation pertaining to elastic nonlinearity at the focal pointis preserved in the relative diffuse energy of parallel andsequential fields. In order to move the technique towardsindustrial viability it is necessary to precisely quantify the de-gree to which elastic nonlinearity and other factors contributetowards the experimentally acquired metric in addition todetermining the ultimate measurement capability. Broadly, thefactors contributing to the measured γ value may be groupedinto three terms as follows
γ(rf , r) = η(rf , r) + p+ e(r), (4)
where η(rf , r) represents the contribution of elastic nonlin-earity. This includes the effect from both the focal point andthe wider material contributions. This determines the locali-sation of the measurement in addition to spatial sensitivity. pis the contribution of incoherent noise to the measurementand finally e(r) contains the remaining experimental error,most significantly effects of instrumentation nonlinearity andrepeatability, and is the term which ultimately determines thelimit of experimental sensitivity. The focus of this work is thecharacterization of these terms.
III. INCOHERENT NOISE
Firstly, the effect p of incoherent noise on the measurementshall be considered. Incoherent noise is a zero-mean randomprocess. For conventional linear or nonlinear imaging basedon the recorded amplitude of a scattered wave, incoherentnoise appears directly as noise within the image space. In thiscase, because the evaluated quantity is statistical energy the
JOURNAL OF IEEE TRANSACTIONS ON ULTRASONICS, FERROELECTRICS AND FREQUENCY CONTROL 4
x (mm)
z (m
m)
−10 0 10
0
10
20
30
x (mm)
−10 0 10
0
10
20
30
0
0.01
0.02
0.03
0.04
0.05
−60
−50
−40
−30
−20
−10
0(a) (b)
Fig. 2. Experimental images (a) nonlinear metric γ (b) linear (total focusing method) (dB)
effect of random noise is different. Random noise has a non-zero mean contribution on the measured energy value whichis, in a statistical sense, spatially independent. Further, therelative contribution of noise is not equivalent for parallel andsequential focusing. Consequently the effect of noise is notremoved in the subtraction process, leading to an offset in theresulting nonlinear image.
Let A be a parameter proportional to the acoustic energy ofa single sequential response and let the energy due to randomnoise be some quantity εA, such that total expected energyof a sequential measurement is E
[F 2k,j
]= A(1 + ε). For a
given level of random noise the value of ε will decrease asthe amplitude of A increases. For a diffuse field this energyis independent of transmitting and receiving elements. For aparallel measurement the acoustic energy of each response isN times that of a sequential measurement however the noiseenergy is the same such that E
[H2j
]= A(N + ε).
If an idealised diffuse field is assumed then both inter-element responses and noise are uncorrelated. In this caseall statistical energy terms will add independently when theindividual fields are summed. In reality the diffuse responsesof the full matrix are weakly correlated but this is a smalleffect. Under these assumptions, the evaluated parallel energysummed across all receiving elements would be
Ep = AN(N + ε). (5)
Similarly, once the post-processed focusing is applied bydelaying and summing across transmitters, the sequentialenergy is
Es = AN2(1 + ε). (6)
Relating these terms to the imaging metric γ, the contribu-tion of noise to the image is found to be
p =Es − EpEs
=(N − 1)ε
N(1 + ε), (7)
which has the limit
limN→∞
p(N) =ε
1 + ε. (8)
Consequently, for ε� 1, the image offset due to incoherentnoise is expected to approach a value of approximately ε asthe number of transmitting elements increases. The energy inthe received signals acquired when no sound is transmitted bythe array is due to random noise. The ε value may thereforebe found experimentally by evaluating the energy received bythe array in sequential transmission operation, which containsthe acoustic and noise energy values, relative to the energyreceived when operated passively (that is the energy of thesignal recorded when no sound is transmitted), which containsonly noise. This measured energy value can be contrastedto the value measured using a sequential transmission tofind the experimental ε value. For the previously describedexperimental example this is found to be ε = 0.009. Eq. (7)is plotted in Fig. 3(a) for this example. It is clear that for thelarge number of elements of a typical ultrasonic array (in thiscase 64), the image offset due to incoherent noise will be closeto ε.
The influence of element number on the baseline measure-ment, γ0, is evaluated experimentally through a series of testsincreasing the transmission aperture symmetrically about thecentre. The baseline value is taken as the rms γ within anundamaged region of material. This relationship is shown inFig. 3(b) and demonstrates the type of asymptotic responsepredicted by the analysis of incoherent noise.
If the sequential measurements are acquired using a numberof experimental averages equal to the number of elements, N ,the noise energy will be reduced by a factor of N relative theacoustic energy such that E
[F 2k,j
]= A(1 + ε/N). For this
case, the sequential energy Es term then becomes equivalentto parallel energy Ep obtained with no averaging. ApplyingN averages to the sequential acquisition only should thereforeremove the statistical effect of incoherent noise from theresulting nonlinear image. This would also be equivalent to a√N relative increase in reception gain for sequential captures

JOURNAL OF IEEE TRANSACTIONS ON ULTRASONICS, FERROELECTRICS AND FREQUENCY CONTROL 5
ρ0∂2ui∂t2
− µ ∂2ui∂xk∂xk
−(K +
µ
3
) ∂2ul∂xl∂xi
=
(µ+
A
4
)(∂2ul
∂xk∂xk
∂ul∂xi
+∂2ul
∂xk∂xk
∂ui∂xl
+ 2∂2ui∂xl∂xk
∂ul∂xk
)+
(K +
µ
3+A
4+B
)(∂2ul∂xi∂xk
∂ul∂xk
+∂2uk∂xl∂xk
∂ui∂xl
)+
(K − 2
3µ+B
)(∂2ui
∂xk∂xk
∂ui∂xl
)+
(A
4+B
)(∂2uk∂xl∂xk
∂ul∂xi
+∂2ul∂xi∂xk
∂uk∂xl
)+ (B + 2C)
(∂2uk∂xi∂xk
∂ul∂xl
),
(9)
N
10 20 30 40 50 60
p
0
0.002
0.004
0.006
0.008
0.01
N
10 20 30 40 50 60
γ0
0
0.005
0.01
0.015
0.02
N Sequential averagesNo averages
(b)
ǫ
(a)
≈ ǫ
Fig. 3. (a) Theoretical incoherent noise contribution, p (b) Experimental baseline measurement.
but only if all the incoherent noise appears after the gain stageof the signal chain.
The experimental study of the baseline nonlinear measure-ment was repeated with the inclusion of N sequential averages,the results of which are plotted in Fig 3(b). It is seen that theeffect of averaging is to reduce the baseline measurement forlarge element numbers by very close to the measured ε value.This is consistent with the previous analysis and suggests thatthe effect of random noise on the nonlinear measurement isboth well understood and, despite the weak acoustic signalsassociated with diffuse measurements, can be largely removed.The remaining baseline measurement (γ ≈ 0.005) is expectedto comprise of nonlinear material effects and instrumentationerror.
It should be noted that noise is still detrimental to themeasurement since, as a consequence of bit-rate limits, theacoustic information lost through signal quantization increasesproportionally with noise. Additionally, if the noise is notperfectly uncorrelated (as is common with periodic elec-tromagnetic interference), this approach will not completelyremove the contribution to the baseline value. All subsequentexperimental results are obtained using N sequential averages.
IV. MODELING
The term η which describes the influence of elastic non-linearity on the measurement is now considered. The imagingmetric, γ, captures the total nonlinear energy loss from thetransmission bandwidth. The relative parallel-sequential en-ergy loss which occurs as the fields propagate through the focal
point is preserved in the relative diffuse energy. The differencein total energy of the parallel and sequential coherent fields isequivalent to that of the diffuse fields. Consequently, in orderto find the nonlinear elastic contribution to the metric, it isnot necessary to model the diffuse field itself. The relativenonlinear energy loss need only be computed for the earlytime, coherent component of the field. Modeling is undertakenin order to quantify the relative energy flux produced when anarray is focused in a nonlinear elastic medium.
Previous experimental studies have examined nonlinear dif-fuse energy imaging in application to fatigue cracks[12], [13].The measured nonlinear response in those examples is almostcertainly due predominantly to non-classical contact acousticeffects. The ultimate aim of this form of nonlinear imaginghowever is in application to damage precursor detection. Thisrequires sensitivity to weak, classical elastic nonlinearity. Tothis end, the dependence of nonlinear diffuse energy imagingon third order elastic strain energy is considered. The govern-ing partial differential equation for such a system is given byEq. (9)[4], where ρ0 is the material density and K and µ arethe bulk and shear moduli respectively. A, B and C are theLandau-Lifshitz third order elastic constants[15]. Alternativelythese may be expressed in terms of the Murnaghan constants[16] as l = B + C, m = A/2 +B and n = A.
A. Incident field
A perturbative approach is adopted to the solution of Eq.(9) in which the displacement field u(t, r) is considered as the

JOURNAL OF IEEE TRANSACTIONS ON ULTRASONICS, FERROELECTRICS AND FREQUENCY CONTROL 6
U (0)(r, ω) = ∆(2πcl/ω0)1/2T (ω)
N∑n=1
{An(r)DLn(r, ω)Bn(r)e
iω
(|r − an|cl
− δn)
+A⊥n (r)DSn(r, ω)Bn(r)eiω
(|r − an|ct
− δn)}
.
(10)
sum of a linear incident field u(0) and a secondary nonlinearcomponent u(s), such that
u(t, r) = u(0)(t, r) + u(s)(t, r). (11)
The incident field is evaluated in the frequency domainfrom an analytical solution for a focused ultrasonic array.The model, which contains both longitudinal and shear fieldcomponents, is expressed in Eq. (10).
Each element is considered to transmit with the samedisplacement amplitude ∆ (defined as the peak amplitudeone fundamental wavelength from the element center) andwith a Gaussian spectra T (ω) = e−α(ω−ω0)2 centered atthe fundamental frequency w0. The nth element has positionan such that the amplitude unit vector of the longitudinalfield component from each transmitting element is An(r) =(r− an)/ |r − an|. Beam spread is accounted for by the termBn(r) = |r − an|−
12 . The element directivity is approximated
as the far-field response of a line source of width b acting onan elastic half-space [17]. These analytical solutions for thelongitudinal and shear directivity functions are
DLn(ω, θn) =
sinc(πωb sin θn
cl
) (( cLcS )2 − 2 sin2 θn
)cos θn
F0(sin θn),
(12)
and
DSn(ω, θn) =
sinc(πωb sin θn
ct
)clcs
5/2
(( clcs )2 sin2 θn − 1
)1/2
sin 2θn
F0(cLcS
sin θn)
(13)respectively, where
F0(ζ) =
(2ζ2 −
(cLcS
2))2
− 4ζ2(ζ2 − 1)1/2
(ζ2 −
(cLcS
)2)1/2
.
(14)
Finally the element transmission delay is given by δn.For a focused longitudinal field in an isotropic material,δn = |an − rf | /cl, where rf is the focal position and cl isthe longitudinal velocity. The linear material parameters foraluminium are taken as; density ρo = 2700 kg/m3, Young’smodulus of E=90 GPa and Poisson’s ratio ν = 0.35, whichrelate to the linear elastic moduli by K = E/3(1 − 2ν)
and µ = E/2(1 + ν). The array parameters are selected tomatch the experiment and are N = 64, pitch w =0.63 mm,element width b=0.5 mm and center frequency ω0=5 MHz. αis chosen such that the half power response corresponds tothe manufacturer’s stated frequency of 2/3ω0. The third orderelastic constants are taken as the following measured valuesfor undamaged aluminium[18]; A= -344 GPa B= -124 GPaand C = -19.5 GPa.
B. Secondary field
Since the secondary field component is much smaller thanthe incident component, its contribution to the right hand sideof Eq. (9) may be neglected. This allows the nonlinear forcingper unit volume to be approximated as Eq. (15). The secondaryfield component produced by this forcing may therefore beobtained from the solution of the following
ρ0∂2u
(s)i
∂t2− µ ∂2u
(s)i
∂xk∂xk−(K +
µ
3
) ∂2u(s)l
∂xl∂xi= Fi. (16)
This partial differential equation is solved numerically usinga finite difference scheme. At each time step, t, the incidentfield described by Eq. (10) is evaluated as u(0)(r, t) =1
2π
∫∞−∞ U (0)(r, ω)eiωt dω. The first and second order spa-
tial derivatives of the incident field are then evaluated andfrom this the nonlinear forcing is computed. Numerical time-stepping is achieved using a fourth order Runge-Kutta methodand all spatial derivatives are computed using fourth orderfinite difference approximations.
C. Imaging metric
Since a numerical integration step is required, the fullnonlinear partial differential equation given by Eq. (9) couldbe solved directly in a similar manner without the requirementfor perturbative approximations and producing a more accuratesolution for the field. The motivation for this modeling is toevaluate the energy flux from the incident field both in terms oftotal magnitude and, importantly, where in space it occurs. Bykeeping the explicit separation of the incident and secondaryfield components this energy flux is more easily computedthan if the field was modeled as a whole. In the approachtaken here there is no nonlinear energy loss from the incidentfield. It may however be found implicitly by evaluating thenonlinear work done by the incident field on the secondary.This nonlinear work is equal to the energy flux that wouldoccur from the incident to secondary field components andmay be expressed as
JOURNAL OF IEEE TRANSACTIONS ON ULTRASONICS, FERROELECTRICS AND FREQUENCY CONTROL 7
Fi =
(µ+
A
4
)(∂2u
(0)l
∂xk∂xk
∂u(0)l
∂xi+
∂2u(0)l
∂xk∂xk
∂u(0)i
∂xl+ 2
∂2u(0)i
∂xl∂xk
∂u(0)l
∂xk
)
+
(K +
µ
3+A
4+B
)(∂2u
(0)l
∂xi∂xk
∂u(0)l
∂xk+
∂2u(0)k
∂xl∂xk
∂u(0)i
∂xl
)+
(K − 2
3µ+B
)(∂2u
(0)i
∂xk∂xk
∂u(0)i
∂xl
)
+
(A
4+B
)(∂2u
(0)k
∂xl∂xk
∂u(0)l
∂xi+
∂2u(0)l
∂xi∂xk
∂u(0)k
∂xk
)+ (B + 2C)
(∂2u
(0)k
∂xi∂xk
∂u(0)l
∂xl
) . (15)
x (mm)−10 0 10
5
10
15
20
25
x (mm)
z (m
m)
−10 0 10
5
10
15
20
25
x (mm)−10 0 10
5
10
15
20
25
(c)(b)(a)
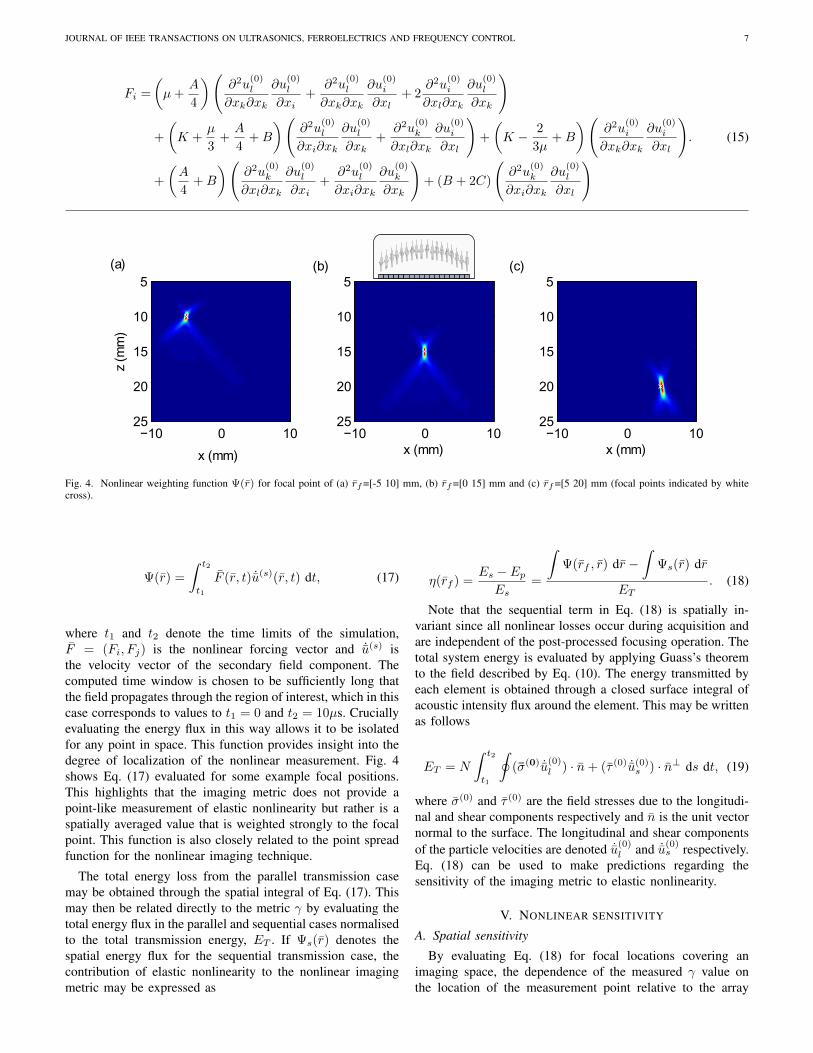
Fig. 4. Nonlinear weighting function Ψ(r) for focal point of (a) rf=[-5 10] mm, (b) rf=[0 15] mm and (c) rf=[5 20] mm (focal points indicated by whitecross).
Ψ(r) =
∫ t2
t1
F (r, t) ˙u(s)(r, t) dt, (17)
where t1 and t2 denote the time limits of the simulation,F = (Fi, Fj) is the nonlinear forcing vector and ˙u(s) isthe velocity vector of the secondary field component. Thecomputed time window is chosen to be sufficiently long thatthe field propagates through the region of interest, which in thiscase corresponds to values to t1 = 0 and t2 = 10µs. Cruciallyevaluating the energy flux in this way allows it to be isolatedfor any point in space. This function provides insight into thedegree of localization of the nonlinear measurement. Fig. 4shows Eq. (17) evaluated for some example focal positions.This highlights that the imaging metric does not provide apoint-like measurement of elastic nonlinearity but rather is aspatially averaged value that is weighted strongly to the focalpoint. This function is also closely related to the point spreadfunction for the nonlinear imaging technique.
The total energy loss from the parallel transmission casemay be obtained through the spatial integral of Eq. (17). Thismay then be related directly to the metric γ by evaluating thetotal energy flux in the parallel and sequential cases normalisedto the total transmission energy, ET . If Ψs(r) denotes thespatial energy flux for the sequential transmission case, thecontribution of elastic nonlinearity to the nonlinear imagingmetric may be expressed as
η(rf ) =Es − EpEs
=
∫Ψ(rf , r) dr −
∫Ψs(r) dr
ET. (18)
Note that the sequential term in Eq. (18) is spatially in-variant since all nonlinear losses occur during acquisition andare independent of the post-processed focusing operation. Thetotal system energy is evaluated by applying Guass’s theoremto the field described by Eq. (10). The energy transmitted byeach element is obtained through a closed surface integral ofacoustic intensity flux around the element. This may be writtenas follows
ET = N
∫ t2
t1
∮(σ(0) ˙u
(0)l ) · n+ (τ (0) ˙u(0)
s ) · n⊥ ds dt, (19)
where σ(0) and τ (0) are the field stresses due to the longitudi-nal and shear components respectively and n is the unit vectornormal to the surface. The longitudinal and shear componentsof the particle velocities are denoted ˙u
(0)l and ˙u
(0)s respectively.
Eq. (18) can be used to make predictions regarding thesensitivity of the imaging metric to elastic nonlinearity.
V. NONLINEAR SENSITIVITY
A. Spatial sensitivity
By evaluating Eq. (18) for focal locations covering animaging space, the dependence of the measured γ value onthe location of the measurement point relative to the array

JOURNAL OF IEEE TRANSACTIONS ON ULTRASONICS, FERROELECTRICS AND FREQUENCY CONTROL 8
x (mm)
z (m
m)
−20 0 20
10
20
30
40
50
60 −30 −20 −10 0 10 20 300
0.2
0.4
0.6
0.8
1
1.2
x (mm)
γ / γ
max
Numerical
Experimental
(a) (b)
Fig. 5. Spatial variation of measured nonlinear response (a) numerical surface η(rf ) (b) Experimental and numerical lateral section for z = 15mm.
can be determined. This is shown in Fig. 5(a), from whichit can be seen that the measured value for given elasticconstants will vary as a function of position. This is primarilya consequence of variations in the intensity of the focusedparallel field due to array directivity. Notably, as a result ofhigher order amplitude dependence, the region of insensitivityclose to the array is more pronounced than is seen withlinear imaging. This presents a potential practical challengefor near-surface nonlinear imaging. Fig. 5(a) also representsthe expected image generated for uniform elastic nonlinearityif all other factors contributing to the measured γ value canbe removed.
While it is difficult to experimentally validate the entiresurface shown in Fig. 5(a), it is comparatively straight forwardto acquire a lateral section of it. The fatigue crack specimenconsidered in the earlier example provides a discrete nonlinearelastic feature much stronger than the surrounding material. Assuch it can be used as a close experimental approximation to apoint-like nonlinear feature. By acquiring a series of nonlinearimages with the array translated relative to the crack positionthe lateral sensitivity can be examined. This translation isachieved by mechanically scanning the lateral position of thearray along the surface of the specimen. Taking the peaknonlinear value from these images allows a section of thespatial variation surface to be populated at a depth equal tothat of the crack tip. This is plotted in Fig. 5(b) alongside thenumerical equivalent, both normalized to their peak values.Good agreement is seen between the two, providing a degreeof validation for the numerical model.
This agreement also provides some insight into how thecrack responds to a focused field. Since the model assumesan isotropic elastic nonlinearity, this result suggests there isno strong directivity associated with the nonlinear responseof the crack. Despite the crack having a nominal direction ofgrowth, its topography on the scale of the field displacements(which is the length scale at which nonlinear contact-acoustic
effects occur and is in the order of nm) will be highlyirregular. There would therefore be no strongly preferentialdirection for surface normals, resulting in the measurementbeing rather insensitive to the direction of the incident field.This is important since it reduces the effect of factors suchas defect orientation on detectability. This is a proposedexplanation for the observed agreement between the modelingand experimental results observed for the crack consideredhere. This study however does not provide sufficient evidencethat this represents the general nonlinear response of fatiguecracks of any size and geometry.
B. N scaling
The dependence of the measured nonlinear response on thenumber of array elements and size of transmission aperture isnow examined. Firstly the case of imaging within a scalar fieldis considered. For this example the total transmitted energywill be proportional to N∆2. Neglecting effects of elementdirectivity, the parallel focal amplitude is proportional to N∆.For some arbitrary quadratic nonlinearity β, the energy fluxat the focal point for parallel transmission is proportional toβN4∆4 and for the sequential case is proportional to βN∆4.For this simplified approximation the measured nonlinearvalue would be
η =Es − EpEs
∝ ∆2(N3 − 1)β. (20)
It can be seen that for scalar field applications, such asbiomedical imaging, the nonlinear diffuse energy measurementwould have a cubic dependency on the number of transmittingelements. Consequently the sensitivity of the measurementcould be expected to be improved to any arbitrary degree sim-ply by increasing the number of array elements as illustratedin Fig 6(a).
The N scaling in application to nonlinear imaging of elasticsolids is not so straight forward due to the manner in which

JOURNAL OF IEEE TRANSACTIONS ON ULTRASONICS, FERROELECTRICS AND FREQUENCY CONTROL 9
10 20 30 40 50 600
0.2
0.4
0.6
0.8
1
N
γ / γ
max
NumericalExperimental
10 20 30 40 50 600
0.2
0.4
0.6
0.8
1
N
γ / γ
max
(a) (b)
Fig. 6. Nonlinear amplitude γ variation with number of transmitting elements for (a) scalar field (b) vector field.
amplitude vectors interfere. Take the example of an arrayfocused at a location below its center. At this focal positionthe vertical component of the amplitude vectors associatedwith the transmission of each element sum constructively,resulting in an increase in the stress seen by the materialfor parallel transmission. In this symmetric configuration thelateral components of the field interfere destructively therebynot contributing to any nonlinear energy flux in the parallelcase. As the transmission aperture of the array is increased,the edge elements contribute an increasing proportion of theiramplitude to the lateral direction. These additional elementstherefore add little to absolute intensity at the focal point butdo increase the total energy of the system. The consequenceof this is a limit to sensitivity that can be achieved throughincreasing element number. Simulation results for the effectof element number are shown in Fig. 6(b). It is seen thatinitially the the nonlinear metric has a high order dependencyon element number which then reduces as subsequent elementscontribute increasingly less to the focal amplitude. Continuingto increase the aperture size further will in fact eventuallyreduce the measured nonlinear value as the total systemenergy increases linearly with element number, resulting inthe existence of some optimal array size.
The effect of aperture size is also examined experimentallyby monitoring the peak nonlinear response of the fatigue crackspecimen as the number of elements used for transmissionis increased symmetrically from the center of the array. Thisis shown normalized to the maximum value in Fig. 6(b) inwhich excellent agreement can be seen with the numericalresults. As before, the good agreement with the model providesinsight into the nonlinear response of the fatigue crack. Themeasured nonlinear response of the crack is dominated by non-classical contact acoustic effects as is evident by the significantsubharmonic generation observed in similar specimens[19].The modeling here assumes a classical form of nonlinear-ity which is not representative of the underlying nonlinearmechanics of a closed crack. The model therefore can notpredict where, in terms of frequency or space, nonlinear energyflux occurs for such a defect. Despite this, the observed
experimental agreement suggests that the nonlinear behaviorin terms of total energy flux from the transmission bandwidthobeys quadratic amplitude scaling.
The smoothness of the function observed experimentally isperhaps unexpected since contact acoustic nonlinearity wouldbe expected to exhibit some amplitude dependent thresholdingbehavior. One possible explanation for this observation couldbe, in a similar manner to the apparent isotropy of theresponse, that the smoothness is a consequence of the averagedeffect of the complex geometry present at the scale of thedisplacements. Although any given contact point along thecrack may exhibit its own thresholding behavior, because eachcontact point has a different orientation and local stress state,when the total effect is averaged over the order of a wavelengthit behaves as a smooth function. The leveling off of theresponse around N = 10 is due to the limit of measurementsensitivity rather than an indication of thresholding behavior.
C. Amplitude dependence
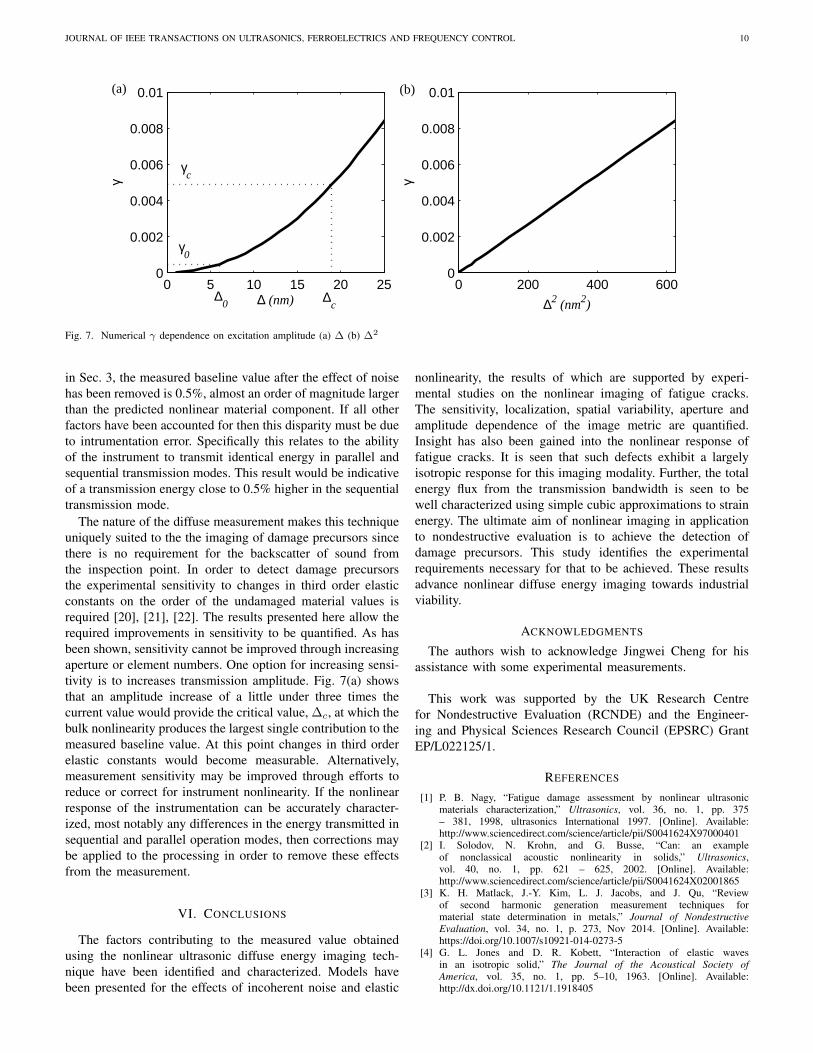
The computed relationship between transmission amplitude∆ and the nonlinear metric is plotted in Fig. 7. As is consistentwith the prediction of Eq. (20), γ is seen to be a quadratic func-tion of transmission amplitude. These results are computedusing third order elastic constants for undamaged aluminumand can therefore be used to predict the expected contributionof bulk material nonlinearity to the experimental baseline mea-surement. In order to relate these results to the experimentalexample considered here, the transmission amplitude must firstbe measured. A Polytec OFV-505 laser vibrometer was usedto measure the back wall displacement of the test block infront of a single transmitting element. The model parameter∆ is defined as the displacement one fundamental wavelengthin front of the element. After a correction is applied to themeasured back wall displacement to account for beam spreadthe experimental ∆ is found to be approximately 6nm.
As shown in Fig. 7(a), the predicted contribution from thebulk material nonlinearity of undamaged aluminium would be.07% (γ = 0.0007) for this excitation amplitude. As discussed
JOURNAL OF IEEE TRANSACTIONS ON ULTRASONICS, FERROELECTRICS AND FREQUENCY CONTROL 10
0 5 10 15 20 250
0.002
0.004
0.006
0.008
0.01
∆ (nm)
γ
0 200 400 6000
0.002
0.004
0.006
0.008
0.01
∆2 (nm2)
γ
γ0
γc
∆c
(a) (b)
∆0
Fig. 7. Numerical γ dependence on excitation amplitude (a) ∆ (b) ∆2
in Sec. 3, the measured baseline value after the effect of noisehas been removed is 0.5%, almost an order of magnitude largerthan the predicted nonlinear material component. If all otherfactors have been accounted for then this disparity must be dueto intrumentation error. Specifically this relates to the abilityof the instrument to transmit identical energy in parallel andsequential transmission modes. This result would be indicativeof a transmission energy close to 0.5% higher in the sequentialtransmission mode.
The nature of the diffuse measurement makes this techniqueuniquely suited to the the imaging of damage precursors sincethere is no requirement for the backscatter of sound fromthe inspection point. In order to detect damage precursorsthe experimental sensitivity to changes in third order elasticconstants on the order of the undamaged material values isrequired [20], [21], [22]. The results presented here allow therequired improvements in sensitivity to be quantified. As hasbeen shown, sensitivity cannot be improved through increasingaperture or element numbers. One option for increasing sensi-tivity is to increases transmission amplitude. Fig. 7(a) showsthat an amplitude increase of a little under three times thecurrent value would provide the critical value, ∆c, at which thebulk nonlinearity produces the largest single contribution to themeasured baseline value. At this point changes in third orderelastic constants would become measurable. Alternatively,measurement sensitivity may be improved through efforts toreduce or correct for instrument nonlinearity. If the nonlinearresponse of the instrumentation can be accurately character-ized, most notably any differences in the energy transmitted insequential and parallel operation modes, then corrections maybe applied to the processing in order to remove these effectsfrom the measurement.
VI. CONCLUSIONS
The factors contributing to the measured value obtainedusing the nonlinear ultrasonic diffuse energy imaging tech-nique have been identified and characterized. Models havebeen presented for the effects of incoherent noise and elastic
nonlinearity, the results of which are supported by experi-mental studies on the nonlinear imaging of fatigue cracks.The sensitivity, localization, spatial variability, aperture andamplitude dependence of the image metric are quantified.Insight has also been gained into the nonlinear response offatigue cracks. It is seen that such defects exhibit a largelyisotropic response for this imaging modality. Further, the totalenergy flux from the transmission bandwidth is seen to bewell characterized using simple cubic approximations to strainenergy. The ultimate aim of nonlinear imaging in applicationto nondestructive evaluation is to achieve the detection ofdamage precursors. This study identifies the experimentalrequirements necessary for that to be achieved. These resultsadvance nonlinear diffuse energy imaging towards industrialviability.
ACKNOWLEDGMENTS
The authors wish to acknowledge Jingwei Cheng for hisassistance with some experimental measurements.
This work was supported by the UK Research Centrefor Nondestructive Evaluation (RCNDE) and the Engineer-ing and Physical Sciences Research Council (EPSRC) GrantEP/L022125/1.
REFERENCES
[1] P. B. Nagy, “Fatigue damage assessment by nonlinear ultrasonicmaterials characterization,” Ultrasonics, vol. 36, no. 1, pp. 375– 381, 1998, ultrasonics International 1997. [Online]. Available:http://www.sciencedirect.com/science/article/pii/S0041624X97000401
[2] I. Solodov, N. Krohn, and G. Busse, “Can: an exampleof nonclassical acoustic nonlinearity in solids,” Ultrasonics,vol. 40, no. 1, pp. 621 – 625, 2002. [Online]. Available:http://www.sciencedirect.com/science/article/pii/S0041624X02001865
[3] K. H. Matlack, J.-Y. Kim, L. J. Jacobs, and J. Qu, “Reviewof second harmonic generation measurement techniques formaterial state determination in metals,” Journal of NondestructiveEvaluation, vol. 34, no. 1, p. 273, Nov 2014. [Online]. Available:https://doi.org/10.1007/s10921-014-0273-5
[4] G. L. Jones and D. R. Kobett, “Interaction of elastic wavesin an isotropic solid,” The Journal of the Acoustical Society ofAmerica, vol. 35, no. 1, pp. 5–10, 1963. [Online]. Available:http://dx.doi.org/10.1121/1.1918405

JOURNAL OF IEEE TRANSACTIONS ON ULTRASONICS, FERROELECTRICS AND FREQUENCY CONTROL 11
[5] A. J. Croxford, P. D. Wilcox, B. W. Drinkwater, and P. B. Nagy,“The use of non-collinear mixing for nonlinear ultrasonic detectionof plasticity and fatigue,” The Journal of the Acoustical Society ofAmerica, vol. 126, no. 5, pp. EL117–EL122, 2009. [Online]. Available:http://dx.doi.org/10.1121/1.3231451
[6] Y. Ohara, T. Mihara, R. Sasaki, T. Ogata, S. Yamamoto, Y. Kishimoto,and K. Yamanaka, “Imaging of closed cracks using nonlinearresponse of elastic waves at subharmonic frequency,” Applied PhysicsLetters, vol. 90, no. 1, p. 011902, 2007. [Online]. Available:http://dx.doi.org/10.1063/1.2426891
[7] C.-S. Park, J.-W. Kim, S. Cho, and D. chul Seo, “A highresolution approach for nonlinear sub-harmonic imaging,” NDT &E International, vol. 79, pp. 114 – 122, 2016. [Online]. Available:http://www.sciencedirect.com/science/article/pii/S0963869516000025
[8] P. Blanloeuil, L. Rose, J. Guinto, M. Veidt, and C. Wang,“Closed crack imaging using time reversal method based onfundamental and second harmonic scattering,” Wave Motion,vol. 66, pp. 156 – 176, 2016. [Online]. Available:http://www.sciencedirect.com/science/article/pii/S0165212516300658
[9] Y. Ohara, K. Takahashi, Y. Ino, K. Yamanaka, T. Tsuji, andT. Mihara, “High-selectivity imaging of closed cracks in a coarse-grained stainless steel by nonlinear ultrasonic phased array,” {NDT}& E International, vol. 91, pp. 139 – 147, 2017. [Online]. Available:http://www.sciencedirect.com/science/article/pii/S0963869517302359
[10] Y. Ohara, K. Takahashi, K. Jinno, and K. Yamanaka, “High-selectivityultrasonic imaging of closed cracks using global preheating and localcooling,” MATERIALS TRANSACTIONS, vol. 55, no. 7, pp. 1003–1010,2014.
[11] S. Haupert, G. Renaud, and A. Schumm, “Ultrasonic imagingof nonlinear scatterers buried in a medium,” NDT & EInternational, vol. 87, pp. 1 – 6, 2017. [Online]. Available:http://www.sciencedirect.com/science/article/pii/S0963869516303206
[12] J. N. Potter, A. J. Croxford, and P. D. Wilcox,“Nonlinear ultrasonic phased array imaging,” Phys. Rev.Lett., vol. 113, p. 144301, Oct 2014. [Online]. Available:https://link.aps.org/doi/10.1103/PhysRevLett.113.144301
[13] J. Cheng, J. N. Potter, A. J. Croxford, and B. W. Drinkwater,“Monitoring fatigue crack growth using nonlinear ultrasonic phasedarray imaging,” Smart Materials and Structures, vol. 26, no. 5,p. 055006, 2017. [Online]. Available: http://stacks.iop.org/0964-1726/26/i=5/a=055006
[14] C. Holmes, B. W. Drinkwater, and P. D. Wilcox, “Post-processing of the full matrix of ultrasonic transmitreceive arraydata for non-destructive evaluation,” NDT & E International,vol. 38, no. 8, pp. 701 – 711, 2005. [Online]. Available:http://www.sciencedirect.com/science/article/pii/S0963869505000721
[15] L. Landau and E. Lifshitz, in Theory of Elasticity (ThirdEdition). Butterworth-Heinemann, 1986. [Online]. Available:http://www.sciencedirect.com/science/article/pii/B9780080570693500048
[16] F. D. Murnaghan, “Finite deformations of an elastic solid,” AmericanJournal of Mathematics, vol. 59, no. 2, pp. 235–260, 1937. [Online].Available: http://www.jstor.org/stable/2371405
[17] G. F. Miller and H. Pursey, “The field and radiation impedanceof mechanical radiators on the free surface of a semi-infinite isotropic solid,” Proceedings of the Royal Society ofLondon A: Mathematical, Physical and Engineering Sciences,vol. 223, no. 1155, pp. 521–541, 1954. [Online]. Available:http://rspa.royalsocietypublishing.org/content/223/1155/521
[18] V. Lubarda, “New estimates of the third-order elasticconstants for isotropic aggregates of cubic crystals,” Journalof the Mechanics and Physics of Solids, vol. 45,no. 4, pp. 471 – 490, 1997. [Online]. Available:http://www.sciencedirect.com/science/article/pii/S0022509696001135
[19] J. N. Potter, J. Chen, A. J. Croxford, and B. W. Drinkwater, “Ultrasonicphased array imaging of contact-acoustic nonlinearity,” Proceedingsof Meetings on Acoustics, vol. 29, no. 1, p. 045002, 2016. [Online].Available: http://asa.scitation.org/doi/abs/10.1121/2.0000409
[20] J.-Y. Kim, L. J. Jacobs, J. Qu, and J. W. Littles, “Experimentalcharacterization of fatigue damage in a nickel-base superalloy usingnonlinear ultrasonic waves,” The Journal of the Acoustical Society ofAmerica, vol. 120, no. 3, pp. 1266–1273, 2006. [Online]. Available:http://dx.doi.org/10.1121/1.2221557
[21] J.-Y. Kim, J. Qu, L. J. Jacobs, J. W. Littles, and M. F. Savage,“Acoustic nonlinearity parameter due to microplasticity,” Journal ofNondestructive Evaluation, vol. 25, no. 1, pp. 28–36, Mar 2006.[Online]. Available: https://doi.org/10.1007/s10921-006-0004-7
[22] K. H. Matlack, J. J. Wall, J.-Y. Kim, J. Qu, L. J. Jacobs, and H.-W.Viehrig, “Evaluation of radiation damage using nonlinear ultrasound,”Journal of Applied Physics, vol. 111, no. 5, p. 054911, 2012. [Online].Available: http://dx.doi.org/10.1063/1.3692086