Embed Size (px)
Citation preview

Crowdsourcing affective responses to space
Erfassung affektiver Raumwahrnehmung durch Crowdsourcing
Silvia Klettner, Haosheng Huang, Manuela Schmidt, and Georg Gartner
Abstract
Humans perceive and evaluate environments subjectively. These interpretations influence daily
behavior and decision-making in space. Recently, due to the ubiquitous availability of smartphones
and the increasing growth of Web 2.0, crowdsourcing is emerging as a promising approach for
collecting and modeling people’s affective responses towards space. In this paper, we illustrate how
these affective responses can be crowdsourced, and how these collected datasets can help to study
the impact of environmental characteristics on people’s affective responses, as well as how these
responses differ among people with different characteristics, background, and contexts.
Keywords: emotion mapping, crowdsourcing, subjective geo-information, human-environment-
interaction
Zusammenfassung
Der Mensch erlebt und bewertet seine Umwelt. Derartige Interpretationen beeinflussen
Entscheidungen und Verhalten des Menschen im Raum. Durch die gegenwärtige Nutzung von
Smartphones und den zunehmenden Wachstum des Web 2.0 werden neue Möglichkeiten geschaffen,
um derartige affektive Bewertungen des Raumes zu erfassen. Crowdsourcing erweist sich dabei als
vielversprechender Ansatz. Dieser Beitrag veranschaulicht, wie affektive Raumdaten mittels
Crowdsourcing erfasst werden können, und wie derart erhobene Daten in weiterer Folge genutzt
werden können, um die affektive Wahrnehmung der Umwelt in Abhängigkeit von raumbezogenen
und personenbezogenen Eigenschaften sowie kontextuellen Bedingungen zu erforschen.
Schlüsselbegriffe: kartographische Darstellung von Emotionen, Crowdsourcing, subjektive
Geoinformation, Mensch-Raum-Beziehung
1. Affective responses towards space
To a large extent, daily behavior and decisions in space are influenced by an individual’s affective
interpretation of the environment. This is due to the fact that stimuli and environments are
perceived not only according to physical features, but also subjectively – in terms of a person’s
affective response towards them. According to Russell (2003) some affective response is always
present within a person, either perceived as neutral, moderate or extreme. When affect is moderate
or extreme, it can be consciously experienced as pleasant or unpleasant and form the basis of an
emotional experience (Barrett et al., 2007; Russell, 2003). When affect is milder, it influences
conscious experience and behavior in a less direct way. In this case, affect is experienced in the
background – as property of the environment (Russell, 2003; Barrett et al., 2007). These two
affective states – emotions and affective qualities of the environment – are common approaches for
investigating affective responses to space. However, emotions are multifaceted phenomena and
difficult to study. Due to their complexity and connection with other processes, there is no agreed-on
definition or method to clearly indicate and mark off emotions from other affective states, such as
mood or feelings.
Another way to study affective responses to space is by examining affective qualities of
environments. Affective qualities are experienced as properties of the external world, commonly
described with affect-denoting adjectives such as hectic, exciting, or beautiful. These affective
qualities are verbally attributed to a place, but have the ability to change a person's affective feeling
of pleasure or displeasure (Russell & Pratt, 1980; Russell, 2003). According to Russell (2003), the
perception of affective qualities is a ubiquitous process. People evaluate and judge their
surroundings routinely, at any time, whereas emotional experiences are rather infrequent, triggered
by intense or situational cues (Myrtek, 2004). A number of studies in the field of environmental
psychology indicate effects of environmental characteristics on wellbeing (Ulrich, 1984; Kaplan, 1993;
Hartig & Staats, 2006), satisfaction (Hur et al., 2010), and on behavior in space. Such behavioral
changes involve changes in the kind of social interaction in space (Sullivan et al., 2004), perceived
walkability of space (Leslie et al., 2005), as well as the choice for walking routes (Zacharias, 2001;
Borst et al., 2008). Data about people's preferences and avoidances of environments may be used in
various fields of research - one of which is navigation. Borst et al. (2008) studied route choices of
elderly people in relation to environmental attributes. Their findings suggest that people do not
simply decide for the shortest route, but that decisions in space are influenced by various
characteristics of the environment, such as parks, slopes, trees, front gardens, or shops.
Consequently, data about people's perception of space may be used to better predict people's route
choices, and support spatial behavior in a user-oriented way (Borst et al., 2009).
In this paper, we will illustrate how crowdsourcing can be used to collect people’s affective responses
towards space, and how these affective data can be used to study how people perceive and interact
with environments differently.
2. Collecting affective responses towards space
Affective responses towards space can be collected through various approaches (see Griffin &
McQuoid, 2012 for an extented review). Self reports and physiological recordings are among the
most prominent conventional methods for collecting such data. However, these approaches are
traditionally situated in rather artificial conditions (in laboratories with highly controlled conditions,
or have participants equipped with unhandy devices). Due to recent developments of new
technologies, novel methods and sources of data have become available for collecting affective
responses towards space. In the following we will describe some of these current approaches.
2.1 Psycho-physiological recordings
Sensors for collecting affective responses are becoming smarter, smaller and easily wearable in space.
Physiological recordings through these sensors (e.g. galvanic skin response, electrocardiogram)
provide an objective measure to affective responses gathered in space (Bergner et al., 2012; Hogertz,
2010). Affective responses are indicated by a person’s high or low arousal (e.g. high arousal as an
indicator for stress), with the advantage that users do not even need to recognize and label
physiological changes themselves. However, interpreting these data is quite challenging, since high
arousal may or may not be related or caused by emotional experiences.

2.2 Self reports
When affective data are collected through self reports, affective experiences are consciously named
and labelled by respondents. Such responses are subjective by nature, with the advantage of
approaching a person’s subjective experiences, interpreted by the individual, and expressed in
his/her own words. However, it may be difficult for some people to label affective experiences.
Culture and language shape an individual’s emotional vocabulary (Wierzbicka, 1999), but also inter-
individual differences on higher or lower emotional granularity (Barrett et al., 2007). People high in
emotional granularity represent mental contents in addition to valence (pleasure-displeasure),
whereas those low in granularity represent their experiences primarily as feelings of comfort (Barrett
et al., 2007). Taking into account these challenges, self-reports studies on affective responses must
be adapted to individual competences and be designed carefully.
Conventional methods for affective responses through self reports, are often rather extensive, time-
consuming, and laid out in rather artificial settings (e.g. in laboratories with highly controlled
conditions). However, within the last several years, online social networking websites and new
technologies have been developed rapidly, and many users start to express their affective responses
or comments towards space online. This opens new leads for gathering self-reported data.
2.3 Social media and Crowdsourcing
Due to the development of online social networking websites, recent research attentions have been
drawn to mining social media data to study people’s affective responses to space. Techniques on
natural language processing are often employed in these approaches for analyzing social media data.
For example, Mislove et al. (2010) extract the mood of people from different cities by mining
information on social media, i.e., tweets. This information is related to various places (e.g. states),
but is not collected as responses towards space. However, there is also some recent research on
mining affective responses towards space from social media. For example, Tauscher and Neumann
(2012) generate sentiment maps of touristic locations, by mining online tourist reviews. Hauthal and
Burghardt (2013) extract location-based emotions from photo titles, descriptions, and tags of Filckr
and Panoramio photos. However, it is important to note that data on social media are often noisy
and multilingual, and processing these data are still quite challenging. More importantly, this
approach often fails to collect affective responses from heterogeneous groups of people. Moreover,
affective responses from these sources may not be easily linked to the physical environment.
Recently, due to the ubiquitous availability and use of smartphones, and the rapid spread of Web 2.0,
researchers start to explore using smartphones to capture users’ self-reported affective responses.
With smartphones a large number of users can be reached and data can be collected in real-time,
real scenarios, anytime and anywhere. In this crowdsourcing approach, data can be collected in a
high granularity in space, and be automatically linked to the physical environment. Due to these
advantages using mobile phones for reporting subjective information appears to be a very promising
approach for gathering location-based subjective data, directly, efficiently, and in real-time.
Research has started to focus on developing mobile services, to gather users’ wellbeing and feelings
and to relate them to the geographic reference of their occurrence. The research project “Mappiness”
is among the most prominent of such mobile applications, aiming at studying people’s happiness in
relation to the local environment (MacKerron & Mourato, 2011). In particular, users are asked to rate
how happy, relaxed, and awake they are as well as for additional contextual and situational
information (e.g. current company, activity). The users’ location is stored automatically. This allows
for subsequently linking users’ ratings to characteristics of the environment. The research project
“Track Your Happiness” (Killingsworth & Gilbert, 2010), aims at investigating causes and correlates of
happiness. This research studies factors that affect people’s happiness in their daily lives. Information
is gathered (on a webpage or via smartphones) about a person's current wellbeing (“How do you feel
right now?”), and related to current activities, indoor or outdoor locations, company, time of day, etc.
However, in this project location is not obtained from a geographic position, but refers to the
situations or contexts users are in (e.g. at work, at home, in a car).
Present location based services for collecting affective experiences in space tend to focus on various
affective states of the users in relation to space. However, these services do not necessarily gather
experiences caused by environments. Whether the feelings reported are attributed to or even
evoked by environmental factors, remains unclear. To get more distinct data on this issue, it may be
necessary to ask the user more specifically of how the environment makes a person feel, instead of
asking “How are you?”, or as Russell (2003) suggests, directing people’s attention to their
surroundings by having people evaluate their environment.
3. Visualizing affective data
Affective data allow researchers to gain insight into people’s experiences towards space.
Visualization plays a key role in this. Different techniques are often employed to visualize affective
data, such as dot maps, choropleth maps, cartograms, and interpolated maps. Dot maps are usually
used if the data for visualization are point features, such as affective responses which are collected as
a set of point-based data. In dot maps, it is important to ensure that the dot is represented in its
correct spatial location. In contrast, choropleth maps use area symbols to depict the data. For
visualizing affective data with choropleth maps, different observations or recordings can be
aggregated to enumeration units, such as administrative boundaries. White (2007) provides an
example of using choropleth maps to visualize a “map of world happiness”. Similarly, cartograms are
also used for mapping affective data. In cartograms, the geometry of each enumeration unit is
distorted/scaled to reflect the variable (e.g. population) being mapped. Mislove et al. (2010) use
cartograms to visualize the mood in the USA extracted from Twitter messages (tweets). The area of
each state is scaled to be proportional to the number of tweets that originate from the state. In
contrast to the techniques described, interpolated maps consider affective responses to space as
continuous phenomena, and visualize affective data as a continuous surface or layer. Interpolation is
a method of finding the value of an unknown point according to a known set of discrete data points.
Estimating the value of an unknown point can be achieved with different interpolation algorithms,
such as Inverse Distance Weighting (IDW), Kriging, bilinear and cubic convolutions. Interpolated maps
can be used to effectively visualize the spatial distribution patterns of emotions (affective responses).
Jang (2012) shows an example on this, by using IDW to interpolate and visualize different emotions
on a 3D map.
4. The EmoMap project - Crowdsourcing-based emotion mapping
Environmental features are perceived and evaluated subjectively by individuals. Such evaluations
may influence a person’s behavior and decision-making in space. Hence, with the project EmoMap
we aim at gathering people’s affective responses to space through mobile phones, as well as at
modelling, and visualizing these data, which can then be incorporated into geospatial services and
applications, particularly into navigation services for pedestrians.
In general, the affective data collected in this study allow for the investigation of people’s evaluations
of space. At an individual level, these data can be used for studying similarities and differences of
experience and interpretations of space between individuals and within individuals. The data can also
be aggregated to study the impact of environmental characteristics on people’s affective responses,
as well as how these responses differ among people with different characteristics, and in different
contexts. All these contribute to a better understanding of human-environment interaction, as
studied in the disciplines of environmental psychology, geography, urban planning, and architecture.
As a result, the affective data can be aggregated to provide smart location based services (LBS). For
example, affective data can be aggregated to produce collective emotion maps in mobile city guides
for showing places of interest or unsafe places of a city. This layer of subjective information may
enhance people’s experiences while exploring a city (e.g. tourists). Mobile pedestrian navigation
systems can also benefit from affective data. Golledge (1995) shows that pedestrians – especially
when having enough time – favour different route qualities, such as safety, attractiveness, and
convenience, over shortness. These additional route qualities are subjective by nature and thus
difficult to measure and model with geometrical characteristics of the road network (Huang &
Gartner, 2012). However, aggregating affective data may be a promising approach to model such
subjective route qualities. For example, if similar users in similar context consider a specific place as
attractive, probably this place can be also viewed as attractive for the current user in the current
context. Therefore, smart routing services can be provided in LBS by aggregating affective responses
from similar users in similar context.
In the following section, we will particularly focus on collecting affective data, and how these data
can help to study the impact of environmental characteristics on people’s affective responses, as well
as how these responses differ among different groups of people.
4.1 Emotion-Space-Model
As a first task, an emotion-space model has to be laid out, aiming at making subjective data about
space easily reportable. Watson and Clark (1992) propose a hierarchical model, with two levels of
affective experiences: a higher order affect-dimension of valence (e.g., negative or positive affect)
and a lower order level of affective categories, which reflect specific contents of affect (e.g. fear,
anger, stress, etc.). In line with Watson’s and Clark’s model, and due to the fact of individual
differences regarding the ability to characterize affective experiences as broad versus discrete terms,
a hierarchical structure for collecting affective data in space was opted for this study. On the high
order level of this model, people’s level of comfort in space is gathered, whereas on the low order
level, users can optionally report more specific content regarding their affective experiences in space:
1. Level of comfort: According to Wierzbicka (1999) and Barrett et al. (2007) the level of
comfort can be easily perceived and reported by any person, independent of culture,
language, emotional vocabulary and granularity or age. Consequently the level of comfort in
a given environment is used as the basic level for gathering space-related affective data. In
particular, we ask the participants to rate their level of comfort in the environment they
were in: from comfortable to uncomfortable, on a 7-point Likert scale.
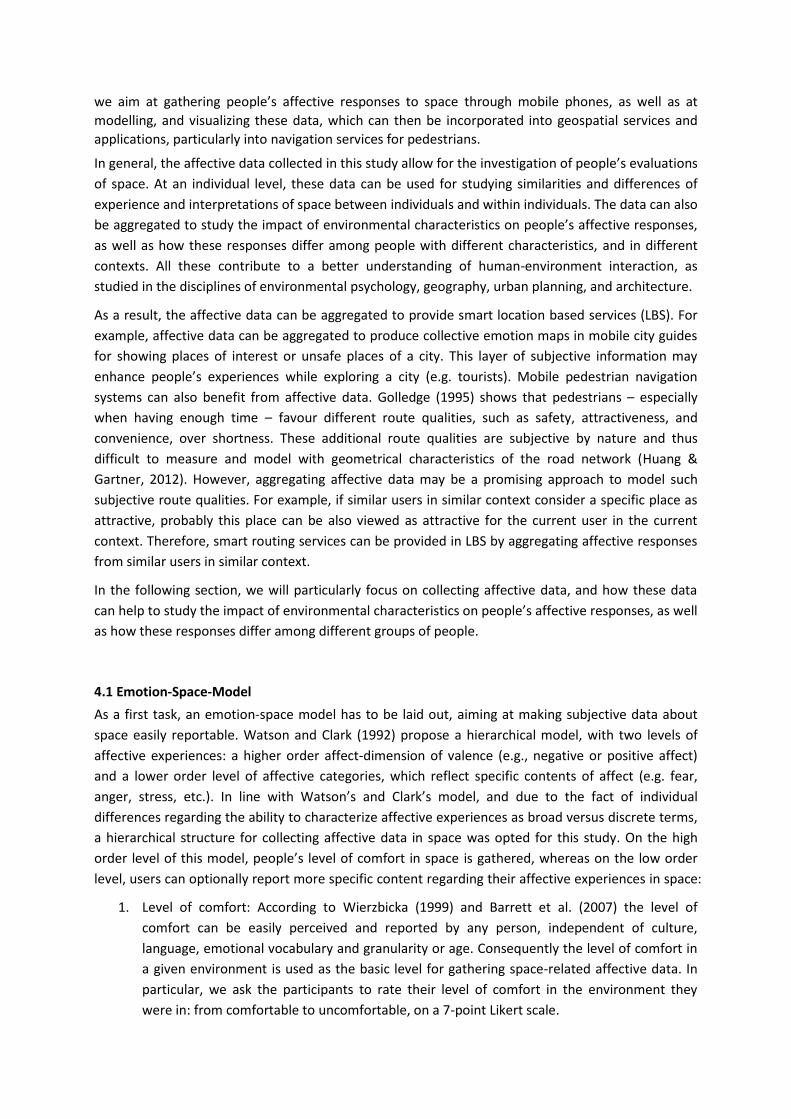
2. Level of distinct affective environmental qualities. In a second step, we ask the participants
to rate affective qualities of the current environment (Figure 1). The affect-denoted
parameters used in this project were obtained in a multistage method in several iterations:
67 affect-denoted environmental parameters were compiled by participants of a focus group
(N=9), reduced in online questionnaires to 12 parameters (N=102), and further aggregated
through factor analysis to four affect-denoted terms (safety, attractiveness, diversity, and
relaxation). These four factors are used in the emotion-space-model of this study. In
particular, participants are asked to rate their surroundings on a 7-point Likert scale,
regarding safety (unsafe-safe), attractiveness (unattractive-appealing), diversity
(monotonous-diverse), and relaxation (hectic-calm).
Figure 1: Screenshot of the Android application for collecting affective responses in space.
4.2 Data collection
Due to the ubiquitous use of smartphones and the increasing growth of Web 2.0, we collected
affective geographic data via crowdsourcing – from people using their smartphones to contribute
data. Based on the Emotion-Space-Model, a mobile application was set up to enable people to report
their affective responses towards space anytime and anywhere. The application (working on
smartphones with Android 2.1 or above) was available in English and in German and could be
downloaded for free from the project website. Due to GPS positions being automatically matched to
OpenStreetMap, data could be contributed without spatial restrictions.
With this crowdsourcing approach, we are able to acquire subjective data directly from the users –
without further retrospective interpretation needed –, reported in a high granularity in space, and
automatically linked to the physical environment. The approach aims at a direct, efficient, real-time
collection of data, evoked by realistic scenarios, leading to high ecological valid results.
4.3 Results
In total, until January 31st 2013, 2178 contributions were collected from 125 people (72 female vs.
53 male). The contributions are distributed in Austria, Germany, Switzerland, Czech Republic,
Slovakia, Slovenia, and China. However about 97% of the contributions are for the city of Vienna,
Austria. For analysis, we selected a particular area around Vienna University of Technology with 473
contributions from 79 participants.
In order to visually compare people's affective responses towards urban space, we depict these
affective responses with interpolated maps for each urban setting. For interpolation, we use the IDW
method, which is an effective way to visualize the spatial distribution patterns of emotions (affective
responses) (Jang, 2012). IDW estimates the value of an unknown point as a weighted average of the
neighboring known points, while the weights are assigned as the inverse of the distance to each
known point.
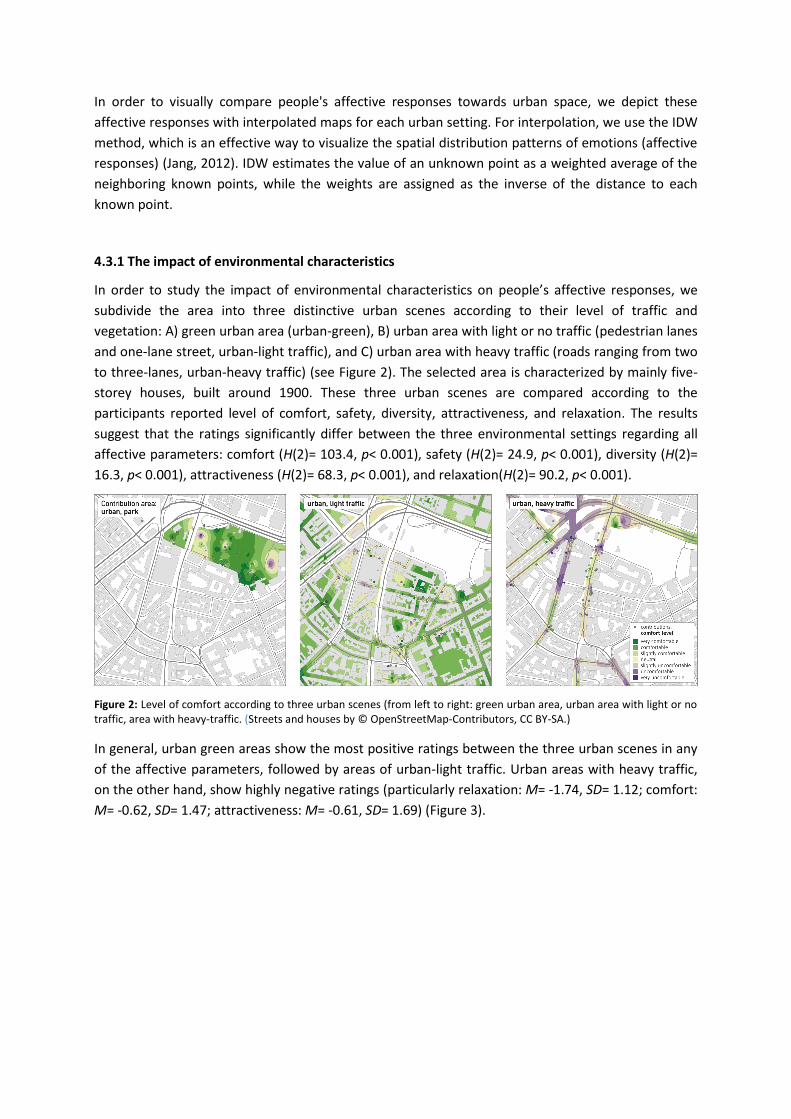
4.3.1 The impact of environmental characteristics
In order to study the impact of environmental characteristics on people’s affective responses, we
subdivide the area into three distinctive urban scenes according to their level of traffic and
vegetation: A) green urban area (urban-green), B) urban area with light or no traffic (pedestrian lanes
and one-lane street, urban-light traffic), and C) urban area with heavy traffic (roads ranging from two
to three-lanes, urban-heavy traffic) (see Figure 2). The selected area is characterized by mainly five-
storey houses, built around 1900. These three urban scenes are compared according to the
participants reported level of comfort, safety, diversity, attractiveness, and relaxation. The results
suggest that the ratings significantly differ between the three environmental settings regarding all
affective parameters: comfort (H(2)= 103.4, p< 0.001), safety (H(2)= 24.9, p< 0.001), diversity (H(2)=
16.3, p< 0.001), attractiveness (H(2)= 68.3, p< 0.001), and relaxation(H(2)= 90.2, p< 0.001).
Figure 2: Level of comfort according to three urban scenes (from left to right: green urban area, urban area with light or no traffic, area with heavy-traffic. (Streets and houses by © OpenStreetMap-Contributors, CC BY-SA.)
In general, urban green areas show the most positive ratings between the three urban scenes in any
of the affective parameters, followed by areas of urban-light traffic. Urban areas with heavy traffic,
on the other hand, show highly negative ratings (particularly relaxation: M= -1.74, SD= 1.12; comfort:
M= -0.62, SD= 1.47; attractiveness: M= -0.61, SD= 1.69) (Figure 3).
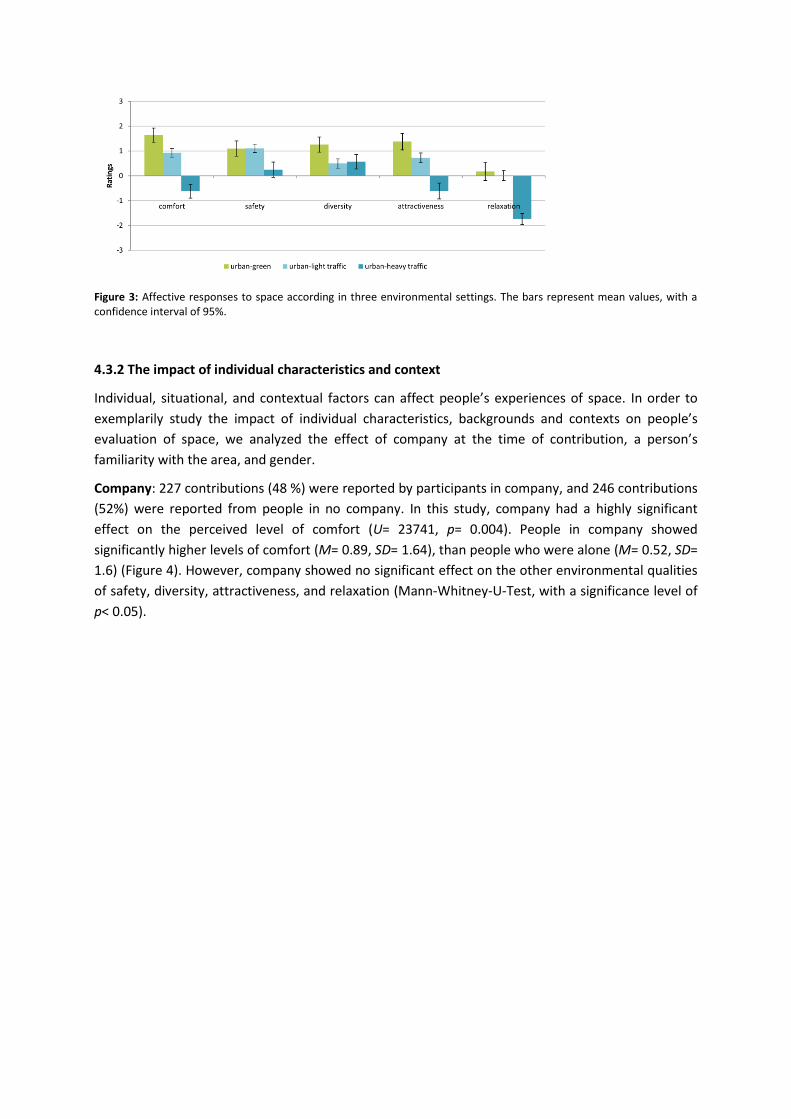
Figure 3: Affective responses to space according in three environmental settings. The bars represent mean values, with a confidence interval of 95%.
4.3.2 The impact of individual characteristics and context
Individual, situational, and contextual factors can affect people’s experiences of space. In order to
exemplarily study the impact of individual characteristics, backgrounds and contexts on people’s
evaluation of space, we analyzed the effect of company at the time of contribution, a person’s
familiarity with the area, and gender.
Company: 227 contributions (48 %) were reported by participants in company, and 246 contributions
(52%) were reported from people in no company. In this study, company had a highly significant
effect on the perceived level of comfort (U= 23741, p= 0.004). People in company showed
significantly higher levels of comfort (M= 0.89, SD= 1.64), than people who were alone (M= 0.52, SD=
1.6) (Figure 4). However, company showed no significant effect on the other environmental qualities
of safety, diversity, attractiveness, and relaxation (Mann-Whitney-U-Test, with a significance level of
p< 0.05).
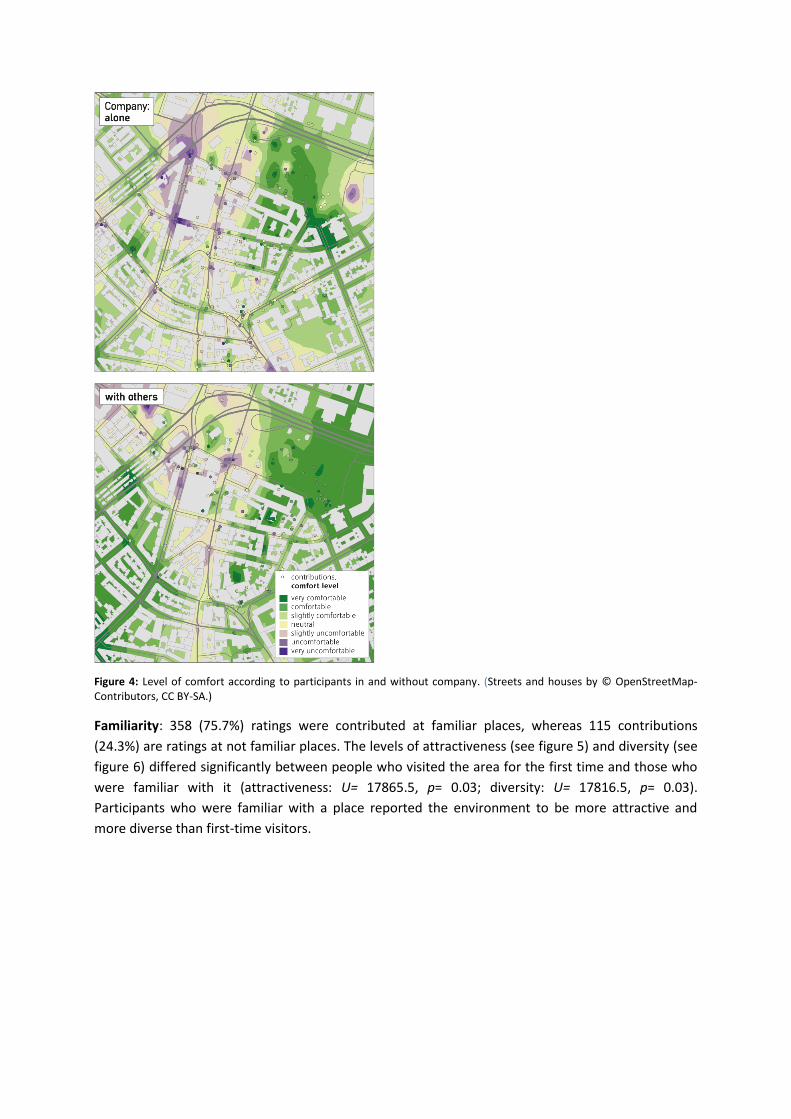
Figure 4: Level of comfort according to participants in and without company. (Streets and houses by © OpenStreetMap-Contributors, CC BY-SA.)
Familiarity: 358 (75.7%) ratings were contributed at familiar places, whereas 115 contributions
(24.3%) are ratings at not familiar places. The levels of attractiveness (see figure 5) and diversity (see
figure 6) differed significantly between people who visited the area for the first time and those who
were familiar with it (attractiveness: U= 17865.5, p= 0.03; diversity: U= 17816.5, p= 0.03).
Participants who were familiar with a place reported the environment to be more attractive and
more diverse than first-time visitors.
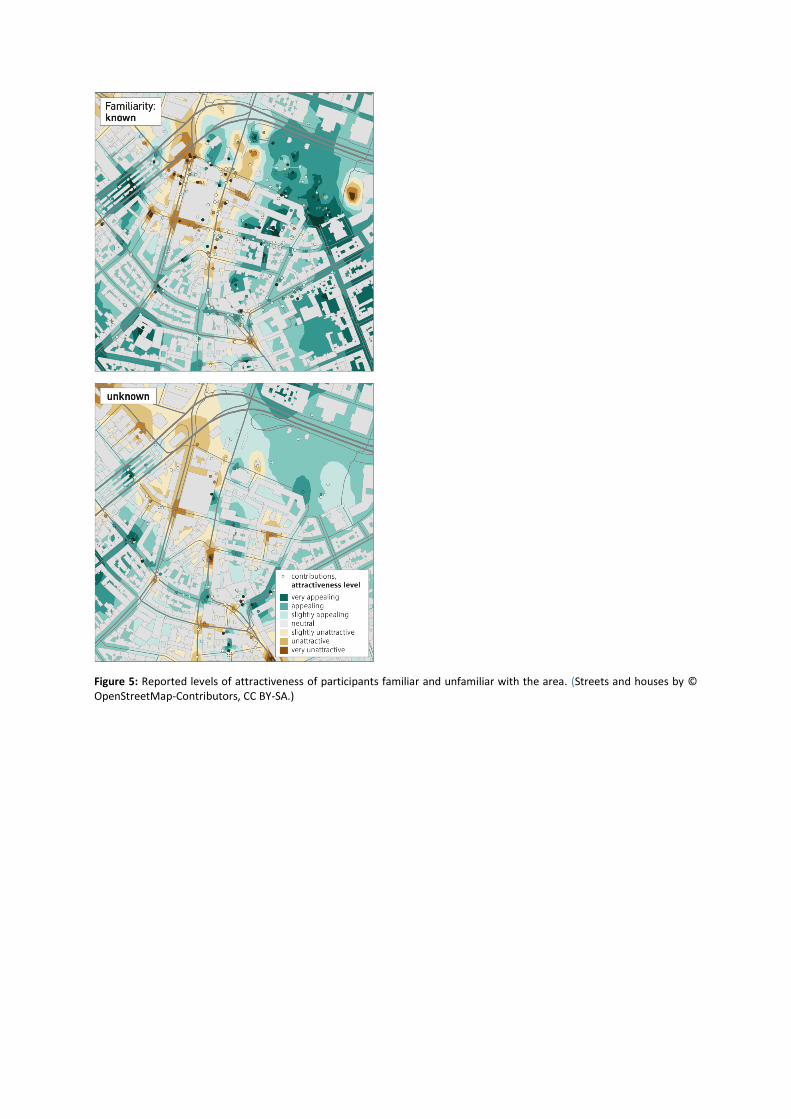
Figure 5: Reported levels of attractiveness of participants familiar and unfamiliar with the area. (Streets and houses by © OpenStreetMap-Contributors, CC BY-SA.)
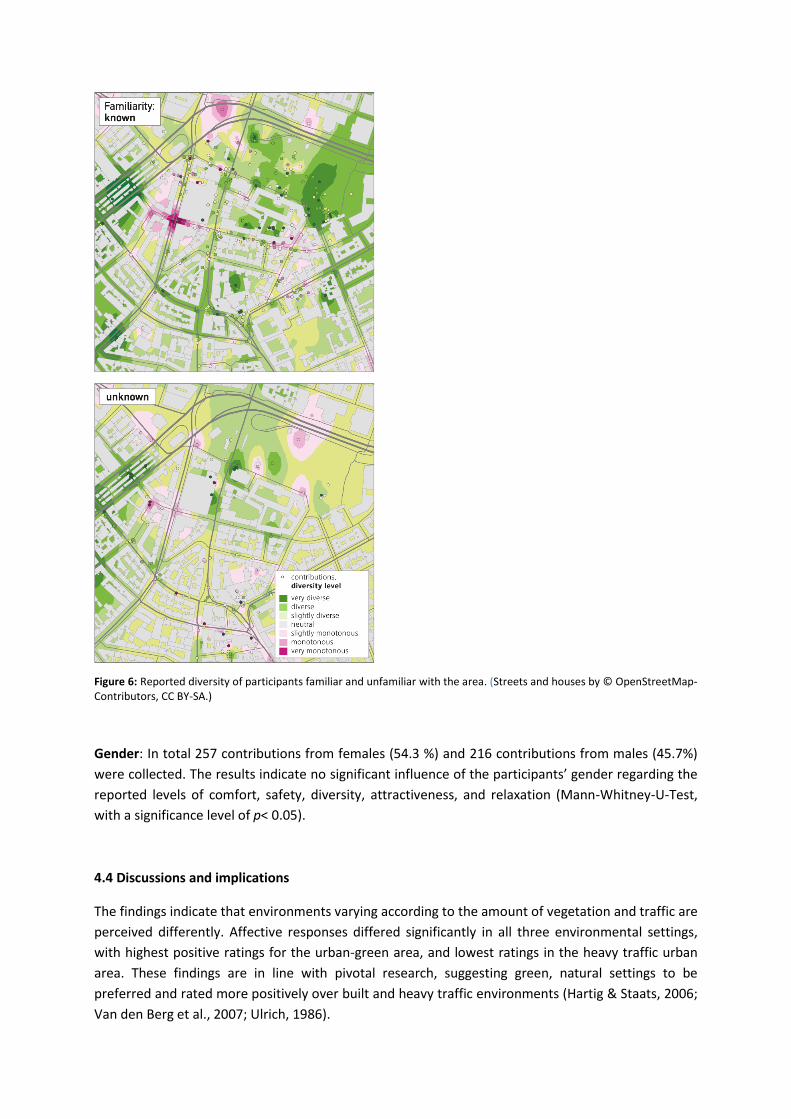
Figure 6: Reported diversity of participants familiar and unfamiliar with the area. (Streets and houses by © OpenStreetMap-Contributors, CC BY-SA.)
Gender: In total 257 contributions from females (54.3 %) and 216 contributions from males (45.7%)
were collected. The results indicate no significant influence of the participants’ gender regarding the
reported levels of comfort, safety, diversity, attractiveness, and relaxation (Mann-Whitney-U-Test,
with a significance level of p< 0.05).
4.4 Discussions and implications
The findings indicate that environments varying according to the amount of vegetation and traffic are
perceived differently. Affective responses differed significantly in all three environmental settings,
with highest positive ratings for the urban-green area, and lowest ratings in the heavy traffic urban
area. These findings are in line with pivotal research, suggesting green, natural settings to be
preferred and rated more positively over built and heavy traffic environments (Hartig & Staats, 2006;
Van den Berg et al., 2007; Ulrich, 1986).
We also showed that not only physical characteristics of the environment lead to different
experiences, but also that context (e.g. company) and familiarity influence an individual’s perception
of space. Familiarity as an influencing factor in evaluative judgments has been found in many pivotal
research (for an explanation of this phenomenon see Zajonc, 1968). In this study gender did not have
a significant influence on the perception of space. However, it is important to note that the
participants of this study were mainly students, and therefore a rather homogenous group. Hence,
gender differences in the evaluation of space may be prevalent in a different, more heterogeneous
sample. At this point it is also worth noting that the parameters analyzed in this study do not claim to
be exhaustive. Rather, it shows an excerpt of possible environmental, individual, and contextual
factors which may influence people’s affective responses to space. Other factors, such as temporal
environmental conditions (e.g. weather), contextual factors (e.g. purpose of walk), mood congruency
(Mayer et al., 1992; Forgas, 1995), and personality (McCrae & Costa, 1992; Gallagher, 1990), may
also influence evaluative judgments. Considering these parameters will help future studies to obtain
even more realistic and differentiated results.
Even with this rather homogenous group of participants, the results suggest that different urban
spaces evoke different affective experiences. Therefore, it can be expected that more significant
differences would be observed with heterogeneous groups of participants. As shown in literature,
daily behavior and decisions in space are influenced by these kinds of affective responses (Borst et al.,
2009; Sullivan et al., 2004; Coley et al., 1997). Therefore, in order to offer services that more
adequately support and suit users' needs and preferences, geospatial applications, especially LBS,
need to pay attentions to both the objective attributes of locations and people’s subjective
perception of space. As mentioned before, in a next step, we will try to collect more affective data
from different kinds of people, and incorporate these affective data into mobile pedestrian
navigation systems – one of the most popular LBS applications – to provide emotion-aware route
planning for pedestrians. Another implication taken from the above data analysis, is that affective
responses should be modeled not only in respect to where they refer to, but also in which context
they are contributed, e.g., company (with others vs. alone) and familiarity (first time visit vs. return
visit).
5 Summary and outlook
In this paper, approaches on modeling, gathering and visualizing these affective responses have been
discussed. As an illustration, we showed how these affective data can be crowdsourced and used to
answer the questions of “how are different types of environments perceived differently” and “do
people with different characteristics and background perceive the environment differently”.
However, applications of the affective data will not be restricted to this. Currently, we are working on
aggregating the collected data to enhance pedestrian navigation systems with more satisfying
routing services.
Until February 2013, the number of affective contributions is steadily growing. For a comprehensive
understanding about how environments are perceived by different groups of people, more data from
heterogeneous groups of participants must be collected. Currently, we are studying how to
encourage different groups of people to actively participate in the EmoMap project. Relevant
literature (Kim, 2000; Budhathoki & Haythornthwaite, 2012), as well as experiences and strategies
from successful Web 2.0 websites such as Foursquare, Facebook and Wikipedia will be analyzed and
adapted to achieve this aim.
With the increasing number of available affective responses, a subjective layer aggregating these
affective responses can be overlaid on top of the existing objective geospatial data. This subjective
layer brings many opportunities not only to gaining insight into how people interact within and
experience environments, but also to smart and innovative human-centered ICT (Information and
Communication Technology) applications, and as valuable basis for decisions for planning and
community-oriented measures in space.
It is important to note that, currently, we collected this affective information as point-data, i.e.,
affective data automatically annotated with GPS locations. While this approach frees the user from
manually reporting her/his location and thus facilitates the way of contributing, it also faces some
challenges, such as poor GPS accuracy in urban settings and ignorance of the fuzzy nature of the
location component. Research on fuzzy theory and place modeling should be combined to address
these challenges. We will investigate this issue in a follow-up project.
Acknowledgement
This paper is part of the research project EmoMap, which is funded by the Austrian Ministry of
Transportation, Innovation and Technology (BMVIT), managed by the Austrian FFG, within the
strategic program iv2splus.
Literature
Barrett, L.F., Mesquita, B., Ochsner, K.N. & Gross, J.J., 2007, The experience of emotions, Annual
Reviewed Psychology, 58, 373-403.
Bergner, B.S., Exner, J.P., Zeile, P. & Rumberg, M., 2012, Sensing the city – How to identify
recreational benefits of urban green areas with the help of sensor technology, In: Schrenk M.,
Popovich, V.V., Zeile, P. (Eds.): Proceedings REAL CORP 2012, Schwechat, 737-746.
Borst, H.C., DeVries, S.I., Graham, J.M.A., VanDongen, J.E.F., Bakker, I. & Miedema, H.M.E., 2009,
Influence of environmental street characteristics on walking route choice of elderly people, Journal
of Environmental Psychology, 29, 477–484.
Borst, H.C., Miedema, H.M.E., DeVries, S.I., Graham, J.M.A. & VanDongen, J.E.F., 2008, Relationships
between street characteristics and perceived attractiveness for walking reported by elderly people,
Journal of Environmental Psychology, 28, 353–361.
Budhathoki, N.R., & Haythornthwaite, C., 2012, Motivation for Open Collaboration: Crowd and
Community Models and the Case of OpenStreetMap, American Behavioral Scientist. Special issue
on wikis. Preprint published December 28, 2012 as doi: 10.1177/0002764212469364.
Coley, R.L., Kuo, F.E. & Sullivan, W.C., 1997, Where does community grow? The social context created
by nature in urban public housing, Environment and Behavior, 29(4), 468-494.
Forgas, J.P., 1995, Mood and judgment: the affect infusion model (AIM), Psychological bulletin,
117(1), 39.
Gallagher, D.J., 1990, Extraversion, neuroticism and appraisal of stressful academic events,
Personality and Individual Differences, 11, 1053–1057.
Golledge, R., 1995, Defining the criteria used in path selection, Technical Report UCTC No. 78,
University of California Transportation Center.
Griffin, A.L. & J McQuoid J., 2012, At the Intersection of maps and emotion: the challenge of spatially
representing experience, Kartographische Nachrichten, 6, 291-299.
Hartig, T., & Staats, H., 2006, The need for psychological restoration as a determinant of
environmental preferences, Journal of Environmental Psychology, 26, 215-226.
Hauthal E. & Burghardt D., 2013, Extraction of location-based Emotions from Photo Platforms, In:
Krisp J. (Ed.) Progress in Location-Based Services, Springer.
Hogertz, C. (2010), Emotions of the urban pedestrian: sensory mapping, Pedestrians’ Quality Needs,
31-52.
Huang, H. & Gartner, G., 2012, Collective intelligence-based route recommendation for assisting
pedestrian wayfinding in the era of Web 2.0, Journal of Location Based Services, 6(1), 1-21.
Hur, M., Nasar, J.L. & Chun, B., 2010, Neighborhood satisfaction, physical and perceived naturalness
and openness, Journal of Environmental Psychology, 30, 52-59.
Jang, M., 2012, Three-dimensional visualization of an emotional map with geographical information
systems: a case study of historical and cultural heritage in the Yeongsan River Basin, Korea,
International Journal of Geographical Information Science, 26(8), 1393-1413.
Kaplan, R. & Kaplan, S., 1989, The experience of nature: a psychological perspective, Cambridge
University Press, Cambridge.
Kaplan, R., 1993, The role of nature in the context of the workplace, Landscape and Urban Planning,
26, 193-201.
Killingsworth, M.A., & Gilbert, D.T., 2010, A wandering mind is an unhappy mind, Science, 330(6006),
932-932.
Kim, A.J. , 2000, Community building on the web, Peachpit Pr.
Leslie, E., Saelens, B., Frank, L., Owen, N., Bauman, A., & Hugo, G., 2005, Residents' perceptions of
walkability attributes in objectively different neighbourhoods: a pilot study, Health and Place, 11(3),
227-36.
MacKerron, G. & Mourato, S., 2011, mappiness.org.uk.
Mayer, J.D., Gaschke, Y.N., Braverman, D.L., & Evans, T.W., 1992, Mood-congruent judgment is a
general effect, Journal of Personality and Social Psychology, 63(1), 119.
McCrae, R.R., & John, O.P., 1992, An introduction to the five-factor model and its applications,
Special Issue: the five-factor model: issues and applications, Journal of Personality, 60, 175–215.
Mislove, A., Lehmann, S., Ahn, Y.-Y., Onnela, J.P. & Rosenquist, J.N., 2010, Pulse of the Nation: U.S.
mood throughout the day inferred from Twitter, Available from:
http://www.ccs.neu.edu/home/amislove/twittermood/.
Myrtek, M., 2004, Heart and emotion, Ambulatory monitoring studies in everyday life, Cambridge,
MA: Hogrefe & Huber Publishers.
Russell, J.A. & Pratt, G., 1980, A description of the affective quality attributed to environments,
Journal of Personality and Social Psychology, 38(2), 311-322.

Russell, J.A., 2003, Core affect and the psychological construction of emotion, Psychological Review,
110(1), 145-172.
Sullivan, W.C., Kuo, F.E. & Depooter, S., 2004, The fruit of urban nature: Vital neighborhood spaces.
Environment & Behavior, 36(5), 678-700.
Tauscher S. & Neumann K., 2012, Combining web map services and opinion mining to generate
sentiment maps of touristic locations. In: Jobst M. (Ed.) Service Oriented Mapping 2012, JobstMedia
Management Verlag Wien, 277-286.
Ulrich, R.S., 1984, View through a window may influence recovery from surgery, Science, 224, 420-
421.
Ulrich, R.S., 1986, Human responses to vegetation and landscapes, Landscape and Urban Planning, 13,
29-44.
Van den Berg, A.E., Hartig, T. & Staats, H., 2007, Preferences for nature in urbanized societies: stress,
restoration, and the pursuit of sustainability, Journal of Social Issues, 63(1), 79-96.
Watson, D. & Clark, L.A., 1992, Affects separable and inseparable: On the hierarchical arrangement of
the negative affects, Journal of Personality and Social Psychology, 62, 489–505.
White, A., 2007, A Global Projection of Subjective Well-being: A Challenge to Positive Psychology?,
Psychtalk, 56, 17-20.
Wierzbicka, A., 1999, Emotions across languages and cultures: Diversity and universals, Cambridge
[u.a.]: Cambridge University Press.
Zacharias, J., 2001, Path choice and visual stimuli: Signs of human activity and architecture, Journal of
Environmental Psychology, 21, 341-352.
Zajonc, R.B., 1968, Attitudinal effects of mere exposure, Journal of Personality and Social Psychology,
9(2, part 2), 1-28.
About the authors:
Silvia Klettner, environmental psychologist, research assistant, and PhD candidate at the Research
Group of Cartography at the Vienna University of Technology. Email: [email protected].
Haosheng Huang, PhD, computer scientist, research assistant, and PhD candidate at the Research
Group of Cartography at the Vienna University of Technology. Email:
Manuela Schmidt, cartographer, university assistant, and PhD candidate at the Research Group of
Cartography at the Vienna University of Technology. Email: [email protected].
Prof. Dr. Georg Gartner, Professor for Cartography and Geo-Mediatechniques at the Research Group
of Cartography at the Vienna University of Technology, Austria; President of the International
Cartographic Association (ICA); Member of the Executive Board of the Austrian Geographic Society.
Email: [email protected].


![Analysing user physiological responses for affective video ... · Analysing user physiological responses for affective video ... [52] summarise music videos automatically by using](https://img.pdfslide.us/doc/110x75/603579fb21ea6862b9609541/analysing-user-physiological-responses-for-affective-video-analysing-user-physiological.jpg)