Embed Size (px)
Citation preview
Cross-Platform Machine Learning Characterization
for Task Allocation in IoT Ecosystems
Wanlin Cui Yeseong Kim Tajana S. Rosing University of California San Diego {w8cui, yek048, tajana}@ucsd.edu
Abstract— With the emergence of the Internet of Things (IoT)
and Big Data era, many applications are expected to assimilate a
large amount of data collected from environment to extract
useful information. However, how heterogeneous computing devices of IoT ecosystems can execute the data processing
procedures has not been clearly explored. In this paper, we
propose a framework which characterizes energy and
performance requirements of the data processing applications
across heterogeneous devices, from a server in the cloud and a resource-constrained gateway at edge. We focus on diverse
machine learning algorithms which are key procedures for
handling the large amount of IoT data. We build analytic models
which automatically identify the relationship between
requirements and data in a statistical way. The proposed framework also considers network communication cost and
increasing processing demand. We evaluate the proposed
framework on two heterogenous devices, a Raspberry Pi and a
commercial Intel server. We show that the identified models can
accurately estimate performance and energy requirements with less than error of 4.8% for both platforms. Based on the models,
we also evaluate whether the resource-constrained gateway can
process the data more efficiently than the server in the cloud. The
results present that the less-powerful device can achieve better
energy and performance efficiency for more than 50% of machine learning algorithms.
I. INTRODUCTION
The emerging Internet of Things (IoT) applications involve
many data-driven and informat ion retrieving procedures to efficiently serve Big Data [1]. As evidenced by the appearance
of industrial IoT gateways and microprocessors specialized for IoT workloads, IoT systems present more complex device
hierarchy including new computing nodes, e.g. wearables and smarter gateways [2,3,4]. Traditionally, a system candidate
widely assumed to perform the data processing procedures is parallel system architectures on clouds which mask the
computation burden by taking advantage of multiple powerful
processors [5]. However, the assumption is facing many challenging issues such as security, quick and reliab le response
in unreliable and constrained network conditions [6]. In this context, fog computing, also known as edge computing, has
been considered as an alternative solution to decentralize the application services into different places which the data are
produced [7]. For example, a gateway enhanced with
processing capability could also execute a wide range of machine learn ing algorithms instead of transferring large data
for the cloud computing [2].
An important research question related to this new view of
the IoT device hierarchy is how to determine and balance the data processing workload across completely different IoT
devices, e.g., powerful servers vs. gateway devices. Some research has investigated how to allocate tasks across either
similar platforms, e.g., task migration in data centers [10, 11]
or different architectures for specific tasks, e.g., mobile computation offloading [12]. In the context of the IoT and Big
Data, we further need to exp licitly quantify the performance and energy requirement of emerg ing data processing
applications and machine learnings . Thus, it is essential to model the application behaviors across the heterogenous IoT
devices. In addition, the modeling procedure should be
automated to cover the increasing number of IoT applications. In this paper, we propose a novel cross-architecture data
processing application characterization framework, called CrossTest, which examines and quantifies energy and
performance requirements of diverse applications, when heterogeneous devices of the IoT hierarchy communicate with
each other to transfer data of various sizes. To this end, our framework first builds cross-platform models which predict the
requirement of the applications with the consideration of the
data size. To cover d iverse data processing applications of IoT, the proposed model generation is completely automated and do
not require any prior knowledge of the characterized applications. In addition, the models are carefully generated to
avoid under- and overfitting issues so that they accurately identify resource demands of the future data processing in the
Big Data domain. The proposed framework also investigates
how the network bandwidths affect system resource usage of the data communication between a server in the cloud and a
gateway device at the edge. Based on the identified models for the application requirements and the network communication
costs, we perform a what-if analysis which verifies whether a gateway device can execute diverse data processing
applications more efficiently, in terms of energy and
performance, than the server platform. We evaluate our framework with Raspberry Pi and Intel
SR1560SF server, in which they represent two state-of-the-art heterogeneous devices, a resource-constrained gateway and a
commercial server platform, respectively. In this work, we focus on machine learning (ML) algorithms which are the
common key parts of IoT data processing applications. We show that the proposed models can accurately estimate the
performance and energy consumption of the applications which
perform ML algorithms, with less than error of 4.8% for both the two platforms. We also show a practical value of the
978-1-5090-4228-9/17/$31.00 ©2017 IEEE
generated models by addressing a task allocation problem of
IoT ecosystems, i.e., where to execute a data processing application between a gateway device and a powerful server. In
the evaluation, we present that more than 50% of ML algorithms can be executed on a resource constrained device
with better energy and performance efficiency.
II. RELATED WORK
A swarm of IoT devices is expected to produce a large
amount of data than ever before more than 2000 terabytes [1]. To efficiently provide up-to-date informat ion and better quality
of the service by assimilat ing the Big Data, the IoT ecosystems should mitigate computation burden of clouds by performing a
part of application tasks at edge [8]. Many applications have been actively developed across heterogeneous computing
devices, from embedded systems to high-performance systems using diverse machine learning algorithms, such as information
identification [2,3] and context recognition [9].
To understand impact of the data processing algorithms, earlier researchers have characterized resource usage of various
IoT applications for different system platforms. For example, Magalhães et al. [10] modeled resource usage of real-world
applications such as browsing and bidding on clouds platforms. Lee et al. [11] directly focused on the key procure of the IoT
applications for power efficiency of large-scale systems.
Kliazovich et al. [23] presented a workload distribution simulator which estimates energy consumption of components
in data centers including servers and switches. Recent research has also focused on workload characterizations on resource-
constrained devices, e.g., gateways [2], since the less-powerful computing devices would be closer to raw sensory data
produced by small IoT devices and thus able to process them in
a more efficient way than the servers. For example, Carbajales et al. [13] investigated the power requirement of data sensing
on Raspberry Pi as a representation of a small device. Lane et al. [14] characterized neural network algorithms for various
embedded devices including wearables and smartphones. Bellagente et al. [15] examined the feasibility of typical tasks
of gateways on state-of-the-art embedded systems. Such research efforts have focused on a specific application
and similar computing devices. However, the IoT ecosystems
are expected to include diverse computing nodes of completely different architectures. Thus, workload characteristics should
be understood in notion of IoT ecosystem hierarchy. We focus on the cross-platform characterization of IoT data processing
workloads, in particular, a wide range of machine learning algorithms.
III. AUTOMATED CHARACTERIZATION OF
MACHINE LEARNING ALGORITHMS
A. Measurement Setup We consider two heterogeneous device platform candidates
in the IoT computing node which exhibit significantly different computing power: a gateway-level device and a server. In
literature [2,7], gateway-level devices may collect raw sensory data from other IoT devices, e.g., smartphone and wearables,
and process them internally if required. As a counterpart,
centralized server platforms in the cloud can also process ML
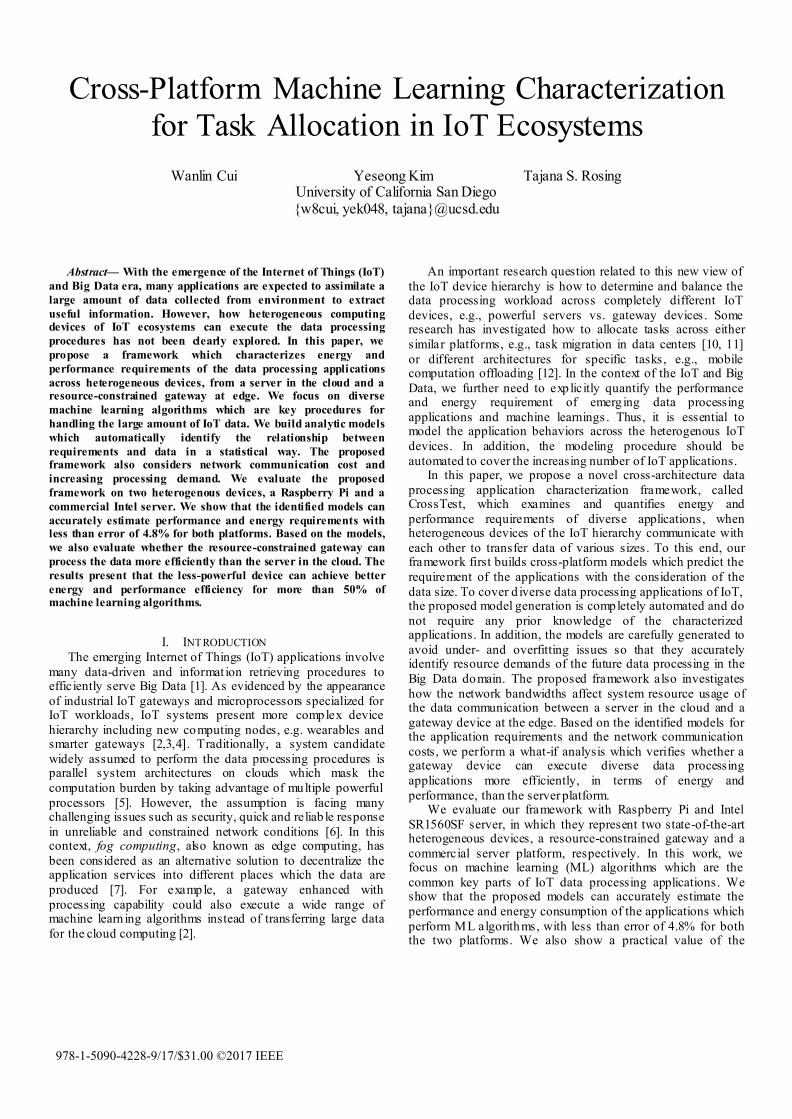
algorithms [1, 12] once the collected raw sensory data are transferred. Figure 1 shows our measurement setup which
identifies the system requirements of the two target platforms . For the representation of a resource-constrained device, we use
Raspberry Pi 2 running with Linux systems which can also serve typical tasks of gateways [2]. For the representation of
the powerful server platforms, a commercial Intel SR1560SF server is used. The detailed specifications of the two devices
are summarized in Table 1. The two devices use different
instruction set architectures (ISA), i.e., x86 and ARM. In the rest of the paper, we call the two devices as Gateway and
Server, in short. We execute diverse data processing applications, 22 in
total, on both devices as labeled with (i) in Figure 1. A wide range of machine learning algorithms, which perform
classification, clustering, and regression tasks, are used as
representatives of the data processing applications. Table 2 shows the list of experimented machine learning algorithms.
For architectural compatibility of applications, the algorithms are implemented with Python 2.7 using scikit-learn library
[16]. We also evaluate requirements of network communication of the Gateway, as labeled with (ii) in Figure 1,
to understand how much additional network cost is required in
the resource-constrained device. We use a microbenchmark that generates network packets while the network bandwidth is
controlled by wondershaper tool. The RPi can transfer data by up to 40Mbps and 100 Mbps of bandwidths for WiFi and
Ethernet, respectively. While executing each algorithm and network communications, we also measured the machine
power consumption of the two p latforms using HIOKI 3334 power meter [19].
Table 1. Evaluated Computing Nodes
Type Specification
Gateway at
edge:
Raspberry Pi 2
ARMv7 Cortex A7 processor (4 cores,
900MHz)
DRAM size: 1GB
Ethernet: SMSC LAN9514 10/100 Controller
WiFi: Edimax EW-7811Un 802.n Adapter
Server in cloud:
Intel SR1560SF
Intel Xeon E5440 processor (8 cores @
2.83GHz)
DRAM size: 8GB
Figure 1. Measurement Setup
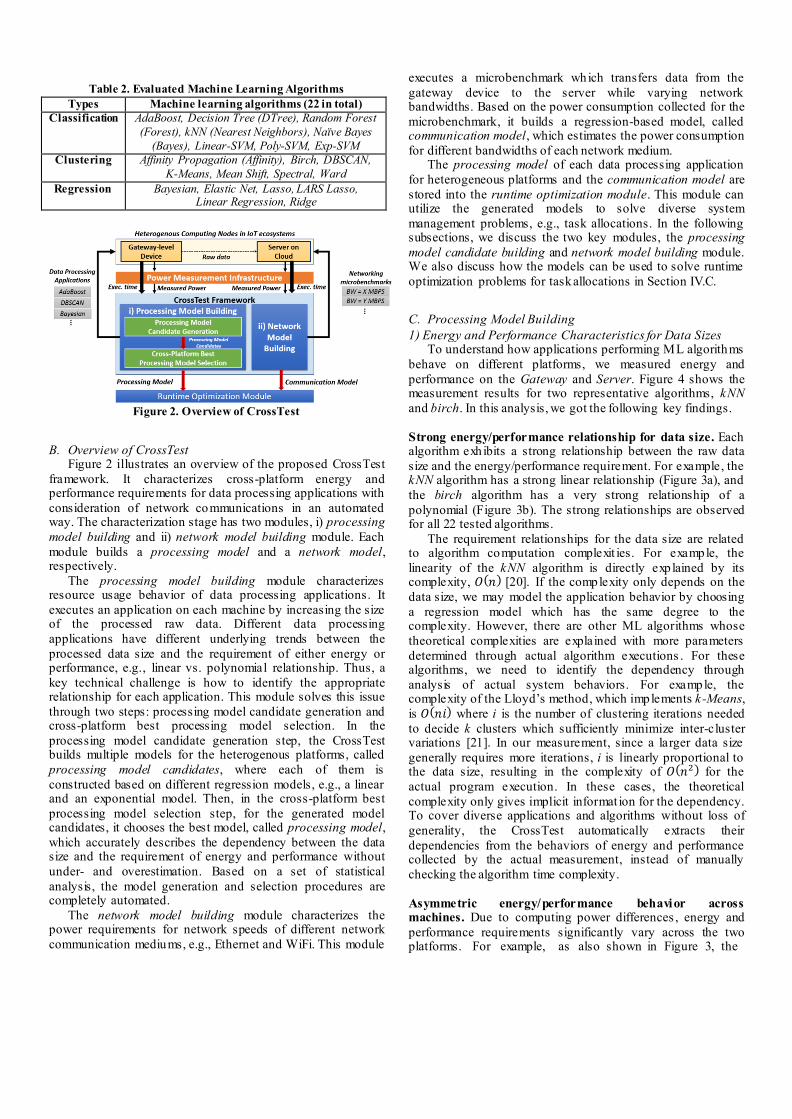
Table 2. Evaluated Machine Learning Algorithms
Types Machine learning algorithms (22 in total)
Classification AdaBoost, Decision Tree (DTree), Random Forest
(Forest), kNN (Nearest Neighbors), Naïve Bayes
(Bayes), Linear-SVM, Poly-SVM, Exp-SVM
Clustering Affinity Propagation (Affinity), Birch, DBSCAN,
K-Means, Mean Shift, Spectral, Ward
Regression Bayesian, Elastic Net, Lasso, LARS Lasso, Linear Regression, Ridge
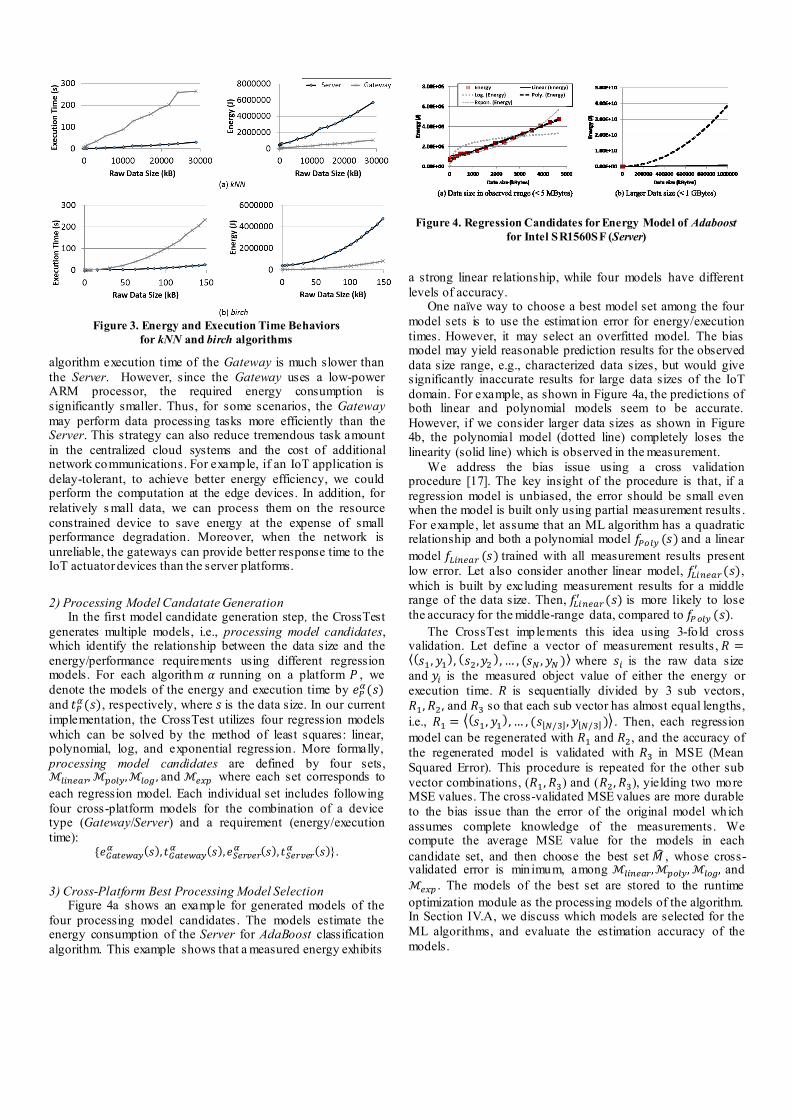
B. Overview of CrossTest Figure 2 illustrates an overview of the proposed CrossTest
framework. It characterizes cross-platform energy and performance requirements for data processing applications with
consideration of network communications in an automated way. The characterization stage has two modules, i) processing
model building and ii) network model building module. Each
module builds a processing model and a network model, respectively.
The processing model building module characterizes resource usage behavior of data processing applications. It
executes an application on each machine by increasing the size of the processed raw data. Different data processing
applications have different underlying trends between the
processed data size and the requirement of either energy or performance, e.g., linear vs. polynomial relationship. Thus, a
key technical challenge is how to identify the appropriate relationship for each application. This module solves this issue
through two steps: processing model candidate generation and cross-platform best processing model selection. In the
processing model candidate generation step, the CrossTest builds multiple models for the heterogenous platforms, called
processing model candidates, where each of them is
constructed based on different regression models, e.g., a linear and an exponential model. Then, in the cross-platform best
processing model selection step, for the generated model candidates, it chooses the best model, called processing model,
which accurately describes the dependency between the data size and the requirement of energy and performance without
under- and overestimation. Based on a set of statistical
analysis, the model generation and selection procedures are completely automated.
The network model building module characterizes the power requirements for network speeds of different network
communication mediums, e.g., Ethernet and WiFi. This module
executes a microbenchmark which transfers data from the
gateway device to the server while varying network bandwidths. Based on the power consumption collected for the
microbenchmark, it builds a regression-based model, called communication model, which estimates the power consumption
for different bandwidths of each network medium. The processing model of each data processing application
for heterogeneous platforms and the communication model are
stored into the runtime optimization module. This module can utilize the generated models to solve diverse system
management problems, e.g., task allocations. In the following subsections, we discuss the two key modules, the processing
model candidate building and network model building module. We also discuss how the models can be used to solve runtime
optimization problems for task allocations in Section IV.C.
C. Processing Model Building
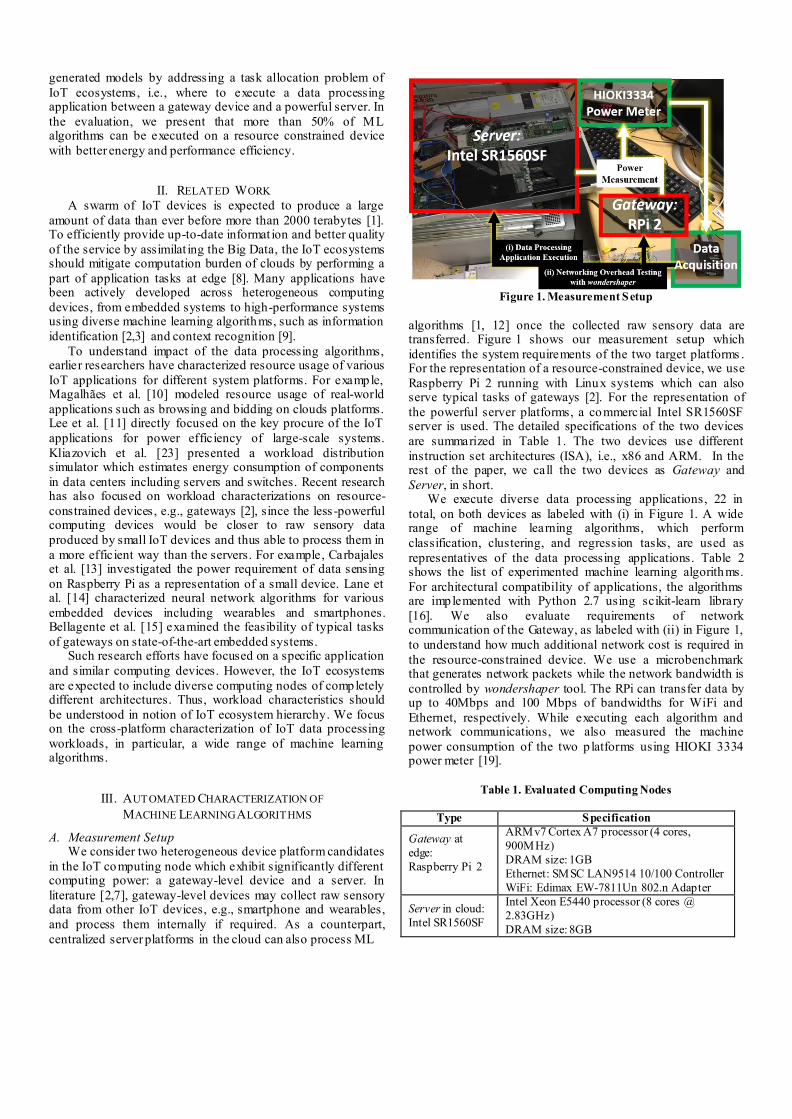
1) Energy and Performance Characteristics for Data Sizes To understand how applications performing ML algorithms
behave on different platforms, we measured energy and
performance on the Gateway and Server. Figure 4 shows the measurement results for two representative algorithms, kNN
and birch. In this analysis, we got the following key findings.
Strong energy/performance relationship for data size. Each algorithm exhibits a strong relationship between the raw data
size and the energy/performance requirement. For example, the kNN algorithm has a strong linear relationship (Figure 3a), and
the birch algorithm has a very strong relationship of a
polynomial (Figure 3b). The strong relationships are observed for all 22 tested algorithms.
The requirement relationships for the data size are related to algorithm computation complexit ies. For example, the
linearity of the kNN algorithm is directly exp lained by its complexity, 𝑂(𝑛) [20]. If the complexity only depends on the
data size, we may model the application behavior by choosing
a regression model which has the same degree to the complexity. However, there are other ML algorithms whose
theoretical complexities are explained with more parameters
determined through actual algorithm executions . For these algorithms, we need to identify the dependency through
analysis of actual system behaviors. For example, the complexity of the Lloyd’s method , which implements k-Means,
is 𝑂(𝑛𝑖) where i is the number of clustering iterations needed
to decide k clusters which sufficiently minimize inter-cluster variations [21]. In our measurement, since a larger data size
generally requires more iterations, i is linearly proportional to the data size, resulting in the complexity of 𝑂(𝑛2) for the
actual program execution. In these cases, the theoretical
complexity only gives implicit informat ion for the dependency. To cover diverse applications and algorithms without loss of
generality, the CrossTest automatically extracts their
dependencies from the behaviors of energy and performance collected by the actual measurement, instead of manually
checking the algorithm time complexity.
Asymmetric energy/performance behavior across machines. Due to computing power differences , energy and
performance requirements significantly vary across the two platforms. For example, as also shown in Figure 3, the
Figure 2. Overview of CrossTest
algorithm execution time of the Gateway is much slower than
the Server. However, since the Gateway uses a low-power ARM processor, the required energy consumption is
significantly smaller. Thus, for some scenarios, the Gateway
may perform data processing tasks more efficiently than the Server. This strategy can also reduce tremendous task amount
in the centralized cloud systems and the cost of additional network communications. For example, if an IoT application is
delay-tolerant, to achieve better energy efficiency, we could perform the computation at the edge devices. In addition, for
relatively s mall data, we can process them on the resource
constrained device to save energy at the expense of small performance degradation. Moreover, when the network is
unreliable, the gateways can provide better response time to the IoT actuator devices than the server platforms.
2) Processing Model Candatate Generation In the first model candidate generation step, the CrossTest
generates multiple models, i.e., processing model candidates, which identify the relationship between the data size and the
energy/performance requirements using different regression models. For each algorithm 𝛼 running on a platform 𝑃 , we
denote the models of the energy and execution time by 𝑒𝑃𝛼(𝑠)
and 𝑡𝑃𝛼(𝑠), respectively, where 𝑠 is the data size. In our current
implementation, the CrossTest utilizes four regression models
which can be solved by the method of least squares: linear, polynomial, log, and exponential regression. More formally,
processing model candidates are defined by four sets, ℳ𝑙𝑖𝑛𝑒𝑎𝑟, ℳ𝑝𝑜𝑙𝑦, ℳ𝑙𝑜𝑔 , and ℳ𝑒𝑥𝑝 where each set corresponds to
each regression model. Each individual set includes following
four cross-platform models for the combination of a device type (Gateway/Server) and a requirement (energy/execution
time): {𝑒𝐺𝑎𝑡𝑒𝑤𝑎𝑦
𝛼 (𝑠), 𝑡𝐺𝑎𝑡𝑒𝑤𝑎𝑦𝛼 (𝑠), 𝑒𝑆𝑒𝑟𝑣𝑒𝑟
𝛼 (𝑠), 𝑡𝑆𝑒𝑟𝑣𝑒𝑟𝛼 (𝑠)}.
3) Cross-Platform Best Processing Model Selection Figure 4a shows an example for generated models of the
four processing model candidates . The models estimate the energy consumption of the Server for AdaBoost classification
algorithm. This example shows that a measured energy exhibits
a strong linear relationship, while four models have different
levels of accuracy. One naïve way to choose a best model set among the four
model sets is to use the estimat ion error for energy/execution
times. However, it may select an overfitted model. The bias model may yield reasonable prediction results for the observed
data size range, e.g., characterized data sizes, but would give significantly inaccurate results for large data sizes of the IoT
domain. For example, as shown in Figure 4a, the predictions of both linear and polynomial models seem to be accurate.
However, if we consider larger data sizes as shown in Figure 4b, the polynomial model (dotted line) completely loses the
linearity (solid line) which is observed in the measurement.
We address the bias issue using a cross validation procedure [17]. The key insight of the procedure is that, if a
regression model is unbiased, the error should be small even when the model is built only using partial measurement results .
For example, let assume that an ML algorithm has a quadratic relationship and both a polynomial model 𝑓𝑃𝑜𝑙𝑦 (𝑠) and a linear
model 𝑓𝐿𝑖𝑛𝑒𝑎𝑟 (𝑠) trained with all measurement results present
low error. Let also consider another linear model, 𝑓𝐿𝑖𝑛𝑒𝑎𝑟′ (𝑠),
which is built by excluding measurement results for a middle range of the data size. Then, 𝑓𝐿𝑖𝑛𝑒𝑎𝑟
′ (𝑠) is more likely to lose
the accuracy for the middle-range data, compared to 𝑓𝑃 𝑜𝑙𝑦 (𝑠).
The CrossTest implements this idea using 3-fo ld cross validation. Let define a vector of measurement results , 𝑅 =⟨(𝑠1 , 𝑦1
), (𝑠2,𝑦2), … , (𝑠𝑁 , 𝑦𝑁 )⟩ where 𝑠𝑖 is the raw data size
and 𝑦𝑖 is the measured object value of either the energy or
execution time. 𝑅 is sequentially divided by 3 sub vectors,
𝑅1, 𝑅2, and 𝑅3 so that each sub vector has almost equal lengths,
i.e., 𝑅1 = ⟨(𝑠1 , 𝑦1), … , (𝑠⌊𝑁/3⌋ , 𝑦⌊𝑁/3⌋ )⟩ . Then, each regression
model can be regenerated with 𝑅1 and 𝑅2, and the accuracy of
the regenerated model is validated with 𝑅3 in MSE (Mean
Squared Error). This procedure is repeated for the other sub
vector combinations, (𝑅1, 𝑅3) and (𝑅2 , 𝑅3), yielding two more MSE values. The cross-validated MSE values are more durable
to the bias issue than the error of the original model which
assumes complete knowledge of the measurements. We compute the average MSE value for the models in each
candidate set, and then choose the best set 𝑀 , whose cross-validated error is min imum, among ℳ𝑙𝑖𝑛𝑒𝑎𝑟, ℳ𝑝𝑜𝑙𝑦, ℳ𝑙𝑜𝑔, and
ℳ𝑒𝑥𝑝 . The models of the best set are stored to the runtime
optimization module as the processing models of the algorithm. In Section IV.A, we discuss which models are selected for the
ML algorithms, and evaluate the estimation accuracy of the
models.
Figure 3. Energy and Execution Time Behaviors
for kNN and birch algorithms
Figure 4. Regression Candidates for Energy Model of Adaboost
for Intel SR1560SF (Server)
D. Network Model Building
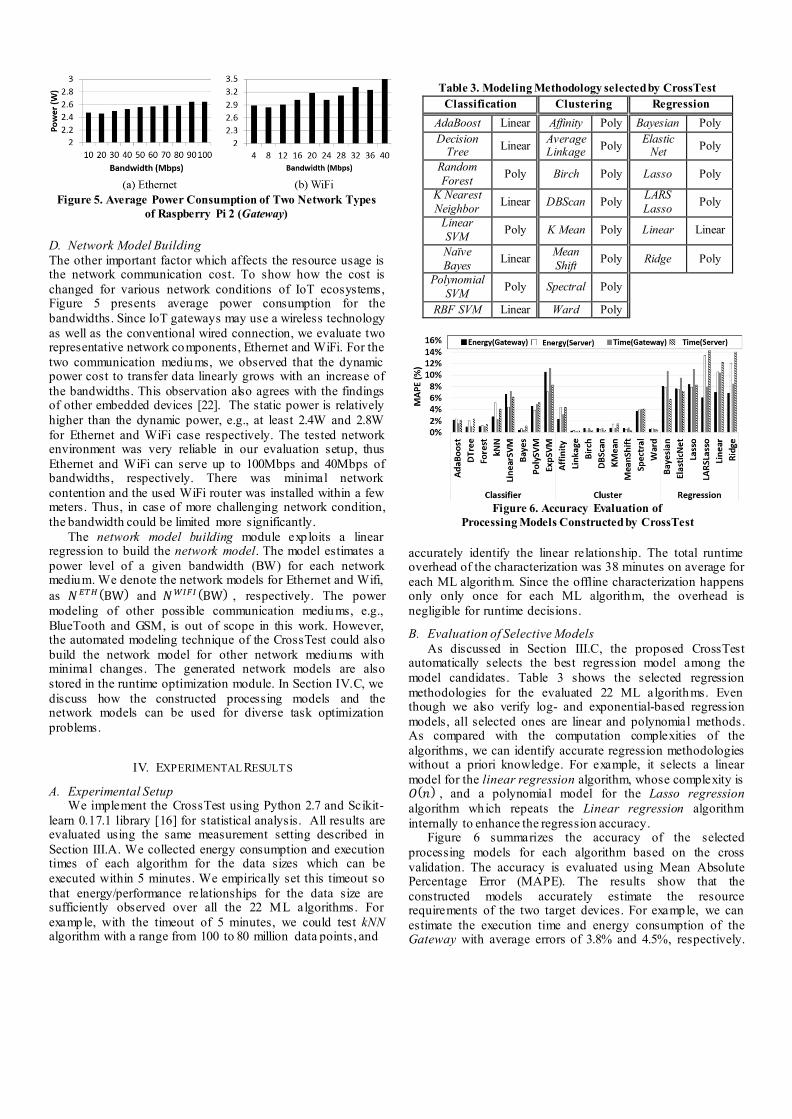
The other important factor which affects the resource usage is the network communication cost. To show how the cost is
changed for various network conditions of IoT ecosystems, Figure 5 presents average power consumption for the
bandwidths. Since IoT gateways may use a wireless technology
as well as the conventional wired connection, we evaluate two representative network components, Ethernet and WiFi. For the
two communication mediums, we observed that the dynamic power cost to transfer data linearly grows with an increase of
the bandwidths. This observation also agrees with the findings of other embedded devices [22]. The static power is relatively
higher than the dynamic power, e.g., at least 2.4W and 2.8W
for Ethernet and WiFi case respectively. The tested network environment was very reliable in our evaluation setup, thus
Ethernet and WiFi can serve up to 100Mbps and 40Mbps of bandwidths, respectively. There was minimal network
contention and the used WiFi router was installed within a few meters. Thus, in case of more challenging network condition,
the bandwidth could be limited more significantly.
The network model building module exp loits a linear regression to build the network model. The model estimates a
power level of a given bandwidth (BW) for each network medium. We denote the network models for Ethernet and Wifi,
as 𝑁 𝐸𝑇𝐻 (BW) and 𝑁 𝑊𝐼𝐹𝐼 (BW) , respectively. The power
modeling of other possible communication mediums, e.g.,
BlueTooth and GSM, is out of scope in this work. However, the automated modeling technique of the CrossTest could also
build the network model for other network mediums with minimal changes. The generated network models are also
stored in the runtime optimization module. In Section IV.C, we
discuss how the constructed processing models and the network models can be used for diverse task optimization
problems.
IV. EXPERIMENTAL RESULTS
A. Experimental Setup We implement the CrossTest using Python 2.7 and Scikit-
learn 0.17.1 library [16] for statistical analysis. All results are evaluated using the same measurement setting described in
Section III.A. We collected energy consumption and execution times of each algorithm for the data sizes which can be
executed within 5 minutes. We empirically set this timeout so
that energy/performance relationships for the data size are sufficiently observed over all the 22 ML algorithms. For
example, with the timeout of 5 minutes, we could test kNN algorithm with a range from 100 to 80 million data points , and
accurately identify the linear relationship. The total runtime overhead of the characterization was 38 minutes on average for
each ML algorithm. Since the offline characterization happens only only once for each ML algorithm, the overhead is
negligible for runtime decisions.
B. Evaluation of Selective Models
As discussed in Section III.C, the proposed CrossTest automatically selects the best regression model among the
model candidates. Table 3 shows the selected regression
methodologies for the evaluated 22 ML algorithms. Even though we also verify log- and exponential-based regression
models, all selected ones are linear and polynomial methods. As compared with the computation complexities of the
algorithms, we can identify accurate regression methodologies without a priori knowledge. For example, it selects a linear
model for the linear regression algorithm, whose complexity is 𝑂(𝑛) , and a polynomial model for the Lasso regression
algorithm which repeats the Linear regression algorithm
internally to enhance the regression accuracy. Figure 6 summarizes the accuracy of the selected
processing models for each algorithm based on the cross
validation. The accuracy is evaluated using Mean Absolute Percentage Error (MAPE). The results show that the
constructed models accurately estimate the resource requirements of the two target devices. For example, we can
estimate the execution time and energy consumption of the Gateway with average errors of 3.8% and 4.5%, respectively.
Figure 5. Average Power Consumption of Two Network Types
of Raspberry Pi 2 (Gateway)
Table 3. Modeling Methodology selected by CrossTest
Classification Clustering Regression
AdaBoost Linear Affinity Poly Bayesian Poly
Decision Tree
Linear Average Linkage
Poly Elastic
Net Poly
Random
Forest Poly Birch Poly Lasso Poly
K Nearest
Neighbor Linear DBScan Poly
LARS
Lasso Poly
Linear
SVM Poly K Mean Poly Linear Linear
Naïve
Bayes Linear
Mean
Shift Poly Ridge Poly
Polynomial
SVM Poly Spectral Poly
RBF SVM Linear Ward Poly
Figure 6. Accuracy Evaluation of
Processing Models Constructed by CrossTest
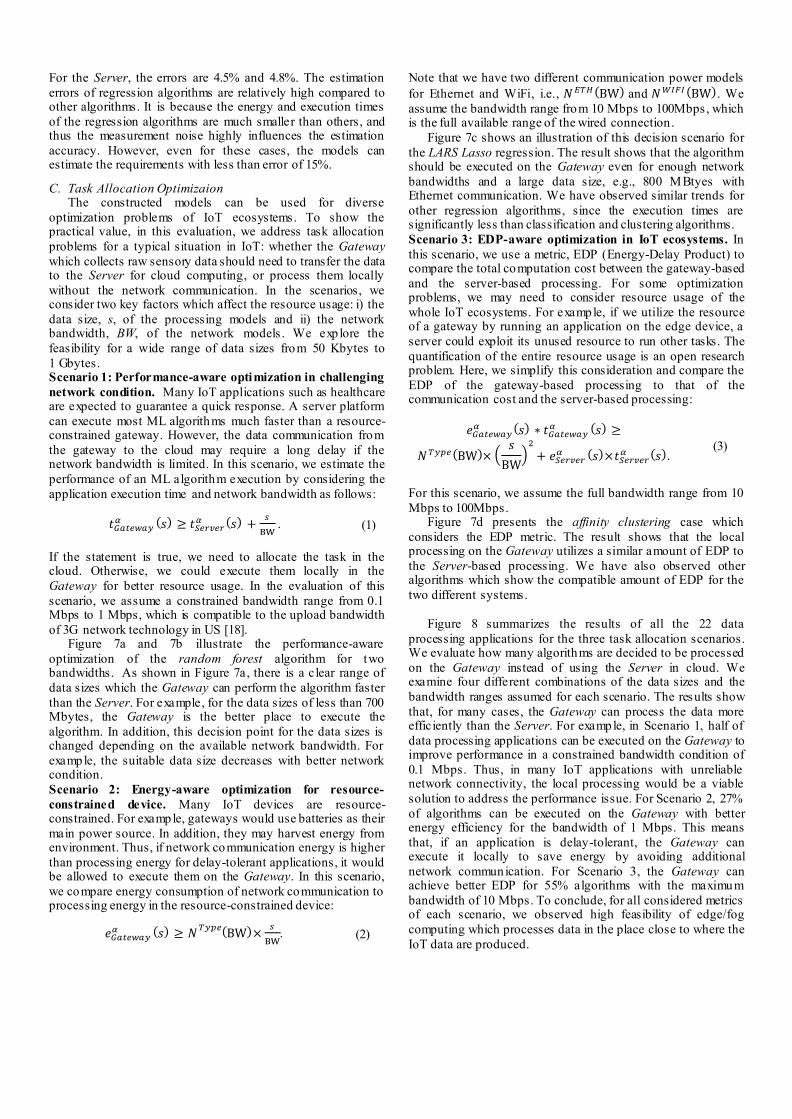
For the Server, the errors are 4.5% and 4.8%. The estimation
errors of regression algorithms are relatively high compared to other algorithms. It is because the energy and execution times
of the regression algorithms are much smaller than others, and thus the measurement noise highly influences the estimation
accuracy. However, even for these cases, the models can estimate the requirements with less than error of 15%.
C. Task Allocation Optimizaion
The constructed models can be used for diverse
optimization problems of IoT ecosystems. To show the practical value, in this evaluation, we address task allocation
problems for a typical situation in IoT: whether the Gateway
which collects raw sensory data should need to transfer the data to the Server for cloud computing, or process them locally
without the network communication. In the scenarios, we consider two key factors which affect the resource usage: i) the
data size, s, of the processing models and ii) the network bandwidth, BW, of the network models . We exp lore the
feasibility for a wide range of data sizes from 50 Kbytes to
1 Gbytes. Scenario 1: Performance-aware optimization in challenging
network condition. Many IoT applications such as healthcare are expected to guarantee a quick response. A server platform
can execute most ML algorithms much faster than a resource-constrained gateway. However, the data communication from
the gateway to the cloud may require a long delay if the network bandwidth is limited. In this scenario, we estimate the
performance of an ML algorithm execution by considering the
application execution time and network bandwidth as follows:
𝑡𝐺𝑎𝑡𝑒𝑤𝑎𝑦𝛼 (𝑠) ≥ 𝑡𝑆𝑒𝑟𝑣𝑒𝑟
𝛼 (𝑠) +𝑠
BW . (1)
If the statement is true, we need to allocate the task in the cloud. Otherwise, we could execute them locally in the
Gateway for better resource usage. In the evaluation of this
scenario, we assume a constrained bandwidth range from 0.1 Mbps to 1 Mbps, which is compatible to the upload bandwidth
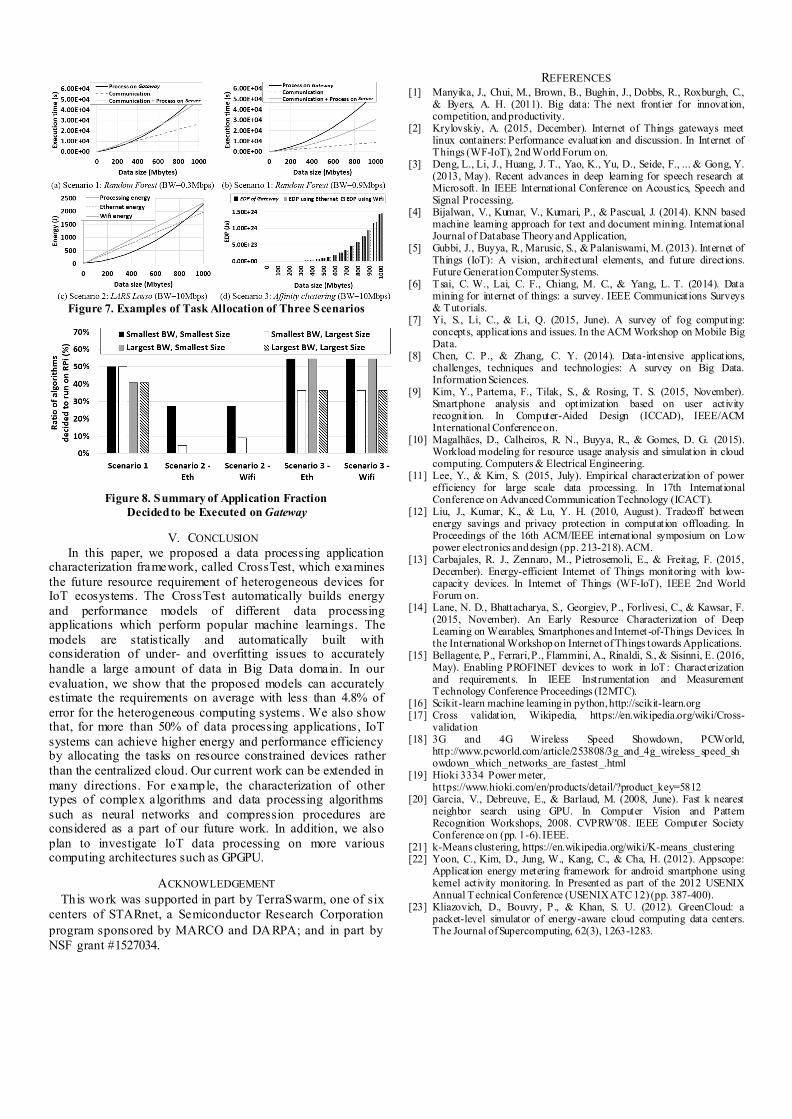
of 3G network technology in US [18]. Figure 7a and 7b illustrate the performance-aware
optimization of the random forest algorithm for two bandwidths. As shown in Figure 7a, there is a clear range of
data sizes which the Gateway can perform the algorithm faster
than the Server. For example, for the data sizes of less than 700 Mbytes, the Gateway is the better place to execute the
algorithm. In addition, this decision point for the data sizes is changed depending on the available network bandwidth. For
example, the suitable data size decreases with better network condition.
Scenario 2: Energy-aware optimization for resource-
constrained device. Many IoT devices are resource-constrained. For example, gateways would use batteries as their
main power source. In addition, they may harvest energy from environment. Thus, if network communication energy is higher
than processing energy for delay-tolerant applications, it would be allowed to execute them on the Gateway. In this scenario,
we compare energy consumption of network communication to processing energy in the resource-constrained device:
𝑒𝐺𝑎𝑡𝑒𝑤𝑎𝑦𝛼 (𝑠) ≥ 𝑁
𝑇𝑦𝑝𝑒(BW)×𝑠
BW. (2)
Note that we have two different communication power models
for Ethernet and WiFi, i.e., 𝑁 𝐸𝑇𝐻 (BW) and 𝑁 𝑊𝐼𝐹𝐼 (BW). We
assume the bandwidth range from 10 Mbps to 100Mbps, which is the full available range of the wired connection.
Figure 7c shows an illustration of this decision scenario for
the LARS Lasso regression. The result shows that the algorithm should be executed on the Gateway even for enough network
bandwidths and a large data size, e.g., 800 MBtyes with Ethernet communication. We have observed similar trends for
other regression algorithms, since the execution times are significantly less than classification and clustering algorithms.
Scenario 3: EDP-aware optimization in IoT ecosystems. In
this scenario, we use a metric, EDP (Energy-Delay Product) to compare the total computation cost between the gateway-based
and the server-based processing. For some optimization problems, we may need to consider resource usage of the
whole IoT ecosystems. For example, if we utilize the resource of a gateway by running an application on the edge device, a
server could exploit its unused resource to run other tasks. The
quantification of the entire resource usage is an open research problem. Here, we simplify this consideration and compare the
EDP of the gateway-based processing to that of the communication cost and the server-based processing:
𝑒𝐺𝑎𝑡𝑒𝑤𝑎𝑦𝛼 (𝑠) ∗ 𝑡𝐺𝑎𝑡𝑒𝑤𝑎𝑦
𝛼 (𝑠) ≥
𝑁 𝑇𝑦𝑝𝑒(BW)× (𝑠
BW)
2
+ 𝑒𝑆𝑒𝑟𝑣𝑒𝑟𝛼 (𝑠)×𝑡𝑆𝑒𝑟𝑣𝑒𝑟
𝛼 (𝑠). (3)
For this scenario, we assume the full bandwidth range from 10
Mbps to 100Mbps. Figure 7d presents the affinity clustering case which
considers the EDP metric. The result shows that the local processing on the Gateway utilizes a similar amount of EDP to
the Server-based processing. We have also observed other algorithms which show the compatible amount of EDP for the
two different systems.
Figure 8 summarizes the results of all the 22 data
processing applications for the three task allocation scenarios. We evaluate how many algorithms are decided to be processed
on the Gateway instead of using the Server in cloud. We examine four different combinations of the data sizes and the
bandwidth ranges assumed for each scenario. The results show
that, for many cases, the Gateway can process the data more efficiently than the Server. For example, in Scenario 1, half of
data processing applications can be executed on the Gateway to improve performance in a constrained bandwidth condition of
0.1 Mbps. Thus, in many IoT applications with unreliable network connectivity, the local processing would be a viable
solution to address the performance issue. For Scenario 2, 27%
of algorithms can be executed on the Gateway with better energy efficiency for the bandwidth of 1 Mbps. This means
that, if an application is delay-tolerant, the Gateway can execute it locally to save energy by avoiding additional
network communication. For Scenario 3, the Gateway can achieve better EDP for 55% algorithms with the maximum
bandwidth of 10 Mbps. To conclude, for all considered metrics of each scenario, we observed high feasibility of edge/fog
computing which processes data in the place close to where the
IoT data are produced.
V. CONCLUSION
In this paper, we proposed a data processing application characterization framework, called CrossTest, which examines
the future resource requirement of heterogeneous devices for IoT ecosystems. The CrossTest automatically builds energy
and performance models of different data processing applications which perform popular machine learnings. The
models are statistically and automatically built with consideration of under- and overfitting issues to accurately
handle a large amount of data in Big Data domain. In our
evaluation, we show that the proposed models can accurately estimate the requirements on average with less than 4.8% of
error for the heterogeneous computing systems . We also show that, for more than 50% of data processing applications , IoT
systems can achieve higher energy and performance efficiency by allocating the tasks on resource constrained devices rather
than the centralized cloud. Our current work can be extended in
many directions. For example, the characterization of other types of complex algorithms and data processing algorithms
such as neural networks and compression procedures are considered as a part of our future work. In addition, we also
plan to investigate IoT data processing on more various computing architectures such as GPGPU.
ACKNOWLEDGEMENT
Th is work was supported in part by TerraSwarm, one of six
centers of STARnet, a Semiconductor Research Corporation
program sponsored by MARCO and DARPA; and in part by
NSF grant #1527034.
REFERENCES [1] Manyika, J., Chui, M., Brown, B., Bughin, J., Dobbs, R., Roxburgh, C.,
& Byers, A. H. (2011). Big data: The next frontier for innovation, competition, and productivity.
[2] Krylovskiy, A. (2015, December). Internet of Things gateways meet linux containers: Performance evaluation and discussion. In Internet of Things (WF-IoT), 2nd World Forum on.
[3] Deng, L., Li, J., Huang, J. T., Yao, K., Yu, D., Seide, F., ... & Gong, Y. (2013, May). Recent advances in deep learning for speech research at Microsoft. In IEEE International Conference on Acoustics, Speech and Signal Processing.
[4] Bijalwan, V., Kumar, V., Kumari, P., & Pascual, J. (2014). KNN based machine learning approach for text and document mining. International Journal of Database Theory and Application,
[5] Gubbi, J., Buyya, R., Marusic, S., & Palaniswami, M. (2013). Internet of Things (IoT): A vision, architectural elements, and future directions. Future Generation Computer Systems.
[6] Tsai, C. W., Lai, C. F., Chiang, M. C., & Yang, L. T. (2014). Data mining for internet of things: a survey. IEEE Communications Surveys & Tutorials.
[7] Yi, S., Li, C., & Li, Q. (2015, June). A survey of fog computing: concepts, applications and issues. In the ACM Workshop on Mobile Big Data.
[8] Chen, C. P., & Zhang, C. Y. (2014). Data-intensive applications, challenges, techniques and technologies: A survey on Big Data. Information Sciences.
[9] Kim, Y., Parterna, F., Tilak, S., & Rosing, T. S. (2015, November). Smartphone analysis and optimization based on user activity recognition. In Computer-Aided Design (ICCAD), IEEE/ACM International Conference on.
[10] Magalhães, D., Calheiros, R. N., Buyya, R., & Gomes, D. G. (2015). Workload modeling for resource usage analysis and simulation in cloud computing. Computers & Electrical Engineering.
[11] Lee, Y., & Kim, S. (2015, July). Empirical characterization of power efficiency for large scale data processing. In 17th International Conference on Advanced Communication Technology (ICACT).
[12] Liu, J., Kumar, K., & Lu, Y. H. (2010, August). Tradeoff between energy savings and privacy protection in computation offloading. In Proceedings of the 16th ACM/IEEE international symposium on Low power electronics and design (pp. 213-218). ACM.
[13] Carbajales, R. J., Zennaro, M., Pietrosemoli, E., & Freitag, F. (2015, December). Energy-efficient Internet of Things monitoring with low-capacity devices. In Internet of Things (WF-IoT), IEEE 2nd World Forum on.
[14] Lane, N. D., Bhattacharya, S., Georgiev, P., Forlivesi, C., & Kawsar, F. (2015, November). An Early Resource Characterization of Deep Learning on Wearables, Smartphones and Internet -of-Things Devices. In the International Workshop on Internet of Things towards Applications.
[15] Bellagente, P., Ferrari, P., Flammini, A., Rinaldi, S., & Sisinni, E. (2016, May). Enabling PROFINET devices to work in IoT: Characterization and requirements. In IEEE Instrumentation and Measurement Technology Conference Proceedings (I2MTC).
[16] Scikit-learn machine learning in python, http://scikit-learn.org [17] Cross validation, Wikipedia, https://en.wikipedia.org/wiki/Cross-
validation [18] 3G and 4G Wireless Speed Showdown, PCWorld,
http://www.pcworld.com/article/253808/3g_and_4g_wireless_speed_showdown_which_networks_are_fastest_.html
[19] Hioki 3334 Power meter, https://www.hioki.com/en/products/detail/?product_key=5812
[20] Garcia, V., Debreuve, E., & Barlaud, M. (2008, June). Fast k nearest neighbor search using GPU. In Computer Vision and Pattern Recognition Workshops, 2008. CVPRW'08. IEEE Computer Society Conference on (pp. 1-6). IEEE.
[21] k-Means clustering, https://en.wikipedia.org/wiki/K-means_clustering [22] Yoon, C., Kim, D., Jung, W., Kang, C., & Cha, H. (2012). Appscope:
Application energy metering framework for android smartphone using kernel activity monitoring. In Presented as part of the 2012 USENIX Annual Technical Conference (USENIX ATC 12) (pp. 387-400).
[23] Kliazovich, D., Bouvry, P., & Khan, S. U. (2012). GreenCloud: a packet-level simulator of energy-aware cloud computing data centers. The Journal of Supercomputing, 62(3), 1263-1283.
Figure 7. Examples of Task Allocation of Three Scenarios
Figure 8. Summary of Application Fraction
Decided to be Executed on Gateway