Embed Size (px)
Citation preview
An Active Sensing Platform forWireless Structural Health Monitoring
Daniele MusianiUC San DiegoLa Jolla, CA
Kaisen LinUC San DiegoLa Jolla, CA
Tajana Simunic RosingUC San DiegoLa Jolla, CA
ABSTRACTThis paper presents SHiMmer, a wireless platform for activesensing that combines localized processing with energy har-vesting to provide long-lived structural health monitoring.The life-cycle of the node is extended to 20 years by the useof super-capacitors for energy storage. During this periodthe node is expected to work completely maintenance-free.The node is capable of harvesting up to 780J per day. Thismakes it completely self-sufficient while employed in realstructural health monitoring applications. Unlike other sen-sor networks that periodically monitor a structure and routeinformation to a base station, our device acquires the dataand processes it locally after being radio-triggered by an ex-ternal agent. The localized processing allows us to avoidissues due to network congestion. Our experiments showthat its 32-bits computational core can run at 100MIPS for15 minutes daily.
1. INTRODUCTIONSensor networks have been deployed in a wide variety
of fields related to public safety. Examples include land-slide detection [2], search and rescue [13], and fire detectionin buildings [8]. Structural monitoring has also become aprominent application of wireless sensor networks in the in-terest of public safety. Structural health monitoring (SHM)aims to detect damage in civil, military and aerospace struc-tures such as bridges, aerial vehicles, tanks and oil rigs atan early stage of the evolution. The monitoring process isbased on measuring and analyzing the dynamic response ofa system to an environmental or an ad hoc stimulus to assessits integrity in near real time.
In order to monitor structures with a high degree of ac-curacy, it is often required to instrument the structure witha high density of sensors. The installation of a wired sensornetwork can be prohibitively expensive, since it may requirechanges to the structure itself (e.g. drilling holes in walls)and take several months in big buildings and infrastructures.By contrast, wireless sensor networks provide structural en-
Permission to make digital or hard copies of all or part of this work forpersonal or classroom use is granted without fee provided that copies arenot made or distributed for profit or commercial advantage and that copiesbear this notice and the full citation on the first page. To copy otherwise, torepublish, to post on servers or to redistribute to lists, requires prior specificpermission and/or a fee.Copyright 200X ACM X-XXXXX-XX-X/XX/XX ...$5.00.
gineers with a cheap and effective way to instrument a struc-ture and collect data regarding it, by eliminating the needto cable the structure under test.
Wireless sensor networks, however, also create complex-ities of their own. In particular, sensor nodes have severeenergy constraints. Battery-powered sensor nodes need pe-riodical human intervention, in order to recharge or replacebatteries. The life-cycle of batteries is only a few years.Some solutions allow the life-cycle to be extended [7] [30],but after 10 years their capacity is reduced by 50% [28].This would result in considerably high maintenance costs.A typical solution to this is to equip sensors with an energyharvesting circuit which collects energy from the environ-ment, such as with solar cells. Aside from energy harvestingnodes, a few wireless sensor nodes have been built for SHMapplications [34] [24] [22]. Since they focus only on passivesensing, these solutions have limited computational powerand acquisition fidelity. In addition to that, they do notimplement any energy harvesting techniques.
In this paper, we present SHiMmer, a system that showsit is indeed feasible to build an active SHM sensor networkcomprised of energy self-sufficient nodes which perform allthe damage detection analysis locally. This technique oflocalized computation, known as active networking, has ap-peared in sensor networks, but only to a limited degree [18].However, our use of the term active has wider implications,in that our node actively controls an actuator to excite thestructure under test, before the sensing phase. SHiMmercan generate actuation waves of up to 1MHz frequency and15V peak-to-peak amplitude. In addition to this, the nodeachieves a very high level of fidelity in the acquisition phaseby sampling at a 10MSPS frequency. In terms of energyharvesting, our node can harvest up to 780J per day and its32-bits computational core can run at 100MIPS for 15 min-utes daily. The energy is stored in super-capacitors. Theiruse doubles the nodes life-cycle with respect to rechargeablebattery-powered systems, extending it up to 20 years [28].During this period the device is expected to work completelymaintenance free.
The remainder of the paper is outlined as follows. We firstreview the state-of-the-art in the wireless sensor networksfield. Then we provide a general background about SHMtechniques and discuss specific solutions involving wirelessnetworks. Subsequently, we outline the requirements of ourSHM application and detail the hardware and software ar-chitecture we have built to support it. Finally, we evaluatethe effectiveness of our system against the requirements.
2. RELATED WORKWireless sensor networks have traditionally not included
much computing power in sensor nodes because of the en-ergy needed to perform such a computation. In-networkcomputation has been minimal and used predominantly bythe database community, such as with TinyDB [21], androuting techniques with more knowledge about the proper-ties of the data [20] [14]. In our solution, we push the fullcomputation of the sampled data directly onto the node androute only the results that we want.
Considerable work has also been done regarding energyharvesting sensor nodes. Two recent ones are Heliomote [27]and Prometheus [15]. In these solutions, the energy is har-vested from solar panels and then stored into super-capacitorsand/or rechargable lithium batteries. Both have tradeoffsregarding leakage and energy capacity. However, becauselarge structures have lifespans of decades and even centuries,it is important to adjust the sensor nodes as few times aspossible (e.g. replace batteries). For this reason, SHiMmeruses only super-capacitors because of their minimal degra-dation over thousands of recharge cycles [28].
Some wireless sensor nodes have been built and testedin real SHM scenarios [35] [19]. However, the authors arenot aware of any realization of sensor nodes with energyharvesting capabilities for SHM applications. Moreover, theprevious designs have only small computational capabilities,which simply acquire the data and route it to a base stationfor further processing. There have also been solutions thathave focused on the programming environment for struc-tural engineers such as NetSHM [6]. This solution, althoughit provides a richer framework to analyze the structure un-der test, must still route the sampled data to a base stationfor further processing. By contrast, in this paper we presenta platform with both high computational power and energyharvesting capabilities, which shows the feasibility of local-ized computation in SHM wireless sensor networks.
3. BACKGROUND
3.1 SHM MethodsA major focus of the structural engineering community
is to develop systems and structures that can monitor theirown structural integrity in real time. Besides preventingcatastrophic failures, on-line damage detection would re-duce costs by minimizing maintenance and inspection cycles.One of the most promising means of developing these self-monitoring structures is through the integration of smartmaterials into the structures themselves. Smart materialsare materials that couple two forms of energy such as mag-netic and mechanical energy for magnetorheological fluid,heat and mechanical energy for shape memory alloy, andelectric and mechanical energy for piezoceramics. As a con-sequence, these materials can often serve as both sensors andactuators. In this project we use Lead-Zirconate-Titanate(PZT) piezoelectric transducers, whose usefulness and effec-tiveness in SHM applications have been investigated [12] [29].Commercial PZT devices are fairly low cost and small-sizedso they can be integrated at high density in structures inan unobtrusive and inexpensive way. The impedance-basedtechnique and the Lamb waves technique are nondestruc-tive evaluation (NDE) methods, which utilize the benefitsof piezoelectric materials and show great promises for struc-tural health monitoring systems.
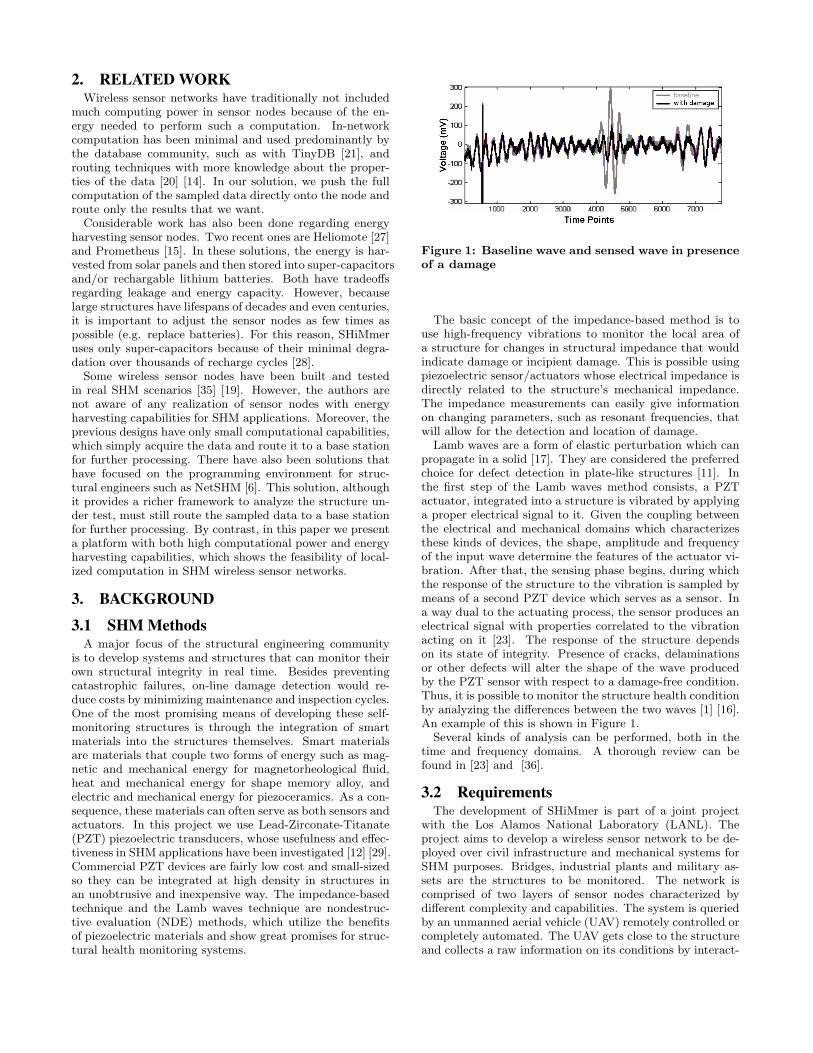
Figure 1: Baseline wave and sensed wave in presenceof a damage
The basic concept of the impedance-based method is touse high-frequency vibrations to monitor the local area ofa structure for changes in structural impedance that wouldindicate damage or incipient damage. This is possible usingpiezoelectric sensor/actuators whose electrical impedance isdirectly related to the structure’s mechanical impedance.The impedance measurements can easily give informationon changing parameters, such as resonant frequencies, thatwill allow for the detection and location of damage.
Lamb waves are a form of elastic perturbation which canpropagate in a solid [17]. They are considered the preferredchoice for defect detection in plate-like structures [11]. Inthe first step of the Lamb waves method consists, a PZTactuator, integrated into a structure is vibrated by applyinga proper electrical signal to it. Given the coupling betweenthe electrical and mechanical domains which characterizesthese kinds of devices, the shape, amplitude and frequencyof the input wave determine the features of the actuator vi-bration. After that, the sensing phase begins, during whichthe response of the structure to the vibration is sampled bymeans of a second PZT device which serves as a sensor. Ina way dual to the actuating process, the sensor produces anelectrical signal with properties correlated to the vibrationacting on it [23]. The response of the structure dependson its state of integrity. Presence of cracks, delaminationsor other defects will alter the shape of the wave producedby the PZT sensor with respect to a damage-free condition.Thus, it is possible to monitor the structure health conditionby analyzing the differences between the two waves [1] [16].An example of this is shown in Figure 1.
Several kinds of analysis can be performed, both in thetime and frequency domains. A thorough review can befound in [23] and [36].
3.2 RequirementsThe development of SHiMmer is part of a joint project
with the Los Alamos National Laboratory (LANL). Theproject aims to develop a wireless sensor network to be de-ployed over civil infrastructure and mechanical systems forSHM purposes. Bridges, industrial plants and military as-sets are the structures to be monitored. The network iscomprised of two layers of sensor nodes characterized bydifferent complexity and capabilities. The system is queriedby an unmanned aerial vehicle (UAV) remotely controlled orcompletely automated. The UAV gets close to the structureand collects a raw information on its conditions by interact-
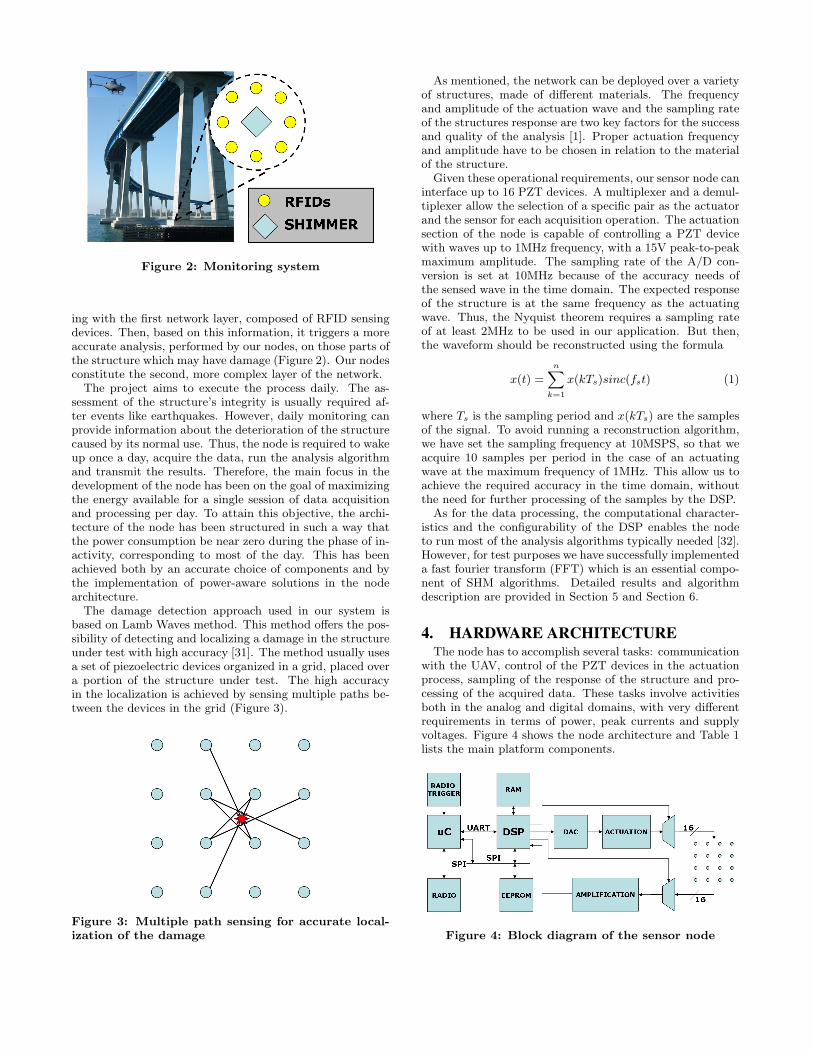
Figure 2: Monitoring system
ing with the first network layer, composed of RFID sensingdevices. Then, based on this information, it triggers a moreaccurate analysis, performed by our nodes, on those parts ofthe structure which may have damage (Figure 2). Our nodesconstitute the second, more complex layer of the network.
The project aims to execute the process daily. The as-sessment of the structure’s integrity is usually required af-ter events like earthquakes. However, daily monitoring canprovide information about the deterioration of the structurecaused by its normal use. Thus, the node is required to wakeup once a day, acquire the data, run the analysis algorithmand transmit the results. Therefore, the main focus in thedevelopment of the node has been on the goal of maximizingthe energy available for a single session of data acquisitionand processing per day. To attain this objective, the archi-tecture of the node has been structured in such a way thatthe power consumption be near zero during the phase of in-activity, corresponding to most of the day. This has beenachieved both by an accurate choice of components and bythe implementation of power-aware solutions in the nodearchitecture.
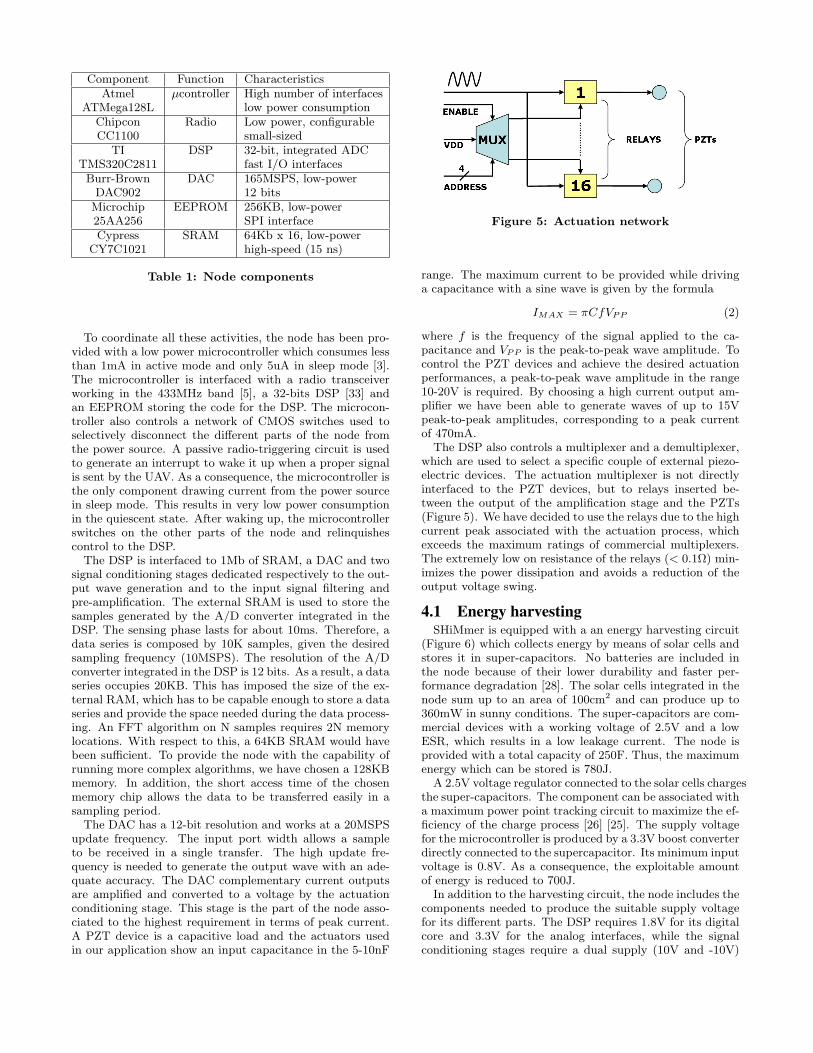
The damage detection approach used in our system isbased on Lamb Waves method. This method offers the pos-sibility of detecting and localizing a damage in the structureunder test with high accuracy [31]. The method usually usesa set of piezoelectric devices organized in a grid, placed overa portion of the structure under test. The high accuracyin the localization is achieved by sensing multiple paths be-tween the devices in the grid (Figure 3).
Figure 3: Multiple path sensing for accurate local-ization of the damage
As mentioned, the network can be deployed over a varietyof structures, made of different materials. The frequencyand amplitude of the actuation wave and the sampling rateof the structures response are two key factors for the successand quality of the analysis [1]. Proper actuation frequencyand amplitude have to be chosen in relation to the materialof the structure.
Given these operational requirements, our sensor node caninterface up to 16 PZT devices. A multiplexer and a demul-tiplexer allow the selection of a specific pair as the actuatorand the sensor for each acquisition operation. The actuationsection of the node is capable of controlling a PZT devicewith waves up to 1MHz frequency, with a 15V peak-to-peakmaximum amplitude. The sampling rate of the A/D con-version is set at 10MHz because of the accuracy needs ofthe sensed wave in the time domain. The expected responseof the structure is at the same frequency as the actuatingwave. Thus, the Nyquist theorem requires a sampling rateof at least 2MHz to be used in our application. But then,the waveform should be reconstructed using the formula
x(t) =
n∑k=1
x(kTs)sinc(fst) (1)
where Ts is the sampling period and x(kTs) are the samplesof the signal. To avoid running a reconstruction algorithm,we have set the sampling frequency at 10MSPS, so that weacquire 10 samples per period in the case of an actuatingwave at the maximum frequency of 1MHz. This allow us toachieve the required accuracy in the time domain, withoutthe need for further processing of the samples by the DSP.
As for the data processing, the computational character-istics and the configurability of the DSP enables the nodeto run most of the analysis algorithms typically needed [32].However, for test purposes we have successfully implementeda fast fourier transform (FFT) which is an essential compo-nent of SHM algorithms. Detailed results and algorithmdescription are provided in Section 5 and Section 6.
4. HARDWARE ARCHITECTUREThe node has to accomplish several tasks: communication
with the UAV, control of the PZT devices in the actuationprocess, sampling of the response of the structure and pro-cessing of the acquired data. These tasks involve activitiesboth in the analog and digital domains, with very differentrequirements in terms of power, peak currents and supplyvoltages. Figure 4 shows the node architecture and Table 1lists the main platform components.
Figure 4: Block diagram of the sensor node
Component Function CharacteristicsAtmel µcontroller High number of interfaces
ATMega128L low power consumptionChipcon Radio Low power, configurableCC1100 small-sized
TI DSP 32-bit, integrated ADCTMS320C2811 fast I/O interfacesBurr-Brown DAC 165MSPS, low-power
DAC902 12 bitsMicrochip EEPROM 256KB, low-power25AA256 SPI interfaceCypress SRAM 64Kb x 16, low-power
CY7C1021 high-speed (15 ns)
Table 1: Node components
To coordinate all these activities, the node has been pro-vided with a low power microcontroller which consumes lessthan 1mA in active mode and only 5uA in sleep mode [3].The microcontroller is interfaced with a radio transceiverworking in the 433MHz band [5], a 32-bits DSP [33] andan EEPROM storing the code for the DSP. The microcon-troller also controls a network of CMOS switches used toselectively disconnect the different parts of the node fromthe power source. A passive radio-triggering circuit is usedto generate an interrupt to wake it up when a proper signalis sent by the UAV. As a consequence, the microcontroller isthe only component drawing current from the power sourcein sleep mode. This results in very low power consumptionin the quiescent state. After waking up, the microcontrollerswitches on the other parts of the node and relinquishescontrol to the DSP.
The DSP is interfaced to 1Mb of SRAM, a DAC and twosignal conditioning stages dedicated respectively to the out-put wave generation and to the input signal filtering andpre-amplification. The external SRAM is used to store thesamples generated by the A/D converter integrated in theDSP. The sensing phase lasts for about 10ms. Therefore, adata series is composed by 10K samples, given the desiredsampling frequency (10MSPS). The resolution of the A/Dconverter integrated in the DSP is 12 bits. As a result, a dataseries occupies 20KB. This has imposed the size of the ex-ternal RAM, which has to be capable enough to store a dataseries and provide the space needed during the data process-ing. An FFT algorithm on N samples requires 2N memorylocations. With respect to this, a 64KB SRAM would havebeen sufficient. To provide the node with the capability ofrunning more complex algorithms, we have chosen a 128KBmemory. In addition, the short access time of the chosenmemory chip allows the data to be transferred easily in asampling period.
The DAC has a 12-bit resolution and works at a 20MSPSupdate frequency. The input port width allows a sampleto be received in a single transfer. The high update fre-quency is needed to generate the output wave with an ade-quate accuracy. The DAC complementary current outputsare amplified and converted to a voltage by the actuationconditioning stage. This stage is the part of the node asso-ciated to the highest requirement in terms of peak current.A PZT device is a capacitive load and the actuators usedin our application show an input capacitance in the 5-10nF
Figure 5: Actuation network
range. The maximum current to be provided while drivinga capacitance with a sine wave is given by the formula
IMAX = πCfVPP (2)
where f is the frequency of the signal applied to the ca-pacitance and VPP is the peak-to-peak wave amplitude. Tocontrol the PZT devices and achieve the desired actuationperformances, a peak-to-peak wave amplitude in the range10-20V is required. By choosing a high current output am-plifier we have been able to generate waves of up to 15Vpeak-to-peak amplitudes, corresponding to a peak currentof 470mA.
The DSP also controls a multiplexer and a demultiplexer,which are used to select a specific couple of external piezo-electric devices. The actuation multiplexer is not directlyinterfaced to the PZT devices, but to relays inserted be-tween the output of the amplification stage and the PZTs(Figure 5). We have decided to use the relays due to the highcurrent peak associated with the actuation process, whichexceeds the maximum ratings of commercial multiplexers.The extremely low on resistance of the relays (< 0.1Ω) min-imizes the power dissipation and avoids a reduction of theoutput voltage swing.
4.1 Energy harvestingSHiMmer is equipped with a an energy harvesting circuit
(Figure 6) which collects energy by means of solar cells andstores it in super-capacitors. No batteries are included inthe node because of their lower durability and faster per-formance degradation [28]. The solar cells integrated in thenode sum up to an area of 100cm2 and can produce up to360mW in sunny conditions. The super-capacitors are com-mercial devices with a working voltage of 2.5V and a lowESR, which results in a low leakage current. The node isprovided with a total capacity of 250F. Thus, the maximumenergy which can be stored is 780J.
A 2.5V voltage regulator connected to the solar cells chargesthe super-capacitors. The component can be associated witha maximum power point tracking circuit to maximize the ef-ficiency of the charge process [26] [25]. The supply voltagefor the microcontroller is produced by a 3.3V boost converterdirectly connected to the supercapacitor. Its minimum inputvoltage is 0.8V. As a consequence, the exploitable amountof energy is reduced to 700J.
In addition to the harvesting circuit, the node includes thecomponents needed to produce the suitable supply voltagefor its different parts. The DSP requires 1.8V for its digitalcore and 3.3V for the analog interfaces, while the signalconditioning stages require a dual supply (10V and -10V)
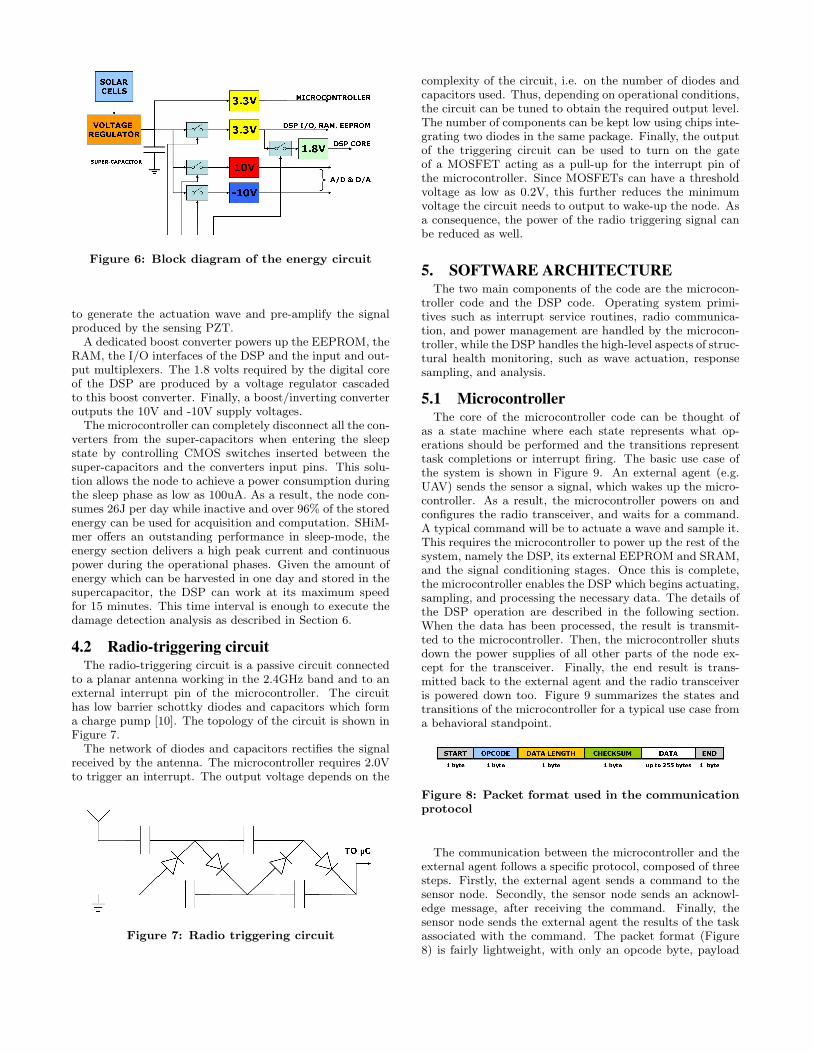
Figure 6: Block diagram of the energy circuit
to generate the actuation wave and pre-amplify the signalproduced by the sensing PZT.
A dedicated boost converter powers up the EEPROM, theRAM, the I/O interfaces of the DSP and the input and out-put multiplexers. The 1.8 volts required by the digital coreof the DSP are produced by a voltage regulator cascadedto this boost converter. Finally, a boost/inverting converteroutputs the 10V and -10V supply voltages.
The microcontroller can completely disconnect all the con-verters from the super-capacitors when entering the sleepstate by controlling CMOS switches inserted between thesuper-capacitors and the converters input pins. This solu-tion allows the node to achieve a power consumption duringthe sleep phase as low as 100uA. As a result, the node con-sumes 26J per day while inactive and over 96% of the storedenergy can be used for acquisition and computation. SHiM-mer offers an outstanding performance in sleep-mode, theenergy section delivers a high peak current and continuouspower during the operational phases. Given the amount ofenergy which can be harvested in one day and stored in thesupercapacitor, the DSP can work at its maximum speedfor 15 minutes. This time interval is enough to execute thedamage detection analysis as described in Section 6.
4.2 Radio-triggering circuitThe radio-triggering circuit is a passive circuit connected
to a planar antenna working in the 2.4GHz band and to anexternal interrupt pin of the microcontroller. The circuithas low barrier schottky diodes and capacitors which forma charge pump [10]. The topology of the circuit is shown inFigure 7.
The network of diodes and capacitors rectifies the signalreceived by the antenna. The microcontroller requires 2.0Vto trigger an interrupt. The output voltage depends on the
Figure 7: Radio triggering circuit
complexity of the circuit, i.e. on the number of diodes andcapacitors used. Thus, depending on operational conditions,the circuit can be tuned to obtain the required output level.The number of components can be kept low using chips inte-grating two diodes in the same package. Finally, the outputof the triggering circuit can be used to turn on the gateof a MOSFET acting as a pull-up for the interrupt pin ofthe microcontroller. Since MOSFETs can have a thresholdvoltage as low as 0.2V, this further reduces the minimumvoltage the circuit needs to output to wake-up the node. Asa consequence, the power of the radio triggering signal canbe reduced as well.
5. SOFTWARE ARCHITECTUREThe two main components of the code are the microcon-
troller code and the DSP code. Operating system primi-tives such as interrupt service routines, radio communica-tion, and power management are handled by the microcon-troller, while the DSP handles the high-level aspects of struc-tural health monitoring, such as wave actuation, responsesampling, and analysis.
5.1 MicrocontrollerThe core of the microcontroller code can be thought of
as a state machine where each state represents what op-erations should be performed and the transitions representtask completions or interrupt firing. The basic use case ofthe system is shown in Figure 9. An external agent (e.g.UAV) sends the sensor a signal, which wakes up the micro-controller. As a result, the microcontroller powers on andconfigures the radio transceiver, and waits for a command.A typical command will be to actuate a wave and sample it.This requires the microcontroller to power up the rest of thesystem, namely the DSP, its external EEPROM and SRAM,and the signal conditioning stages. Once this is complete,the microcontroller enables the DSP which begins actuating,sampling, and processing the necessary data. The details ofthe DSP operation are described in the following section.When the data has been processed, the result is transmit-ted to the microcontroller. Then, the microcontroller shutsdown the power supplies of all other parts of the node ex-cept for the transceiver. Finally, the end result is trans-mitted back to the external agent and the radio transceiveris powered down too. Figure 9 summarizes the states andtransitions of the microcontroller for a typical use case froma behavioral standpoint.
Figure 8: Packet format used in the communicationprotocol
The communication between the microcontroller and theexternal agent follows a specific protocol, composed of threesteps. Firstly, the external agent sends a command to thesensor node. Secondly, the sensor node sends an acknowl-edge message, after receiving the command. Finally, thesensor node sends the external agent the results of the taskassociated with the command. The packet format (Figure8) is fairly lightweight, with only an opcode byte, payload
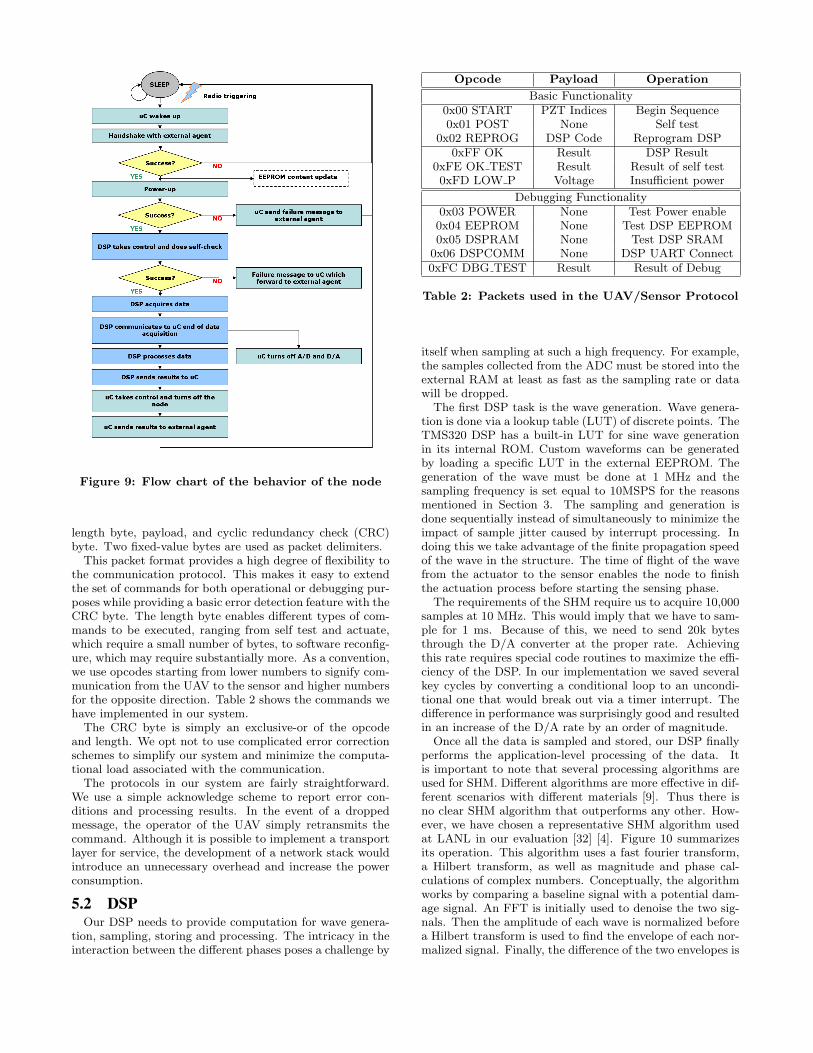
Figure 9: Flow chart of the behavior of the node
length byte, payload, and cyclic redundancy check (CRC)byte. Two fixed-value bytes are used as packet delimiters.
This packet format provides a high degree of flexibility tothe communication protocol. This makes it easy to extendthe set of commands for both operational or debugging pur-poses while providing a basic error detection feature with theCRC byte. The length byte enables different types of com-mands to be executed, ranging from self test and actuate,which require a small number of bytes, to software reconfig-ure, which may require substantially more. As a convention,we use opcodes starting from lower numbers to signify com-munication from the UAV to the sensor and higher numbersfor the opposite direction. Table 2 shows the commands wehave implemented in our system.
The CRC byte is simply an exclusive-or of the opcodeand length. We opt not to use complicated error correctionschemes to simplify our system and minimize the computa-tional load associated with the communication.
The protocols in our system are fairly straightforward.We use a simple acknowledge scheme to report error con-ditions and processing results. In the event of a droppedmessage, the operator of the UAV simply retransmits thecommand. Although it is possible to implement a transportlayer for service, the development of a network stack wouldintroduce an unnecessary overhead and increase the powerconsumption.
5.2 DSPOur DSP needs to provide computation for wave genera-
tion, sampling, storing and processing. The intricacy in theinteraction between the different phases poses a challenge by
Opcode Payload Operation
Basic Functionality0x00 START PZT Indices Begin Sequence0x01 POST None Self test
0x02 REPROG DSP Code Reprogram DSP0xFF OK Result DSP Result
0xFE OK TEST Result Result of self test0xFD LOW P Voltage Insufficient power
Debugging Functionality0x03 POWER None Test Power enable0x04 EEPROM None Test DSP EEPROM0x05 DSPRAM None Test DSP SRAM
0x06 DSPCOMM None DSP UART Connect0xFC DBG TEST Result Result of Debug
Table 2: Packets used in the UAV/Sensor Protocol
itself when sampling at such a high frequency. For example,the samples collected from the ADC must be stored into theexternal RAM at least as fast as the sampling rate or datawill be dropped.
The first DSP task is the wave generation. Wave genera-tion is done via a lookup table (LUT) of discrete points. TheTMS320 DSP has a built-in LUT for sine wave generationin its internal ROM. Custom waveforms can be generatedby loading a specific LUT in the external EEPROM. Thegeneration of the wave must be done at 1 MHz and thesampling frequency is set equal to 10MSPS for the reasonsmentioned in Section 3. The sampling and generation isdone sequentially instead of simultaneously to minimize theimpact of sample jitter caused by interrupt processing. Indoing this we take advantage of the finite propagation speedof the wave in the structure. The time of flight of the wavefrom the actuator to the sensor enables the node to finishthe actuation process before starting the sensing phase.
The requirements of the SHM require us to acquire 10,000samples at 10 MHz. This would imply that we have to sam-ple for 1 ms. Because of this, we need to send 20k bytesthrough the D/A converter at the proper rate. Achievingthis rate requires special code routines to maximize the effi-ciency of the DSP. In our implementation we saved severalkey cycles by converting a conditional loop to an uncondi-tional one that would break out via a timer interrupt. Thedifference in performance was surprisingly good and resultedin an increase of the D/A rate by an order of magnitude.
Once all the data is sampled and stored, our DSP finallyperforms the application-level processing of the data. Itis important to note that several processing algorithms areused for SHM. Different algorithms are more effective in dif-ferent scenarios with different materials [9]. Thus there isno clear SHM algorithm that outperforms any other. How-ever, we have chosen a representative SHM algorithm usedat LANL in our evaluation [32] [4]. Figure 10 summarizesits operation. This algorithm uses a fast fourier transform,a Hilbert transform, as well as magnitude and phase cal-culations of complex numbers. Conceptually, the algorithmworks by comparing a baseline signal with a potential dam-age signal. An FFT is initially used to denoise the two sig-nals. Then the amplitude of each wave is normalized beforea Hilbert transform is used to find the envelope of each nor-malized signal. Finally, the difference of the two envelopes is
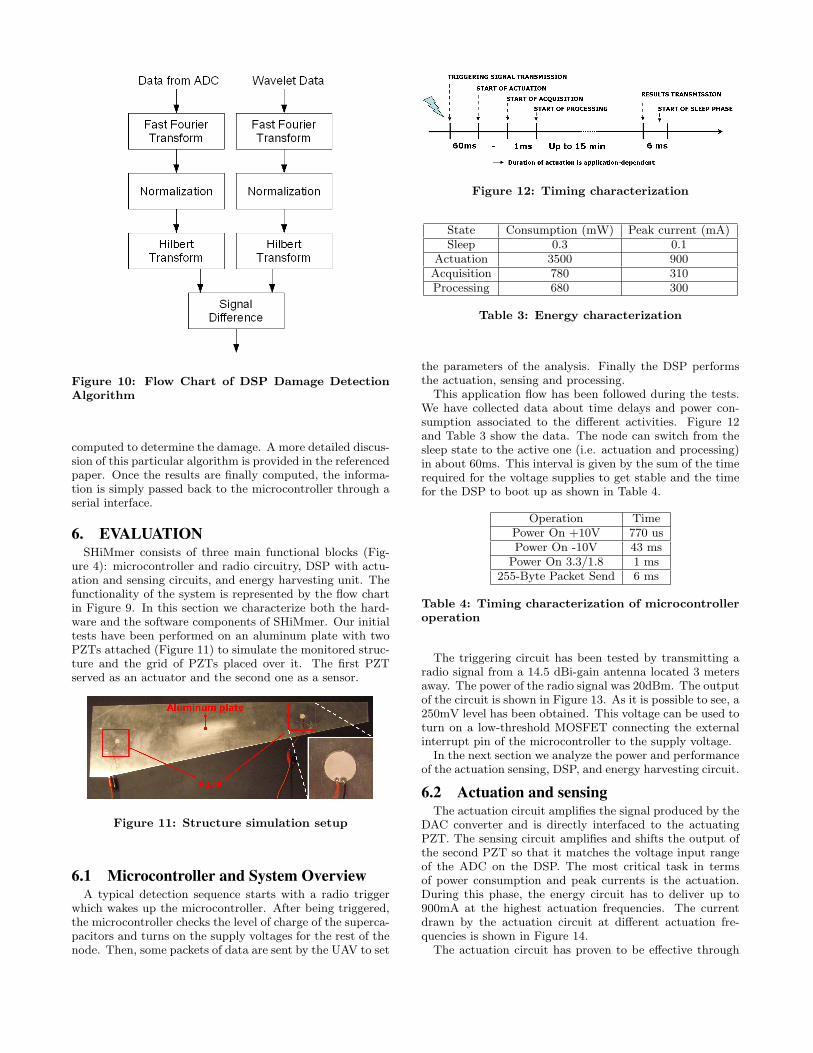
Figure 10: Flow Chart of DSP Damage DetectionAlgorithm
computed to determine the damage. A more detailed discus-sion of this particular algorithm is provided in the referencedpaper. Once the results are finally computed, the informa-tion is simply passed back to the microcontroller through aserial interface.
6. EVALUATIONSHiMmer consists of three main functional blocks (Fig-
ure 4): microcontroller and radio circuitry, DSP with actu-ation and sensing circuits, and energy harvesting unit. Thefunctionality of the system is represented by the flow chartin Figure 9. In this section we characterize both the hard-ware and the software components of SHiMmer. Our initialtests have been performed on an aluminum plate with twoPZTs attached (Figure 11) to simulate the monitored struc-ture and the grid of PZTs placed over it. The first PZTserved as an actuator and the second one as a sensor.
Figure 11: Structure simulation setup
6.1 Microcontroller and System OverviewA typical detection sequence starts with a radio trigger
which wakes up the microcontroller. After being triggered,the microcontroller checks the level of charge of the superca-pacitors and turns on the supply voltages for the rest of thenode. Then, some packets of data are sent by the UAV to set
Figure 12: Timing characterization
State Consumption (mW) Peak current (mA)Sleep 0.3 0.1
Actuation 3500 900Acquisition 780 310Processing 680 300
Table 3: Energy characterization
the parameters of the analysis. Finally the DSP performsthe actuation, sensing and processing.
This application flow has been followed during the tests.We have collected data about time delays and power con-sumption associated to the different activities. Figure 12and Table 3 show the data. The node can switch from thesleep state to the active one (i.e. actuation and processing)in about 60ms. This interval is given by the sum of the timerequired for the voltage supplies to get stable and the timefor the DSP to boot up as shown in Table 4.
Operation TimePower On +10V 770 usPower On -10V 43 ms
Power On 3.3/1.8 1 ms255-Byte Packet Send 6 ms
Table 4: Timing characterization of microcontrolleroperation
The triggering circuit has been tested by transmitting aradio signal from a 14.5 dBi-gain antenna located 3 metersaway. The power of the radio signal was 20dBm. The outputof the circuit is shown in Figure 13. As it is possible to see, a250mV level has been obtained. This voltage can be used toturn on a low-threshold MOSFET connecting the externalinterrupt pin of the microcontroller to the supply voltage.
In the next section we analyze the power and performanceof the actuation sensing, DSP, and energy harvesting circuit.
6.2 Actuation and sensingThe actuation circuit amplifies the signal produced by the
DAC converter and is directly interfaced to the actuatingPZT. The sensing circuit amplifies and shifts the output ofthe second PZT so that it matches the voltage input rangeof the ADC on the DSP. The most critical task in termsof power consumption and peak currents is the actuation.During this phase, the energy circuit has to deliver up to900mA at the highest actuation frequencies. The currentdrawn by the actuation circuit at different actuation fre-quencies is shown in Figure 14.
The actuation circuit has proven to be effective through
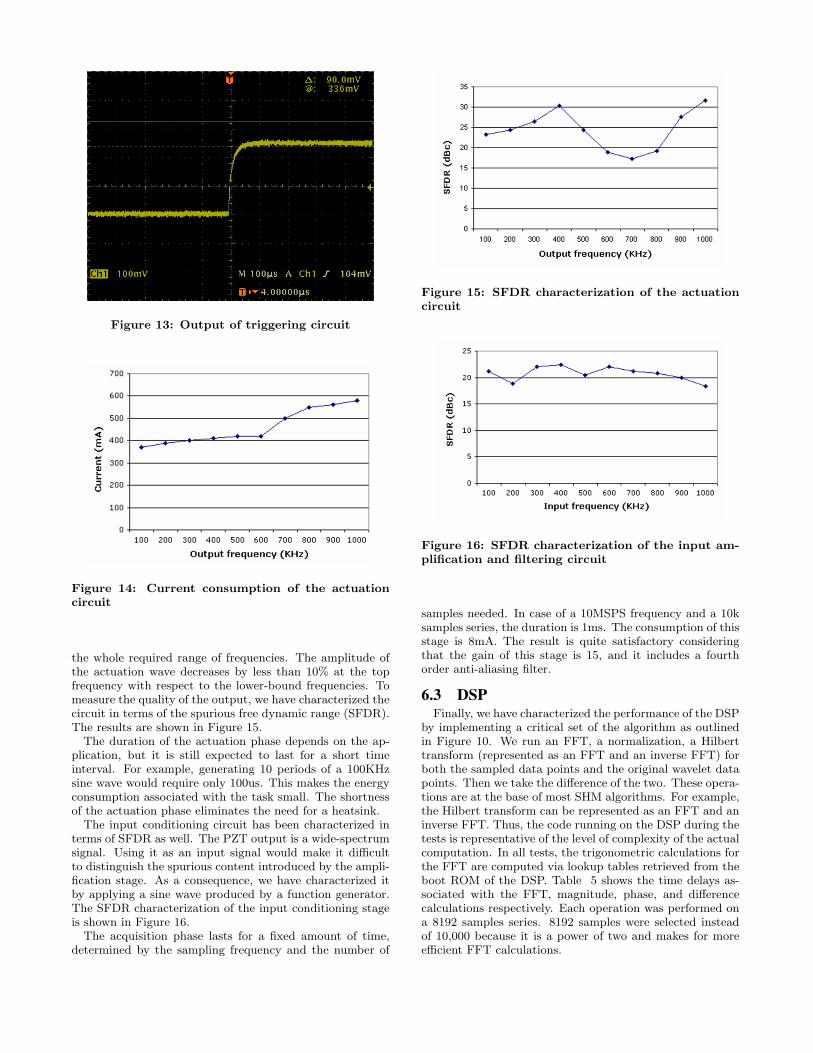
Figure 13: Output of triggering circuit
Figure 14: Current consumption of the actuationcircuit
the whole required range of frequencies. The amplitude ofthe actuation wave decreases by less than 10% at the topfrequency with respect to the lower-bound frequencies. Tomeasure the quality of the output, we have characterized thecircuit in terms of the spurious free dynamic range (SFDR).The results are shown in Figure 15.
The duration of the actuation phase depends on the ap-plication, but it is still expected to last for a short timeinterval. For example, generating 10 periods of a 100KHzsine wave would require only 100us. This makes the energyconsumption associated with the task small. The shortnessof the actuation phase eliminates the need for a heatsink.
The input conditioning circuit has been characterized interms of SFDR as well. The PZT output is a wide-spectrumsignal. Using it as an input signal would make it difficultto distinguish the spurious content introduced by the ampli-fication stage. As a consequence, we have characterized itby applying a sine wave produced by a function generator.The SFDR characterization of the input conditioning stageis shown in Figure 16.
The acquisition phase lasts for a fixed amount of time,determined by the sampling frequency and the number of
Figure 15: SFDR characterization of the actuationcircuit
Figure 16: SFDR characterization of the input am-plification and filtering circuit
samples needed. In case of a 10MSPS frequency and a 10ksamples series, the duration is 1ms. The consumption of thisstage is 8mA. The result is quite satisfactory consideringthat the gain of this stage is 15, and it includes a fourthorder anti-aliasing filter.
6.3 DSPFinally, we have characterized the performance of the DSP
by implementing a critical set of the algorithm as outlinedin Figure 10. We run an FFT, a normalization, a Hilberttransform (represented as an FFT and an inverse FFT) forboth the sampled data points and the original wavelet datapoints. Then we take the difference of the two. These opera-tions are at the base of most SHM algorithms. For example,the Hilbert transform can be represented as an FFT and aninverse FFT. Thus, the code running on the DSP during thetests is representative of the level of complexity of the actualcomputation. In all tests, the trigonometric calculations forthe FFT are computed via lookup tables retrieved from theboot ROM of the DSP. Table 5 shows the time delays as-sociated with the FFT, magnitude, phase, and differencecalculations respectively. Each operation was performed ona 8192 samples series. 8192 samples were selected insteadof 10,000 because it is a power of two and makes for moreefficient FFT calculations.
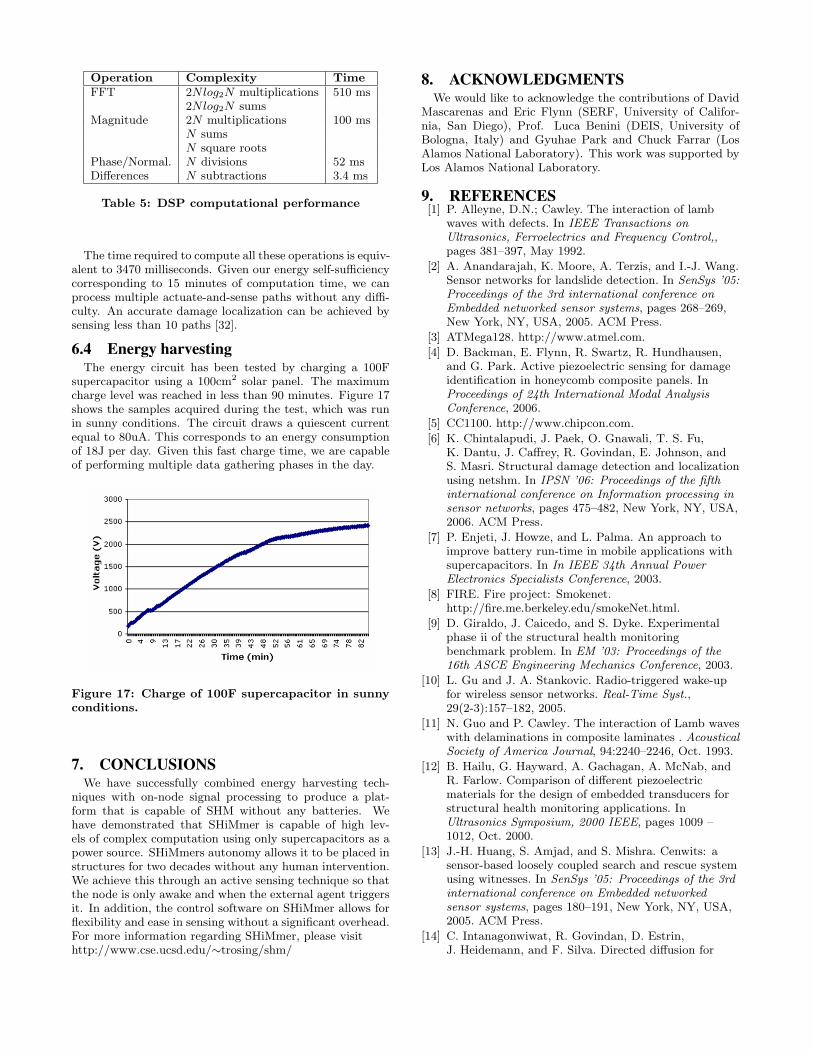
Operation Complexity TimeFFT 2Nlog2N multiplications 510 ms
2Nlog2N sumsMagnitude 2N multiplications 100 ms
N sumsN square roots
Phase/Normal. N divisions 52 msDifferences N subtractions 3.4 ms
Table 5: DSP computational performance
The time required to compute all these operations is equiv-alent to 3470 milliseconds. Given our energy self-sufficiencycorresponding to 15 minutes of computation time, we canprocess multiple actuate-and-sense paths without any diffi-culty. An accurate damage localization can be achieved bysensing less than 10 paths [32].
6.4 Energy harvestingThe energy circuit has been tested by charging a 100F
supercapacitor using a 100cm2 solar panel. The maximumcharge level was reached in less than 90 minutes. Figure 17shows the samples acquired during the test, which was runin sunny conditions. The circuit draws a quiescent currentequal to 80uA. This corresponds to an energy consumptionof 18J per day. Given this fast charge time, we are capableof performing multiple data gathering phases in the day.
Figure 17: Charge of 100F supercapacitor in sunnyconditions.
7. CONCLUSIONSWe have successfully combined energy harvesting tech-
niques with on-node signal processing to produce a plat-form that is capable of SHM without any batteries. Wehave demonstrated that SHiMmer is capable of high lev-els of complex computation using only supercapacitors as apower source. SHiMmers autonomy allows it to be placed instructures for two decades without any human intervention.We achieve this through an active sensing technique so thatthe node is only awake and when the external agent triggersit. In addition, the control software on SHiMmer allows forflexibility and ease in sensing without a significant overhead.For more information regarding SHiMmer, please visithttp://www.cse.ucsd.edu/∼trosing/shm/
8. ACKNOWLEDGMENTSWe would like to acknowledge the contributions of David
Mascarenas and Eric Flynn (SERF, University of Califor-nia, San Diego), Prof. Luca Benini (DEIS, University ofBologna, Italy) and Gyuhae Park and Chuck Farrar (LosAlamos National Laboratory). This work was supported byLos Alamos National Laboratory.
9. REFERENCES[1] P. Alleyne, D.N.; Cawley. The interaction of lamb
waves with defects. In IEEE Transactions onUltrasonics, Ferroelectrics and Frequency Control,,pages 381–397, May 1992.
[2] A. Anandarajah, K. Moore, A. Terzis, and I.-J. Wang.Sensor networks for landslide detection. In SenSys ’05:Proceedings of the 3rd international conference onEmbedded networked sensor systems, pages 268–269,New York, NY, USA, 2005. ACM Press.
[3] ATMega128. http://www.atmel.com.
[4] D. Backman, E. Flynn, R. Swartz, R. Hundhausen,and G. Park. Active piezoelectric sensing for damageidentification in honeycomb composite panels. InProceedings of 24th International Modal AnalysisConference, 2006.
[5] CC1100. http://www.chipcon.com.
[6] K. Chintalapudi, J. Paek, O. Gnawali, T. S. Fu,K. Dantu, J. Caffrey, R. Govindan, E. Johnson, andS. Masri. Structural damage detection and localizationusing netshm. In IPSN ’06: Proceedings of the fifthinternational conference on Information processing insensor networks, pages 475–482, New York, NY, USA,2006. ACM Press.
[7] P. Enjeti, J. Howze, and L. Palma. An approach toimprove battery run-time in mobile applications withsupercapacitors. In In IEEE 34th Annual PowerElectronics Specialists Conference, 2003.
[8] FIRE. Fire project: Smokenet.http://fire.me.berkeley.edu/smokeNet.html.
[9] D. Giraldo, J. Caicedo, and S. Dyke. Experimentalphase ii of the structural health monitoringbenchmark problem. In EM ’03: Proceedings of the16th ASCE Engineering Mechanics Conference, 2003.
[10] L. Gu and J. A. Stankovic. Radio-triggered wake-upfor wireless sensor networks. Real-Time Syst.,29(2-3):157–182, 2005.
[11] N. Guo and P. Cawley. The interaction of Lamb waveswith delaminations in composite laminates . AcousticalSociety of America Journal, 94:2240–2246, Oct. 1993.
[12] B. Hailu, G. Hayward, A. Gachagan, A. McNab, andR. Farlow. Comparison of different piezoelectricmaterials for the design of embedded transducers forstructural health monitoring applications. InUltrasonics Symposium, 2000 IEEE, pages 1009 –1012, Oct. 2000.
[13] J.-H. Huang, S. Amjad, and S. Mishra. Cenwits: asensor-based loosely coupled search and rescue systemusing witnesses. In SenSys ’05: Proceedings of the 3rdinternational conference on Embedded networkedsensor systems, pages 180–191, New York, NY, USA,2005. ACM Press.
[14] C. Intanagonwiwat, R. Govindan, D. Estrin,J. Heidemann, and F. Silva. Directed diffusion for
wireless sensor networking. IEEE/ACM Trans. Netw.,11(1):2–16, 2003.
[15] X. Jiang, J. Polastre, and D. Culler. Perpetualenvironmentally powered sensor networks. In IPSN’05: Proceedings of the 4th international symposiumon Information processing in sensor networks,page 65, Piscataway, NJ, USA, 2005. IEEE Press.
[16] S. Legendre, D. Massicotte, J. Goyette, and T. Bose.Wavelet-transform-based method of analysis forlamb-wave ultrasonic nde signals. In Instrumentationand Measurement, IEEE Transactions on, pages524–530, June 2000.
[17] E. Lehfeldt and P. Holler. Lamb waves and laminationdetection. Ultrasonics, 5:255, 1967.
[18] P. Levis, D. Gay, and D. Culler. Active sensornetworks. In Proceedings of the 2nd USENIX/ACMSymposium on Network Systems Design andImplementation (NSDI), 2005.
[19] J. Lynch, K. Law, A. Kiremidjian, T. Kenny,E. Carryer, and A. Partridge. The design of a wirelesssensing unit for structural health monitoring. InProceedings of the 3rd International Workshop onStructural Health Monitoring, Stanford, CA, 2001.”,2001.
[20] S. Madden, M. J. Franklin, J. M. Hellerstein, andW. Hong. Tag: a tiny aggregation service for ad-hocsensor networks. SIGOPS Oper. Syst. Rev.,36(SI):131–146, 2002.
[21] S. R. Madden, M. J. Franklin, J. M. Hellerstein, andW. Hong. Tinydb: an acquisitional query processingsystem for sensor networks. ACM Trans. DatabaseSyst., 30(1):122–173, 2005.
[22] D. L. Mascarenas, M. D. Todd, G. Park, and C. R.Farrar. A miniaturized electromechanicalimpedance-based node for the wireless interrogation ofstructural health. In Proceedings of SPIE – HealthMonitoring and Smart Nondestructive Evaluation ofStructural and Biological Systems, Mar. 2006.
[23] D. Montalvao, N. M. Maia, and A. M. Ribeiro. AReview of Vibration-based Structural HealthMonitoring with Special Emphasis on CompositeMaterials. The Shock and Vibration Digest,38(4):295–324, 2006.
[24] S. Pakzad, S. Kim, G. Fenves, S. Glaser, D. Culler,and J. Demmel. Multi-purpose wireless accelerometersfor civil infrastructure monitoring. In Proceedings ofthe 5th International Workshop on Structural HealthMonitoring, 2005.
[25] C. Park and P. H. Chou. Ambimax: Efficient,autonomous energy harvesting system formultiple-supply wireless sensor nodes. In SECON ’06:Proceedings of Third Annual IEEE CommunicationsSociety Conference on Sensor, Mesh, and Ad HocCommunications and Networks, 2006.
[26] V. Raghunathan and P. H. Chou. Design and powermanagement of energy harvesting embedded systems.In ISLPED ’06: Proceedings of the 2006 internationalsymposium on Low power electronics and design, pages369–374, New York, NY, USA, 2006. ACM Press.
[27] V. Raghunathan, A. Kansal, J. Hsu, J. Friedman, andM. Srivastava. Design considerations for solar energyharvesting wireless embedded systems. In IPSN ’05:
Proceedings of the 4th international symposium onInformation processing in sensor networks, page 64,Piscataway, NJ, USA, 2005. IEEE Press.
[28] F. Simjee and P. H. Chou. Everlast: long-life,supercapacitor-operated wireless sensor node. InISLPED ’06: Proceedings of the 2006 internationalsymposium on Low power electronics and design, pages197–202, New York, NY, USA, 2006. ACM Press.
[29] J. Simmers, Garnett E., J. R. Hodgkins, D. D.Mascarenas, G. Park, and H. Sohn. Improvedpiezoelectric self-sensing actuation. Journal ofIntelligent Material Systems and Structures,15(12):941–953, 2004.
[30] T. Smith, J. Mars, and G. Turner. Usingsupercapacitors to improve battery performance. In InPower Electronics Specialists Conference, 2002.
[31] K. S.S., S. Spearing, and C. Soutis. Damage detectionin composite materials using lamb wave methods. InProceedings of the American Society for Composites,Sept. 2001.
[32] A. B. Thien. Pipeline structural health monitoringusing micro-fiber composite active sensors. Master’sthesis, University of Cincinnati, 2006.
[33] TMS320R2811. http://www.ti.com.
[34] Y. Wang, J. P. Lynch, and K. H. Law. Design of alow-power wireless structural monitoring system forcollaborative computational algorithms. In T. Kundu,editor, Health Monitoring and Smart NondestructiveEvaluation of Structural and Biological Systems IV.Edited by Kundu, Tribikram. Proceedings of the SPIE,Volume 5768, pp. 106-117 (2005)., pages 106–117,May 2005.
[35] N. Xu, S. Rangwala, K. K. Chintalapudi, D. Ganesan,A. Broad, R. Govindan, and D. Estrin. A wirelesssensor network for structural monitoring. In SenSys’04: Proceedings of the 2nd international conferenceon Embedded networked sensor systems, pages 13–24,New York, NY, USA, 2004. ACM Press.
[36] Y. Zou, L. Tong, and G. Steven. Vibration-basedmodel-dependant damage (Delamination)indetification and health monitoring for compositestructures - A review. Journal of Sound andVibration, 2:357–378, 2000.