Embed Size (px)
Citation preview
Cross-modal interactions in the perception
of musical performance
Bradley W. Vinesa, Carol L. Krumhanslb, Marcelo M. Wanderleyc,Daniel J. Levitina,c,*
aDepartment of Psychology, McGill University, 1205 Avenue Penfield, Montreal, Que., Canada H2V 2A3bPsychology Department, Cornell University, Ithaca, NY, USA
cFaculty of Music and Center for Interdisciplinary Research in Music Media and Technology, McGill University,
Montreal, Que., Canada
Received 21 March 2005; revised 17 July 2005; accepted 7 September 2005
Abstract
We investigate the dynamics of sensory integration for perceiving musical performance, a
complex natural behavior. Thirty musically trained participants saw, heard, or both saw and
heard, performances by two clarinetists. All participants used a sliding potentiometer to make
continuous judgments of tension (a measure correlated with emotional response) and continuous
judgments of phrasing (a measure correlated with perceived musical structure) as performances
were presented. The data analysis sought to reveal relations between the sensory modalities
(vision and audition) and to quantify the effect of seeing the performances on participants’ overall
subjective experience of the music. In addition to traditional statistics, functional data analysis
techniques were employed to analyze time-varying aspects of the data. The auditory and visual
channels were found to convey similar experiences of phrasing but different experiences of
tension through much of the performances. We found that visual information served both to
augment and to reduce the experience of tension at different points in the musical piece (as
revealed by functional linear modeling and functional significance testing). In addition, the
musicians’ movements served to extend the sense of phrasing, to cue the beginning of new
phrases, to indicate musical interpretation, and to anticipate changes in emotional content.
Evidence for an interaction effect suggests that there may exist an emergent quality when musical
performances are both seen and heard. The investigation augments knowledge of human
Cognition 101 (2006) 80–113
www.elsevier.com/locate/COGNIT
0022-2860/$ - see front matter q 2005 Elsevier B.V. All rights reserved.
doi:10.1016/j.cognition.2005.09.003
* Corresponding author. Address: Department of Psychology, McGill University, 1205 Avenue Penfield,
Montreal, Que., Canada H2V 2A3. Tel.: C1 514 398 8263; fax: C1 514 398 4896.
E-mail address: [email protected] (D.J. Levitin).
B.W. Vines et al. / Cognition 101 (2006) 80–113 81
communicative processes spanning language and music, and involving multiple modalities of
emotion and information transfer.
q 2005 Elsevier B.V. All rights reserved.
Keywords: Cross-modal interactions; Music cognition; Emotion; Gesture
1. Introduction
One of the oldest questions in experimental psychology concerns the nature of cross-
modal sensory interactions—the degree to which information from one sensory channel
influences our interpretation of information arising through other sensory channels.
Indeed, the field of psychophysics was launched with the famous “Greenwich Observatory
Problem” (Boring, 1923; Levitin, MacLean, Mathews, Chu, & Jensen, 2000; Mollon &
Perkins, 1996), which grew out of discrepancies between visual and auditory information
in plotting stellar transits using Bradley’s “eye and ear method”—a classic cross-modal
interaction problem.1 The early experimental psychologists and “mental scientists” (as
they were called at the time) conducted experiments to investigate a possible priority or
hierarchy among the senses when they provide contradictory information (e.g. Exner,
1875).
A number of phenomena, including the ventriloquism effect (Radeau & Bertelson,
1974), the McGurk effect (McGurk & MacDonald, 1976), the phi phenomenon (O’Leary
& Rhodes, 1984; Staal & Donderi, 1983), and the existence of synthaesthetes
(Baron-Cohen & Harrison, 1996; Cytowic, 2002; Grossenbacher & Lovelace, 2001)
demonstrates the ways in which visual and auditory information can mutually reinforce,
contradict, or modify one another (see also Dixon & Spitz, 1980; Massaro, 1987, 1998;
McGrath & Summerfeld, 1985).
The interaction between auditory and visual information is also known to influence
cognitive and emotional judgments—the focus of the present research. In one study, for
example, participants viewed video recordings of newscasters, narrators, and actors
talking. When the audio track was asynchronously earlier than the video track, participants
judged the talkers to be lower in quality and pleasantness (Reeves & Nass, 1996).
Additionally, Boltz (2001) found that musical excerpts set to a movie scene influenced the
observer’s interpretation of characters’ actions and mental states. For example, a scene in
which a man follows a woman through the city was interpreted as a precursor to
kidnapping or murder when the accompanying music was negative in emotional character,
but the same scene was interpreted as a romantic crescendo if the accompanying music
was of a positive valence.
A number of experiments have shown that the intelligibility of speech is significantly
increased when the speaker’s face can be seen as well as heard (MacLeod & Summerfield,
1987; Massaro, 1987, 1998; Repp, Frost, & Zsiga, 1992; Sumby & Pollack, 1954). Might it
1 In the so-called eye-and-ear method, the astronomer would track the star’s movement across gradients etched
on the telescope’s eyepiece while noting the star’s position relative to successive ticks on a clock in the
observatory.
B.W. Vines et al. / Cognition 101 (2006) 80–11382
also be the case that the intelligibility of music is similarly increased when the musician’s
facial and bodily movements can be seen as well as heard?
Not surprisingly, the auditory component of music has been the primary focus of
research in music cognition to date (Baily, 1985; Storr, 1992). Yet the visual experience of
watching a performance may also convey relevant information. Why do people enjoy live
performances of music, even though most living rooms offer a more intimate and pristine
listening environment? Apart from the social aspects of sharing an aesthetic experience
with others, what might the visual information convey? Body movements have been
shown to reveal certain internal mental states and attitudes accurately (Aston & Savona,
1992; McNeill, 1992; Planalp, DeFrancisco, & Rutherford, 1996; Runeson & Frykholm,
1983) even in children (Boone & Cunningham, 2001), and it has been suggested that the
gestures and movements of musicians communicate aspects of their internal states as well
(Davidson, 1993; Delalande, 1988).
Because all musical instruments are played through bodily gestures (Levitin,
McAdams, & Adams, 2002), learning a musical piece requires both auditory memory
and motor memory. In general, body movements are intertwined in musicians’ memory
for musical pieces (Wanderley, 2002). If the movements are an integral aspect of a
musician’s memory for a piece of music, then what do those movements convey to a
person who can see the performer? Are they simply epiphenomena necessary to execute
the piece, or do they contain additional information about the performer’s emotional states
and intentions, or even the states and intentions of the composer as interpreted and
channeled by the performer?
Davidson (1993) asked participants to rate the expressiveness of recorded
performances. The performers had been given instructions to play in three different
ways: with no expressiveness (in a “dead-pan” manner), with standard expressiveness (as
if playing to an audience), and with exaggerated expressiveness. The experimental
participants experienced sound only, image only, or both sound and image; the visual
image was represented in point-light form (Johansson, 1973) to avoid any biasing due to
the performer’s appearance.2 Participants were best able to distinguish the three levels of
expressive intention when they saw the performances without hearing them. Judgment
accuracy decreased significantly in the sound only condition. Davidson concluded that the
gestures of musicians are a more revealing indicator of expressive intention than the
sound.
Krumhansl and Schenck (1997) presented a ballet performance to three groups of
participants who either only saw the dance, only heard the music, or both saw and heard
the performance. Participants made four different judgments in real time: identifying
section ends, identifying new ideas, a continuous judgment of tension, and a continuous
judgment of the amount of emotion. The judgments were found to be similar across
modalities with highly significant correlations among them, and the judgments from
participants who could both hear and see the performances could be modeled by an
2 Johansson (1973) pioneered the point-light method to study the perception of body motion independent of
form. A point-light recording is made by placing reflective tape on key joints of the performer’s body while
filming. During playback, the contrast of the video image is adjusted so that only the reflectors are visible against
a dark background.
B.W. Vines et al. / Cognition 101 (2006) 80–113 83
additive combination of the judgments from the other two conditions. Krumhansl and
Schenck thus showed that the visual and auditory modalities of a ballet performance can
convey similar structural and emotional information and that input from different
perceptual modalities can generate congruent experiences for an observer.
1.1. Measuring tension
Musical experience may be characterized as an ebb and flow of tension that gives rise to
emotional responses (Krumhansl, 2002; Meyer, 1956; Patel, 2003). Many structural
features of music contribute to the experience of tension, including pitch range, loudness
dynamics, note density, harmonic relations, and implicit expectations based on experience
with a musical genre (Bigand & Parncutt, 1999; Krumhansl, 1996; Meyer, 1956); for this
reason, tension is considered a “global” attribute of musical experience (Madsen &
Fredrickson, 1993).
In the continuous tension judgment (Krumhansl & Schenk, 1997; Nielsen, 1983, cited
in Fredrickson, 1995; Madsen & Fredrickson, 1993), participants squeeze a pair of spring-
loaded tongs or adjust some other continuously variable input device to indicate the
amount of tension they are experiencing in real time, as a musical performance is
presented. For a variety of Western classical musical stimuli, continuous tension
judgments have proven to be consistent across participant age, level of musical skill, and
amount of familiarity with the musical stimulus (Fredrickson, 1997, 1999, 2000;
Krumhansl, 1996).3 It is notable that no explicit meaning of “tension” was given to
participants in these studies (Fredrickson, 1995, 1997, 1999, 2000; Krumhansl, 1996,
1997; Krumhansl & Schenck, 1997; Madsen & Fredrickson, 1993); common non-musical
experiences, such as tension in the body and in physical objects, and metaphorical uses of
the word to describe social situations, may account for the similarity in continuous tension
judgments across individuals. This measure is also related to changes in physiology,
including cardiac, vascular, respiratory, and electrodermal functions (Krumhansl, 1997).
Krumhansl (1997) further found that participants’ judgments of the dominant emotion
in a musical piece were significantly correlated with tension. This finding is consistent
with the results of Krumhansl and Schenck’s ballet study (1997), in which the judgment of
“amount of emotion” correlated significantly with tension ratings. Accordingly, tension
can serve as a proxy for the experience of emotion in a musical piece.
One methodological advantage of using tension judgments (rather than directly asking
about emotion) is that tension (as most people understand the term) is one-dimensional,
varying only in intensity, and it thus maps directly onto a one-dimensional input device
such as spring-loaded tongs or a linear potentiometer (“fader”). Though the factors
contributing to the experience and interpretation of tension in music are multi-
dimensional—involving structural features in sound as well as a variety of real-world
referents to tension—the final judgment indexes the magnitude of overall intensity of
3 Using chord progressions, Bigand et al. (1999) have found differences in the music–theoretical factors that
influence discrete ratings of tension for musicians and non-musicians, though they identified commonalities as
well. Additionally, inter-subject agreement was higher for musicians (Bigand & Parncutt, 1999).
B.W. Vines et al. / Cognition 101 (2006) 80–11384
experience. The multi-dimensional input contributes to a one-dimensional output.
Emotion, on the other hand, is multi-dimensional in nature (Davidson, Ekman, Saron,
Senulis, & Friesen, 1990; Ekman, 1992; Gagnon & Peretz, 2003; Russell, 1979; Schubert,
1999), hence it does not have an obvious mapping onto one-dimensional input devices; it
would be ambiguous as to which dimension of emotion (e.g. valence, arousal, happiness–
sadness, approach–withdrawal) was being measured at any one time. A second advantage
of using tension judgments to access affective experience is that many studies have already
employed them successfully, facilitating comparison with previous findings.
1.2. Measuring phrasing
Theoretical accounts of music and language posit that they both have structure, that this
structure is hierarchical (Cooper & Meyer, 1960; Cooper & Paccia-Cooper, 1980; Lerdahl,
2001; Lerdahl & Jackendoff, 1983; Levitin & Menon, 2003; West, Howell, & Cross,
1985), and that smaller elements are grouped to form larger phrases with clear and
specifiable temporal boundaries (Adams, 1977; Aiello, 1994; Fodor & Bever, 1965;
Gregory, 1978). Investigators have used an analogy between music and speech to collect
judgments of musical phrase structure. Different tasks have been employed to this end,
including the identification of new ideas introduced into a performance (Deliege & El
Ahmadi, 1990; Imberty, 1981; Krumhansl, 1996; Krumhansl & Schenck, 1997) and the
identification of section endings (Clarke & Krumhansl, 1990; Gregory, 1978; Krumhansl,
1996; Krumhansl & Schenck, 1997). In their ballet study, Krumhansl & Schenck (1997)
found that the visual-only and the auditory-only participant groups identified many of the
same endings of phrases. Thus, visual and auditory information can convey not just similar
affect in the form of tension but also similar phrasing structures. Additionally, researchers
have found that musicians’ interpretations of a musical score, with respect to phrasing
boundaries in particular, are revealed by adjustments in performance timing (e.g. rubato),
and that such adjustments are recognized by listeners as cues for musical boundaries
(Gabrielsson, 1987; Palmer, 1996; Todd, 1985). As with the tension judgment, judgments
of structure and phrasing in music have proven to be consistent across levels of musical
skill (Deliege & El Ahmadi, 1990; Krumhansl, 1996).
1.3. Exploring cross-modal interactions in tension and phrasing judgments
The present experiment explores cross-modal issues in musical performance. In
particular, we focus on two components of musical experience—the sense of emotion
conveyed (as indexed by real-time continuous judgments of tension) and the sense of
musical structure conveyed (as indexed by real-time continuous judgments of phrasing).
Musicians tend to entrain their movements to the music’s metric pulse (the tactus or
“beat” of the music; Wanderley, 2002), leading to constrained and predictable motions
that may obscure the more subtle motions and gestures a musician makes in response to
emotional and structural aspects of the music. Accordingly, we sought to find a musical
piece that lacked such a pulse. We chose Stravinsky’s second piece for solo clarinet
(Revised edition 1993, Chester Music Limited, London), a composition without any
underlying meter. (The score for the piece is attached below, in Appendix A.) The work is
B.W. Vines et al. / Cognition 101 (2006) 80–113 85
also unaccompanied, thus a performer’s movements are not affected by the presence of
another performer. Stravinsky’s Three Pieces for Clarinet Solo have become standard
repertoire for advanced clarinetists, thus, performers from varied schools of training are
readily available for replications and extensions.
2. Methods
2.1. Participants
Thirty participants from the McGill University community were recruited for the
experiment (mean age 23.7 years, SD 3.1, range 18–30). All participants had at least 5
years of musical training (mean 13.5 years, range 5–26, SD 6.2). This criterion ensured
that participants had a developed musical ear and an understanding of basic terms in
music. Pilot testing and previous research mentioned above have revealed that musicians
and non-musicians perform similarly on the tasks used in this experiment. Therefore, the
results from the musician participants may be generalized to the non-musician population.
Using a Between-Subjects design, participants were randomly divided into three
equally sized treatment groups of 10 participants each. The auditory only (AO) group
heard the performances with the visual component removed, the visual only (VO) group
saw the performances with the auditory component removed, and the auditoryCvisual
(AV) group experienced the performances with both auditory and visual components
intact. Following the division into three such groups, participants completed tasks in a
within-subjects fully factorial design, detailed below. Each participant received 5 dollars
CDN for participating.
2.2. Stimuli
The stimuli consisted of two video recorded performances by professional clarinetists,
(Performers R and W), that were originally created for an investigation conducted by
Wanderley (2002). In that study, clarinetists were videotaped while an Optotrak system
(Northern Digital Inc., Waterloo, Ont., Canada) recorded the location of sensors placed on
the body and instrument. The clarinetists performed Stravinsky’s second piece for solo
clarinet, as if presenting to a public audience. One performance was 69 s in length and the
other was 80 s in length, yielding 690 and 800 data points, respectively (using a sampling
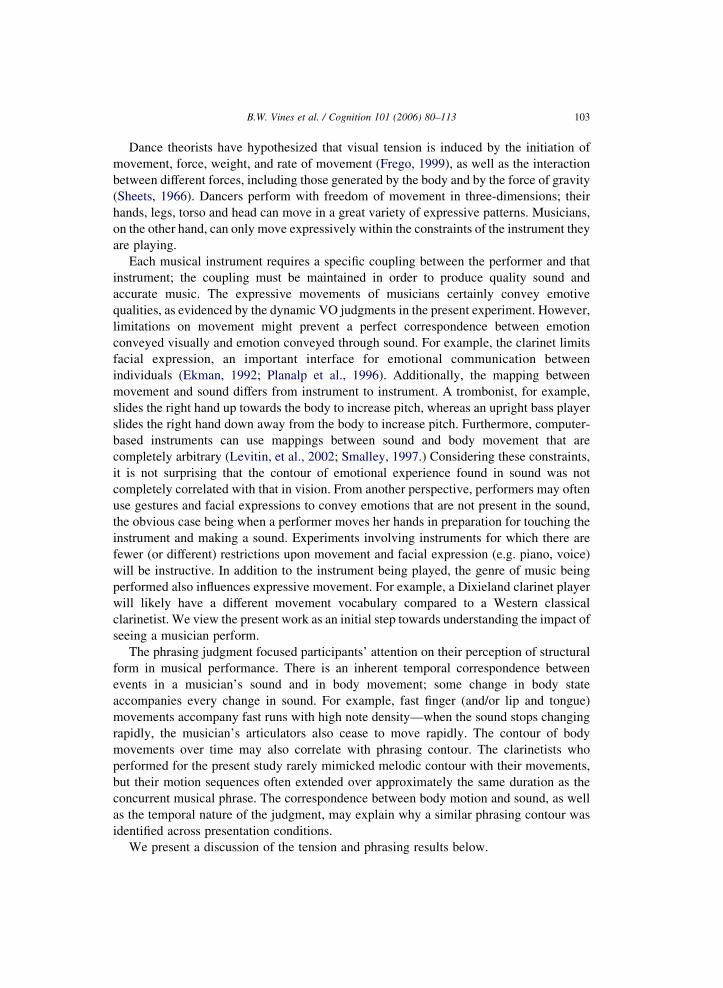
rate of 10 Hz). Screen captures from these performances are shown in Fig. 1.
The performances were shown in counterbalanced order with digital-video quality and
National Television Standards Committee format (NTSC 25 frames per second) on a G4
desktop Macintosh with a Mitsubishi 20 00 Flat Panel LCD monitor. The stimuli were
prepared so that approximately 1 s preceded the beginning of the first note.
Participants received a “familiarization trial” during which they were exposed to the
stimuli in their particular presentation condition before performing any recorded
judgments (e.g. participants in the VO group saw the entirety of the performances
without any sound before making their judgments).
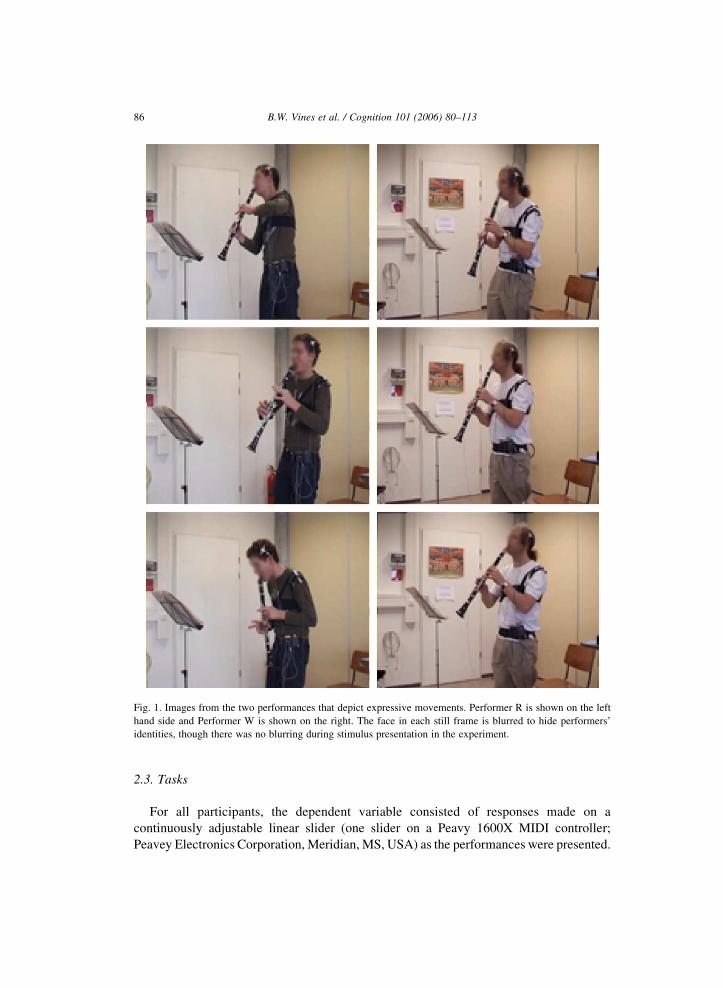
Fig. 1. Images from the two performances that depict expressive movements. Performer R is shown on the left
hand side and Performer W is shown on the right. The face in each still frame is blurred to hide performers’
identities, though there was no blurring during stimulus presentation in the experiment.
B.W. Vines et al. / Cognition 101 (2006) 80–11386
2.3. Tasks
For all participants, the dependent variable consisted of responses made on a
continuously adjustable linear slider (one slider on a Peavy 1600X MIDI controller;
Peavey Electronics Corporation, Meridian, MS, USA) as the performances were presented.
B.W. Vines et al. / Cognition 101 (2006) 80–113 87
The location of the slider was sampled once every 100 ms by a computer program in the
Max/MSP programming environment (Cycling ’74, San Francisco, CA, USA).
Half of the participants completed tension judgments first and the other half completed
phrasing judgments first. The ordering was counterbalanced. (See Fig. 2 for a summary of
the experiment sequence.)
The participants read the following on-screen instructions before performing the
tension task:
Use the full range of the slider to express the TENSION you experience in the
performance. Move the slider upward as the tension increases and downward as the
tension decreases. Begin with the slider all the way down.
There was an initial practice round that allowed participants to become familiar with
the range of the slider and the tension task in general. A solo clarinet performance of the
first movement in Francis Poulenc’s Sonata for Clarinet and Piano in B flat (14th edition
1993, Chester Music, London) was presented for this purpose. The clarinetist in the warm-
up performance was not one of the two who played in the experimental stimuli.
Participants read the following on-screen instructions before performing the phrasing
task:
Use the full range of the slider to express the PHRASING you experience in the
performance. Move the slider upward as a phrase is entered and downward as a phrase
is exited. The slider should be near the top in the middle of a phrase and near the bottom
between phrases. Begin with the slider all the way down.
Participants became familiar with the phrasing task and apparatus during a separate
practice round. The experimenters presented an unaccompanied performance of the
second movement in Francis Poulenc’s Sonata for Clarinet and Piano in B flat (14th
edition 1993, Chester Music, London).
All participants completed a questionnaire detailing their musical training after the
tasks were completed.
3. Results
3.1. Analysis
For each measure, tension and phrasing, we first present a correlation analysis, followed
by functional data analyses.
3.1.1. Correlation analysis
Techniques do not presently exist for accurately calculating the correlation between
two functions that are themselves serially correlated and non-stationary (i.e. for which
consecutive values are dependent over time in a non-predictable way). To quantify the
relations among perceptual modalities, we computed two correlations—a non-parametric
estimate, and a parametric estimate with serial correlation removed as much as possible.
These two different estimates allow us to converge on an understanding of the true nature
of the association between variables.
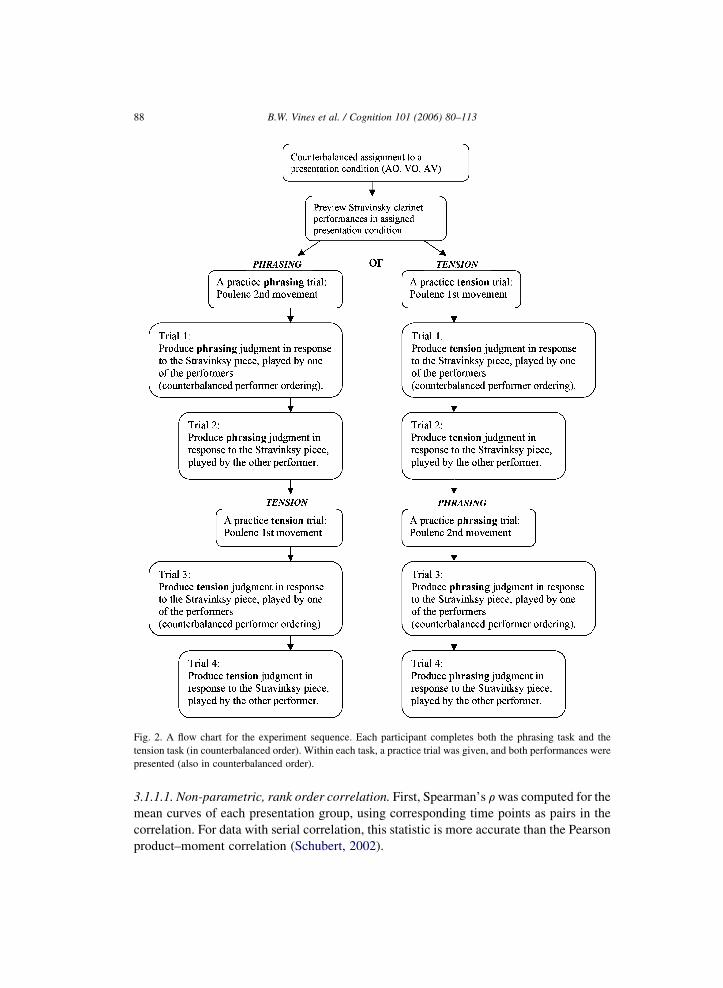
Fig. 2. A flow chart for the experiment sequence. Each participant completes both the phrasing task and the
tension task (in counterbalanced order). Within each task, a practice trial was given, and both performances were
presented (also in counterbalanced order).
B.W. Vines et al. / Cognition 101 (2006) 80–11388
3.1.1.1. Non-parametric, rank order correlation. First, Spearman’s r was computed for the
mean curves of each presentation group, using corresponding time points as pairs in the
correlation. For data with serial correlation, this statistic is more accurate than the Pearson
product–moment correlation (Schubert, 2002).
B.W. Vines et al. / Cognition 101 (2006) 80–113 89
3.1.1.2. Parametric statistic, with serial correlation removed. A second measure of
correlation was used to reduce the effects of serial correlation in the data. We offer a
general overview of the method, followed by a more detailed description for the interested
reader.
In time series data such as those we have here, two sources of serial correlation (also
known as autocorrelation) exist. First, the position of the slider at any given moment (our
dependent variable) is by necessity correlated with the position of the slider at the time
point just before and just after a given observation (xtwxtK1, oxtwxtC1), simply because
the slider cannot move instantaneously from one position to another without passing
through intermediate positions. Second, at a more abstract level, we assume that the
musical performance cannot cause an instantaneous change from one emotion or sense of
phrasing to another (the state-of-the-world that our dependent variable is intended to
capture). Existing correlation statistics, like the Pearson correlation, assume that
successive points in the series are independent. Our approach to removing serial
correlation is based on Boker, Xu, Rotondo, and King, (2002). We first partitioned the
musical piece into musically meaningful segments that were large enough to qualify the
assumption that slider positions in one segment would be independent from those in an
adjacent segment. We then sampled sequential points spaced evenly within each segment,
and used them to compute correlations. The calculated correlations each used a single
sample from each of the segments. We averaged across all of the calculated correlations to
generate the reported result.
The particular way that we segmented the musical piece (and the corresponding
function characterizing the slider position) was as follows. Based upon an analysis of the
musical score obtained from a music theorist and two musicians, we identified seven major
phrasing sections in the piece (shown in Appendix A). This divided the performances into
seven sections corresponding to independent psychological units, that is, regions of the
musical piece within which we had a priori theoretical reasons to believe the dependent
variable should be independent in value compared to adjacent regions. We further
subdivided the seven phrasing sections into three subsections of equal duration.
The shortest subsection was 2.0 s long for Performer R (mean subdivision length: 3.3 s,
SD: 0.80, max: 5.8) and the shortest subsection was 2.2 s long for Performer W (mean
subdivision length: 3.8 s, SD: 1.0, max: 6.2). The use of a minimum duration length of 2.0
and 2.2 s for Performer R and Performer W, respectively, presumes that the location of a
participant’s slider at time t is independent from the location of the sliderw(approxi-
mately) 2 s before. This is a reasonable assumption considering that (1) the minimum
threshold for motor response is below 0.5 s (Galbraith, Chae, Cooper, Gindi, Ho & Kim,
2000), (2) the musical piece is characterized by rapid change, and response times are likely
to reflect this feature of the music, and (3) past research suggests that the frequency of
relevant information for continuous measurements is close to 1 Hz (Madsen &
Fredrickson, 1993). Therefore, time windows that are 2 s in duration or longer should
comprise independent events in the participants’ continuous responses.
Once the 21 subsections were determined for each performance, we built a set of
vectors of length 21 (that is, each vector had 21 cells, populated with one value of the
dependent variable taken from each of the 21 subsections). The first vector in this set was
composed of the first slider value in each of the 21 subsections. Because there were
B.W. Vines et al. / Cognition 101 (2006) 80–11390
differences in the subsection lengths, the remaining vectors were filled by sampling
elements from the longer duration subsections based upon the percentage of the subsection
traversed in time. For example, for Performer R, the shortest subsection was 2.0 s, which
comprised 20 sampled values (due to the 10 Hz sampling rate). The sampled sets were,
therefore, drawn at intervals of 0/20th of the duration of the subsection (the first sample),
1/20th of the duration, 2/20th of the duration, and so on up to 19/20th, using rounding to
the nearest measured time point. For example, the sample values occurring 1/20th of the
way into each subsection duration were selected to form the second vector, and the sample
values occurring 2/20th of the way into each duration were selected to form the third
vector. Again, we used this method of sample extraction instead of simply taking
consecutive elements from each subsection because the subsections varied in length; using
consecutive elements would only have included the first n elements in each subsection
(where n is the length of the shortest subsection), leaving data from the ends of the longer
subsections unconsidered. We sought to develop a statistic that took into account the full
range of data. Our technique uses every datum in the shortest subsection, and samples data
from the entire temporal range of the longer samples in a proportional fashion.
We repeated this procedure for each presentation condition and then calculated a two-
tailed Pearson correlation for each of the 21 extrapolated sets. We then calculated the
average for the 21 Pearson correlations that compared each presentation condition. The
same procedure was used for Performer W, though the minimum duration was 2.2 s (22
sampled values), thus there were 22 sets of values and 22 separate correlation coefficients
calculated between each presentation condition for Performer W. We calculated the
average for all correlations and P-values to provide overall estimates.
3.1.2. Functional data analysis
Functional data analysis (FDA) is a statistical approach and a set of software tools
developed for datasets that arise from continuous processes (Levitin, Nuzzo, Vines,
Ramsay, 2005; Ramsay, 2003; Ramsay & Silverman, 1997, 2002). Examples of
continuous processes include seasonal temperatures, movement trajectories, and one’s
experience while listening to or watching a musical performance (particularly when
continuous judgments are the dependent variable). FDA models discrete data sampled
over time with continuous functions of time, and then operates on those functions as the
basic elements of analysis.
3.2. Tension
3.2.1. Treatment of outliers
Judgments that were static (i.e. those that did not deviate from position zero, at the
bottom of the slider) throughout the majority of a performance were removed from the
analysis. Twenty-seven judgments remained for Performer R (nine AO, eight VO, and ten
AV) and 28 judgments remained for Performer W (nine AO, nine VO, and ten AV). One
AO participant’s tension judgment, made in response to Performer R, was active until
second 53.3, after which time the judgment remained static. That participant’s data, from
second 53.3 until the end of the performance were treated as missing data in the following
analyses. (All other participants were active throughout the entirety of each performance.)
B.W. Vines et al. / Cognition 101 (2006) 80–113 91
The analyses mentioned below were performed independently for data collected in
response to each performance.
3.3. Treatment of missing data
Due to a programming error, data for the first 4 s in some of the judgments were lost.
For Performer R, six judgments were affected (three AO, two AV, and one VO). For
Performer W, four judgments were affected (one AO, two AV, and one VO). All data were
intact for the remainder of each performance (65 s for Performer R and 76 s for Performer
W). For the functional analyses, the missing data were replaced by an average of the intact
judgments in the same condition. The missing data were simply left out of the group means
used in the conventional analyses.
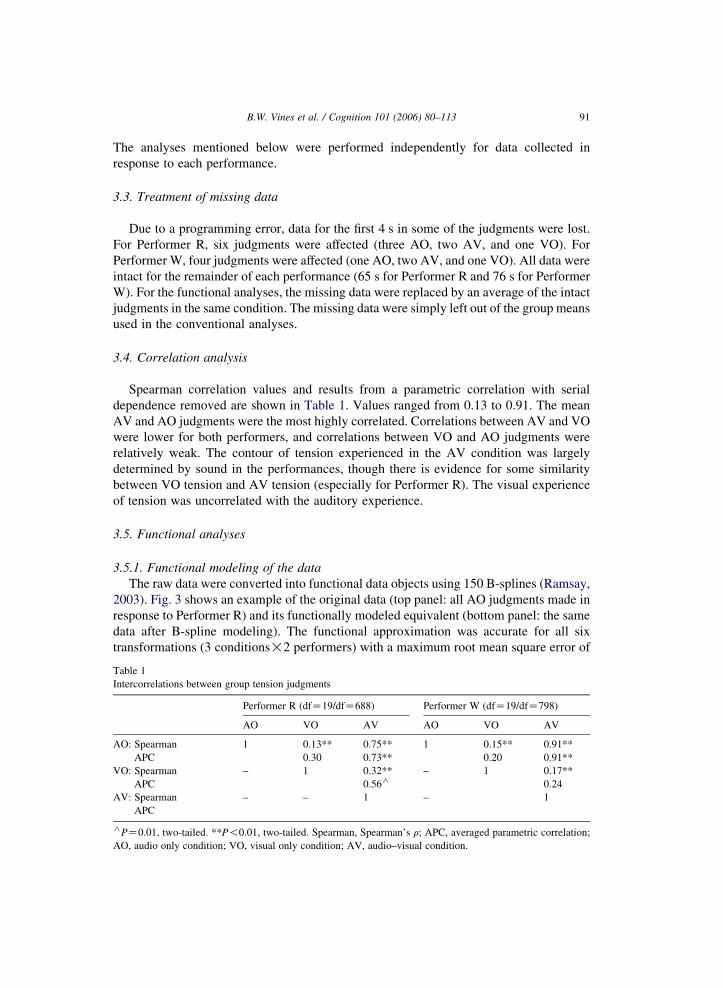
3.4. Correlation analysis
Spearman correlation values and results from a parametric correlation with serial
dependence removed are shown in Table 1. Values ranged from 0.13 to 0.91. The mean
AV and AO judgments were the most highly correlated. Correlations between AV and VO
were lower for both performers, and correlations between VO and AO judgments were
relatively weak. The contour of tension experienced in the AV condition was largely
determined by sound in the performances, though there is evidence for some similarity
between VO tension and AV tension (especially for Performer R). The visual experience
of tension was uncorrelated with the auditory experience.
3.5. Functional analyses
3.5.1. Functional modeling of the data
The raw data were converted into functional data objects using 150 B-splines (Ramsay,
2003). Fig. 3 shows an example of the original data (top panel: all AO judgments made in
response to Performer R) and its functionally modeled equivalent (bottom panel: the same
data after B-spline modeling). The functional approximation was accurate for all six
transformations (3 conditions!2 performers) with a maximum root mean square error of
Table 1
Intercorrelations between group tension judgments
Performer R (dfZ19/dfZ688) Performer W (dfZ19/dfZ798)
AO VO AV AO VO AV
AO: Spearman
APC
1 0.13** 0.75** 1 0.15** 0.91**
0.30 0.73** 0.20 0.91**
VO: Spearman
APC
– 1 0.32** – 1 0.17**
0.56o 0.24
AV: Spearman
APC
– – 1 – 1
oPZ0.01, two-tailed. **P!0.01, two-tailed. Spearman, Spearman’s r; APC, averaged parametric correlation;
AO, audio only condition; VO, visual only condition; AV, audio–visual condition.
B.W. Vines et al. / Cognition 101 (2006) 80–11392
9% of the full range of values. Some error was due to high frequency fluctuations that
emerged when the spline-fitting algorithm attempted to model sudden plateaus in
participants’ judgments—the function oscillates about the plateau value with dampening
magnitude. These relatively insignificant high-frequency artifacts of noise did not interfere
with subsequent analyses or interpretations, all of which targeted larger scale and lower-
frequency changes over time.
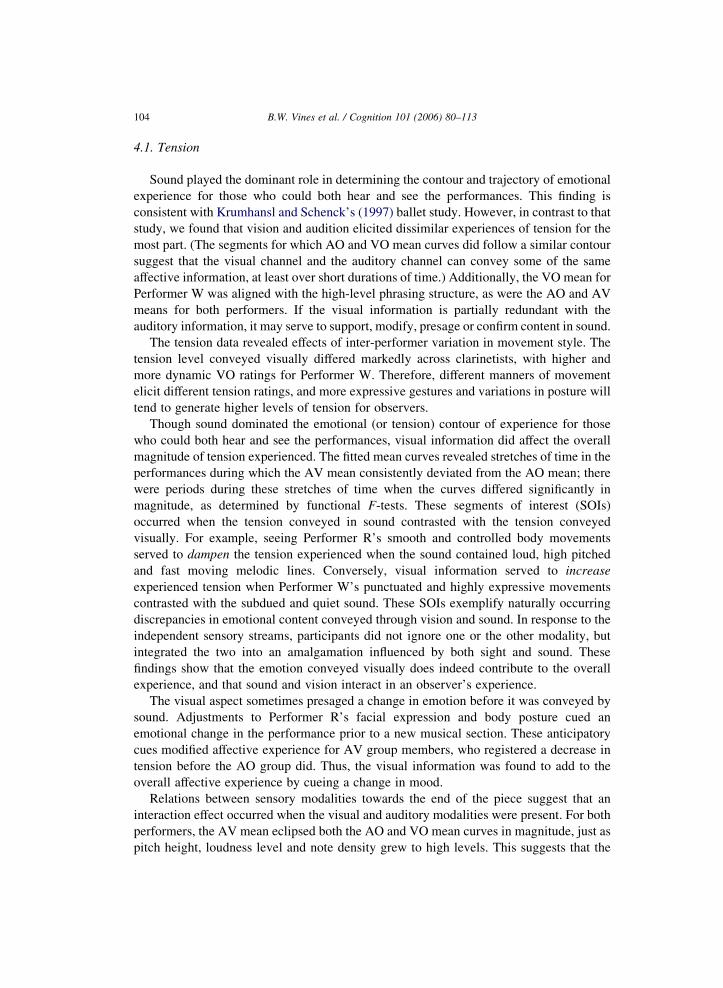
3.5.2. Fitted mean curves and smoothing
Fitted mean curves were prepared for each presentation condition (see Fig. 4). The
fitted mean captures the underlying tendency (the average) for a group of functions in the
same condition. We applied a smoothing function to the fitted means with a smoothing
value lZ0.1 for the tension data; this smoothing value was chosen so as to simplify the
visual display without eliminating contours that were important to the analysis. The
tension curves for groups presented with sound (AO and AV groups) were generally more
dynamic than the VO fitted means; the VO curve for Performer R was especially static.
The AV curve followed a similar contour to that of the AO curve for both performers, in
accordance with the correlation values discussed above. The VO contour was idiosyncratic,
although there were times when the VO, AO and AV curves changed together (for example,
seconds 40–50 for Performer R; seconds 30–35 and 55–60 for Performer W in Fig. 4).
Fig. 3. Each line represents the tension judgment of a single participant in the auditory only condition, made in
response to Performer R. The original data are shown in the top panel and the same data are shown in the lower
panel after modeling with functional techniques.
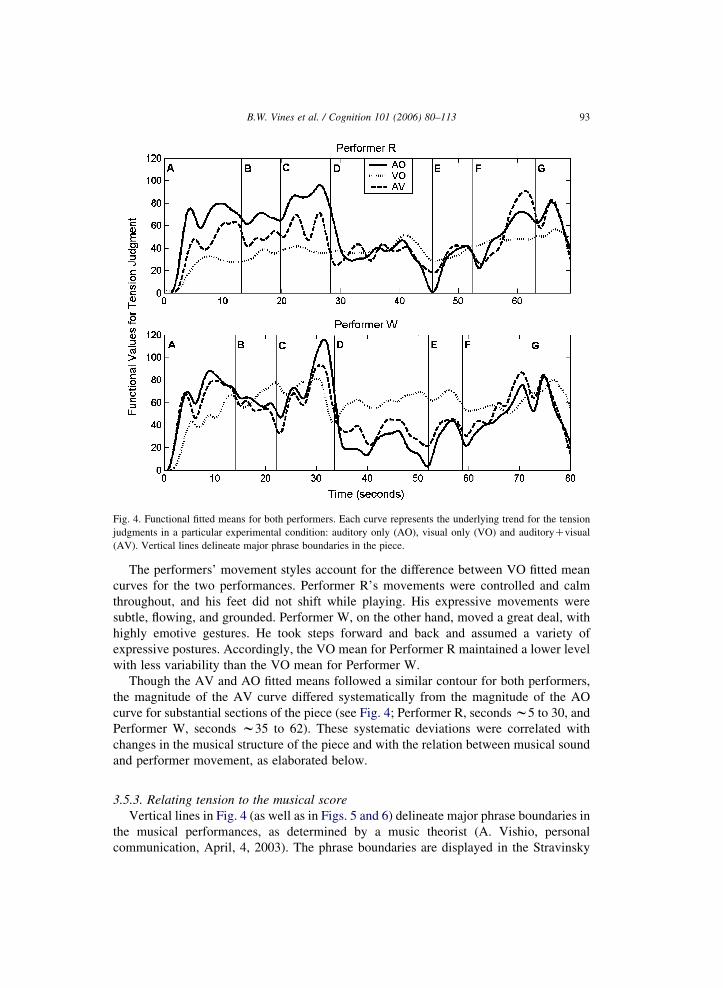
Fig. 4. Functional fitted means for both performers. Each curve represents the underlying trend for the tension
judgments in a particular experimental condition: auditory only (AO), visual only (VO) and auditoryCvisual
(AV). Vertical lines delineate major phrase boundaries in the piece.
B.W. Vines et al. / Cognition 101 (2006) 80–113 93
The performers’ movement styles account for the difference between VO fitted mean
curves for the two performances. Performer R’s movements were controlled and calm
throughout, and his feet did not shift while playing. His expressive movements were
subtle, flowing, and grounded. Performer W, on the other hand, moved a great deal, with
highly emotive gestures. He took steps forward and back and assumed a variety of
expressive postures. Accordingly, the VO mean for Performer R maintained a lower level
with less variability than the VO mean for Performer W.
Though the AV and AO fitted means followed a similar contour for both performers,
the magnitude of the AV curve differed systematically from the magnitude of the AO
curve for substantial sections of the piece (see Fig. 4; Performer R, seconds w5 to 30, and
Performer W, seconds w35 to 62). These systematic deviations were correlated with
changes in the musical structure of the piece and with the relation between musical sound
and performer movement, as elaborated below.
3.5.3. Relating tension to the musical score
Vertical lines in Fig. 4 (as well as in Figs. 5 and 6) delineate major phrase boundaries in
the musical performances, as determined by a music theorist (A. Vishio, personal
communication, April, 4, 2003). The phrase boundaries are displayed in the Stravinsky
B.W. Vines et al. / Cognition 101 (2006) 80–11394
score in Appendix A. It is notable that each phrase boundary is accompanied, or is
followed closely in time, by a trough in tension ratings for both the AO and AV curves.
Clearly the contour of tension in the performances was tightly linked to the phrasing
structure in the piece, a finding that is consistent with past work by Krumhansl (1996,
2002) and Krumhansl & Schenck (1997). The phrasing structure was also reflected in the
VO tension mean for Performer W: Tension tended to build-up during phrases and to drop
at phrase boundaries or just after. Except for the boundary at phrase E, this trend is not
obvious in the VO data for performer R. We now present an analysis of the performances
with respect to musical content and visual content.
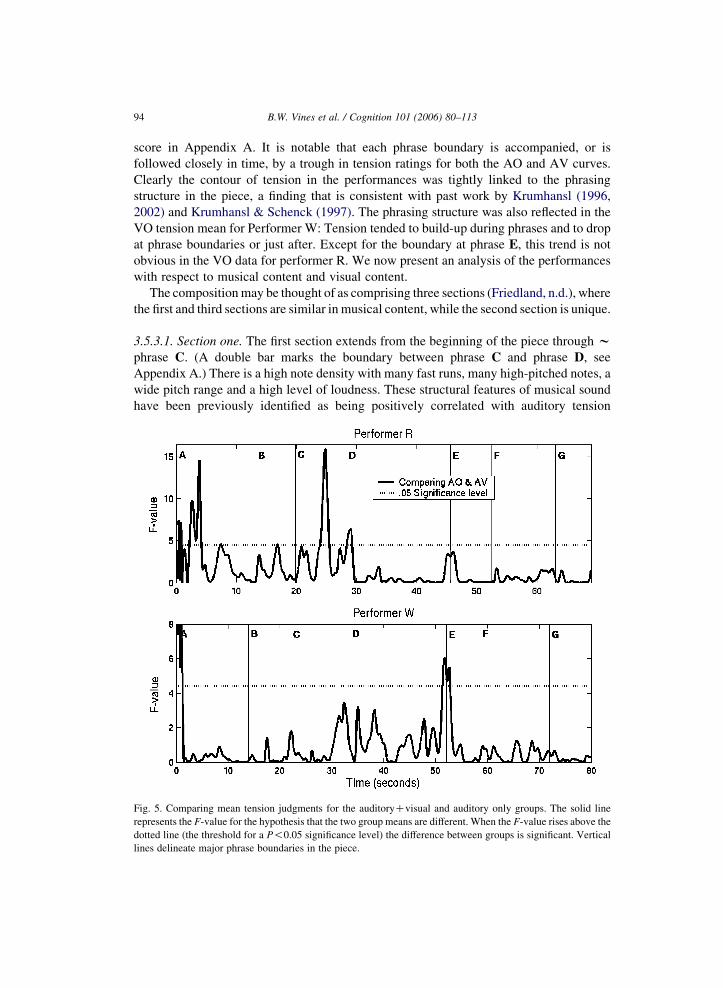
The composition may be thought of as comprising three sections (Friedland, n.d.), where
the first and third sections are similar in musical content, while the second section is unique.
3.5.3.1. Section one. The first section extends from the beginning of the piece through wphrase C. (A double bar marks the boundary between phrase C and phrase D, see
Appendix A.) There is a high note density with many fast runs, many high-pitched notes, a
wide pitch range and a high level of loudness. These structural features of musical sound
have been previously identified as being positively correlated with auditory tension
Fig. 5. Comparing mean tension judgments for the auditoryCvisual and auditory only groups. The solid line
represents the F-value for the hypothesis that the two group means are different. When the F-value rises above the
dotted line (the threshold for a P!0.05 significance level) the difference between groups is significant. Vertical
lines delineate major phrase boundaries in the piece.
B.W. Vines et al. / Cognition 101 (2006) 80–113 95
(Krumhansl, 1996; Nielsen, 1983); the AO and AV tension ratings are accordingly high.
Performer R’s movements were characteristically smooth and controlled while Performer
W’s movements were highly expressive, with elaborate gestures occurring at the end of
note clusters. VO tension was relatively low for Performer R and high for Performer W.
3.5.3.2. Section two. The second section spanned w phrases D and E. (The boundary at
phrase F is marked in the score by a 16th-note rest and a breath mark.) The structural
content of the music differed from section one in several ways: loudness dynamics were
much lower, dropping from moderately loud to very soft. The note density was reduced;
whereas the first section was composed of 16th and 30-s note runs (about nine notes per
second within the runs), the second section was formed mostly with eighth notes (1/2 or
1/4 as many notes per second). The pitch height also decreased from section one to section
two. These structural features of musical sound are negatively correlated with auditory
tension (Krumhansl, 1996; Nielsen, 1983); AO and AV tension ratings were low.
The musicians’ movements did not dampen, but became even more punctuated, rhythmic,
and expressive, especially Performer W’s. The VO tension level remained as high as in
section one.
3.5.4. Section three
The third section extended from w phrase F to the end. Features of musical structure
found in section three are similar to those in section one: Fast runs with a wide pitch range
and high loudness characterized the sound. (Recall that these features are associated with
high tension in sound; the AO and AV tension levels rose accordingly.) The clarinetists’
movements were also very similar to those found in section one: Performer R continued to
move in smooth flowing contours while Performer W moved in bursts with motion arcs
occurring at the end of note clusters. The VO tension level rose slightly for Performer R
and remained at a similar level for Performer W.
It is notable that for both performers the AV mean curve eclipsed the other two curves
in the latter portion of phrase F. This change in relations between sensory modalities was
the only point in the score when the AV curve surpassed the AO and VO curves at the same
time for both performers.
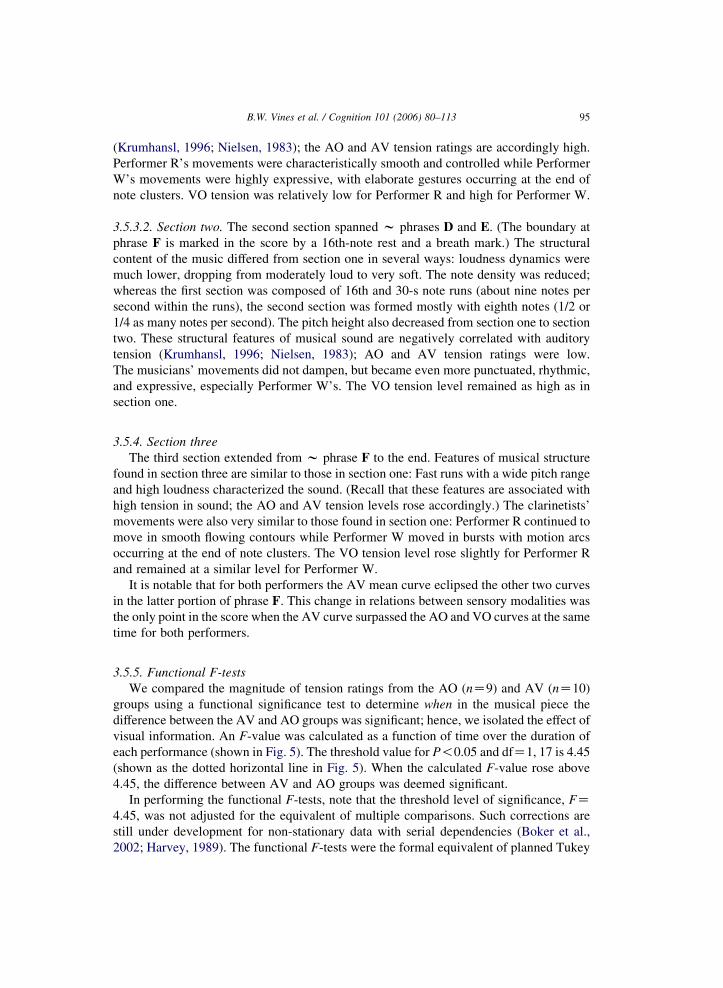
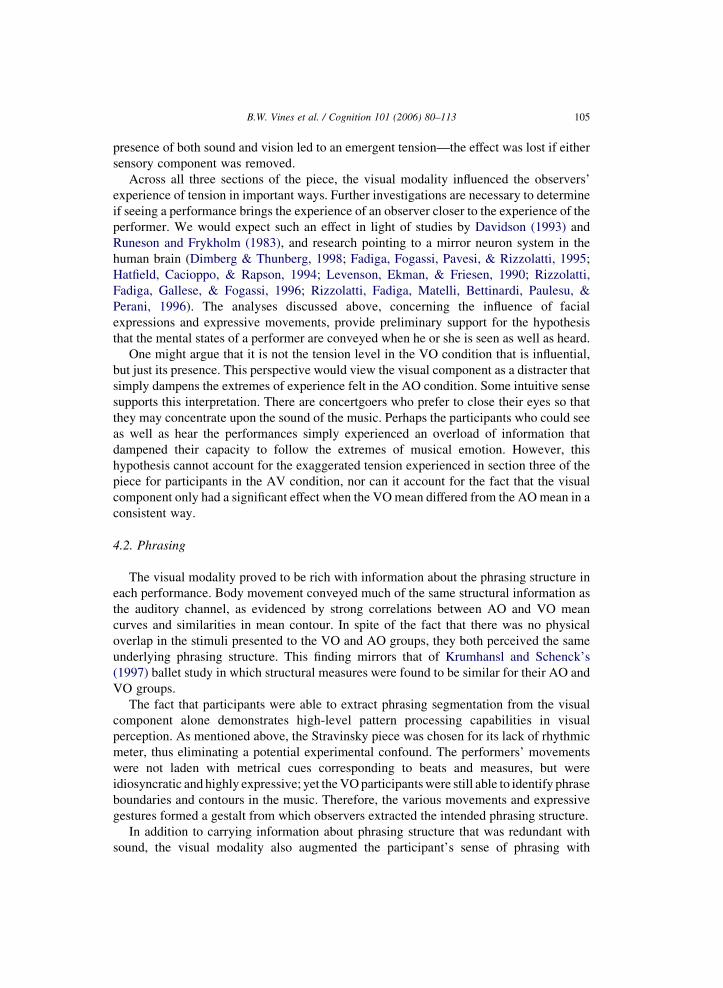
3.5.5. Functional F-tests
We compared the magnitude of tension ratings from the AO (nZ9) and AV (nZ10)
groups using a functional significance test to determine when in the musical piece the
difference between the AV and AO groups was significant; hence, we isolated the effect of
visual information. An F-value was calculated as a function of time over the duration of
each performance (shown in Fig. 5). The threshold value for P!0.05 and dfZ1, 17 is 4.45
(shown as the dotted horizontal line in Fig. 5). When the calculated F-value rose above
4.45, the difference between AV and AO groups was deemed significant.
In performing the functional F-tests, note that the threshold level of significance, FZ4.45, was not adjusted for the equivalent of multiple comparisons. Such corrections are
still under development for non-stationary data with serial dependencies (Boker et al.,
2002; Harvey, 1989). The functional F-tests were the formal equivalent of planned Tukey
B.W. Vines et al. / Cognition 101 (2006) 80–11396
LSD post hoc comparisons for each 100 ms time window, with a significance threshold of
P!0.05.
We analyzed the video footage frame-by-frame for the segments of interest (SOIs)
identified by the functional F-tests. We only analyzed SOIs that occurred after second 4 in
the piece (because of the typical unreliability of responses at the beginning of such
judgments) and those that were longer than 0.5 s in duration (to focus upon the most
important segments). One second of the performance prior to each significant section was
included in the subsequent video analysis. Kuwano & Namba (1985) found that a delay
time of about 1 s was typical for their continuous measurement. Other researchers have
reported lag times of up to 3.25 s (see Schubert, 2001). We chose to include only the
previous second for this analysis because it is likely that the rapidly changing nature of,
and the participants’ pre-exposure to the present stimuli kept lag times to a minimum.
There were two segments of interest in the Performer R data, one spanning seconds
24.0–25.4 and the other spanning seconds 28.4–29.2. A peak of musical intensity was
reached during the first of the two SOIs. There was a fast melodic sequence that culminated
in the highest pitched note in the entire piece of music. The AO group registered a high
magnitude of tension. The AV group mean was also high, but significantly lower than that
of the AO group level (see Figs. 4 and 5, Performer R, w second 25). Performer R’s
movements were relaxed and flowing—accordingly, the VO group registered a low level of
tension. Performer R’s smooth and calm movement contours contradicted the activity in
sound. The effect of adding visual information over this SOI was to dampen the experience
of tension for participants who could both hear and see the music.
The second SOI for Performer R occurred just as section two of the piece began (phrase
D). As described above, section two differed dramatically from section one in that the music
was much more subdued and quiet. The tension judgments decreased in magnitude for both
the AV and the AO groups, but the AV mean decreased earlier than the AO mean, causing a
significant difference between them (see Figs. 4 and 5, Performer R, w second 29). In the
visual stimulus, Performer R’s facial expression and body posture changed in anticipation of
the new section, before the sound actually began. He adopted a lighter expression, in which
his eyebrows were raised, as he took a breath with which to begin the next section. The visual
component cued the change in mood for the AV group in advance of the sound.
There was a single SOI for Performer W that lasted from 51.4 to 52.7 s. In sound, a very
low note, played at the softest loudness dynamic in the entire piece, diminished into
inaudibility. A brief silence followed, and then a series of quiet notes began the next
phrase. Performer W’s movements were active during this segment, as they were
throughout. His body rose with the clarinet through the low note, following a contour that
peaked in height just after the sound could no longer be heard. By then, he was leaning to
his left with his eyebrows raised. He appeared to experience the music intensely.
Performer W’s body and clarinet then followed a descending contour. He coordinated a
breath with the downward motion, and the next series of notes began after a controlled
forward movement, for which a step was taken. The expressive visual activity thus
contradicted the calm and quiet content in sound. AO and AV curves were at their lowest
levels during this SOI, but the tension level for the AV group was significantly higher than
that of the AO group (see Figs. 4 and 5, Performer W, w second 52). The VO
group responded with high ratings of tension (see Fig. 4, Performer W, w second 52).
B.W. Vines et al. / Cognition 101 (2006) 80–113 97
The addition of visual information during this SOI significantly increased the level of
experienced tension.
3.6. Phrasing
The phrasing judgments revealed what points in time participants perceived phrase
boundaries in the music as well as their sense of phrasing contour. The phrasing analyses
we employed focus upon temporal coincidence (or lack thereof) in judgments, as well as
similarities in contour across the presentation conditions.
3.6.1. Outliers and missing data
Missing data for phrasing were dealt with in the same way as missing data for tension.
After removing outliers, 29 participant judgments remained for Performer R (nine VO, 10
AO, and 10 AV) and 29 for Performer W (nine VO, 10 AO, and 10 AV).
A programming error affected data for the first 4 s in some of the judgments. For
Performer R, five judgments were affected (one AO, one AV, and three VO). For
Performer W, seven judgments were affected (four AO, two AV, and one VO). All data
were intact for the remainder of each performance (65 s for Performer R and 76 s for
Performer W). For the functional modeling, the missing data were replaced by an average
of the intact judgments in the same condition. The missing data were simply left out of the
group means used in correlation analyses.
3.6.2. Scaling
The data were scaled from 0 to 1 for each participant’s phrasing response to eliminate
differential use of the slider. The phrasing judgment is a temporally based structural
measure for which the magnitude does not have meaning; hence, scaling eliminated
uninformative information beyond response contour.
3.6.3. Correlation analysis
The scaled judgments were averaged across participants and within presentation
conditions. As with the tension ratings, we used two measures of correlation to assess
relations across perceptual modalities. Spearman correlation values and results from the
parametric correlation with serial dependence removed are shown in Table 2. Correlations
ranged from 0.41 to 0.81. The strongest correlations were between AV and AO curves for
both performers, as they were for the tension judgments. However, the correlations
between AV and VO and between AO and VO were strong as well. The only non-
significant P-value was associated with a parametric comparison between AO and VO
mean curves for Performer R, though the effect size (an averaged r of 0.41) points to a
positive relation between phrasing conveyed by sound and phrasing conveyed through
vision (Cohen, 1990).
3.6.4. Functional modeling of the data
We used 150 B-splines to model the data. The maximum root mean square error
obtained between a participant’s judgment and the corresponding functional model was
kept at less than 9% of the full range of values.
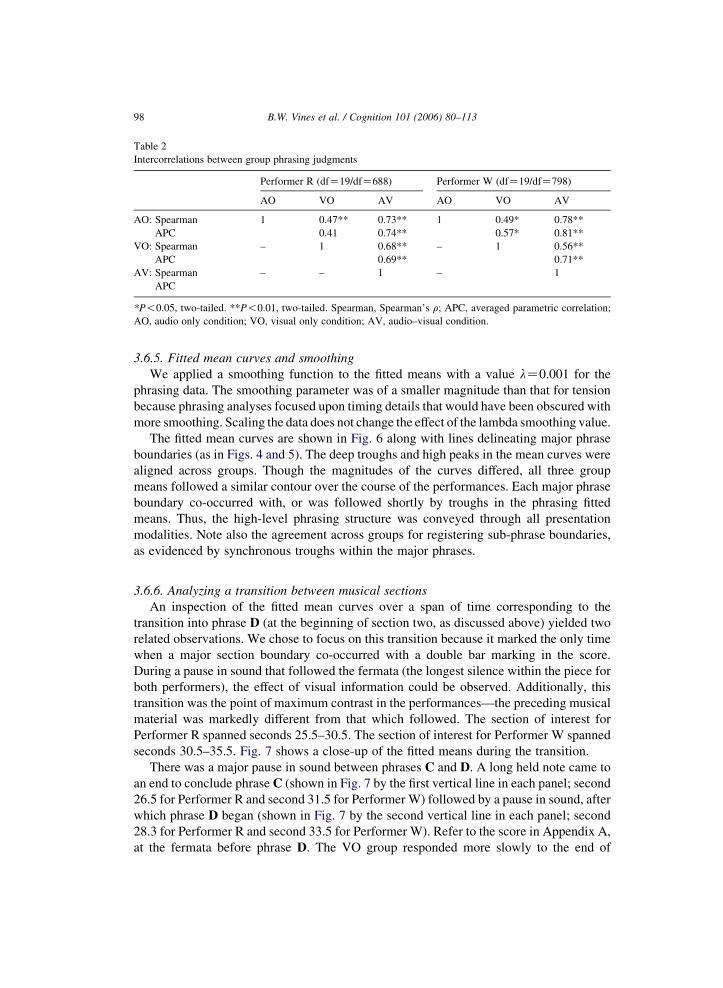
Table 2
Intercorrelations between group phrasing judgments
Performer R (dfZ19/dfZ688) Performer W (dfZ19/dfZ798)
AO VO AV AO VO AV
AO: Spearman
APC
1 0.47** 0.73** 1 0.49* 0.78**
0.41 0.74** 0.57* 0.81**
VO: Spearman
APC
– 1 0.68** – 1 0.56**
0.69** 0.71**
AV: Spearman
APC
– – 1 – 1
*P!0.05, two-tailed. **P!0.01, two-tailed. Spearman, Spearman’s r; APC, averaged parametric correlation;
AO, audio only condition; VO, visual only condition; AV, audio–visual condition.
B.W. Vines et al. / Cognition 101 (2006) 80–11398
3.6.5. Fitted mean curves and smoothing
We applied a smoothing function to the fitted means with a value lZ0.001 for the
phrasing data. The smoothing parameter was of a smaller magnitude than that for tension
because phrasing analyses focused upon timing details that would have been obscured with
more smoothing. Scaling the data does not change the effect of the lambda smoothing value.
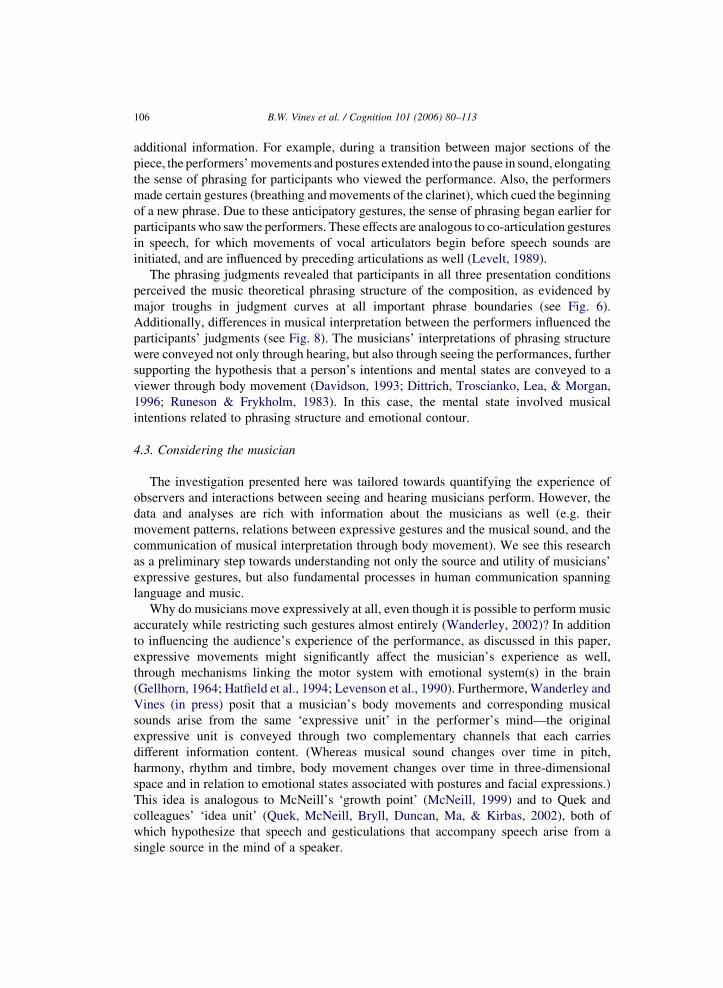
The fitted mean curves are shown in Fig. 6 along with lines delineating major phrase
boundaries (as in Figs. 4 and 5). The deep troughs and high peaks in the mean curves were
aligned across groups. Though the magnitudes of the curves differed, all three group
means followed a similar contour over the course of the performances. Each major phrase
boundary co-occurred with, or was followed shortly by troughs in the phrasing fitted
means. Thus, the high-level phrasing structure was conveyed through all presentation
modalities. Note also the agreement across groups for registering sub-phrase boundaries,
as evidenced by synchronous troughs within the major phrases.
3.6.6. Analyzing a transition between musical sections
An inspection of the fitted mean curves over a span of time corresponding to the
transition into phrase D (at the beginning of section two, as discussed above) yielded two
related observations. We chose to focus on this transition because it marked the only time
when a major section boundary co-occurred with a double bar marking in the score.
During a pause in sound that followed the fermata (the longest silence within the piece for
both performers), the effect of visual information could be observed. Additionally, this
transition was the point of maximum contrast in the performances—the preceding musical
material was markedly different from that which followed. The section of interest for
Performer R spanned seconds 25.5–30.5. The section of interest for Performer W spanned
seconds 30.5–35.5. Fig. 7 shows a close-up of the fitted means during the transition.
There was a major pause in sound between phrases C and D. A long held note came to
an end to conclude phrase C (shown in Fig. 7 by the first vertical line in each panel; second
26.5 for Performer R and second 31.5 for Performer W) followed by a pause in sound, after
which phrase D began (shown in Fig. 7 by the second vertical line in each panel; second
28.3 for Performer R and second 33.5 for Performer W). Refer to the score in Appendix A,
at the fermata before phrase D. The VO group responded more slowly to the end of
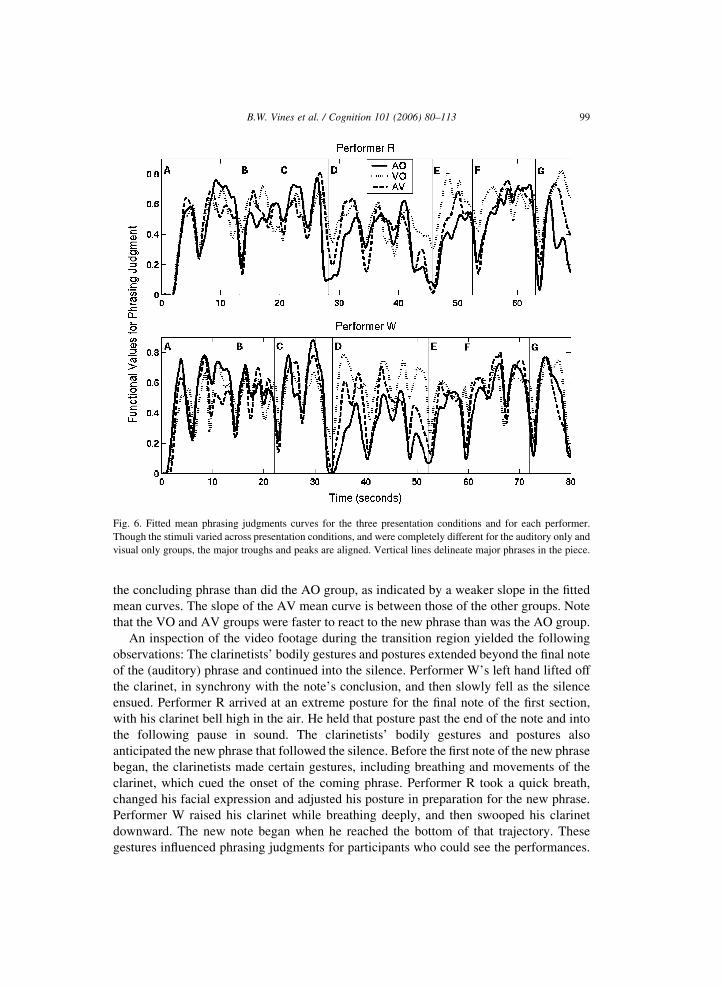
Fig. 6. Fitted mean phrasing judgments curves for the three presentation conditions and for each performer.
Though the stimuli varied across presentation conditions, and were completely different for the auditory only and
visual only groups, the major troughs and peaks are aligned. Vertical lines delineate major phrases in the piece.
B.W. Vines et al. / Cognition 101 (2006) 80–113 99
the concluding phrase than did the AO group, as indicated by a weaker slope in the fitted
mean curves. The slope of the AV mean curve is between those of the other groups. Note
that the VO and AV groups were faster to react to the new phrase than was the AO group.
An inspection of the video footage during the transition region yielded the following
observations: The clarinetists’ bodily gestures and postures extended beyond the final note
of the (auditory) phrase and continued into the silence. Performer W’s left hand lifted off
the clarinet, in synchrony with the note’s conclusion, and then slowly fell as the silence
ensued. Performer R arrived at an extreme posture for the final note of the first section,
with his clarinet bell high in the air. He held that posture past the end of the note and into
the following pause in sound. The clarinetists’ bodily gestures and postures also
anticipated the new phrase that followed the silence. Before the first note of the new phrase
began, the clarinetists made certain gestures, including breathing and movements of the
clarinet, which cued the onset of the coming phrase. Performer R took a quick breath,
changed his facial expression and adjusted his posture in preparation for the new phrase.
Performer W raised his clarinet while breathing deeply, and then swooped his clarinet
downward. The new note began when he reached the bottom of that trajectory. These
gestures influenced phrasing judgments for participants who could see the performances.
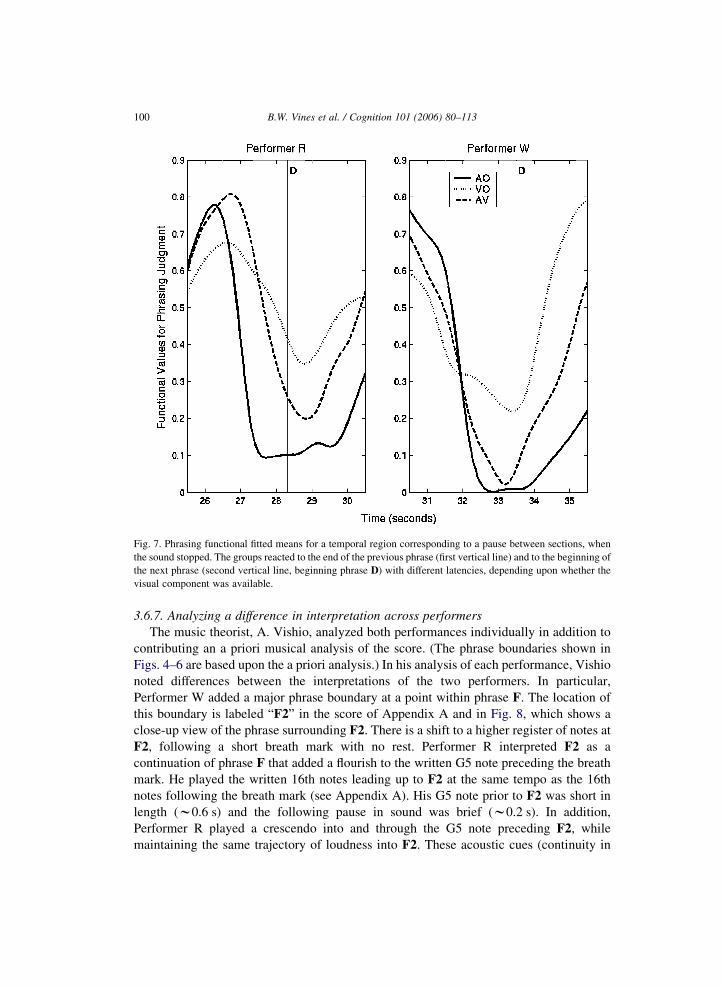
Fig. 7. Phrasing functional fitted means for a temporal region corresponding to a pause between sections, when
the sound stopped. The groups reacted to the end of the previous phrase (first vertical line) and to the beginning of
the next phrase (second vertical line, beginning phrase D) with different latencies, depending upon whether the
visual component was available.
B.W. Vines et al. / Cognition 101 (2006) 80–113100
3.6.7. Analyzing a difference in interpretation across performers
The music theorist, A. Vishio, analyzed both performances individually in addition to
contributing an a priori musical analysis of the score. (The phrase boundaries shown in
Figs. 4–6 are based upon the a priori analysis.) In his analysis of each performance, Vishio
noted differences between the interpretations of the two performers. In particular,
Performer W added a major phrase boundary at a point within phrase F. The location of
this boundary is labeled “F2” in the score of Appendix A and in Fig. 8, which shows a
close-up view of the phrase surrounding F2. There is a shift to a higher register of notes at
F2, following a short breath mark with no rest. Performer R interpreted F2 as a
continuation of phrase F that added a flourish to the written G5 note preceding the breath
mark. He played the written 16th notes leading up to F2 at the same tempo as the 16th
notes following the breath mark (see Appendix A). His G5 note prior to F2 was short in
length (w0.6 s) and the following pause in sound was brief (w0.2 s). In addition,
Performer R played a crescendo into and through the G5 note preceding F2, while
maintaining the same trajectory of loudness into F2. These acoustic cues (continuity in
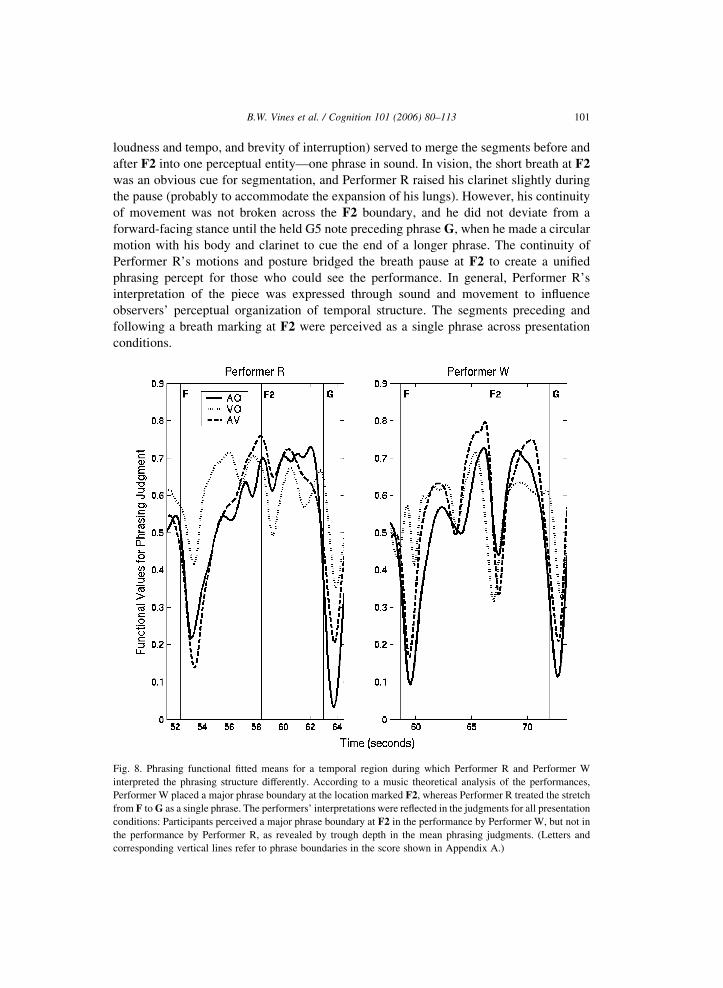
B.W. Vines et al. / Cognition 101 (2006) 80–113 101
loudness and tempo, and brevity of interruption) served to merge the segments before and
after F2 into one perceptual entity—one phrase in sound. In vision, the short breath at F2
was an obvious cue for segmentation, and Performer R raised his clarinet slightly during
the pause (probably to accommodate the expansion of his lungs). However, his continuity
of movement was not broken across the F2 boundary, and he did not deviate from a
forward-facing stance until the held G5 note preceding phrase G, when he made a circular
motion with his body and clarinet to cue the end of a longer phrase. The continuity of
Performer R’s motions and posture bridged the breath pause at F2 to create a unified
phrasing percept for those who could see the performance. In general, Performer R’s
interpretation of the piece was expressed through sound and movement to influence
observers’ perceptual organization of temporal structure. The segments preceding and
following a breath marking at F2 were perceived as a single phrase across presentation
conditions.
Fig. 8. Phrasing functional fitted means for a temporal region during which Performer R and Performer W
interpreted the phrasing structure differently. According to a music theoretical analysis of the performances,
Performer W placed a major phrase boundary at the location marked F2, whereas Performer R treated the stretch
from F to G as a single phrase. The performers’ interpretations were reflected in the judgments for all presentation
conditions: Participants perceived a major phrase boundary at F2 in the performance by Performer W, but not in
the performance by Performer R, as revealed by trough depth in the mean phrasing judgments. (Letters and
corresponding vertical lines refer to phrase boundaries in the score shown in Appendix A.)
B.W. Vines et al. / Cognition 101 (2006) 80–113102
In contrast to Performer R, Performer W interpreted F2 as a new phrase that lead into
phrase G. His timing on the 16th note run just before F2 fluctuated and the tempo taken
after the breath mark did not clearly match that of the previous segment. The held G5
note prior to F2 was comparatively lengthy (1.3 s), as was the pause for breath (0.3 s).
Performer W’s loudness dynamics did not carry a common trajectory before and after the
F2 division. Performer W’s approach in sound lead to the perception of two distinct
psychological units, separated by the breath boundary at F2. Performer W’s movements
also conveyed a clear boundary at F2, as evidenced by a low trough in the VO group
mean at that point. He deviated from a forward-facing posture during the G5 note
preceding F2, moving his clarinet and body in a circular motion; he made a similar
motion during the G5 note preceding phrase G. The changes in posture at each G5 note
acted as strong perceptual cues for separating the preceding and following segments. The
difference in the performers’ interpretations was clearly reflected in the phrasing
judgments.
The judgment curves corresponding to Performer R do not show a salient trough at F2,
only a subtle sub-phrase boundary (see Fig. 8). (Note that the strongest dip is in the VO
mean-curve. The short breath might have played a more important role for the VO group in
determining phrase duration than it did for the AO and AV groups.) The judgments made
in response to Performer W show a strong phrase boundary at F2. This contrast between
performers exemplifies the sensitivity of the continuous phrasing judgment to variations in
musical interpretation, and it also shows that performers’ idiosyncratic phrasing intentions
are conveyed through both sound and body movement.
4. Discussion
The present study of musical performance contributes to a larger context of studies of
the cognitive dynamics of multi-sensory integration. Relations between auditory and
visual modalities differed markedly for the two aspects of experience explored here:
tension and phrasing. The visual modality conveyed tension information that was largely
independent from sound, though there were some convergent segments when visual and
auditory information matched. In contrast, the sense of phrasing conveyed by vision and
sound was remarkably similar. The information relevant to each task may account for the
different relations between modalities for tension and for phrasing.
The tension judgment drew participants’ attention to emotional experience.
Emotions in music are dependent upon a variety of perceptual attributes in sound,
including pitch, tempo, mode, harmony and loudness, all of which involve interactions
between high- and low-level auditory cognitive processes (Balkwill & Thompson,
1999; Gagnon & Peretz, 2003). There is a high density of emotional and tension-
related information in the Stravinsky score. Whether or not body movements can
convey the complexity of emotion that is available in musical sound is a matter of
current interest. Krumhansl & Schenck (1997), for example, found evidence that
choreographed dance conveyed much of the same emotional content as the
accompanying musical piece. What aspects of visual experience elicit an emotional
response such as tension?
B.W. Vines et al. / Cognition 101 (2006) 80–113 103
Dance theorists have hypothesized that visual tension is induced by the initiation of
movement, force, weight, and rate of movement (Frego, 1999), as well as the interaction
between different forces, including those generated by the body and by the force of gravity
(Sheets, 1966). Dancers perform with freedom of movement in three-dimensions; their
hands, legs, torso and head can move in a great variety of expressive patterns. Musicians,
on the other hand, can only move expressively within the constraints of the instrument they
are playing.
Each musical instrument requires a specific coupling between the performer and that
instrument; the coupling must be maintained in order to produce quality sound and
accurate music. The expressive movements of musicians certainly convey emotive
qualities, as evidenced by the dynamic VO judgments in the present experiment. However,
limitations on movement might prevent a perfect correspondence between emotion
conveyed visually and emotion conveyed through sound. For example, the clarinet limits
facial expression, an important interface for emotional communication between
individuals (Ekman, 1992; Planalp et al., 1996). Additionally, the mapping between
movement and sound differs from instrument to instrument. A trombonist, for example,
slides the right hand up towards the body to increase pitch, whereas an upright bass player
slides the right hand down away from the body to increase pitch. Furthermore, computer-
based instruments can use mappings between sound and body movement that are
completely arbitrary (Levitin, et al., 2002; Smalley, 1997.) Considering these constraints,
it is not surprising that the contour of emotional experience found in sound was not
completely correlated with that in vision. From another perspective, performers may often
use gestures and facial expressions to convey emotions that are not present in the sound,
the obvious case being when a performer moves her hands in preparation for touching the
instrument and making a sound. Experiments involving instruments for which there are
fewer (or different) restrictions upon movement and facial expression (e.g. piano, voice)
will be instructive. In addition to the instrument being played, the genre of music being
performed also influences expressive movement. For example, a Dixieland clarinet player
will likely have a different movement vocabulary compared to a Western classical
clarinetist. We view the present work as an initial step towards understanding the impact of
seeing a musician perform.
The phrasing judgment focused participants’ attention on their perception of structural
form in musical performance. There is an inherent temporal correspondence between
events in a musician’s sound and in body movement; some change in body state
accompanies every change in sound. For example, fast finger (and/or lip and tongue)
movements accompany fast runs with high note density—when the sound stops changing
rapidly, the musician’s articulators also cease to move rapidly. The contour of body
movements over time may also correlate with phrasing contour. The clarinetists who
performed for the present study rarely mimicked melodic contour with their movements,
but their motion sequences often extended over approximately the same duration as the
concurrent musical phrase. The correspondence between body motion and sound, as well
as the temporal nature of the judgment, may explain why a similar phrasing contour was
identified across presentation conditions.
We present a discussion of the tension and phrasing results below.
B.W. Vines et al. / Cognition 101 (2006) 80–113104
4.1. Tension
Sound played the dominant role in determining the contour and trajectory of emotional
experience for those who could both hear and see the performances. This finding is
consistent with Krumhansl and Schenck’s (1997) ballet study. However, in contrast to that
study, we found that vision and audition elicited dissimilar experiences of tension for the
most part. (The segments for which AO and VO mean curves did follow a similar contour
suggest that the visual channel and the auditory channel can convey some of the same
affective information, at least over short durations of time.) Additionally, the VO mean for
Performer W was aligned with the high-level phrasing structure, as were the AO and AV
means for both performers. If the visual information is partially redundant with the
auditory information, it may serve to support, modify, presage or confirm content in sound.
The tension data revealed effects of inter-performer variation in movement style. The
tension level conveyed visually differed markedly across clarinetists, with higher and
more dynamic VO ratings for Performer W. Therefore, different manners of movement
elicit different tension ratings, and more expressive gestures and variations in posture will
tend to generate higher levels of tension for observers.
Though sound dominated the emotional (or tension) contour of experience for those
who could both hear and see the performances, visual information did affect the overall
magnitude of tension experienced. The fitted mean curves revealed stretches of time in the
performances during which the AV mean consistently deviated from the AO mean; there
were periods during these stretches of time when the curves differed significantly in
magnitude, as determined by functional F-tests. These segments of interest (SOIs)
occurred when the tension conveyed in sound contrasted with the tension conveyed
visually. For example, seeing Performer R’s smooth and controlled body movements
served to dampen the tension experienced when the sound contained loud, high pitched
and fast moving melodic lines. Conversely, visual information served to increase
experienced tension when Performer W’s punctuated and highly expressive movements
contrasted with the subdued and quiet sound. These SOIs exemplify naturally occurring
discrepancies in emotional content conveyed through vision and sound. In response to the
independent sensory streams, participants did not ignore one or the other modality, but
integrated the two into an amalgamation influenced by both sight and sound. These
findings show that the emotion conveyed visually does indeed contribute to the overall
experience, and that sound and vision interact in an observer’s experience.
The visual aspect sometimes presaged a change in emotion before it was conveyed by
sound. Adjustments to Performer R’s facial expression and body posture cued an
emotional change in the performance prior to a new musical section. These anticipatory
cues modified affective experience for AV group members, who registered a decrease in
tension before the AO group did. Thus, the visual information was found to add to the
overall affective experience by cueing a change in mood.
Relations between sensory modalities towards the end of the piece suggest that an
interaction effect occurred when the visual and auditory modalities were present. For both
performers, the AV mean eclipsed both the AO and VO mean curves in magnitude, just as
pitch height, loudness level and note density grew to high levels. This suggests that the
B.W. Vines et al. / Cognition 101 (2006) 80–113 105
presence of both sound and vision led to an emergent tension—the effect was lost if either
sensory component was removed.
Across all three sections of the piece, the visual modality influenced the observers’
experience of tension in important ways. Further investigations are necessary to determine
if seeing a performance brings the experience of an observer closer to the experience of the
performer. We would expect such an effect in light of studies by Davidson (1993) and
Runeson and Frykholm (1983), and research pointing to a mirror neuron system in the
human brain (Dimberg & Thunberg, 1998; Fadiga, Fogassi, Pavesi, & Rizzolatti, 1995;
Hatfield, Cacioppo, & Rapson, 1994; Levenson, Ekman, & Friesen, 1990; Rizzolatti,
Fadiga, Gallese, & Fogassi, 1996; Rizzolatti, Fadiga, Matelli, Bettinardi, Paulesu, &
Perani, 1996). The analyses discussed above, concerning the influence of facial
expressions and expressive movements, provide preliminary support for the hypothesis
that the mental states of a performer are conveyed when he or she is seen as well as heard.
One might argue that it is not the tension level in the VO condition that is influential,
but just its presence. This perspective would view the visual component as a distracter that
simply dampens the extremes of experience felt in the AO condition. Some intuitive sense
supports this interpretation. There are concertgoers who prefer to close their eyes so that
they may concentrate upon the sound of the music. Perhaps the participants who could see
as well as hear the performances simply experienced an overload of information that
dampened their capacity to follow the extremes of musical emotion. However, this
hypothesis cannot account for the exaggerated tension experienced in section three of the
piece for participants in the AV condition, nor can it account for the fact that the visual
component only had a significant effect when the VO mean differed from the AO mean in a
consistent way.
4.2. Phrasing
The visual modality proved to be rich with information about the phrasing structure in
each performance. Body movement conveyed much of the same structural information as
the auditory channel, as evidenced by strong correlations between AO and VO mean
curves and similarities in mean contour. In spite of the fact that there was no physical
overlap in the stimuli presented to the VO and AO groups, they both perceived the same
underlying phrasing structure. This finding mirrors that of Krumhansl and Schenck’s
(1997) ballet study in which structural measures were found to be similar for their AO and
VO groups.
The fact that participants were able to extract phrasing segmentation from the visual
component alone demonstrates high-level pattern processing capabilities in visual
perception. As mentioned above, the Stravinsky piece was chosen for its lack of rhythmic
meter, thus eliminating a potential experimental confound. The performers’ movements
were not laden with metrical cues corresponding to beats and measures, but were
idiosyncratic and highly expressive; yet the VO participants were still able to identify phrase
boundaries and contours in the music. Therefore, the various movements and expressive
gestures formed a gestalt from which observers extracted the intended phrasing structure.
In addition to carrying information about phrasing structure that was redundant with
sound, the visual modality also augmented the participant’s sense of phrasing with
B.W. Vines et al. / Cognition 101 (2006) 80–113106
additional information. For example, during a transition between major sections of the
piece, the performers’ movements and postures extended into the pause in sound, elongating
the sense of phrasing for participants who viewed the performance. Also, the performers
made certain gestures (breathing and movements of the clarinet), which cued the beginning
of a new phrase. Due to these anticipatory gestures, the sense of phrasing began earlier for
participants who saw the performers. These effects are analogous to co-articulation gestures
in speech, for which movements of vocal articulators begin before speech sounds are
initiated, and are influenced by preceding articulations as well (Levelt, 1989).
The phrasing judgments revealed that participants in all three presentation conditions
perceived the music theoretical phrasing structure of the composition, as evidenced by
major troughs in judgment curves at all important phrase boundaries (see Fig. 6).
Additionally, differences in musical interpretation between the performers influenced the
participants’ judgments (see Fig. 8). The musicians’ interpretations of phrasing structure
were conveyed not only through hearing, but also through seeing the performances, further
supporting the hypothesis that a person’s intentions and mental states are conveyed to a
viewer through body movement (Davidson, 1993; Dittrich, Troscianko, Lea, & Morgan,
1996; Runeson & Frykholm, 1983). In this case, the mental state involved musical
intentions related to phrasing structure and emotional contour.
4.3. Considering the musician
The investigation presented here was tailored towards quantifying the experience of
observers and interactions between seeing and hearing musicians perform. However, the
data and analyses are rich with information about the musicians as well (e.g. their
movement patterns, relations between expressive gestures and the musical sound, and the
communication of musical interpretation through body movement). We see this research
as a preliminary step towards understanding not only the source and utility of musicians’
expressive gestures, but also fundamental processes in human communication spanning
language and music.
Why do musicians move expressively at all, even though it is possible to perform music
accurately while restricting such gestures almost entirely (Wanderley, 2002)? In addition
to influencing the audience’s experience of the performance, as discussed in this paper,
expressive movements might significantly affect the musician’s experience as well,
through mechanisms linking the motor system with emotional system(s) in the brain
(Gellhorn, 1964; Hatfield et al., 1994; Levenson et al., 1990). Furthermore, Wanderley and
Vines (in press) posit that a musician’s body movements and corresponding musical
sounds arise from the same ‘expressive unit’ in the performer’s mind—the original
expressive unit is conveyed through two complementary channels that each carries
different information content. (Whereas musical sound changes over time in pitch,
harmony, rhythm and timbre, body movement changes over time in three-dimensional
space and in relation to emotional states associated with postures and facial expressions.)
This idea is analogous to McNeill’s ‘growth point’ (McNeill, 1999) and to Quek and
colleagues’ ‘idea unit’ (Quek, McNeill, Bryll, Duncan, Ma, & Kirbas, 2002), both of
which hypothesize that speech and gesticulations that accompany speech arise from a
single source in the mind of a speaker.
B.W. Vines et al. / Cognition 101 (2006) 80–113 107
The study of musicians’ gestures and the perception of musical performances opens the
way to a more complete understanding of the human communicative process, in terms of
the sender, the receiver, and multiple modalities of information transfer.
5. Conclusion
This paper explored the ways in which visual and auditory information, separately and
together, convey emotion (as indexed by tension) and structure (as indexed by phrasing).
Consistent with findings in the domain of speech communication, we found evidence for
independence of information transmitted through the visual and auditory domains, with a
certain degree of redundancy. As in the case of speech, in which the visual movements of
lips are constrained by the phonemes being uttered, musicians’ movements are to some
extent constrained by the particular notes being played. Nevertheless, musical-equivalents
of paralinguistic gestures (such as head movements, eyebrow raising, and postural
adjustments) convey a significant amount of information that reinforces, anticipates, or
augments the auditory signal. At times, the experience of tension and phrasing for
participants who both saw and heard the performances was enhanced compared to
judgments made by participants receiving information from only one sensory modality. At
other times, the addition of visual information served to dampen the intensity of emotional
response—seeing the musician may have revealed complexities in the emotional character
of the music, leading to a more comprehensive interpretation of the piece or to greater
aesthetic satisfaction.
We observed a substantial influence of high-level cognitive processes on interactions
between auditory and visual modalities. The cognitive set established by task instructions
determined how input from vision and audition would combine to form the overall
experience. Cognitive set appears to modulate a gating mechanism controlling the
influence of each modality. A bias towards the auditory channel was evident for the
tension judgment, for example. One can imagine a task that would bias visual input: a
continuous judgment of “amount of movement,” for which visual stimulation might play
the strongest role in the overall percept. Each sensory modality’s contribution to a
participant’s experience thus depended upon the experimental task. For the continuous
tension judgment (indexing emotion), the auditory component consistently dominated,
although visual information did take precedence at key points in the musical score. In
contrast, auditory and visual modalities contributed more equally to the experience of
phrasing.
The present study adds to knowledge of multi-sensory integration for conflicting input
from vision and audition. Research into speech and ventriloquism effects has investigated
perceptual conflict extensively (Bertelson, 1999; Massaro, 1987, 1998; McGurk &
MacDonald, 1976), often using short, artificially created stimuli to induce varying levels
of incongruity between seeing and hearing. The investigation presented here compliments
these past efforts by capitalizing upon naturally occurring incongruities in a lengthy
perceptual context: musical performance. In accordance with previous research, we found
that a contrast between sound and sight usually caused an emergent cognition that was
some amalgamation of the information in the two senses. Thus, the perceptual processes
B.W. Vines et al. / Cognition 101 (2006) 80–113108
involved in short, artificially generated incongruities are active under ecologically valid
circumstances as well. A contribution of the present work was to quantify the nature of
sensory integration by showing when auditory information takes precedence over vision,
and vice-versa. This forms a step towards understanding those underlying stimulus factors
that lead to the dominance of a sensory modality. Notable in the present experiment, for
example, were moments near phrase boundaries when musicians’ visual gestures provided
cues as to what would next occur.
The continuous tension judgment indexed real-time emotional experience in response
to clarinet performances, and the continuous phrasing judgment revealed the perceptual
organization of musical structure over time. The visual and auditory channels tended to
convey independent streams of emotional information, but much of the same structural
information. The movements of musicians were found to be important for cueing phrase
beginnings and endings, for augmenting or dampening musical affect, and for anticipating
changes in emotional or structural content. Both phrasing and tension judgments
corresponded well to music–theoretical interpretations of the musical structure, thus
validating the judgments and demonstrating a sensitivity to musical form across perceptual
modalities. Finally, interaction effects strongly suggest that the auditory and visual
channels mutually enhance one another to convey content, and that an emergent quality
exists when a musician is both seen and heard.
Musical performance, like speech and dance, involves a multi-sensory experience in
which sound and visual stimulation interact over time. The mental processes underlying
such cross-modal interactions are of central importance to our understanding of the
relations between senses, perceptual organization, and ultimately the ways in which
mental representations of the world are formed out of (often contradictory and ambiguous)
sensory input. The present investigation showed that the body movements of musicians
influence the cognitions of observers in ways that can be quantified, opening the doors to
further investigations of real-time multi-modal perception.
This article was submitted in partial fulfillment of the requirements for the PhD in
Experimental Psychology from McGill University by the first author.
Acknowledgements
The authors are grateful to the anonymous reviewers for helpful comments on earlier
drafts of this manuscript. We would also like to thank the following for providing helpful
feedback in response to our ideas: Albert Bregman, Michael Brook, Robert Gjerdingen,
Mark Goldstein, Catherine Guastavino, Ervin Hafter, Regina Nuzzo, David Ostry, Richard
Parncutt, Jim Ramsay, Mari Riess Jones, Jean-Claude Risset, Brian Roberts, Malcolm
Slaney, David Wessel, and Robert Zatorre. We greatly appreciate the theoretical analyses
of phrasing structure that Anton Vishio contributed. Thanks also go to the performers who
were instrumental in the stimulus generation. The following research assistants in the
Levitin Laboratory were of great help for the data collection and video analysis: Eve-
Marie Quintin, Nora Hussein, Hadiya Nedd-Roderique, and Sawsan M’Birkou. This work
was supported by a grant from NSERC (Natural Science and Engineering Research
Council of Canada) and from SSHRC (Social Sciences and Humanities Research Council
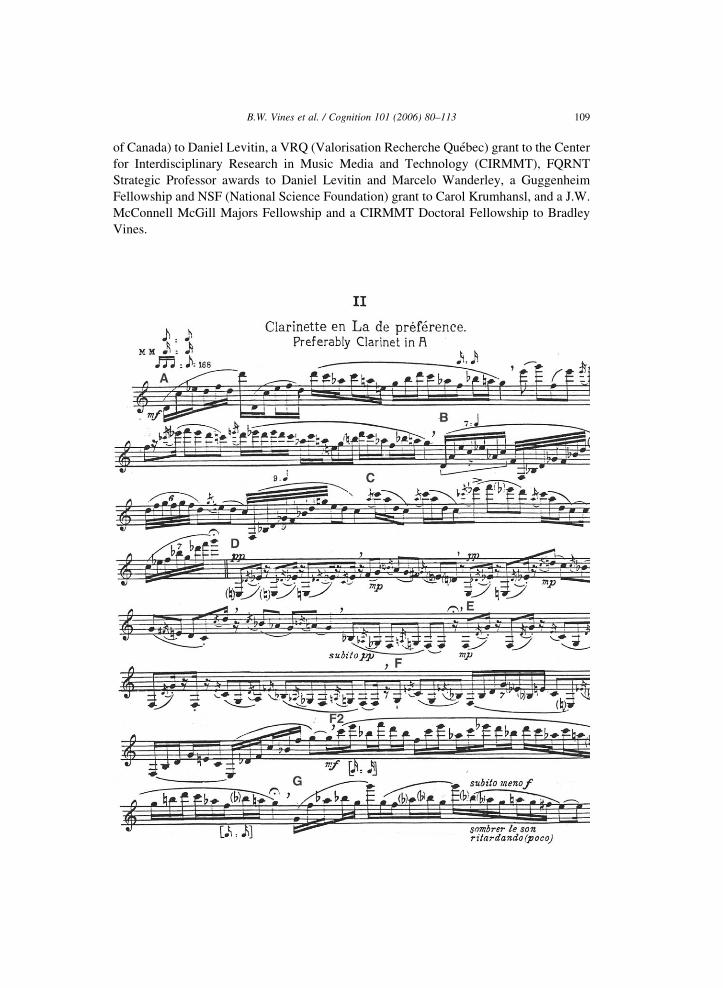
B.W. Vines et al. / Cognition 101 (2006) 80–113 109
of Canada) to Daniel Levitin, a VRQ (Valorisation Recherche Quebec) grant to the Center
for Interdisciplinary Research in Music Media and Technology (CIRMMT), FQRNT
Strategic Professor awards to Daniel Levitin and Marcelo Wanderley, a Guggenheim
Fellowship and NSF (National Science Foundation) grant to Carol Krumhansl, and a J.W.
McConnell McGill Majors Fellowship and a CIRMMT Doctoral Fellowship to Bradley
Vines.
B.W. Vines et al. / Cognition 101 (2006) 80–113110
Appendix A
THREE PIECES FOR CLARINET SOLO, SECOND PIECE
By Igor Stravinsky
Copyrightq1920 for all countries
Revised edition Copyrightq1993 Chester Music Limited, 8/9 Frith Street, London
W1D 3JB, England
All Rights Reserved. International Copyright Secured.
References
Adams, R. D. (1977). Intervening stimulus effects on category judgments of duration. Perception and
Psychophysics, 21(6), 527–534.
Aiello, R. (1994). Music and language: Parallels and contrasts. In R. Aiello, & J. Sloboda (Eds.), Music
perceptions (pp. 40–63). New York: Oxford University Press.
Aston, E., & Savona, G. (1992). Theatre as sign-system: A semiotics of text and performance. London: Routledge.
Baily, J. (1985). Music structure and human movement. In P. Howell, I. Cross, & R. West (Eds.), Musical
structure and cognition: New readings in the experimental psychology of music (pp. 237–258). London:
Academic Press.
Balkwill, L., & Thompson, W. F. (1999). A cross-cultural investigation of the perception of emotion in music:
Psychophysical and cultural cues. Music Perception, 17, 43–64.
Baron-Cohen, S., & Harrison, J. E. (Eds.). (1996). Synaesthesia: Classic and contemporary readings. Oxford:
Blackwell.
Bigand, E., & Parncutt, R. (1999). Perceiving musical tension in long chord sequences. Psychological Research,
62, 237–254.
Boker, S. M., Xu, M., Rotondo, J. L., & King, K. (2002). Windowed cross-correlation and peak picking for the
analysis of variability in the association of between behavioral time series. Psychological Methods, 7(3),
338–355.
Boone, R. T., & Cunningham, J. G. (2001). Children’s expression of emotional meaning in music through
expressive body movement. Journal of Nonverbal Behavior, 25(1), 21–41.
Boring, E. (1923). A history of experimental psychology. New York: Pendragon.
Chester Music Limited. (1993). Three pieces for Clarinet Solo, by Igor Stravinsky. London, England.
Clarke, E. F., & Krumhansl, C. L. (1990). Perceiving musical time. Music Perception, 7, 213–252.
Cohen, J. (1990). Things I have learned (so far). American Psychologist, 45(12), 1304–1312.
Cooper, G. W., & Meyer, L. B. (1960). The rhythmic structure of music. Chicago, IL: University of Chicago
Press.
Cooper, W. E., & Paccia-Cooper, J. (1980). Syntax and speech. Cambridge, MA: Harvard University Press.
Cytowic, R. E. (2002). Synaesthesia: A union of the senses (2nd ed.). Cambridge, MA: MIT Press.
Davidson, J. (1993). Visual perception of performance manner in the movements of solo musicians. Psychology
of Music, 21, 103–113.
Davidson, R. J., Ekman, P., Saron, C., Senulis, J., & Friesen, W. V. (1990). Emotional expression and brain
physiology I: Approach/withdrawal and cerebral asymmetry. Journal of Personality and Social Psychology,
58, 330–341.
Delalande, F. (1988). La gestique de Gould; elements pour une semiologie du geste musical. In G. Guertin (Ed.),
Glenn Gould Pluriel (pp. 83–111). Montreal: Louise Courteau Editrice Inc..
Deliege, I., & El Ahmade, A. (1990). Mechanisms of cue extraction in musical groupings: A study of perception
on Sequenza VI for viola solo by Luciano Berio. Psychology of Music, 18, 18–44.
B.W. Vines et al. / Cognition 101 (2006) 80–113 111
Dimberg, U., & Thunberg, M. (1998). Rapid facial reactions to emotional facial expressions. Scandinavian
Journal of Psychology, 39(1), 39–45.
Dittrich, W. H., Troscianko, T., Lea, S. E. G., & Morgan, D. (1996). Perception of emotion from dynamic point-
light displays represented in dance. Perception, 25, 727–738.
Dixon, N. F., & Spitz, L. (1980). The detection of auditory visual desynchrony. Perception, 9, 719–721.
Ekman, P. (1992). An argument for basic emotions. Cognition and Emotion, 6, 169–200.
Exner, S. (1875). Uber das Sehen von Bewegungen und die Theorie des zusammengesetzten Auges [on the
perception of movement and the theory of the integrative eye]. Sizungsberichte Akademie Wissenschaft Wien,
72, 156–190.
Fadiga, L., Fogassi, L., Pavesi, G., & Rizzolatti, G. (1995). Motor facilitation during action observation: A
magnetic stimulation study. Journal of Neurophysiology, 73, 2608–2611.
Fodor, J. A., & Bever, T. G. (1965). The psychological reality of linguistic segments. Journal of Verbal Learning
and Verbal Behavior, 4, 414–420.
Fredrickson, W. E. (1995). A comparison of perceived musical tension and aesthetic response. Psychology of
Music, 23, 81–87.
Fredrickson, W. E. (1997). Elementary, middle, and high school student perceptions of tension in music. Journal
of Research in Music Education, 45(4), 626–635.
Fredrickson, W. E. (1999). Effect of musical performance on perception of tension in Gustav Holst’s First Suite in
E-flat. Journal of Research in Music Education, 47(1), 44–52.
Fredrickson, W. E. (2000). Perception of tension in music: Musicians versus nonmusicians. Journal of Music
Therapy, 37(1), 40–50.
Frego, D. R. J. (1999). Effects of aural and visual conditions on response to perceived artistic tension in music and
dance. Journal of Research in Music Education, 47(1), 31–43.
Friedland, S. (n.d.). Stravinsky’s three pieces for clarinet solo. Retrieved June 20, 2002, from http://clarinet.cc/
Repertoire003.html.
Gagnon, L., & Peretz, I. (2003). Mode and tempo relative contributions to ‘happy–sad’ judgments in equitone
melodies. Cognition and Emotion, 17(1), 25–40.
Galbraith, G. C., Chae, B. C., Cooper, J. R., Gindi, M. M., Ho, T. N., Kim, B. S., et al. (2000). Brainstem
frequency-following response and simple motor reaction time. International Journal of Psychophysiology,
36, 35–44.
Gellhorn, E. (1964). Motion and emotion: The role of proprioception in the physiology and pathology of
emotions. Psychological Review, 71, 457–572.
Gregory, A. H. (1978). Perception of clicks in music. Perception and Psychophysics, 24, 171–174.
Grossenbacher, P. G., & Lovelace, C. T. (2001). Mechanisms of synaesthesia: Cognitive and physiological
constraints. Trends in Cognitive Sciences, 5, 36–41.
Harvey, A. C. (1989). Forecasting, structural time series models and the Kalman filter. New York: Cambridge
University Press.
Hatfield, E., Cacioppo, J. T., & Rapson, R. L. (1994). Emotional contagion. New York: Cambridge University
Press.
Imberty, M. (1981). Les Ecritures du Temps. Paris: Dunod.
Johansson, G. (1973). Visual perception of biological motion and a model for its analysis. Perception and
Psychophysics, 14, 201–211.
Krumhansl, C. L. (1996). A perceptual analysis of Mozart’s Piano Sonata K. 282: Segmentation, tension, and
musical ideas. Music Perception, 13(3), 401–432.
Krumhansl, C. L. (1997). An exploratory study of musical emotions and psychophysiology. Canadian Journal of
Experimental Psychology, 51(4), 336–352.
Krumhansl, C. L. (2002). Music: A link between cognition and emotion. Current Directions in Psychological
Science, 11(2), 45–50.
Krumhansl, C. L., & Schenck, D. L. (1997). Can dance reflect the structural and expressive qualities of music? A
perceptual experiment on Balanchine’s choreography of Mozart’s Divertimento no. 15. Musicae Scientiae,
1(Spring), 63–85.
Kuwano, S., & Namba, S. (1985). Continuous judgment of level-fluctuating sounds and the relationship between
overall loudness and instantaneous loudness. Psychological Research, 42, 27–37.

B.W. Vines et al. / Cognition 101 (2006) 80–113112
Lerdahl, F. (2001). Tonal pitch space. Oxford: Oxford University Press.
Lerdahl, F., & Jackendoff, R. (1983). A generative theory of tonal music. Cambridge, MA: MIT Press.
Levelt, W. J. M. (1989). Speaking: From intention to articulation. Cambridge, MA: MIT Press.
Levenson, R. W., Ekman, R., & Friesen, W. V. (1990). Voluntary facial action generates emotion-specific
autonomic nervous system activity. Psychophysiology, 20(4), 363–384.
Levitin, D. J., MacLean, K., Mathews, M. V., Chu, L. Y., & Jensen, E. R. (2000). The perception of cross-modal
simultaneity. International Journal of Computing and Anticipatory Systems, 5, 323–329.
Levitin, D. J., McAdams, S., & Adams, R. L. (2002). Control parameters for musical instruments: A foundation
for new mappings of gesture to sound. Organised Sound, 7(2), 171–189.
Levitin, D. J., & Menon, V. (2003). Musical structure is processed in ‘language’ areas of the brain: A possible role
for Brodmann area 47 in temporal coherence. Neuroimage, 20, 2142–2152.
Levitin, D. J., Nuzzo, R., Vines, B. W., & Ramsay, J. O. (2005). Introduction to functional data analysis.
Manuscript submitted for publication.
MacLeod, A., & Summerfield, Q. (1987). Quantifying the contribution of vision to speech perception in noise.
British Journal of Audiology, 21, 131–141.
Madsen, C. K., & Fredrickson, W. E. (1993). The experience of musical tension: A replication of Nielsen’s
research using the continuous response digital interface. Journal of Music Therapy, 30(1), 46–63.
Massaro, D. W. (1987). Speech perception by ear and eye: A paradigm for psychological inquiry. Hillsdale, NJ:
Lawrence Erlbaum Associates, Publishers.
Massaro, D. W. (1998). Perceiving talking faces. Cambridge, MA: The MIT Press.
McGrath, M., & Summerfield, Q. (1985). Intermodal timing relations and audio–visual speech recognition by
normal-hearing adults. Journal of the Acoustical Society of America, 77(2), 678–685.
McGurk, H., & MacDonald, J. (1976). Hearing lips and seeing voices. Nature, 264, 746–748.
McNeill, D. (1992). Hand and mind: What gestures reveal about thought. Chicago, IL: University of Chicago
Press.
McNeill, D. (1999). Triangulating the growth point—arriving at consciousness. In L. S. Messing, & R. Campbell
(Eds.), Gesture, speech, and sign (pp. 77–92). New York, NY: Oxford University Press.
Meyer, L. B. (1956). Emotion and meaning in music. Chicago, IL: University of Chicago Press.
Mollon, J. D., & Perkins, A. J. (1996). Errors of judgment at Greenwich in 1796. Nature, 380, 101–102.
Nielsen, F. V. (1983). Oplevelse af Misikalsk Spending (the experience of musical tension). Copenhagen:
Akademisk Forlag.
O’Leary, A., & Rhodes, G. (1984). Cross-modal effects on visual and auditory object perception. Perception and
Psychophysics, 35, 565–569.
Patel, A. D. (2003). Language, music, syntax and the brain. Nature Neuroscience, 6(7), 674–681.
Planalp, S., DeFrancisco, V. L., & Rutherford, D. (1996). Varieties of cues to emotion in naturally occurring
situations. Cognition and Emotion, 10(2), 137–153.
Quek, F., McNeill, D., Bryll, R., Duncan, S., Ma, X.-F., Kirbas, C., et al. (2002). Multimodal human discourse:
Gesture and speech. ACM Transactions on Computer–Human Interaction, 9(3), 171–193.
Radeau, M., & Bertelson, P. (1974). The after-effects of ventriloquism. Quarterly Journal of Experimental
Psychology, 26, 63–71.
Ramsay, J. O. (2003). FDA analysis toolkit, unpublished software application for MatLab (available for
download from ftpsite ego.psych.mcgill.ca/pub/ramsay/).
Ramsay, J. O., & Silverman, B. W. (1997). Functional data analysis. New York: Springer.
Ramsay, J. O., & Silverman, B. W. (2002). Applied functional data analysis: Methods and case studies. New
York: Springer.
Reeves, B., & Nass, C. (1996). The media equation: How people treat computers, television, and new media like
real people and places. New York: Cambridge University Press.
Repp, B. H., Frost, R., & Zsiga, E. (1992). Lexical mediation between sight and sound in speechreading. The
Quarterly Journal of Experimental Psychology, 45A(1), 1–20.
Rizzolatti, G., Fadiga, L., Gallese, V., & Fogassi, L. (1996). Premotor cortex and the recognition of motor actions.
Cognitive Brain Research, 3, 131–141.
B.W. Vines et al. / Cognition 101 (2006) 80–113 113
Rizzolatti, G., Fadiga, L., Matelli, M., Bettinardi, V., Paulesu, E., Perani, D., et al. (1996). Localisation of grasp
representations in humans by PET. 1. Observation vs. execution. Experimental Brain Research, 111, 246–
252.
Runeson, S., & Frykholm, G. (1983). Kinematic specification of dynamics as an informational basis for person-
and-action perception: Expectations, gender, recognition, and deceptive intention. Journal of Experimental
Psychology: General, 112, 585–615.
Russell, J. A. (1979). Affective space is bipolar. Journal of Personality and Social Psychology, 37, 345–356.
Schubert, E. (1999). Measuring emotion continuously: Validity and reliability of the two dimensional emotion
space. Australian Journal of Psychology, 51, 154–165.
Schubert, E. (2001). Continuous measurement of self-report emotional response to music. In P. N. Juslin, & J. A.
Sloboda (Eds.), Music and emotion: Theory and research (pp. 393–414). New York: Oxford University Press.
Schubert, E. (2002). Correlation analysis of continuous emotional response to music: Correcting for the effects of
serial correlation. Musicae Scientiae , 213–236 (Special Issue 2001–2002).
Sheets, M. (1966). The phenomenology of dance. Madison, WI: University of Wisconsin Press.
Smalley, D. (1997). Spectromorphology: Explaining sound-shapes. Organised Sound, 2(2), 107–126.
Staal, H. E., & Donderi, D. C. (1983). The effect of sound on visual apparent movement. American Journal of
Psychology, 96, 95–105.
Storr, A. (1992). Music and the mind. New York: Free Press.
Sumby, W. H., & Pollack, I. (1954). Visual contribution to speech intelligibility in noise. Journal of the
Acoustical Society of America, 26, 212–215.
Wanderley, M. M. (2002). Quantitative analysis of non-obvious performer gestures. In I. Wachsmuth, & T. Sowa
(Eds.), Gesture and sign language in human–computer interaction (pp. 241–253). Berlin: Springer.
Wanderley, M. M., Vines, B. W. (in press). Ancillary gestures of clarinettists. In E. King, A. Gritten (Eds.), Music
and gesture: New perspectives on theory and contemporary practice. Hampshire, UK: Ashgate.
West, R., Howell, P., & Cross, I. (1985). Modeling perceived musical structure. In P. Howell, I. Cross, & R. West
(Eds.), Musical structure and cognition (pp. 21–52). London: Academic Press.


![Cross-Modal Interpretation of Multi-Modal Sensor Streams ... · sensor signals for robot perception [3]. They enhance robot perception by exploiting interaction as an additional source](https://img.pdfslide.us/doc/110x75/5ea343d752780b0b226c18a0/cross-modal-interpretation-of-multi-modal-sensor-streams-sensor-signals-for.jpg)


![AISC 252 - Multi-modal Active Visual Perception System for SPL … · This paper presents the visual perception system of our humanoid robots participating in the SPL (SPiTeam[21]),](https://img.pdfslide.us/doc/110x75/5e6faef51eed355921445009/aisc-252-multi-modal-active-visual-perception-system-for-spl-this-paper-presents.jpg)