Embed Size (px)
Citation preview

Cross-Border Labor Mobility and Human Capital Development in Aging Asia
Aiko Kikkawa Takenaka Economist, ERCI
AEIR 2018 Inception Workshop on Regional Public Goods
14 December 2017 | Asian Development Bank HQ
Outline
Aging and Demographic changes in Asia: Snap Shots
Regional Labor and Skill mobility
Human Capital Development in Aging Asia
Policy Considerations

Figure 1. Aging and demographic change in Asia and the Pacific
(a) 2017
8.0 6.0 4.0 2.0 0.0
Female (%)
0.0 2.0 4.0 6.0 8.0 10.0
0-4
5-9
10-14
15-19
20-24
25-29
30-34
35-39
40-44
45-49
50-54
55-59
60-64
65-69
70-74
75-79
80+
Male (%)
(b) 2050
10.0 8.0 6.0 4.0 2.0 0.0
Female (%)
0.0 2.0 4.0 6.0 8.0 10.0
0-4
5-9
10-14
15-19
20-24
25-29
30-34
35-39
40-44
45-49
50-54
55-59
60-64
65-69
70-74
75-79
80+
Male
Source: ADB calculations using data from United Nations Population Division.
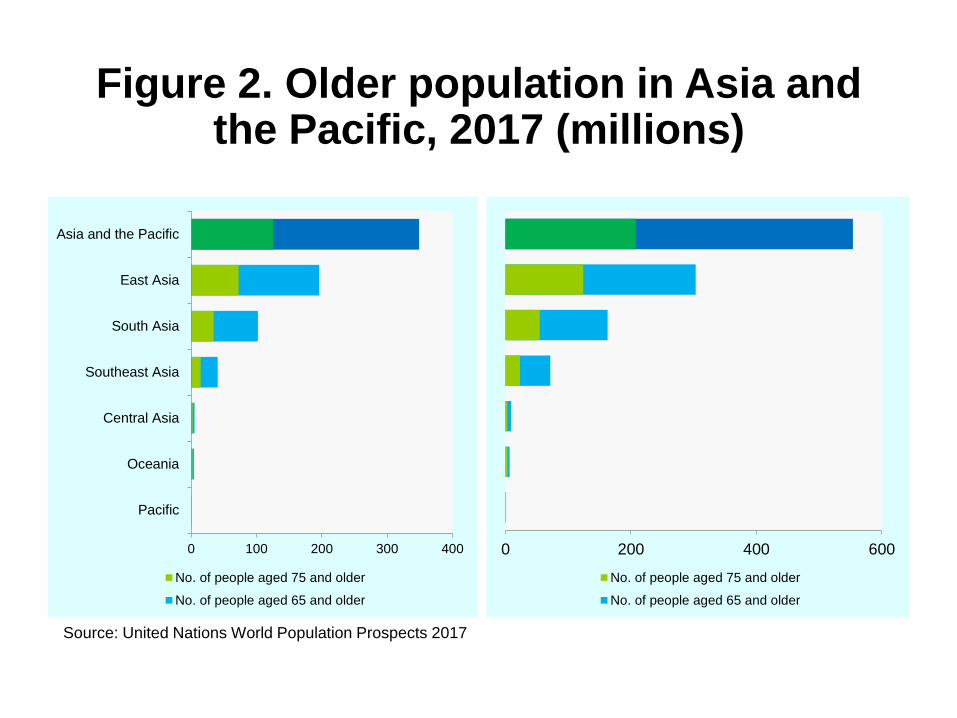
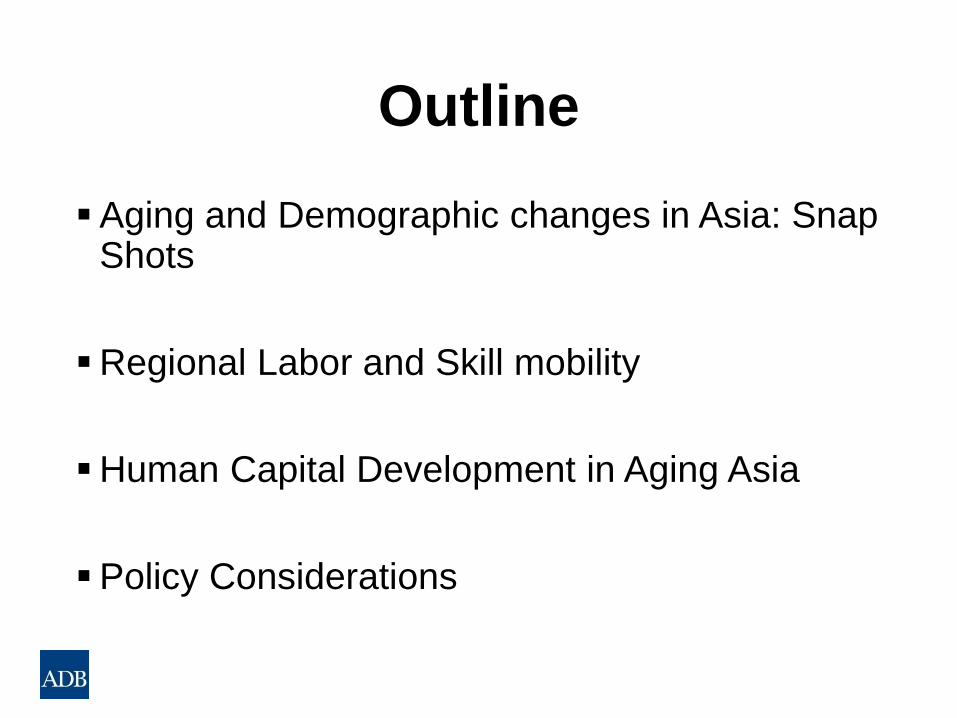
Figure 2. Older population in Asia and the Pacific, 2017 (millions)
(a) 2017
0 100 200 300 400
Pacific
Oceania
Central Asia
Southeast Asia
South Asia
East Asia
Asia and the Pacific
No. of people aged 75 and older
No. of people aged 65 and older
(b) 2030
0 200 400 600
No. of people aged 75 and older
No. of people aged 65 and older
Source: United Nations World Population Prospects 2017
Figure 3. Size of older population in Asia, 2017 and 2050 (% of population)
15.5%
22.7%
12.1%
27.4%
6.3%
15.5%
5.7%
13.3%
5.7%
12.9%
4.0%
7.4%
0%
5%
10%
15%
20%
25%
30%
2017 2050
Oceania East Asia Southeast Asia
Source: ADB calculations using data from United Nations Population Division.

6
Figure 4. Population pyramid 2030
PRC India
10.0 8.0 6.0 4.0 2.0 0.0
Female (%)
0.0 2.0 4.0 6.0 8.0 10.0
0-4
5-9
10-14
15-19
20-24
25-29
30-34
35-39
40-44
45-49
50-54
55-59
60-64
65-69
70-74
75-79
80+
Male (%)
Source: ADB calculations using data from United Nations Population Division.
10.0 8.0 6.0 4.0 2.0 0.0
Female (%)
0.0 2.0 4.0 6.0 8.0 10.0
0-4
5-9
10-14
15-19
20-24
25-29
30-34
35-39
40-44
45-49
50-54
55-59
60-64
65-69
70-74
75-79
80+
Male (%)

7
Figure 5. Population pyramid 2030
Thailand Japan
16.0 14.0 12.0 10.0 8.0 6.0 4.0 2.0 0.0
Female (%)
0.0 2.0 4.0 6.0 8.0 10.0 12.0 14.0 16.0
0-4
5-9
10-14
15-19
20-24
25-29
30-34
35-39
40-44
45-49
50-54
55-59
60-64
65-69
70-74
75-79
80+
Male (%)
Source: ADB calculations using data from United Nations Population Division.

8
Figure 6. Philippines
(a) 2017
12.0 10.0 8.0 6.0 4.0 2.0 0.0
Female (%)
0.0 5.0 10.0 15.0
0-4
5-9
10-14
15-19
20-24
25-29
30-34
35-39
40-44
45-49
50-54
55-59
60-64
65-69
70-74
75-79
80+
Male (%)
(b) 2030
12.0 10.0 8.0 6.0 4.0 2.0 0.0
Female (%)
0.0 2.0 4.0 6.0 8.0 10.0 12.0
0-4
5-9
10-14
15-19
20-24
25-29
30-34
35-39
40-44
45-49
50-54
55-59
60-64
65-69
70-74
75-79
80+
Male (%)
Source: ADB calculations using data from United Nations Population Division.
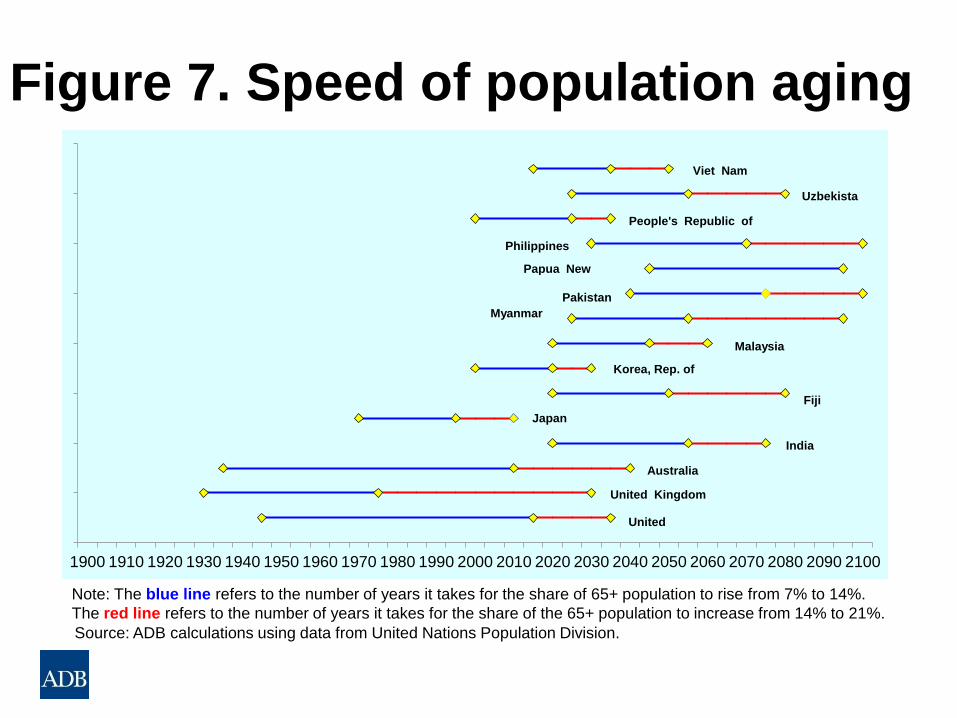
Figure 7. Speed of population aging
1900 1910 1920 1930 1940 1950 1960 1970 1980 1990 2000 2010 2020 2030 2040 2050 2060 2070 2080 2090 2100
United
Viet Nam
United Kingdom
Australia
India
Japan
Fiji
Uzbekista
People's Republic of
Philippines
Papua New
Pakistan
Myanmar
Malaysia
Korea, Rep. of
Note: The blue line refers to the number of years it takes for the share of 65+ population to rise from 7% to 14%.
The red line refers to the number of years it takes for the share of the 65+ population to increase from 14% to 21%.
Source: ADB calculations using data from United Nations Population Division.
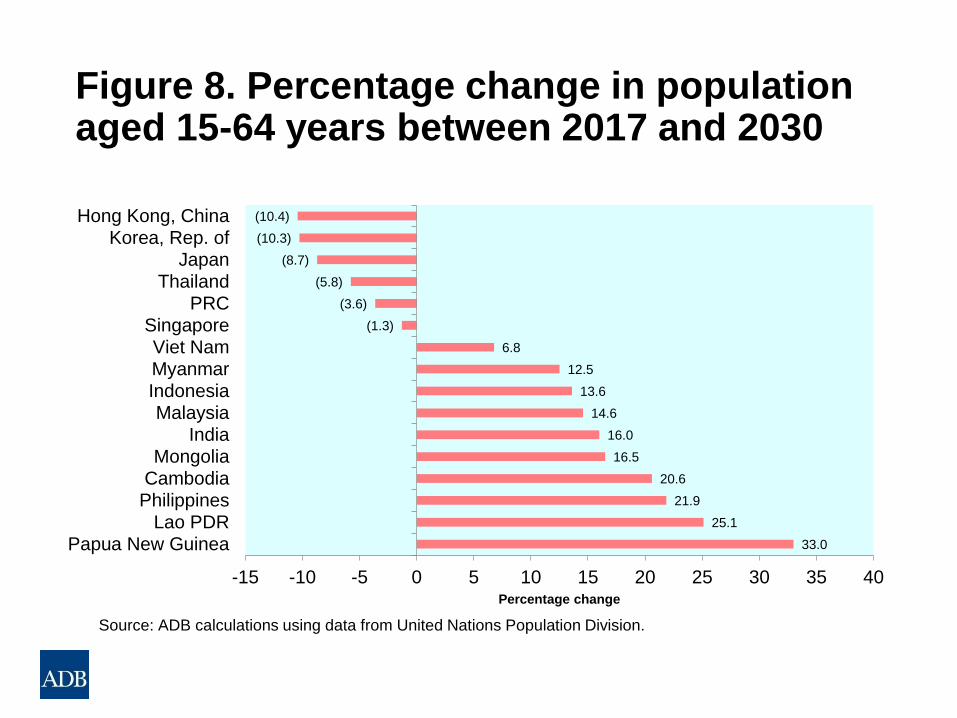
Figure 8. Percentage change in population aged 15-64 years between 2017 and 2030
33.0
25.1
21.9
20.6
16.5
16.0
14.6
13.6
12.5
6.8
(1.3)
(3.6)
(5.8)
(8.7)
(10.3)
(10.4)
-15 -10 -5 0 5 10 15 20 25 30 35 40
Papua New GuineaLao PDR
PhilippinesCambodiaMongolia
IndiaMalaysia
IndonesiaMyanmarViet Nam
Singapore
PRCThailand
JapanKorea, Rep. of
Hong Kong, China
Percentage change
Source: ADB calculations using data from United Nations Population Division.

Role of technology in an aging world
Aging leads to greater automation and more incentive to use
and develop robots across countries (Acemoglue and
Restrepo 2017) Age structure of workers accounts for 40% of variation of
investment in robotics across countries (OECD +20)
Relative scarcity of middle-aged workers are seen prompting the
adoption of robotics
The age structure also correlated to adoption of other automation
technologies (vending machine, ATM)
Aged workforce result in the delay in the introduction of
technology, and this will result in the decline of productivity
as in the case of Germany (Wailuk 2013)
Production
Sales and Related
Service
Office and Admin
Management
Buz/Finance
Education, Legal,
Art, Media
Employment
Computer, Engineer
Science
Healthcare
Transport
Construction and
Extraction
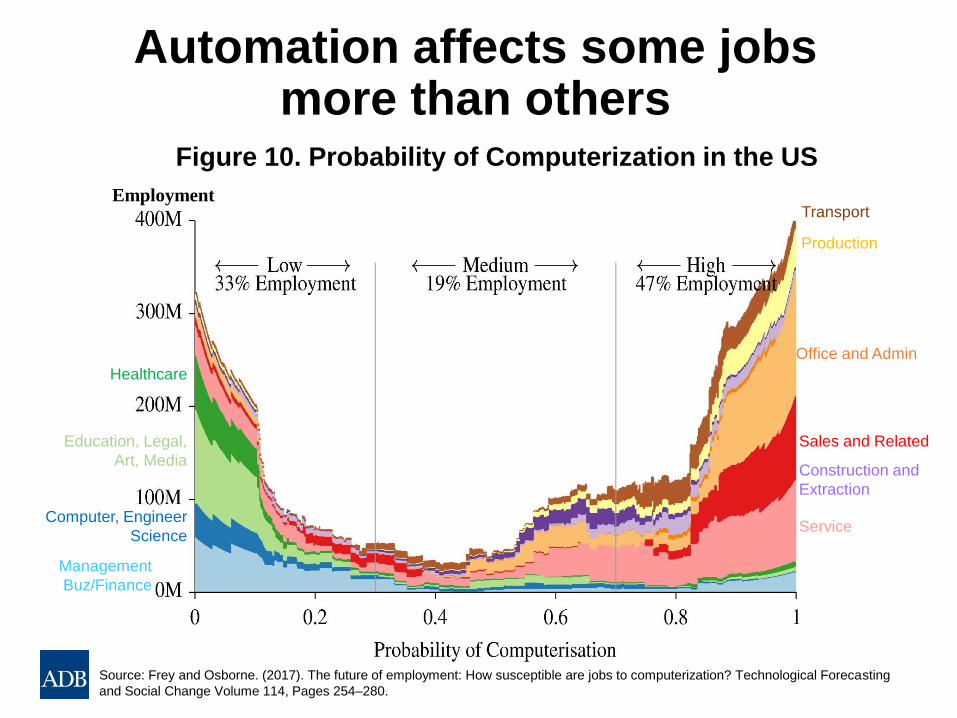
Automation affects some jobs more than others
Source: Frey and Osborne. (2017). The future of employment: How susceptible are jobs to computerization? Technological Forecasting
and Social Change Volume 114, Pages 254–280.
Figure 10. Probability of Computerization in the US

13
Advanced/Aged population
• Contracting workforce
• Need for all types of workers including skilled, care and manual workers
• “Excess” educational capacity in higher education facilities
• Capacity to develop e-education platforms
Middle Income/ Aging population
• Contracting workforce
• Need for developing pool of skilled workforce
• Lack of educational facility and OJTs to develop skilled workers
• Need for care workers
Middle-Low Income/ Young population
• Growing work forth and youth population
• Lack of job opportunities
• Growing needs for educational facilities and OJT
Figure 9.
Rationale for RPGs for regional labor market in aging Asia
Efficient allocation of human resources of varied skill levels Highly skilled
Care workers and others
Addressing needs for skill development in developing Asia

Figure 10. International Migration from Asia (millions, % share)
28.6 30.6
75.3
83.3
38.0 36.7
0
5
10
15
20
25
30
35
40
45
50
0
10
20
30
40
50
60
70
80
90
1990 1995 2000 2005 2010 2015
Perc
en
tag
e s
hare
millio
ns
Asia to Asia Asia to World % share
Notes: % share = migrants from Asia to World / total global migrants * 100
Source: ADB calculations using data from "Trends in International Migrant Stock: The 2015 Revision", United Nations Population Division.

Regional Labor and Skill Mobility
16

Foreign Nurses in Singapore
Nationality
2010 % to All
nurses
% to Non-
Singaporean 2016
% to
All
nurses
% to Non-
Singaporean
Singaporean 18,176 84.2 21,936 69.4
Malaysian 468 2.2 13.8 2,230 7.1 23.0
Chinese (PRC) 578 2.7 17.0 955 3.0 9.9
Filipino 1,760 8.2 51.8 4,942 15.6 51.1
Indian 220 1.0 6.5 544 1.7 5.6
Myanmar 165 0.8 4.9 742 2.3 7.7
Others 208 1.0 6.1 266 0.8 2.7
All Nurses 21,575 100.0 31,615 100.0
Non-Singaporean
Nurses
3,399 100.0 9,679 100.0
PRC = People's Republic of China. Source: Singapore Nursing Board. 2016 and 2010 Annual Reports.
Table 1 Number of Registered Nurse in Singapore by Nationality
18
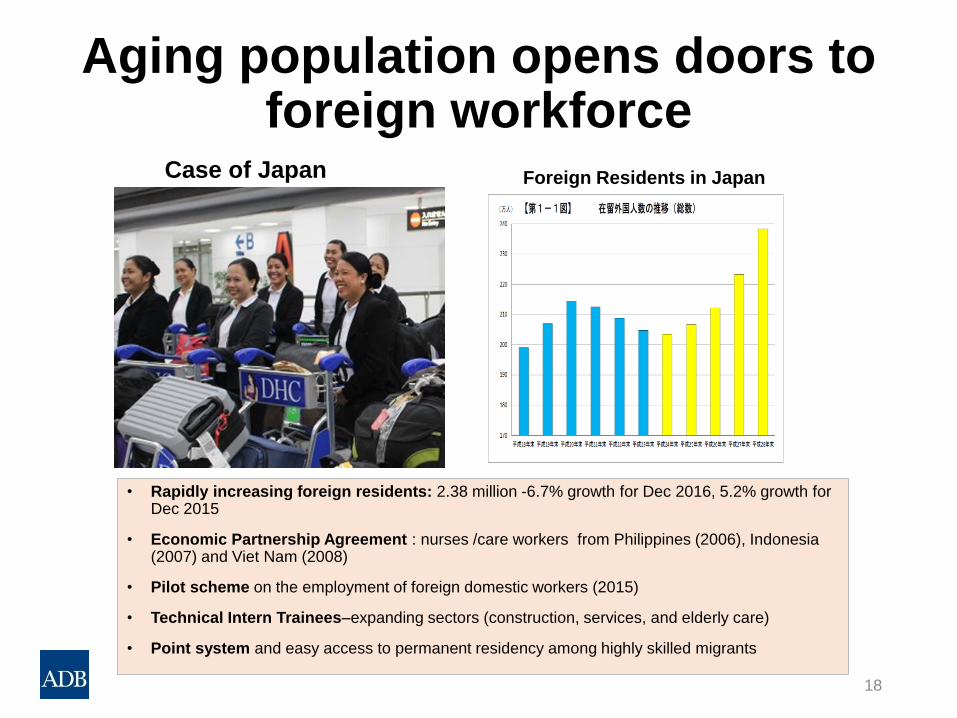
Aging population opens doors to foreign workforce
• Rapidly increasing foreign residents: 2.38 million -6.7% growth for Dec 2016, 5.2% growth for Dec 2015
• Economic Partnership Agreement : nurses /care workers from Philippines (2006), Indonesia (2007) and Viet Nam (2008)
• Pilot scheme on the employment of foreign domestic workers (2015)
• Technical Intern Trainees–expanding sectors (construction, services, and elderly care)
• Point system and easy access to permanent residency among highly skilled migrants
Foreign Residents in Japan Case of Japan

Varying openness to migration
0%
5%
10%
15%
20%
25%
30%
35%
40%
45%
50%
0
5
10
15
20
25
30
35
40
45
50
AUS BRU CAN PRC HKG JAP KOR MAL MEX NZD RUS SIN THA USA
mill
ion
Figure 11. Migrants in APEC economies, 2015 (number and share of population)
Number of migrants (left) Share of population (right)
19
Source: United Nations Department of Economics and Social Affairs Population Division
Barriers to temporary labor mobility
Some skills are not portable - Skill recognition mostly rely on host
country schemes except for some skills that are standardized
through international and regionally standardization
(APEC/ASEAN, Commonwealth etc.)
Where skills are portable, they are not linked to job opportunities,
not widely known to professional organizations
Cost of oversea employment is high
Imperfect competition- restricted entry of recruiters in some
country of origin of migrants, information asymmetry due to
distance/language

Mutual Recognition Arrangements
15
11
53
187
204
299
260
304
257
962
11
9
4
26
17
12
68
39
86
145
0 200 400 600 800 1000 1200
Brunei…
Lao PDR
Cambodia
Thailand
Viet Nam
Myanmar
Philippines
Malaysia
Singapore
Indonesia
Engineering (ACPEs)
Architecture (AAs)
ACPE - ASEAN Chartered Professional Engineers, AA - ASEAN Architect Register, Lao PDR =
Lao People’s Demo. Republic Source: ASEAN Secretariat.
Figure 12. ASEAN Engineers and Architects (as of September 2017)
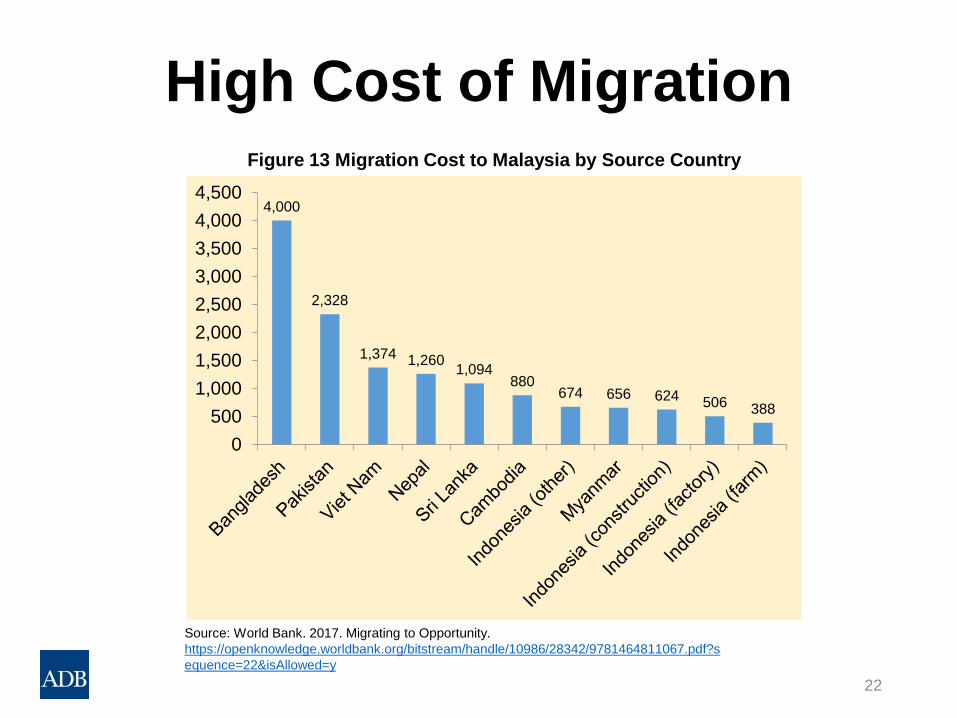
High Cost of Migration
4,000
2,328
1,374 1,260 1,094
880 674 656 624 506 388
0
500
1,000
1,500
2,000
2,500
3,000
3,500
4,000
4,500
22
Source: World Bank. 2017. Migrating to Opportunity.
https://openknowledge.worldbank.org/bitstream/handle/10986/28342/9781464811067.pdf?s
equence=22&isAllowed=y
Figure 13 Migration Cost to Malaysia by Source Country

Regional Mobility Schemes
Human Capital Development in Aging Asia
24

Future Jobs
Education and skills plays a critical part in 4th industrialization, moving up
global value chain and specialization of production. A pool of qualified and
skilled workers are is needed for many countries to make transition from
middle-income country.
The Second Demographic Dividend”- Declining fertility itself is associated
with more resources per child to build human capital (Mason et al 2016).
But this cannot be taken for granted, given the limited fiscal space of
many middle-income countries, high velocity of aging, and lack of quality
service providers.
How can workers in DMC access quality education and OJT ? How can RCI
and RPG contribute?
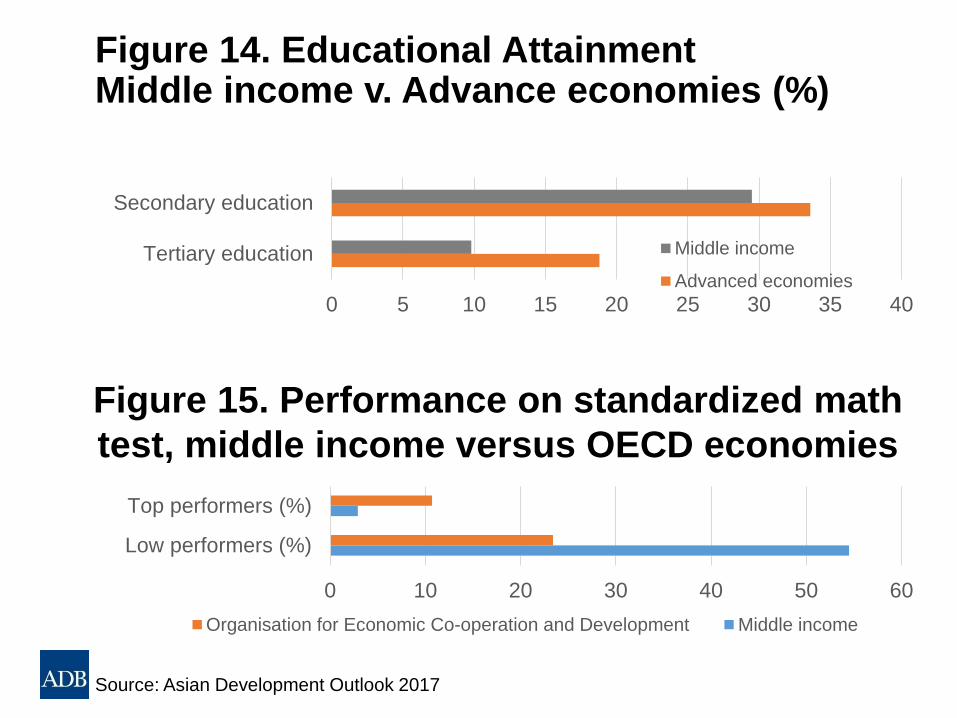
Figure 14. Educational Attainment Middle income v. Advance economies (%)
0 5 10 15 20 25 30 35 40
Tertiary education
Secondary education
Middle income
Advanced economies
Source: Asian Development Outlook 2017
0 10 20 30 40 50 60
Low performers (%)
Top performers (%)
Organisation for Economic Co-operation and Development Middle income
Figure 15. Performance on standardized math
test, middle income versus OECD economies
Regional University Networks and E-Learning Platforms

Data on International Students
0
10
20
30
40
50
60
70
0
200
400
600
800
1,000
1,200
1,400
UnitedKingdom
UnitedStates
Australia Japan China(People'sRepublic
of)
NewZealand
Korea
Pe
rce
nta
ge
Th
ou
sa
nd
s
Figure 16. Selected Destination Countries of International Students
International students Share of international students to total enrolment
Note: Data on international students is irrespective of residency status. Total enrolment data is based on enrolment by field except
Japan which is based on enrolment by institution.
Source: OECD Education Statistics at http://stats.oecd.org/BrandedView.aspx?oecd_bv_id=edu-data-en&doi=33c390e6-en

Regional Platform for Human Capital Development
Partnership on higher education and stimulating knowledge exchange
Graduate employment and skill development scheme

Figure 17. Employment of Foreign Graduates
19,038 20,410
22,869 23,332
25,114
22,697 23,799
4,701 5,135 6,199 6,356
7,035 7,129 8,367
0
5,000
10,000
15,000
20,000
25,000
30,000
2009 2010 2011 2012 2013 2014 2015
Number of foreign graduates Number of foreign graduates entering employment
Source: Ministry of Education, Culture, Sports, Science and Technology—Japan

Key Messages
Asian countries are going through different stages of demographic transition
Labor mobility framework and human capital development mechanism and are increasingly important and promissing forms of RPGs in Aging Asia
Standardizing and simplifying procedures (region-wide skills and qualification recognition framework, streamlined and harmonized immigration requirement, transparency in the market) to address human resource challenge
Strengthening institutional partnership and collaboration in higher education by linking it to professional trainings to develop regional human capital

SPARE SLIDES

Key Messages
Aging and demographic changes in Asia offer opportunities and
challenges for the goal of maintaining pool of trained human capital in
the region.
Labor mobility framework and human capital development mechanism
can be considered increasingly important forms of RPGs in Aging Asia.
Labor mobility in the region can be more actively facilitated and made
safe by harmonizing, standardizing and simplifying national policies
and practices across the region.
Human capital development in the region can be scaled up through
cross-country cooperation and collaboration.

Large gain by liberating movement of people
Figure 18. Efficiency Gain from Elimination of International Barriers (% of world GDP)
All policy barriers to merchandise trade
1.8 Goldin, Knudsen, and van der Mensbrugghe (1993)
4.1 Dessus, Fukasaku, and Safadi (1999)
0.9 Anderson, Francois, Hertel, Hoekman, and Martin (2000)
0.7 Anderson and Martin (2005)
All barriers to capital flows
1.7 Gourinchas and Jeanne (2006)
0.1 Caselli and Feyrer (2007)
All barriers to labor mobility
147.3 Hamilton and Whalley (1984)
96.5 Moses and Letnes (2004)
67 Iregui (2005)
122 Klein and Ventura (2007)
35
Source: M. A. Clemens. 2011. Economics and Emigration: Trillion-Dollar Bills on the Sidewalk? Journal of
Economic Perspective 25 (3).

Figure X. Change in population aged 15-64 years between 2017 and 2030 (million)
Source: ADB calculations using data from United Nations Population Division.
141.9
33.0
24.9
6.1
5.9
5.3
3.6
2.9
1.7
0.5
(0.3)
(0.7)
(7.5)
(7.7)
(14.9)
(128.3)
-150 -100 -50 0 50 100 150 200
India
Indonesia
Philippines
Viet Nam
Myanmar
Malaysia
Cambodia
Papua New Guinea
Lao PDR
Mongolia
Singapore
Hong Kong, China
Korea, Rep. of
Thailand
Japan
PRC
million
Change in population ages 15-64 between 2017 and 2030 (million)

Wage gap across the region
372
402
624
659
1,120
1,730
3,183
4,613
0 1,0002,0003,0004,0005,000
Cambodia (2012)
Lao PDR (2010)
Philippines (2016)
Indonesia (2016)
Viet Nam (2016)
Thailand (2016)
Malaysia (2016)
Brunei Darussalam…
Singapore (2015)
37
Lao PDR = Lao People’s Democratic Republic
Source: International Labor Organization. Key Indicators of the Labor Market (KILM).
http://www.ilo.org/ilostat/faces/oracle/webcenter/portalapp/pagehierarchy/Page3.jspx?MBI_I
D=435
Figure 19. Average monthly earnings of employees

Figure 24. Integration in Asia: Intraregional shares (% of total)
Source: ADB Asian Economic Integration Report 2017.
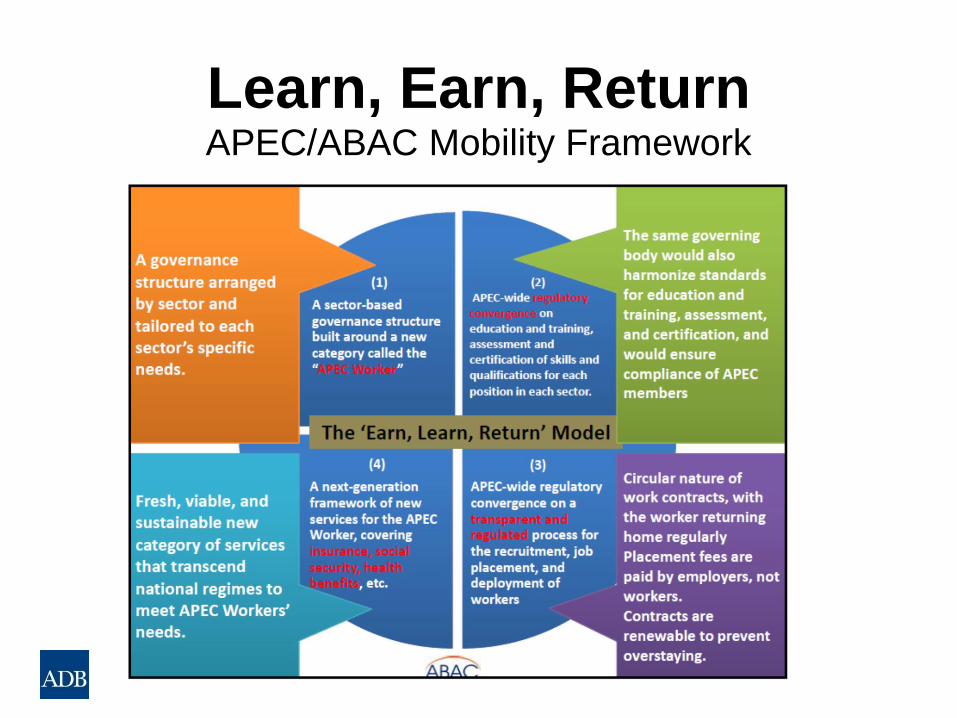
Learn, Earn, Return APEC/ABAC Mobility Framework
Labor Mobility and the Problem of Free-riding
Problem of free-riding; public human capital investment drained by the outmigration of the skilled (eg. doctors, engineers trained by public universities), through partly compensated by remittances (in short term) and future investment/return (in a long run)
→ Likely causing undersupply of the education services (eg, states and more likely donors country increasingly more shy to provide funds for higher education where most graduates go abroad) Need to promote brain circulation and linkages.

Figure 26. Intraregional migration by subregion
(% of total outbound migration from Asia)
53.2 56.7 57.5 59.9 62.0 63.3
0
10
20
30
40
50
60
70
80
90
100
1990 1995 2000 2005 2010 2015
Rest of the World Oceania Pacific Southeast Asia South Asia East Asia Central Asia
Source: ADB calculations using data from "Bilateral Remittance Estimates for 2015 using Migrant Stocks, Host
Country Incomes, and Origin Country Incomes", World Bank Migration and Remittances database.

Definition
Human Capital Development
Education, skill/vocational training, health service and labor standards are traditionally
considered national public goods and provided by the governments given their positive
externalities. Many of these services are also supplied by private providers especially in
areas such as higher education and skills training.
Cross-border labor mobility
Movement of workers of various skill levels crossing borders for the purpose of
employment and delivery of services. Labor mobility in the region is primarily individual
and industry-driven and managed by host country scheme complemented by bilateral
schemes (eg. Thailand, Malaysia, bilateral MOUs). Bilateral and multilateral trade
agreements also facilitate labor mobility in some cases. Some regional organizations
such as European Union (EU), The East African Community (EAC), and Economic
Community of West African States (ECOWAS) practices the freedom of movement of
people for the purpose of employment within the Community.
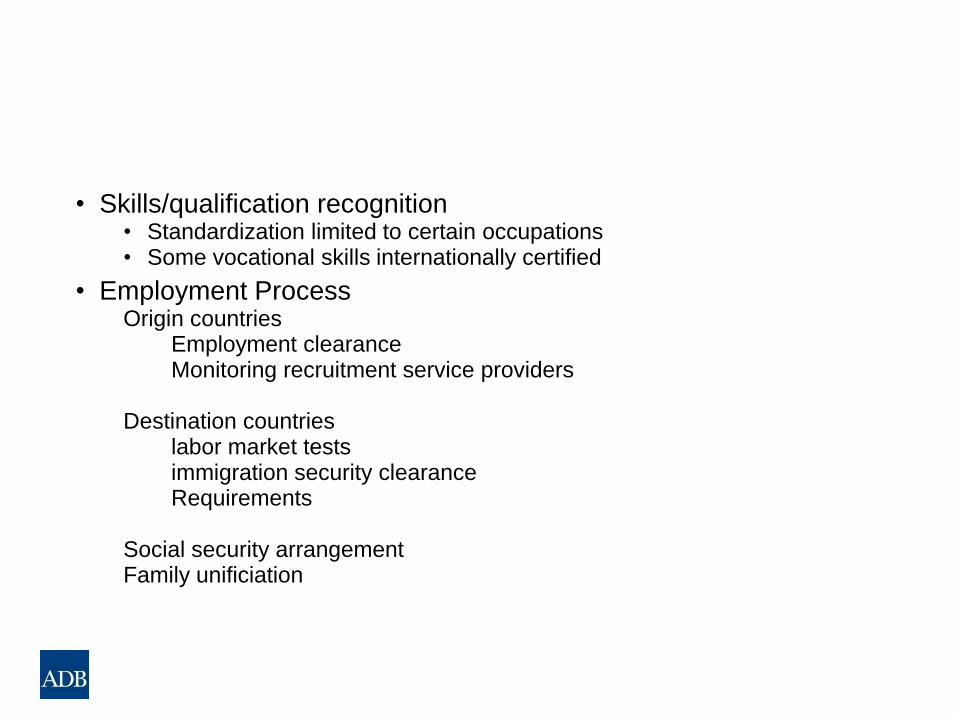
• Skills/qualification recognition • Standardization limited to certain occupations • Some vocational skills internationally certified
• Employment Process Origin countries Employment clearance Monitoring recruitment service providers Destination countries labor market tests immigration security clearance Requirements Social security arrangement Family unificiation