Embed Size (px)
Citation preview
Cross-border labor mobility in the Central European Region. Insights from the TRANSLAB-Project
Research team:Univ.-Prof. Roland Verwiebe Prof. Christoph ReinprechtLaura Wiesböck, M.A.MMag. Raimund Haindorfer
Department of SociologyUniversity of Vienna
2
Research Interest
• In-depth look at the transnational labor market of the Central European Region (Centrope), where a specific historical political context and European transformations are interfering. •Mixed method approach•Key research areas:
»Reasons for cross-border commuting»Wages»Upward/downward mobility»Job finding strategies»Life satisfaction»Relevance of social networks»Working conditions• Differences in these research areas regarding gender, age, education,
social capital, class
3
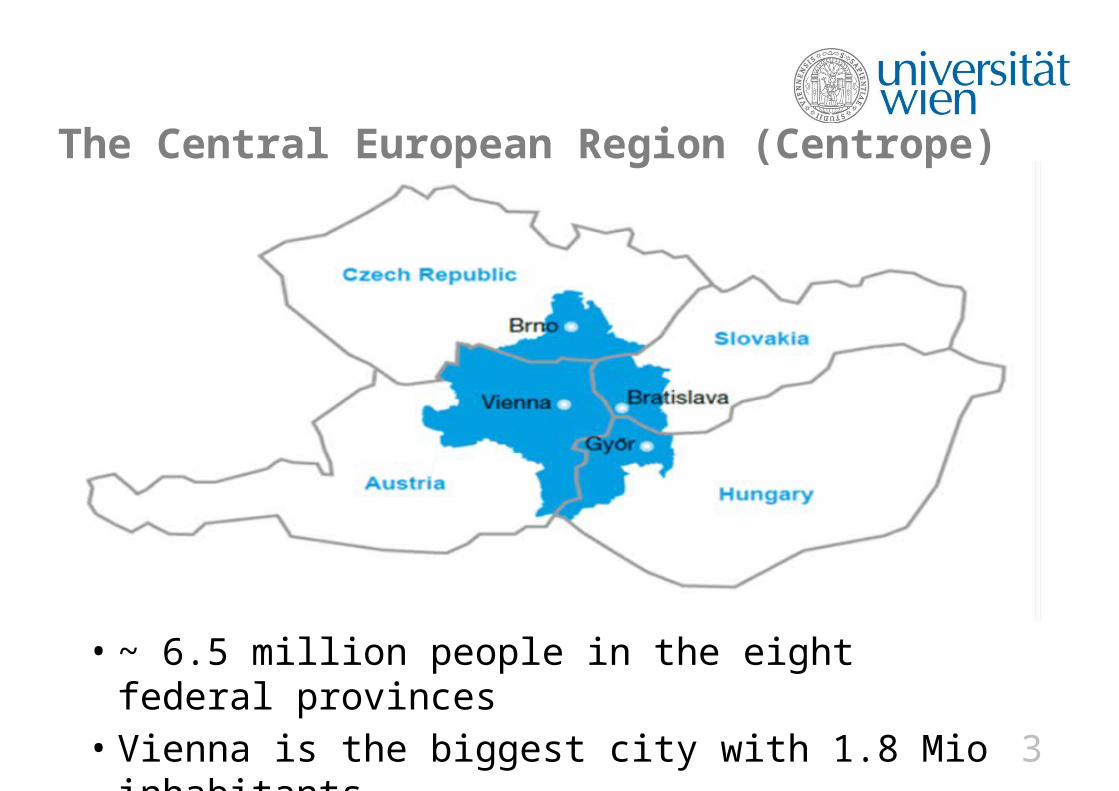
The Central European Region (Centrope)
• ~ 6.5 million people in the eight federal provinces • Vienna is the biggest city with 1.8 Mio inhabitants.
4
The Central European Region (Centrope)
• Several markers of significant changes have led to new interplays of economic, social, political and legal factors:»1991: dissolution of the Soviet Union»2004: EU-enlargement»2011: removal of the last barriers to the free movement of labor
• Long history of cross-border mobility and social exchange, however: relatively high social inequality between Austrian sub-regions and their neighbors remains to be relevant.

Fertiliy rate in Centrope
1990 1995 2000 2005 2012Czech Republic 1.90 1.28 1.15 1.29 1.45Jihozápad 1.28 1.16 1.27 1.48Jihovýchod 1.29 1.12 1.27 1.46Hungary 1.87 1.57 1.32 1.31 1.34Közép-Dunántúl 1.95 1.55 1.24 1.26 1.32Nyugat-Dunántúl 1.84 1.50 1.17 1.21 1.22Austria 1.46 1.42 1.36 1.41 1.44Burgenland (AT) 1.33 1.25 1.19 1.27 1.30Niederösterreich 1.48 1.44 1.35 1.46 1.49Wien 1.39 1.33 1.32 1.37 1.40Oberösterreich 1.53 1.52 1.44 1.49 1.55Slovakia 2.09 1.52 1.30 1.27 1.34Bratislavský kraj 1.04 1.18 1.42Západné Slovensko 1.13 1.09 1.17
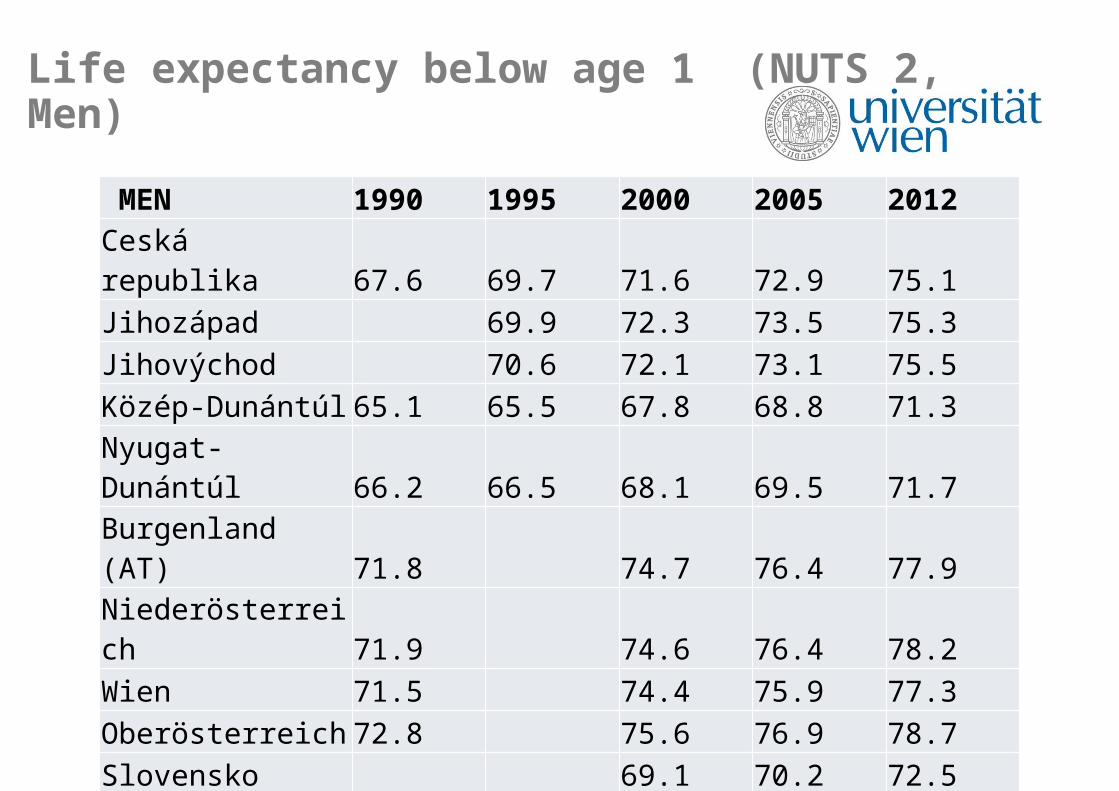
Life expectancy below age 1 (NUTS 2, Men)
MEN 1990 1995 2000 2005 2012Ceská republika 67.6 69.7 71.6 72.9 75.1Jihozápad 69.9 72.3 73.5 75.3Jihovýchod 70.6 72.1 73.1 75.5Közép-Dunántúl 65.1 65.5 67.8 68.8 71.3Nyugat-Dunántúl 66.2 66.5 68.1 69.5 71.7Burgenland (AT) 71.8 74.7 76.4 77.9Niederösterreich 71.9 74.6 76.4 78.2Wien 71.5 74.4 75.9 77.3Oberösterreich 72.8 75.6 76.9 78.7Slovensko 69.1 70.2 72.5Bratislavský kraj 70.9 71.8 74.3
Západné Slovensko 69.6 70.5 72.7
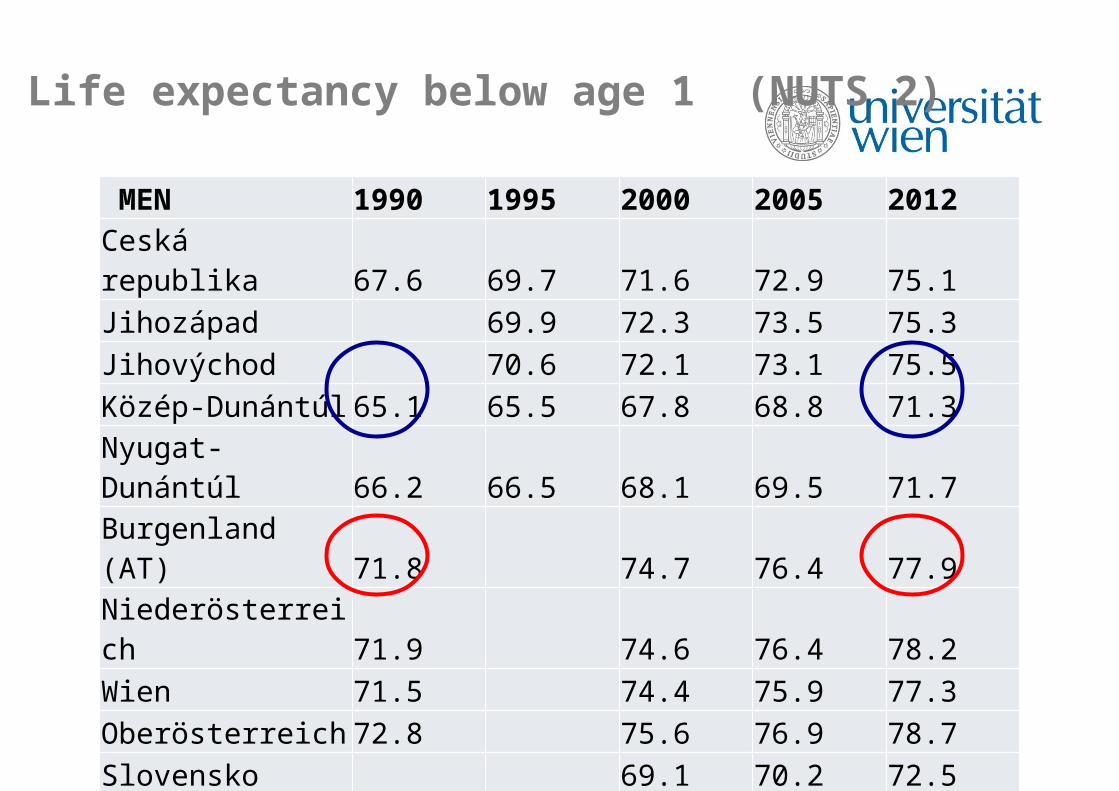
Life expectancy below age 1 (NUTS 2)
MEN 1990 1995 2000 2005 2012Ceská republika 67.6 69.7 71.6 72.9 75.1Jihozápad 69.9 72.3 73.5 75.3Jihovýchod 70.6 72.1 73.1 75.5Közép-Dunántúl 65.1 65.5 67.8 68.8 71.3Nyugat-Dunántúl 66.2 66.5 68.1 69.5 71.7Burgenland (AT) 71.8 74.7 76.4 77.9Niederösterreich 71.9 74.6 76.4 78.2Wien 71.5 74.4 75.9 77.3Oberösterreich 72.8 75.6 76.9 78.7Slovensko 69.1 70.2 72.5Bratislavský kraj 70.9 71.8 74.3
Západné Slovensko 69.6 70.5 72.7
11
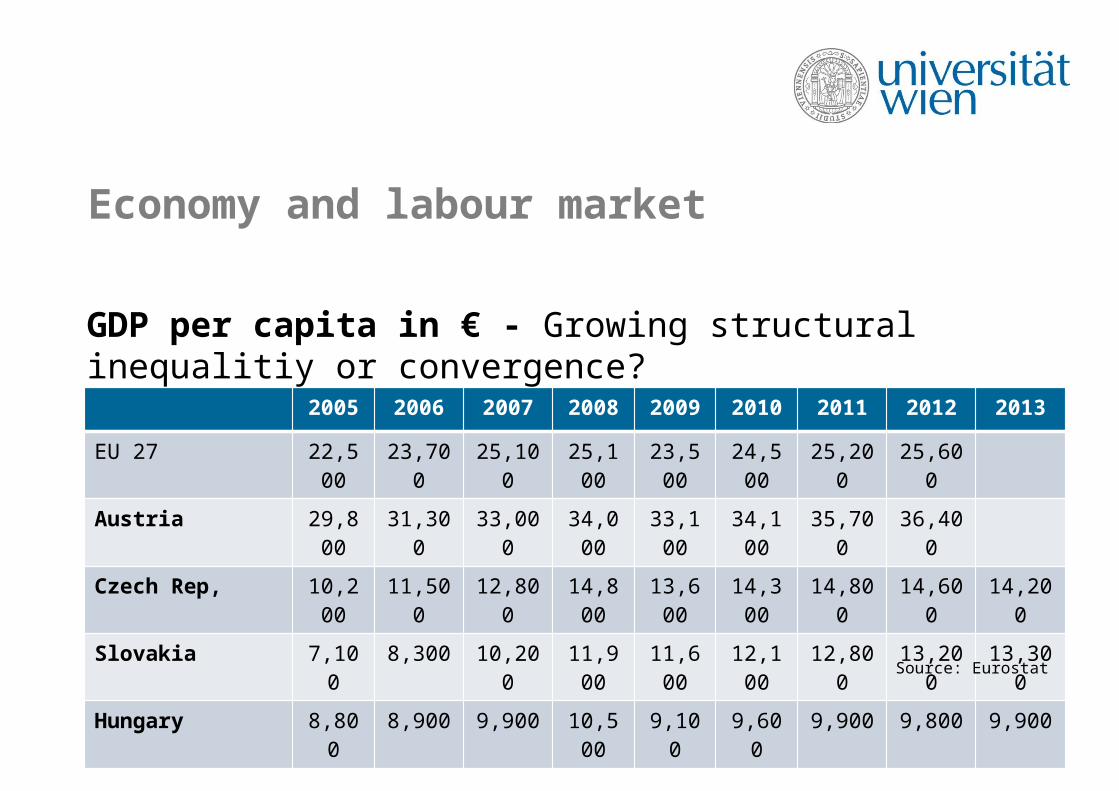
Economy and labour market
2005 2006 2007 2008 2009 2010 2011 2012 2013
EU 27 22,500 23,700 25,100 25,100 23,500 24,500 25,200 25,600
Austria 29,800 31,300 33,000 34,000 33,100 34,100 35,700 36,400
Czech Rep, 10,200 11,500 12,800 14,800 13,600 14,300 14,800 14,600 14,200
Slovakia 7,100 8,300 10,200 11,900 11,600 12,100 12,800 13,200 13,300
Hungary 8,800 8,900 9,900 10,500 9,100 9,600 9,900 9,800 9,900
Source: Eurostat
GDP per capita in € - Growing structural inequalitiy or convergence?

12
Economy and labour market
2005 2006 2007 2008 2009 2010 2011 2012 2013
EU 27 22,500 23,700 25,100 25,100 23,500 24,500 25,200 25,600
Austria 29,800 31,300 33,000 34,000 33,100 34,100 35,700 36,400
Czech Rep, 10,200 11,500 12,800 14,800 13,600 14,300 14,800 14,600 14,200
Slovakia 7,100 8,300 10,200 11,900 11,600 12,100 12,800 13,200 13,300
Hungary 8,800 8,900 9,900 10,500 9,100 9,600 9,900 9,800 9,900
Source: Eurostat
GDP per capita in € - Growing structural inequalitiy or convergence?
13
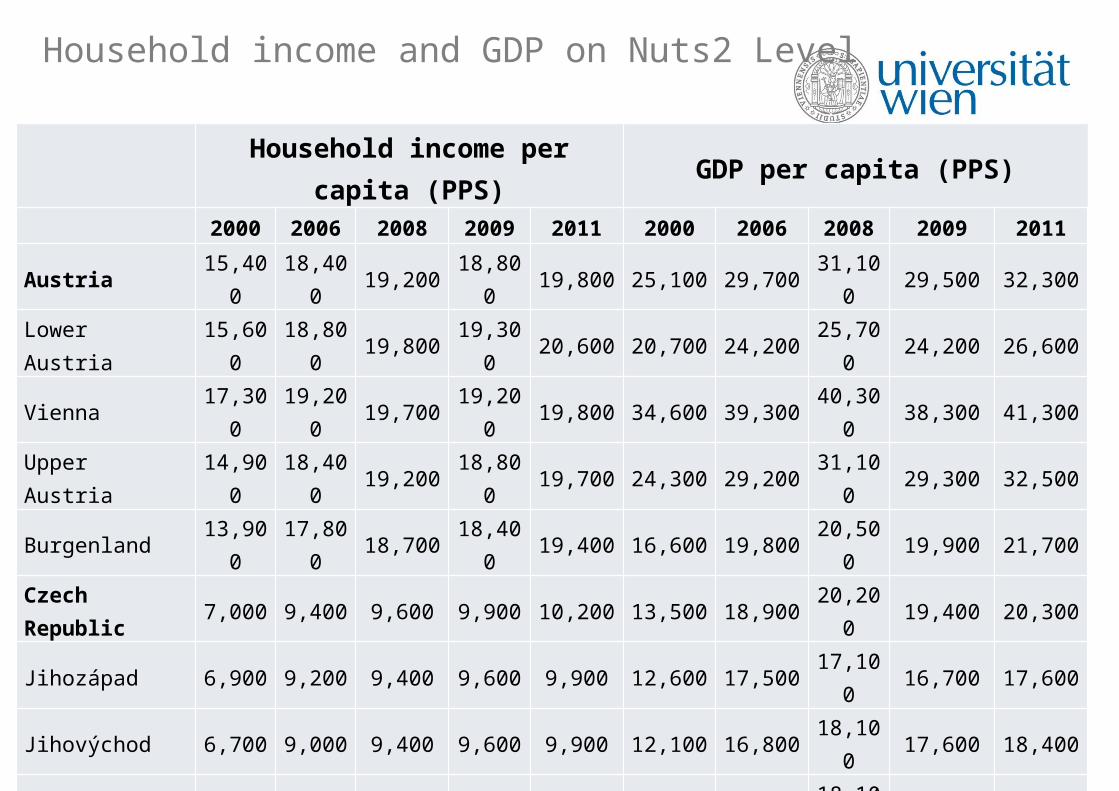
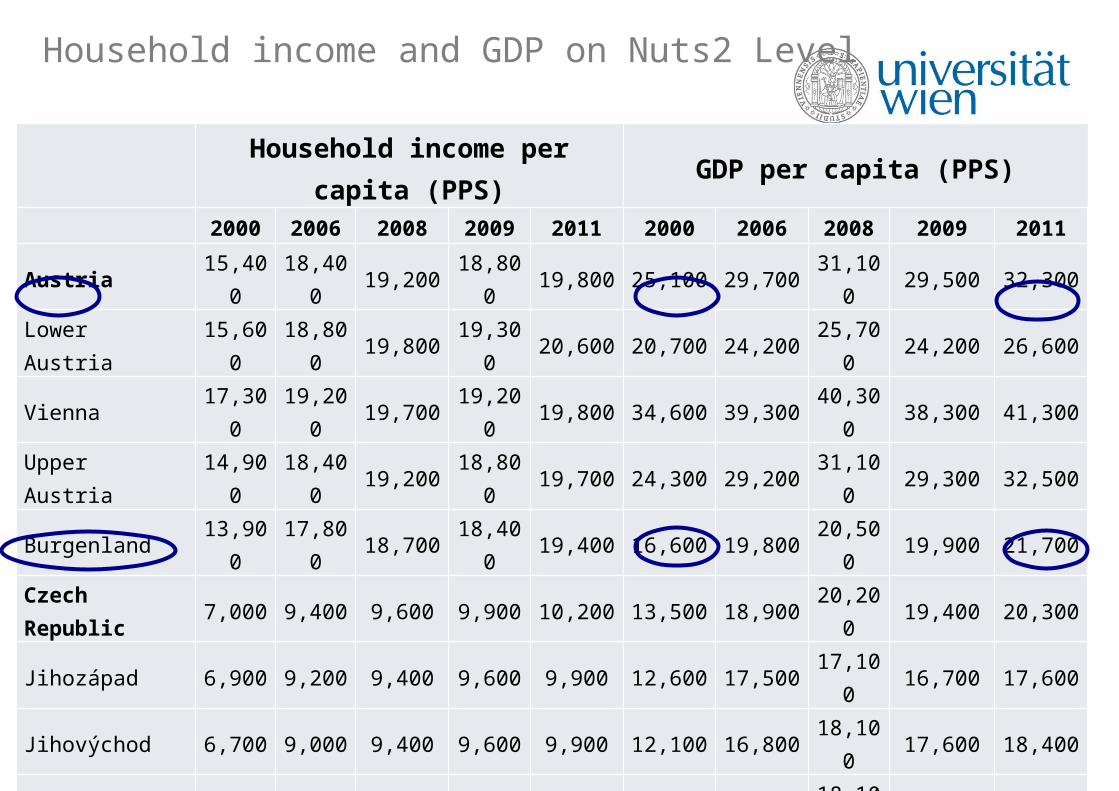
Household income and GDP on Nuts2 Level
Household income per capita (PPS) GDP per capita (PPS)
2000 2006 2008 2009 2011 2000 2006 2008 2009 2011
Austria 15,400 18,400 19,200 18,800 19,800 25,100 29,700 31,100 29,500 32,300
Lower Austria 15,600 18,800 19,800 19,300 20,600 20,700 24,200 25,700 24,200 26,600Vienna 17,300 19,200 19,700 19,200 19,800 34,600 39,300 40,300 38,300 41,300
Upper Austria 14,900 18,400 19,200 18,800 19,700 24,300 29,200 31,100 29,300 32,500
Burgenland 13,900 17,800 18,700 18,400 19,400 16,600 19,800 20,500 19,900 21,700
Czech Republic 7,000 9,400 9,600 9,900 10,200 13,500 18,900 20,200 19,400 20,300
Jihozápad 6,900 9,200 9,400 9,600 9,900 12,600 17,500 17,100 16,700 17,600
Jihovýchod 6,700 9,000 9,400 9,600 9,900 12,100 16,800 18,100 17,600 18,400
Slovakia 5,500 7,800 9,500 9,500 10,500 9,500 14,900 18,100 17,000 18,900
Bratislavský kraj 8,000 12,200 14,400 15,000 16,000 20,700 34,800 41,700 41,600 46,600
Západné Slovens. 5,200 7,700 9,500 9,400 10,700 9,000 14,800 17,300 16,000 18,100
Hungary 5,600 8,000 7,900 7,900 8,600 10,300 14,900 15,900 15,300 16,900
Közép-Dunántúl 5,400 7,800 7,900 8,000 8,500 9,900 13,600 14,500 12,800 14,800Nyugat-Dunántúl 5,800 7,500 7,900 8,200 5600 11,600 15,000 15,500 14,300 17,100
14
Household income and GDP on Nuts2 Level
Household income per capita (PPS) GDP per capita (PPS)
2000 2006 2008 2009 2011 2000 2006 2008 2009 2011
Austria 15,400 18,400 19,200 18,800 19,800 25,100 29,700 31,100 29,500 32,300
Lower Austria 15,600 18,800 19,800 19,300 20,600 20,700 24,200 25,700 24,200 26,600Vienna 17,300 19,200 19,700 19,200 19,800 34,600 39,300 40,300 38,300 41,300
Upper Austria 14,900 18,400 19,200 18,800 19,700 24,300 29,200 31,100 29,300 32,500
Burgenland 13,900 17,800 18,700 18,400 19,400 16,600 19,800 20,500 19,900 21,700
Czech Republic 7,000 9,400 9,600 9,900 10,200 13,500 18,900 20,200 19,400 20,300
Jihozápad 6,900 9,200 9,400 9,600 9,900 12,600 17,500 17,100 16,700 17,600
Jihovýchod 6,700 9,000 9,400 9,600 9,900 12,100 16,800 18,100 17,600 18,400
Slovakia 5,500 7,800 9,500 9,500 10,500 9,500 14,900 18,100 17,000 18,900
Bratislavský kraj 8,000 12,200 14,400 15,000 16,000 20,700 34,800 41,700 41,600 46,600
Západné Slovens. 5,200 7,700 9,500 9,400 10,700 9,000 14,800 17,300 16,000 18,100
Hungary 5,600 8,000 7,900 7,900 8,600 10,300 14,900 15,900 15,300 16,900
Közép-Dunántúl 5,400 7,800 7,900 8,000 8,500 9,900 13,600 14,500 12,800 14,800Nyugat-Dunántúl 5,800 7,500 7,900 8,200 5600 11,600 15,000 15,500 14,300 17,100

15
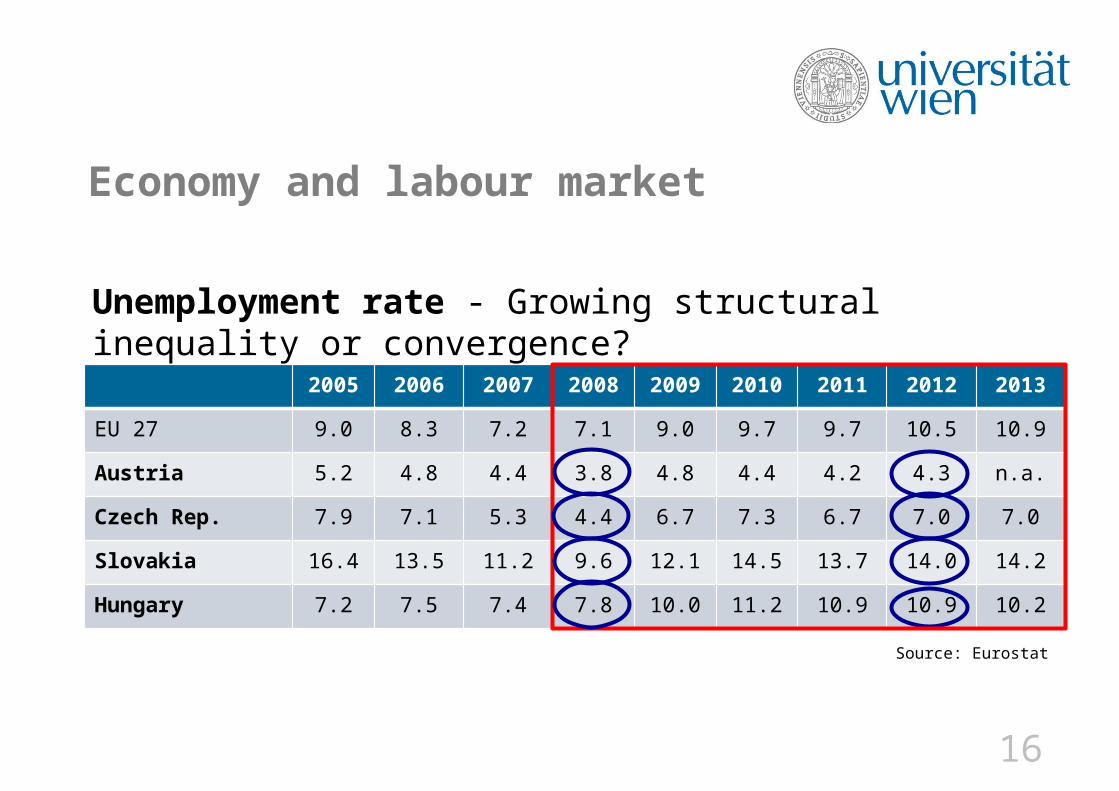
Economy and labour market
2005 2006 2007 2008 2009 2010 2011 2012 2013
EU 27 9.0 8.3 7.2 7.1 9.0 9.7 9.7 10.5 10.9
Austria 5.2 4.8 4.4 3.8 4.8 4.4 4.2 4.3 n.a.
Czech Rep. 7.9 7.1 5.3 4.4 6.7 7.3 6.7 7.0 7.0
Slovakia 16.4 13.5 11.2 9.6 12.1 14.5 13.7 14.0 14.2
Hungary 7.2 7.5 7.4 7.8 10.0 11.2 10.9 10.9 10.2
Unemployment rate - Growing structural inequality or convergence?
Source: Eurostat
16
Economy and labour market
2005 2006 2007 2008 2009 2010 2011 2012 2013
EU 27 9.0 8.3 7.2 7.1 9.0 9.7 9.7 10.5 10.9
Austria 5.2 4.8 4.4 3.8 4.8 4.4 4.2 4.3 n.a.
Czech Rep. 7.9 7.1 5.3 4.4 6.7 7.3 6.7 7.0 7.0
Slovakia 16.4 13.5 11.2 9.6 12.1 14.5 13.7 14.0 14.2
Hungary 7.2 7.5 7.4 7.8 10.0 11.2 10.9 10.9 10.2
Unemployment rate - Growing structural inequality or convergence?
Source: Eurostat
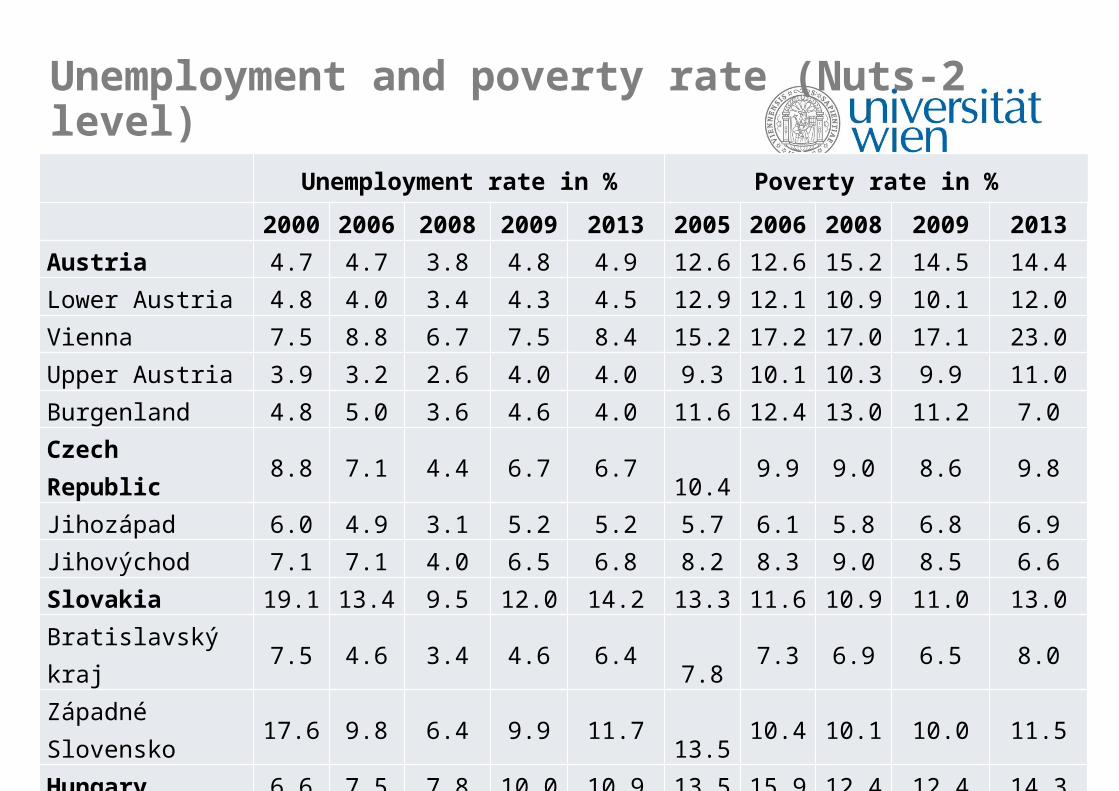
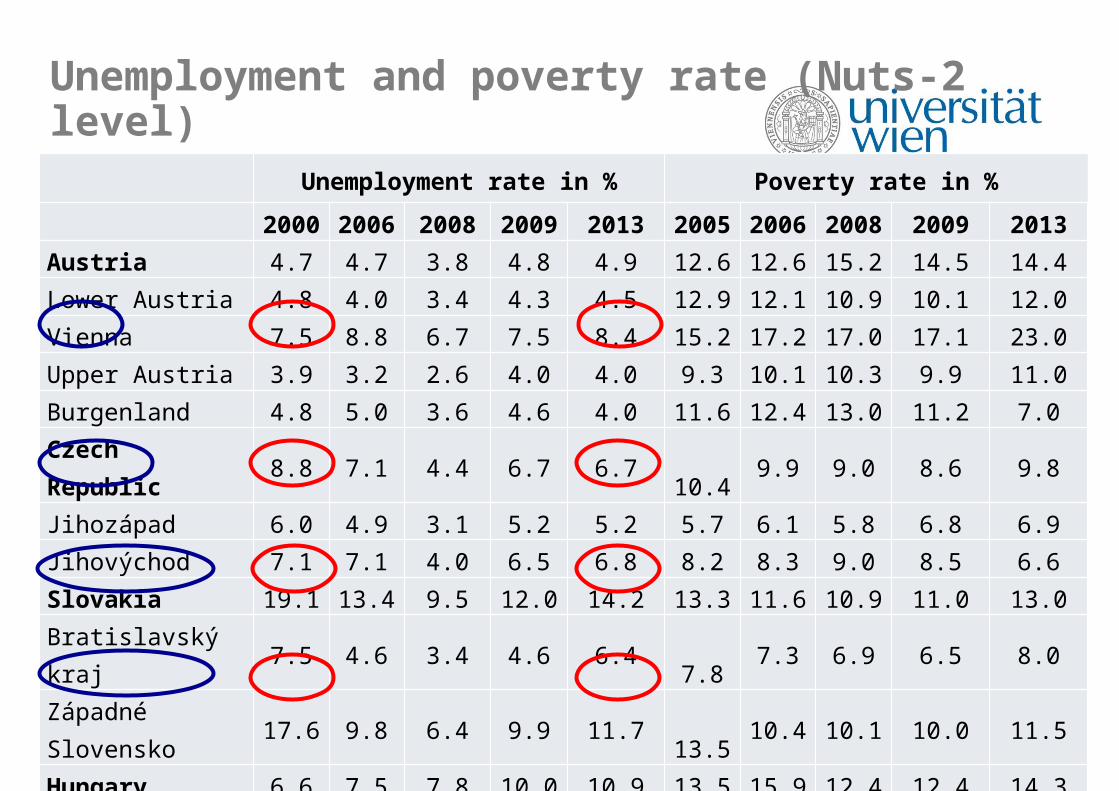
Unemployment and poverty rate (Nuts-2 level)
Unemployment rate in % Poverty rate in %
2000 2006 2008 2009 2013 2005 2006 2008 2009 2013Austria 4.7 4.7 3.8 4.8 4.9 12.6 12.6 15.2 14.5 14.4Lower Austria 4.8 4.0 3.4 4.3 4.5 12.9 12.1 10.9 10.1 12.0Vienna 7.5 8.8 6.7 7.5 8.4 15.2 17.2 17.0 17.1 23.0Upper Austria 3.9 3.2 2.6 4.0 4.0 9.3 10.1 10.3 9.9 11.0Burgenland 4.8 5.0 3.6 4.6 4.0 11.6 12.4 13.0 11.2 7.0Czech Republic 8.8 7.1 4.4 6.7 6.7 10.4 9.9 9.0 8.6 9.8Jihozápad 6.0 4.9 3.1 5.2 5.2 5.7 6.1 5.8 6.8 6.9Jihovýchod 7.1 7.1 4.0 6.5 6.8 8.2 8.3 9.0 8.5 6.6Slovakia 19.1 13.4 9.5 12.0 14.2 13.3 11.6 10.9 11.0 13.0Bratislavský kraj 7.5 4.6 3.4 4.6 6.4 7.8 7.3 6.9 6.5 8.0Západné Slovensko 17.6 9.8 6.4 9.9 11.7 13.5 10.4 10.1 10.0 11.5Hungary 6.6 7.5 7.8 10.0 10.9 13.5 15.9 12.4 12.4 14.3Közép-Dunántúl 5.2 6.0 5.8 9.3 8.8 11.1 13.3 9.8 11.5 11.9Nyugat-Dunántúl 4.4 5.7 4.9 8.6 7.8 - - - - -

20
Prices of consumer goods and services – Structural inequalitiy or convergence?
EU 27 120.20Czech Rep. 122.30Hungary 144.99Austria 119.44Slovakia 122.73
Harmonized Indices of Consumer Prices
Source: Eurostat, Feb. 2014Index reference period(2005 = 100).
21
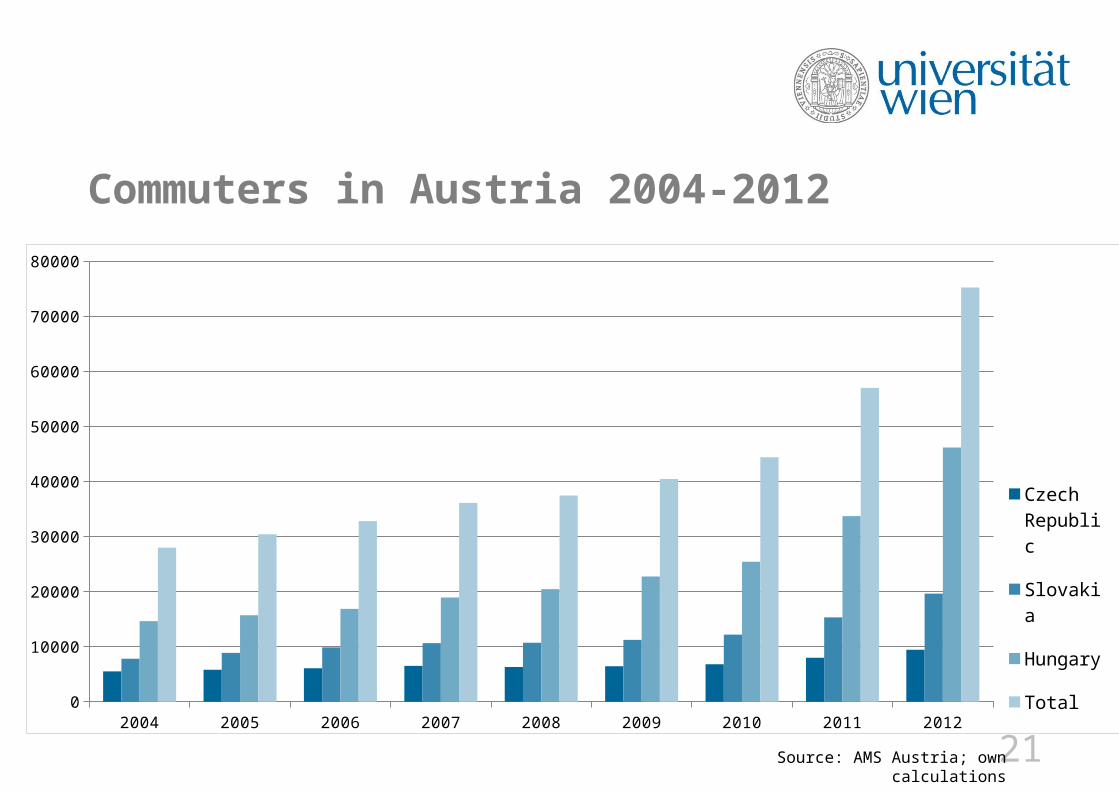
Commuters in Austria 2004-2012
2004 2005 2006 2007 2008 2009 2010 2011 20120
10000
20000
30000
40000
50000
60000
70000
80000
Czech Republic
Slovakia
Hungary
Total
Source: AMS Austria; own calculations

22
Conceptual Background
Fig. 1: Relation between key explanatory factors, job search methods and wages
Source: Extension of the model developed by Aguilera and Massey (2003: 676); original categories: human capital (nota bene, without including individual education), social capital, job search mechanism, formal sector job, wage level.
One key theoretical model
23
Selected key findings of the project

24
Expert interviews
• ‘There are a lot of people who fell into the credit trap. Many people in Hungary borrowed Swiss francs from a bank. A lot of them have pending execution proceedings, their houses have to be auctioned. […] To my opinion the rising demand [for information on employment in Austria] is clearly related to the financial crisis and the wish to escape from Hungary. One can speak of economic refugees that see their last chance in employment in a foreign country.’ EURES Employee, Hungary, 06/2012• ‘There are so much more people who try their luck than actual jobs. […]
There are a lot of people who want to work in Austria but only a few manage to get a job. Nowadays employers can choose from an enormous pool of applicants, so they really can select the best people. I talked to an employer the other day and he said he receives about 400-500 Emails for one single job offer.’ EURES Employee, Hungary, 06/2012
25
Expert interviews
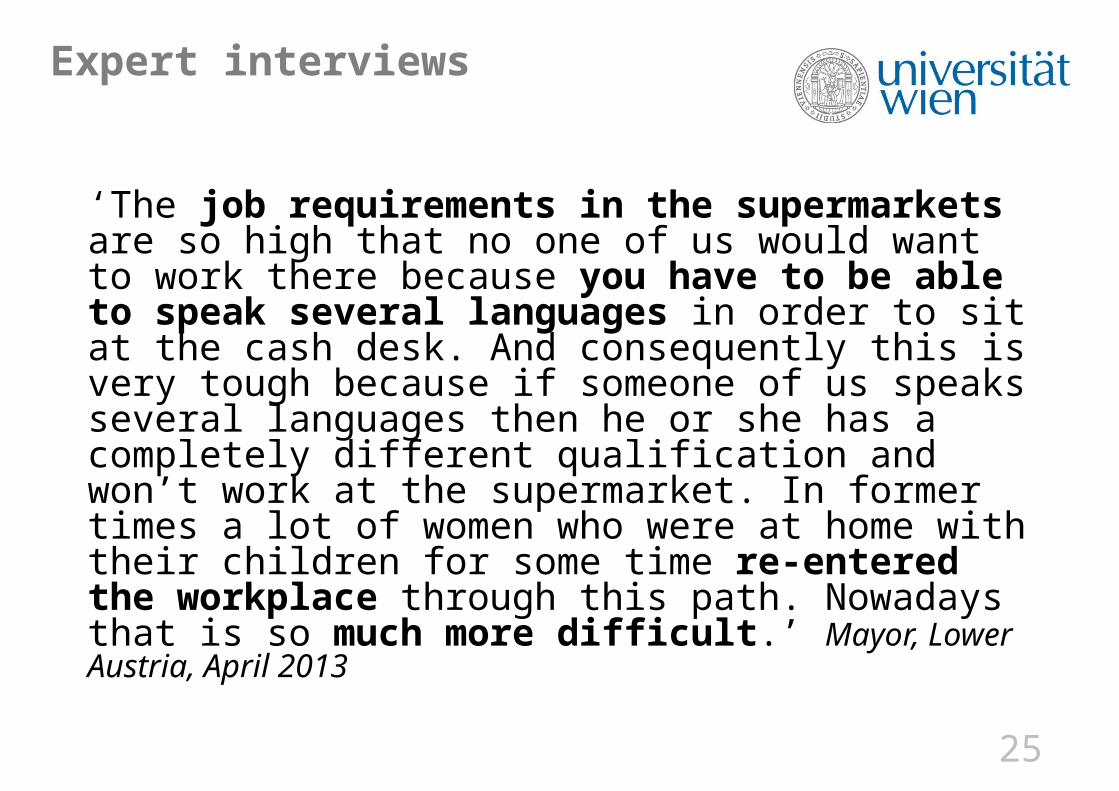
‘The job requirements in the supermarkets are so high that no one of us would want to work there because you have to be able to speak several languages in order to sit at the cash desk. And consequently this is very tough because if someone of us speaks several languages then he or she has a completely different qualification and won’t work at the supermarket. In former times a lot of women who were at home with their children for some time re-entered the workplace through this path. Nowadays that is so much more difficult.’ Mayor, Lower Austria, April 2013
26
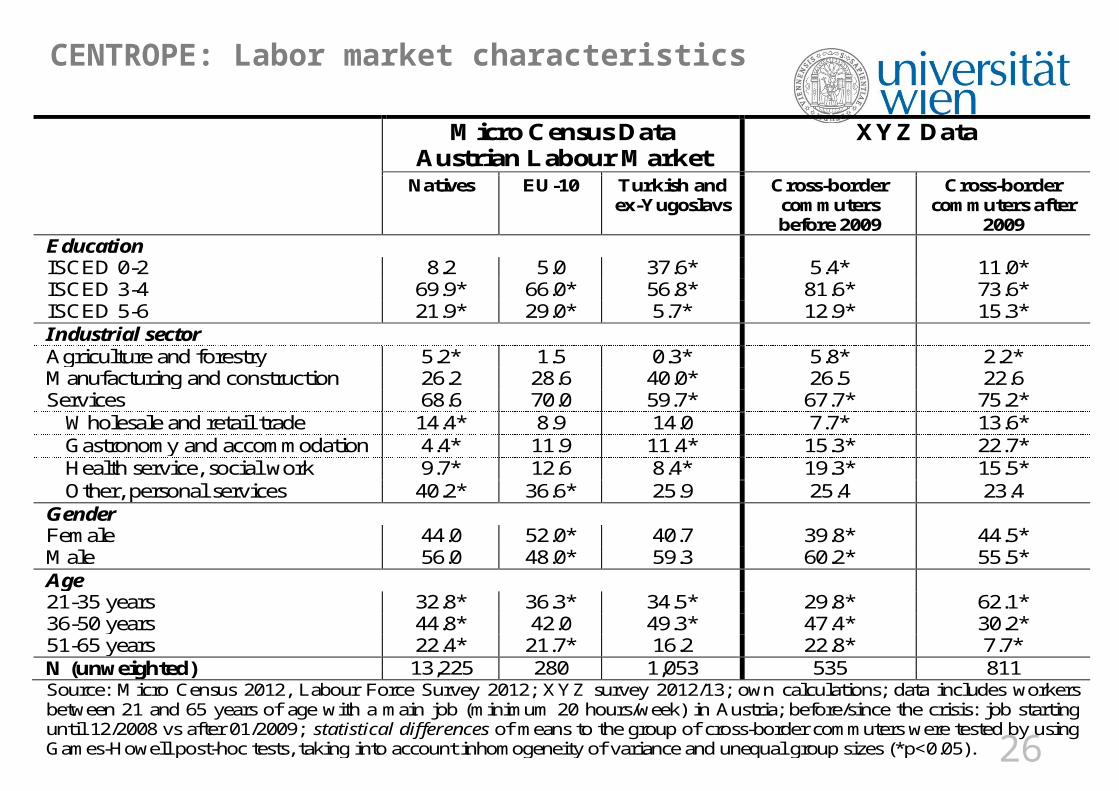
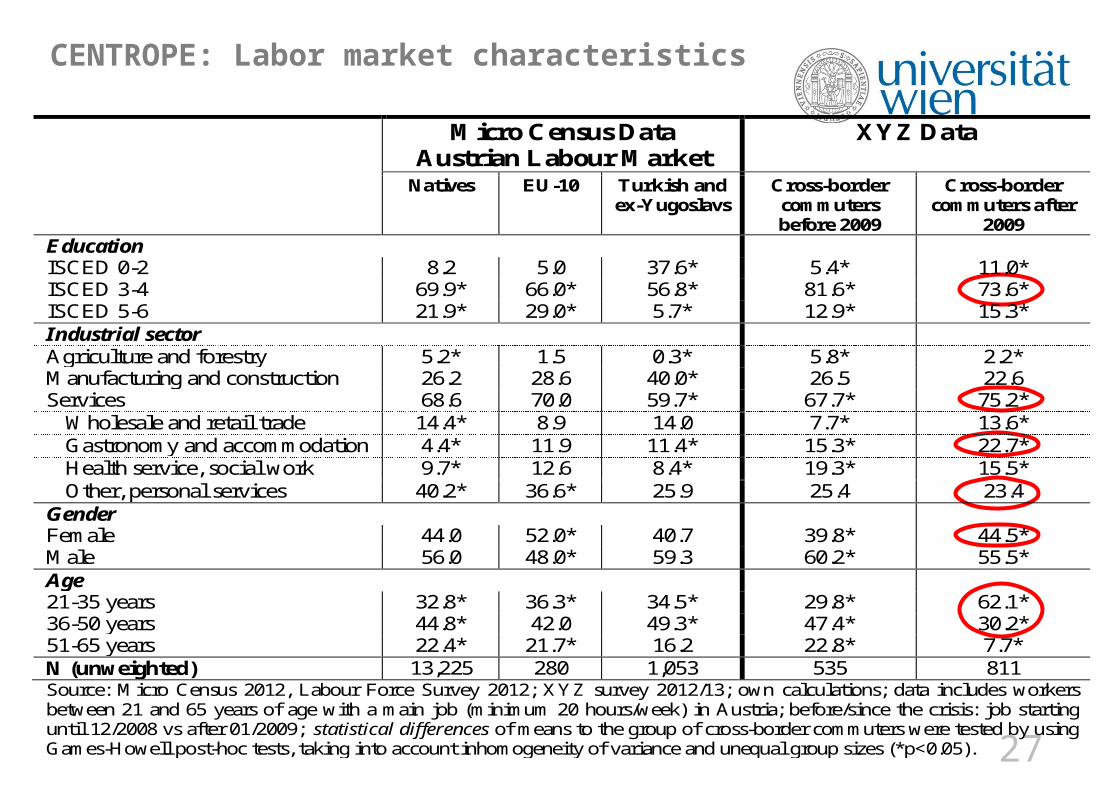
CENTROPE: Labor market characteristics
Micro Census Data Austrian Labour Market
XYZ Data
Natives EU-10 Turkish and ex-Yugoslavs
Cross-border commuters before 2009
Cross-border commuters after
2009 Education ISCED 0-2 8.2 5.0 37.6* 5.4* 11.0* ISCED 3-4 69.9* 66.0* 56.8* 81.6* 73.6* ISCED 5-6 21.9* 29.0* 5.7* 12.9* 15.3* Industrial sector Agriculture and forestry 5.2* 1.5 0.3* 5.8* 2.2* Manufacturing and construction 26.2 28.6 40.0* 26.5 22.6 Services 68.6 70.0 59.7* 67.7* 75.2*
Wholesale and retail trade 14.4* 8.9 14.0 7.7* 13.6* Gastronomy and accommodation 4.4* 11.9 11.4* 15.3* 22.7* Health service, social work 9.7* 12.6 8.4* 19.3* 15.5* Other, personal services 40.2* 36.6* 25.9 25.4 23.4
Gender Female 44.0 52.0* 40.7 39.8* 44.5* Male 56.0 48.0* 59.3 60.2* 55.5* Age 21-35 years 32.8* 36.3* 34.5* 29.8* 62.1* 36-50 years 44.8* 42.0 49.3* 47.4* 30.2* 51-65 years 22.4* 21.7* 16.2 22.8* 7.7* N (unweighted) 13,225 280 1,053 535 811 Source: Micro Census 2012, Labour Force Survey 2012; XYZ survey 2012/13; own calculations; data includes workers between 21 and 65 years of age with a main job (minimum 20 hours/week) in Austria; before/since the crisis: job starting until 12/2008 vs after 01/2009; statistical differences of means to the group of cross-border commuters were tested by using Games-Howell post-hoc tests, taking into account inhomogeneity of variance and unequal group sizes (*p<0.05).
27
CENTROPE: Labor market characteristics
Micro Census Data Austrian Labour Market
XYZ Data
Natives EU-10 Turkish and ex-Yugoslavs
Cross-border commuters before 2009
Cross-border commuters after
2009 Education ISCED 0-2 8.2 5.0 37.6* 5.4* 11.0* ISCED 3-4 69.9* 66.0* 56.8* 81.6* 73.6* ISCED 5-6 21.9* 29.0* 5.7* 12.9* 15.3* Industrial sector Agriculture and forestry 5.2* 1.5 0.3* 5.8* 2.2* Manufacturing and construction 26.2 28.6 40.0* 26.5 22.6 Services 68.6 70.0 59.7* 67.7* 75.2*
Wholesale and retail trade 14.4* 8.9 14.0 7.7* 13.6* Gastronomy and accommodation 4.4* 11.9 11.4* 15.3* 22.7* Health service, social work 9.7* 12.6 8.4* 19.3* 15.5* Other, personal services 40.2* 36.6* 25.9 25.4 23.4
Gender Female 44.0 52.0* 40.7 39.8* 44.5* Male 56.0 48.0* 59.3 60.2* 55.5* Age 21-35 years 32.8* 36.3* 34.5* 29.8* 62.1* 36-50 years 44.8* 42.0 49.3* 47.4* 30.2* 51-65 years 22.4* 21.7* 16.2 22.8* 7.7* N (unweighted) 13,225 280 1,053 535 811 Source: Micro Census 2012, Labour Force Survey 2012; XYZ survey 2012/13; own calculations; data includes workers between 21 and 65 years of age with a main job (minimum 20 hours/week) in Austria; before/since the crisis: job starting until 12/2008 vs after 01/2009; statistical differences of means to the group of cross-border commuters were tested by using Games-Howell post-hoc tests, taking into account inhomogeneity of variance and unequal group sizes (*p<0.05).
28
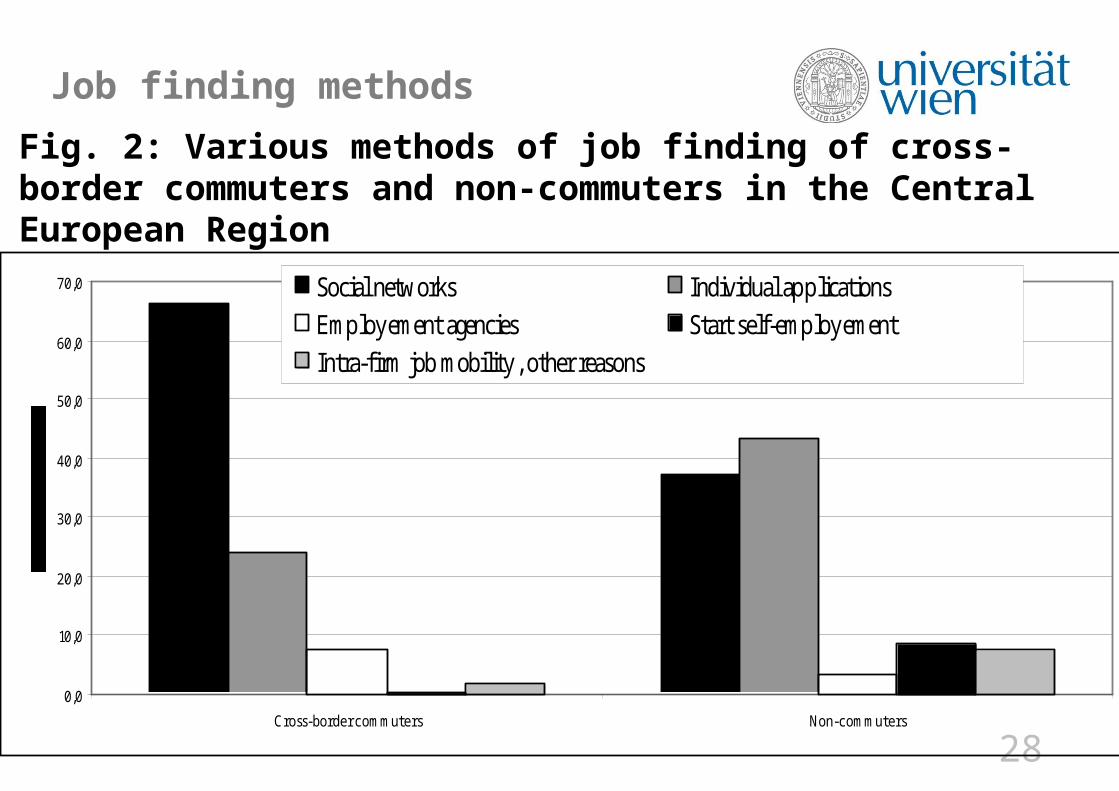
Job finding methods
Fig. 2: Various methods of job finding of cross-border commuters and non-commuters in the Central European Region
0,0
10,0
20,0
30,0
40,0
50,0
60,0
70,0
Cross-border commuters Non-commuters
Social networks Individual applications
Employement agencies Start self-employement
Intra-firm job mobility, other reasons
29
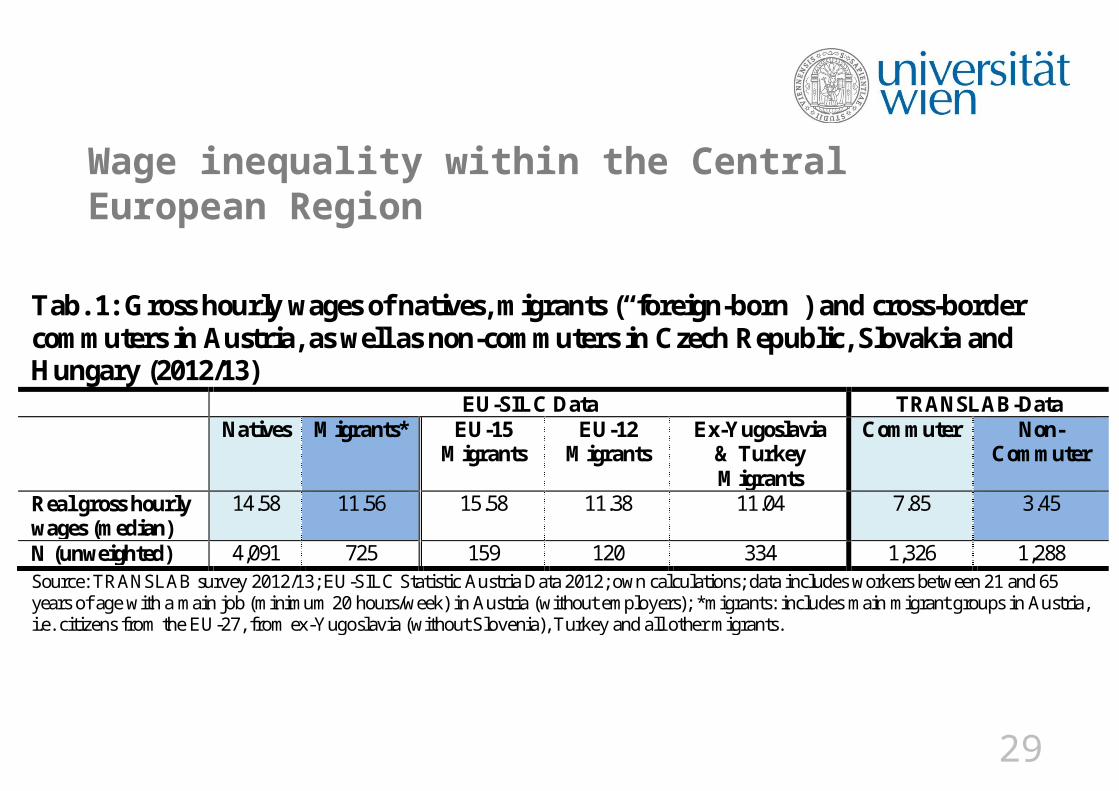
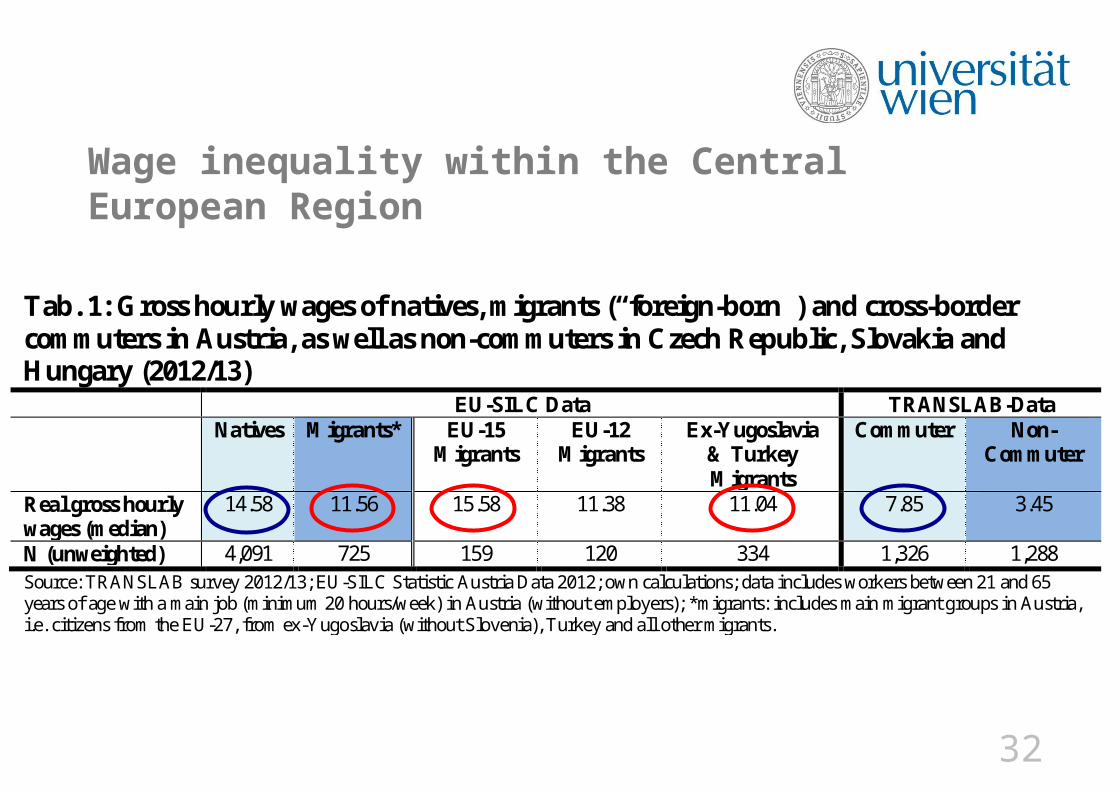
Wage inequality within the Central European Region
Tab. 1: Gross hourly wages of natives, migrants (“foreign-born”) and cross-border commuters in Austria, as well as non-commuters in Czech Republic, Slovakia and Hungary (2012/13) EU-SILC Data TRANSLAB-Data Natives Migrants* EU-15
Migrants EU-12
Migrants Ex-Yugoslavia
& Turkey Migrants
Commuter Non-Commuter
Real gross hourly wages (median)
14.58 11.56 15.58 11.38 11.04 7.85 3.45
N (unweighted) 4,091 725 159 120 334 1,326 1,288 Source: TRANSLAB survey 2012/13; EU-SILC Statistic Austria Data 2012; own calculations; data includes workers between 21 and 65 years of age with a main job (minimum 20 hours/week) in Austria (without employers); *migrants: includes main migrant groups in Austria, i.e. citizens from the EU-27, from ex-Yugoslavia (without Slovenia), Turkey and all other migrants.

30
Wage inequality within the Central European Region
Tab. 1: Gross hourly wages of natives, migrants (“foreign-born”) and cross-border commuters in Austria, as well as non-commuters in Czech Republic, Slovakia and Hungary (2012/13) EU-SILC Data TRANSLAB-Data Natives Migrants* EU-15
Migrants EU-12
Migrants Ex-Yugoslavia
& Turkey Migrants
Commuter Non-Commuter
Real gross hourly wages (median)
14.58 11.56 15.58 11.38 11.04 7.85 3.45
N (unweighted) 4,091 725 159 120 334 1,326 1,288 Source: TRANSLAB survey 2012/13; EU-SILC Statistic Austria Data 2012; own calculations; data includes workers between 21 and 65 years of age with a main job (minimum 20 hours/week) in Austria (without employers); *migrants: includes main migrant groups in Austria, i.e. citizens from the EU-27, from ex-Yugoslavia (without Slovenia), Turkey and all other migrants.
31
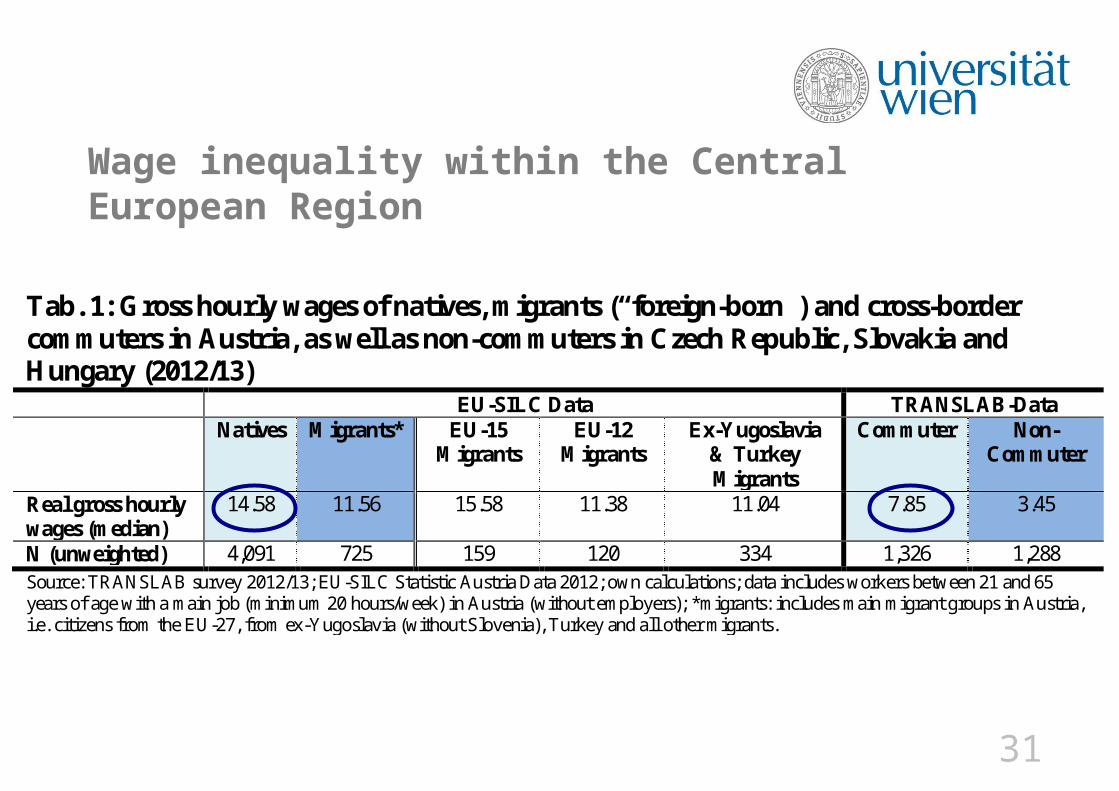
Wage inequality within the Central European Region
Tab. 1: Gross hourly wages of natives, migrants (“foreign-born”) and cross-border commuters in Austria, as well as non-commuters in Czech Republic, Slovakia and Hungary (2012/13) EU-SILC Data TRANSLAB-Data Natives Migrants* EU-15
Migrants EU-12
Migrants Ex-Yugoslavia
& Turkey Migrants
Commuter Non-Commuter
Real gross hourly wages (median)
14.58 11.56 15.58 11.38 11.04 7.85 3.45
N (unweighted) 4,091 725 159 120 334 1,326 1,288 Source: TRANSLAB survey 2012/13; EU-SILC Statistic Austria Data 2012; own calculations; data includes workers between 21 and 65 years of age with a main job (minimum 20 hours/week) in Austria (without employers); *migrants: includes main migrant groups in Austria, i.e. citizens from the EU-27, from ex-Yugoslavia (without Slovenia), Turkey and all other migrants.
32
Wage inequality within the Central European Region
Tab. 1: Gross hourly wages of natives, migrants (“foreign-born”) and cross-border commuters in Austria, as well as non-commuters in Czech Republic, Slovakia and Hungary (2012/13) EU-SILC Data TRANSLAB-Data Natives Migrants* EU-15
Migrants EU-12
Migrants Ex-Yugoslavia
& Turkey Migrants
Commuter Non-Commuter
Real gross hourly wages (median)
14.58 11.56 15.58 11.38 11.04 7.85 3.45
N (unweighted) 4,091 725 159 120 334 1,326 1,288 Source: TRANSLAB survey 2012/13; EU-SILC Statistic Austria Data 2012; own calculations; data includes workers between 21 and 65 years of age with a main job (minimum 20 hours/week) in Austria (without employers); *migrants: includes main migrant groups in Austria, i.e. citizens from the EU-27, from ex-Yugoslavia (without Slovenia), Turkey and all other migrants.

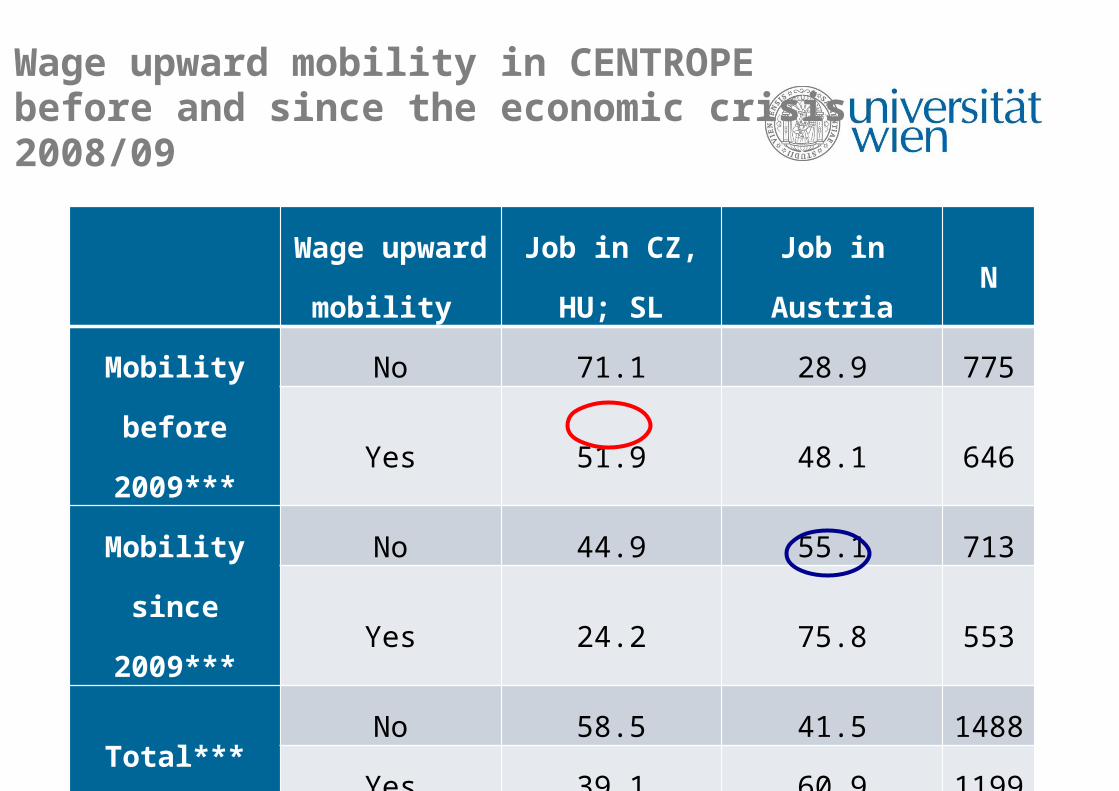
Wage upward mobility in CENTROPE before and since the economic crisis 2008/09
Wage upward mobility
Job in CZ, HU; SL Job in Austria N
Mobility before 2009***
No 71.1 28.9 775
Yes 51.9 48.1 646
Mobility since 2009***
No 44.9 55.1 713
Yes 24.2 75.8 553
Total***No 58.5 41.5 1488
Yes 39.1 60.9 1199
Wage upward mobility in CENTROPE before and since the economic crisis 2008/09
Wage upward mobility
Job in CZ, HU; SL Job in Austria N
Mobility before 2009***
No 71.1 28.9 775
Yes 51.9 48.1 646
Mobility since 2009***
No 44.9 55.1 713
Yes 24.2 75.8 553
Total***No 58.5 41.5 1488
Yes 39.1 60.9 1199

35
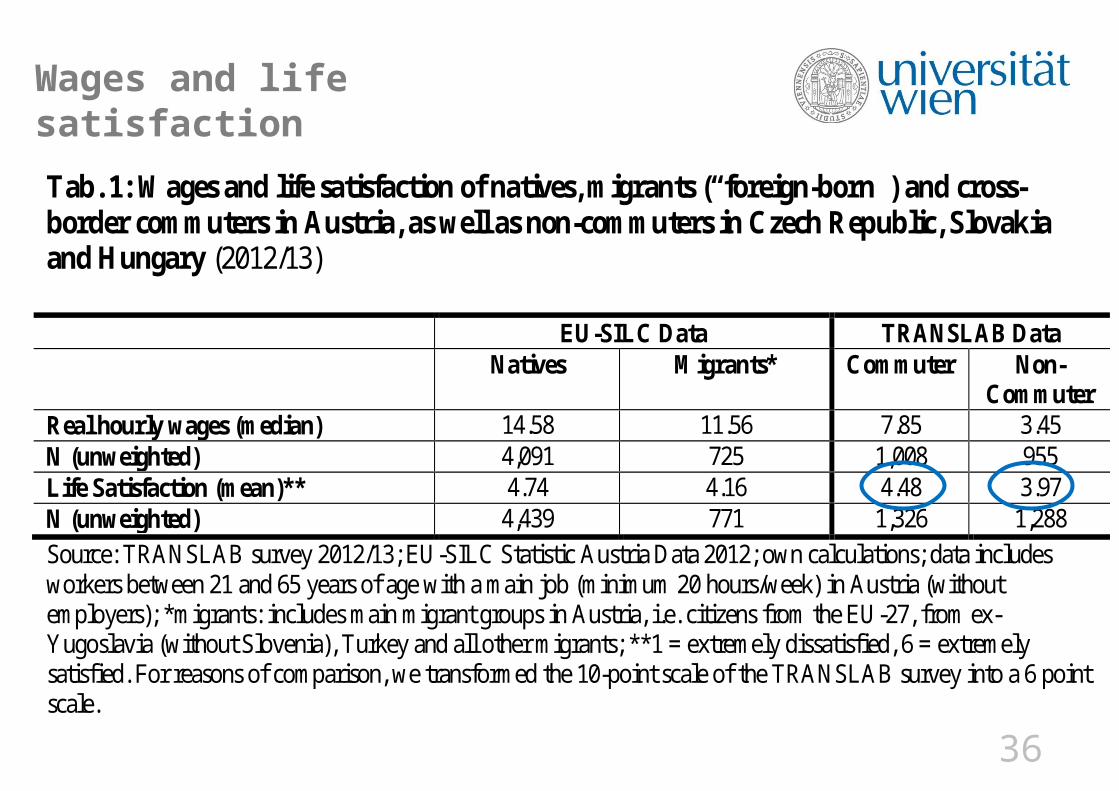
Wages and life satisfaction
Tab. 1: Wages and life satisfaction of natives, migrants (“foreign-born”) and cross-border commuters in Austria, as well as non-commuters in Czech Republic, Slovakia and Hungary (2012/13) EU-SILC Data TRANSLAB Data Natives Migrants* Commuter Non-
Commuter Real hourly wages (median) 14.58 11.56 7.85 3.45 N (unweighted) 4,091 725 1,008 955 Life Satisfaction (mean)** 4.74 4.16 4.48 3.97 N (unweighted) 4,439 771 1,326 1,288 Source: TRANSLAB survey 2012/13; EU-SILC Statistic Austria Data 2012; own calculations; data includes workers between 21 and 65 years of age with a main job (minimum 20 hours/week) in Austria (without employers); *migrants: includes main migrant groups in Austria, i.e. citizens from the EU-27, from ex-Yugoslavia (without Slovenia), Turkey and all other migrants; **1 = extremely dissatisfied, 6 = extremely satisfied. For reasons of comparison, we transformed the 10-point scale of the TRANSLAB survey into a 6 point scale.
36
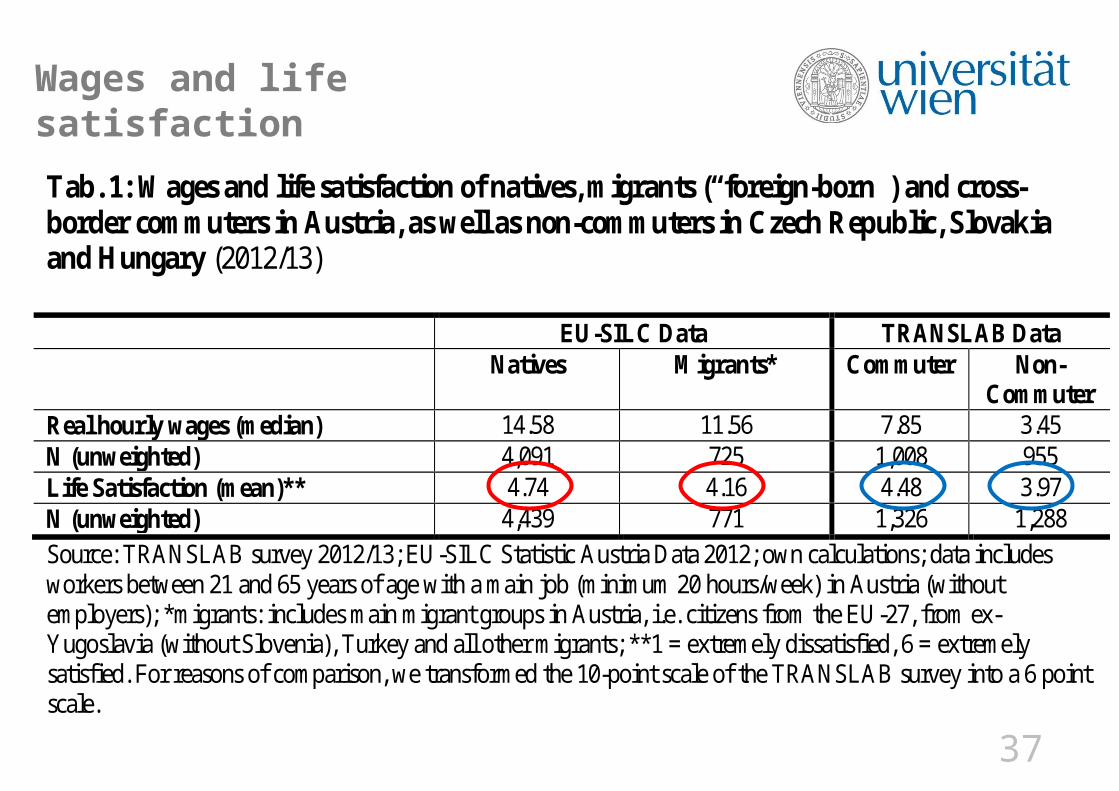
Wages and life satisfaction
Tab. 1: Wages and life satisfaction of natives, migrants (“foreign-born”) and cross-border commuters in Austria, as well as non-commuters in Czech Republic, Slovakia and Hungary (2012/13) EU-SILC Data TRANSLAB Data Natives Migrants* Commuter Non-
Commuter Real hourly wages (median) 14.58 11.56 7.85 3.45 N (unweighted) 4,091 725 1,008 955 Life Satisfaction (mean)** 4.74 4.16 4.48 3.97 N (unweighted) 4,439 771 1,326 1,288 Source: TRANSLAB survey 2012/13; EU-SILC Statistic Austria Data 2012; own calculations; data includes workers between 21 and 65 years of age with a main job (minimum 20 hours/week) in Austria (without employers); *migrants: includes main migrant groups in Austria, i.e. citizens from the EU-27, from ex-Yugoslavia (without Slovenia), Turkey and all other migrants; **1 = extremely dissatisfied, 6 = extremely satisfied. For reasons of comparison, we transformed the 10-point scale of the TRANSLAB survey into a 6 point scale.
37
Wages and life satisfaction
Tab. 1: Wages and life satisfaction of natives, migrants (“foreign-born”) and cross-border commuters in Austria, as well as non-commuters in Czech Republic, Slovakia and Hungary (2012/13) EU-SILC Data TRANSLAB Data Natives Migrants* Commuter Non-
Commuter Real hourly wages (median) 14.58 11.56 7.85 3.45 N (unweighted) 4,091 725 1,008 955 Life Satisfaction (mean)** 4.74 4.16 4.48 3.97 N (unweighted) 4,439 771 1,326 1,288 Source: TRANSLAB survey 2012/13; EU-SILC Statistic Austria Data 2012; own calculations; data includes workers between 21 and 65 years of age with a main job (minimum 20 hours/week) in Austria (without employers); *migrants: includes main migrant groups in Austria, i.e. citizens from the EU-27, from ex-Yugoslavia (without Slovenia), Turkey and all other migrants; **1 = extremely dissatisfied, 6 = extremely satisfied. For reasons of comparison, we transformed the 10-point scale of the TRANSLAB survey into a 6 point scale.

38
Conclusion• Structural increase in mobility. Various events have led to
dynamization of labour related mobility/migration in Centrope (e.g. changing legal framework).• Substantial wage inequality between natives, migrants and
commuters in the transnational labor market of Centrope.• Human capital, gender and labor market characteristics as well as the
job finding method serve as success factors for labor market outcomes (wages) among the cross-border commuters.
» formal education» language proficiency important for job search but not for wages!» migration experience» gender (-6% for women compared to men)» job finding via social networks» firm size and industrial sector
39
Conclusion
• Life satisfaction and income are strongly interrelated; further important determinants:
» age» language proficiency» industrial sector
•Overall, our findings highlight the fundamentally unequal opportunity structures of the transnational labor market of CENTROPE
40
Further questions
• Does cross-border labor commuting lead to decreasing economic imbalances between the sending and receiving regions?
• Further increase in cross-border commuting in the near future?
• Does increase in cross-border commuting facilitate the European integration process?
• Does cross border commuting contribute to new cleavages within the rural low-wage labor market sector (e.g. due to higher requirements of language proficiency in the service sector)?

41
Further questions
• Since analyzing income may only capture certain aspects of the relevant subjective assessment categories in a transnational work career we also raise some related questions in further research:
»What are important dimensions for assessing cross-border commuting trajectories?
»How do we define success in transnational commuting from the perspective of cross-border commuters?
»How relevant are qualifications for the occupational mobility in Austria and related outcomes in terms of life satisfaction?
»How are socio-economic disadvantages and discrimination perceived, and how do cross-border commuters cope with these experiences?
»And, in broad terms, does cross-border commuting to Austria lead to a higher life satisfaction than staying and working in the Czech Republic, Slovakia and Hungary?

43
APPENDIX

44
TRANSLAB: Data and methods I
• Research Project TRANSLAB „Cross-border Labour Mobility, Transnational Labour Markets and Social Differentiation in the Central European Region“ (funded by WWTF, 2012-2015)
• TRANSLAB applies a mixed-methods approach, following methods of „ethnosurvey“ data collection (Kalter 2011; Massey 1987; Massey, Espinosa 1997; Mullan, Frejka 1995; Wallace, Vincent 2007).
• Based on quota sampling the Department of Sociology (University of Vienna) and GfK Austria carried out a quantitative survey in 2012/2013 of N = 1,233 commuters to Austria and 1,340 non-commuters in the northeastern border regions giving on Austria.

45
TRANSLAB: Data and methods II
• Target Population were currently employed persons (at least 20 hours a week), aged 21 to 65 years which had their primary residence within regions bordering on Austria:
• South Moravia (Czech Republic)• Bratislava, Trnava (Slovakia)• Győr-Moson-Sopron, Vas (Hungary)
• Survey compiled information on reasons for cross-border commuting and non-commuting, current occupation and employment careers, geographical mobility, human capital, social demography, network integration and life satisfaction.
46
• Research Project TRANSLAB „Cross-border Labour Mobility, Transnational Labour Markets and Social Differentiation in the Central European Region“ , funded by WWTF, 2012-2015, headed by Prof. Roland Verwiebe and Prof. Christoph Reinprecht.
• Recent intra-European labour migration movements in the Central European Region (Centrope).
• Project’s focus is on migrants’ » reasons for migrating» labour market integration and occupational trajectory» integration into social networks and dynamics of social inequality.
TRANSLAB: Introduction
47
•What are the prevailing reasons for commuting in the Central European Region? To what extent do reasons for migration differ based on characteristics like age, sex, family status, qualifications and nationality? What are the central reasons for immobility?•How strong is the biographical embeddedness of decisions to
migrate? Are the decisions to migrate influenced by previous experiences of mobility?• In which branches and types of firms are commuters
employed? •What role do social networks and employment agencies like
European Employment Services (EURES) play for the occupational careers of commuters? Is getting a job through social networks as opposed to an employment agency associated with certain types of employment relations?
TRANSLAB: Research Questions

48
• Centrope is a EU program “that encourages cooperation among the countries of central Europe to improve innovation, … and to enhance the competitiveness … of their regions”.• EU Regional Fund; mainly economic agenda which is typical for
European integration process.• Long-lasting traditions of social exchange and cross-border
movements.• Structural inequalities remain to be relevant, especially after the
crisis 2008.
Centrope: policy goals
49
•Designed by Massey et al. to analyze the social processes of migration•Designed to operate at the community level•Annual interviews• “A full understanding of the migration process requires
information that is historically grounded, ethnographically interpreted, and quantitatively rigorous.
Ethnosurvey