Embed Size (px)
Citation preview

1
Cross-border banking in the EU since the crisis: what drives the great retrenchment?
This version: 17 July 2017
Lorenz Emter, European Central Bank
Martin Schmitz,
European Central Bank
Marcel Tirpák, European Central Bank
Abstract
Cross-border banking within the EU increased substantially prior to the global financial crisis, reversed significantly in its aftermath and stabilised at markedly lower levels compared to the pre-crisis peak. Cross-border interbank claims in the EU were most affected by this great retrenchment, whereas banks’ cross-border lending to the non-bank sector remained relatively stable. This paper uses a wide range of determinants of bilateral cross-border bank holdings in the EU such as indicators of banking sector health, macroprudential policies, bank levies and institutional quality. We identify high non-performing loans in source countries as an important impediment to cross-border lending within the EU after the crisis. We further show that macroprudential policy stringency in source countries is associated with reduced lending to the foreign non-bank sector. More stringent macroprudential measures in host countries however, are a pull factor for cross-border interbank lending, hinting at regulatory arbitrage opportunities via branches abroad. We also find evidence that bank levies and lower institutional quality in source countries act as a push factor for cross-border lending to the non-bank sector.
Keywords: cross-border lending, capital flows, deleveraging, financial integration, macroprudential policies, regulation, bank levy
JEL Classification numbers: F21, F30, G11, G15, G28
∗We are grateful to Cedric Tille, Philipp Hartmann, Richard Morris, as well as seminar participants at the ECB and participants at the ICMAIF 2017 conference, INFINITI 2017 conference 2017, INFER 2017 conference for insightful discussions and comments for insightful discussions and comments. The views expressed are those of the authors and do not necessarily reflect those of the European Central Bank.

2
0. Nontechnical summary
Cross-border banking within the EU increased substantially prior to the global financial crisis, reversed significantly in its aftermath and stabilised at markedly lower levels compared to the pre-crisis peak. Cross-border interbank claims in the EU were most affected by this great retrenchment, whereas banks’ cross-border lending to the non-bank sector remained relatively stable.
In this paper we examine the drivers of the great retrenchment in cross-border banking across EU countries in the aftermath of the global financial crisis. Our paper contributes to the existing literature by investigating a wide range of possible determinants of cross-border banking in an integrated framework. We investigate whether tightening of regulatory policies, an increasing relative tax burden on banks and the remnants of the global financial crisis manifested in persistently high shares of non-performing assets on banks’ balance sheets reduced cross-border banking integration in the EU.
We employ both a panel data approach for the period of 2001-2014, as well as a cross-sectional difference approach comparing the pre-crisis (2005-2007) and post-crisis (2013-2015) periods. We show that an important driver of cross-border bank lending in the EU and in particular since the global financial crisis has been poor banking sector health as captured by high NPL ratios. Cross-border lending would be significantly higher if banks were not constrained by the unresolved financial sector problems and legal framework bottlenecks associated with the high post-crisis NPL levels in their countries of residence.
Turning towards the estimates of the effect of macroprudential policies on cross-border claims, we find that more stringent policies in the home countries of bank reduce their cross-border lending to the non-bank sector. Furthermore, we identify tighter macroprudential policies aimed at lenders in the host country as a pull factor for cross-border interbank lending which could be interpreted as a sign of regulatory arbitrage in the EU, with banks increasing lending to their affiliates abroad which are not subject to tighter regulation in the host country. Finally, we find that bank levies in a bank’s country of residence increases cross-border lending to the non-bank sector. We take this as evidence that the introduction of bank levies after the financial crisis did not have an adverse effect on cross-border bank lending in the EU, but might have shifted the composition of cross-border lending.
Our results present a strong case for completing the Banking Union. First, remaining possibilities of regulatory arbitrage should be tackled by increasing use of reciprocity agreements. Second, the rulebook for financial actors in the EU needs to be amended by a chapter on a harmonised approach to NPL resolution, complemented with country-specific elements in each high-NPL constituency, as stressed by Constâncio (2017), in order to allow for a resumption of the cross-border banking integration process in the EU.

3
1. Introduction
Cross-border banking in the European Union (EU) has undergone three distinct episodes over the past two decades. The first episode – culminating at the time of the global financial crisis – featured dynamically growing cross-border financial integration. Private other investment flows as recorded in balance of payments statistics, which mostly reflect cross-border banking flows, stood, on average, at 10% of EU GDP during the 2005-2007 period (see Figure 1). The second episode – triggered by the global financial crisis – brought financial integration to a halt, albeit with varying impact across countries. Finally, precipitous deleveraging and retrenchment in the aftermath of the global financial crisis, amplified by the euro area sovereign debt crisis were followed by a subdued recovery. During this period banks located in the EU reduced their cross-border claims more significantly compared to banks located elsewhere. Their cross-border claims fell by about 25% from the pre-crisis peak (see Figure 2) and have not recovered since. Strikingly, domestic bank lending has not recorded such a decline and has consistently been above pre-crisis levels (see Figure A.2). A special focus on the EU is warranted not only because of the severity in the retrenchment of EU banks’ cross-border assets, but moreover EU banks account for around 50% of global cross-border bank claims. The sharp and sustained reduction in intra-EU claims, which make up 60% of total EU cross-border claims, is the major driver of this development in recent years (see Figure 3).
Figure 1: Private other investment flows in the EU 4-quarter moving average, % of GDP
Figure 2: Global cross-border banking claims Index, 2008q3 = 100, 4-quarter moving average
Source: ECB, authors’ calculations. Source: BIS (LBS), authors’ calculations. Note: Total cross-border claims of banks based in all BIS reporting countries (global), EU reporting countries (EU), and non-EU reporting countries (non-EU).
In this paper we examine the drivers of the retrenchment in cross-border banking within the EU using data on bilateral cross-border bank holdings. Our paper contributes to the existing literature by investigating a wide range of possible determinants of cross-border banking in an integrated framework. As key explanatory variables, we employ indicators of banking sector health, macroprudential policies, banking sector taxation, and institutional quality. This choice of variables is motivated by the fact that the post-crisis period in the EU banking sector was marked by a deterioration in asset quality as well as the increasing use of macroprudential measures and banking sector taxation (see Figure 4).

4
Figure 3: EU cross-border claims Index, 2008q3 = 100, 4-quarter moving average
Figure 4: Intra-EU claims, policy measures, and banking sector health
Source: BIS (LBS), authors’ calculations. Note: Cross-border claims of banks based in all BIS reporting countries in the EU on all countries (EU), other EU countries (intra-EU) and non-EU countries (extra-EU).
Sources: BIS LBS, Eurostat, Cerutti et al. (2016), World Bank GFDD, authors’ calculations. Note: Cross border claims is the sum of bilateral cross border claims of banks in 15 EU countries, which report to the BIS, on the bank and non-bank sectors located in 28 EU countries. Bank tax measures tax receipts from bank levies relative to gross income of banks. Macroprudential policy measures index is the average count of macroprudential policy measures implemented. Non-performing debt instruments as percentage of total gross loans.
Our paper contributes to several strands of the existing literature. The first strand analyses recent developments in international capital flows since the global financial crisis. McQuade and Schmitz (2017) conclude that global capital flows have settled at a far more moderate level in the post-crisis period compared to what was observed prior to the financial crisis. The onset of the global financial crisis led to a precipitous decline in international financial flows, representing an abrupt interruption of the financial globalisation process (Milesi-Ferretti and Tille, 2011; Lane, 2013). Broner et al. (2013, 2014) find that gross capital flows are pro-cyclical and collapse during financial crises. The importance of global factors for gross international capital flows, specifically common risk factors, is highlighted by Forbes and Warnock (2012). Furthermore, Rey (2015) shows that capital flows are strongly correlated across different types and regions due to a global financial cycle. There are several studies, which focus on cross-border banking flows.1 Forbes et al. (2016) note that the decline in global capital flows was particularly pronounced in cross-border bank lending. Cerutti and Claessens (2016) document the retrenchment of cross-border bank lending in the aftermath of global financial crisis, describing it as “the great cross-border bank deleveraging”, which was particularly pronounced for European banks (McGuire and von Peter, 2016). Furthermore, Amiti et al. (2017) show that during crisis times, cross-border bank flows are affected by idiosyncratic supply shocks to a borrower country’s creditor banks. More specifically, potential determinants of “financial deglobalisation” (Forbes, 2014), include an increase in home bias (Gianetti and Laeven, 2012), government intervention in the banking system (Rose and Wieladek, 2014), banks’ vulnerabilities (Cerutti and Claessens, 2016), and regulatory tightening (Bremus and Fratzscher, 2015; Ichiue and Lambert, 2016).
The second strand of literature analyses international spillovers following the implementation of macroprudential policies. Overall, there is no consensus in the literature on the impact of tighter macroprudential policies on cross-border bank flows. Some studies highlight the role of regulatory
1 For evidence of the significant impact of cross-border banking flows on real economic activity see, for example, Peek and Rosengreen (2000).
5
arbitrage, which could increase cross-border banking exposures, while others stress that adhering to more stringent rules is costly for banks, which in turn reduce cross-border exposures. Houston et al. (2012) provide some evidence of regulatory arbitrage, i.e. banks exploiting differences in regulation by concentrating more on markets offering less restrictive regulation, for the period before the global financial crisis (i.e. 1996-2007). Ongena et al. (2013) show that tighter regulation at home is associated with lower bank lending standards abroad. Bremus and Fratzscher (2015) find that increasing independence and power for supervisory authorities at home leads to credit flowing abroad, while for the euro area they show that more stringent capital requirements reduce cross-border banking activity. Reinhardt and Sowerbutts (2015) document the differential impact of various macroprudential policies on cross-border borrowing. They find that more stringent capital requirements lead to a higher demand from the non-bank sector for funds from banks operating across the border. This effect is absent however if macroprudential actions target lending standards (i.e. loan-to-value ratio). Fahr and Zochowski (2015) and Buch and Goldberg (2016) also stress that international spillovers vary across prudential instruments. Other studies stress the dampening effect macroprudential regulation may have on cross-border banking. Forbes et al. (2016) find that interaction between prudential regulations and unconventional monetary policy explain roughly 30% of the contraction in aggregate UK cross-border bank lending which corresponds to around 10% of the global contraction. Finally, Ichiue and Lambert (2016) suggest that tighter regulatory standards could explain around half of the decline in non-resident lending-to-GDP ratio in the aftermath of the global financial crisis.2
Regarding banking sector characteristics, McGuire and von Peter (2016) stress the importance of bank health at the group level finding that banks with larger credit losses spread credit contractions across many countries. Cerutti and Claessens (2016) explore the effect of a range of performance and vulnerability indicators on cross-border banking. They conclude that cross-border deleveraging during the height of the global financial crisis largely varied in line with markets’ prior assessments of banks’ vulnerabilities. We extend their analysis by considering the role of banking sector performance indicators in the post-crisis period showing that negative spillover effects from high non-performing loans (NPL) on cross-border loans within the EU are significant, as for example noted by the European Commission (2017).
The literature analysing the impact of sectoral taxes on cross-border banking is scarce. Huizinga et al. (2014) find that banks almost fully pass on double taxation cost through higher interest margins abroad, while they also show that double taxation reduces banking-sector foreign direct investment. Cerutti et al. (2015) include a ‘levy/tax on financial institutions’ in their macroprudential policy index (MPI) and report that tax measures dampen overall credit growth in developing countries. In our paper, we treat banking sector taxes separately from macroprudential measures and construct a measure of the extra tax burden on the banking sector arising from newly introduced bank levies.
The remainder of this paper is organised as follows. Section 2 provides stylised facts about the retrenchment in cross-border banking in the EU. Section 3 presents our empirical strategy and discusses our explanatory variables. Section 4 provides the main empirical results. Section 5 presents several robustness checks and Section 6 concludes.
2. Cross-border banking in the EU – stylised facts
2 There are several studies monitoring the implementation of macroprudential policies and estimating their impact on the local economy. These include Cerutti et al. (2015) who construct an index of macroprudential policies for a wide sample of countries. They find that once implemented, these policies reduce real credit growth. However, their impact is lower for financially mature and open economies, which could hint to possible circumvention of macroprudential policies. In a more recent paper Cerutti et al. (2016) provide a more granular view on macroprudential policies by constructing an index tracking their stringency.

6
Data on bilateral cross-border banking positions are gathered from the Bank for International Settlements’ (BIS) databank on locational banking statistics. The locational banking statistics (LBS) detail at the country level the geographical composition of banks’ balance sheets at quarterly frequency. They capture outstanding claims and liabilities of banking offices located in the BIS reporting countries, including intragroup positions.3 Therefore changes in the bilateral cross-border positions reported in the BIS locational banking statistics approximate well capital flows intermediated by banks between source and host countries. The choice of locational versus consolidated data is often not discussed in depth in the literature and there is no consensus on which type of the BIS banking data should generally be used. Following Kleimeier et al. (2013) we argue that the residence-based approach in the LBS capture cross-border banking flows in a manner most consistent with balance of payments statistics. Thus, we focus solely on cross-border banking, excluding local claims of branches and subsidiaries reported in the BIS consolidated banking statistics. We use data on the 28 EU countries, out of which 15 countries are reporting to the BIS.4 We perform several types of adjustments of the original data reported by the BIS, among other things, to fill the missing observations and eliminate exchange rate-related valuation effects (the latter in line with Cerrutti and Classen, 2016; Cerutti, 2015; and Kleimeier et al., 2013).5
The BIS data allow for a granular breakdown of banks’ cross-border positions into claims vis-à-vis banks and the non-bank sector as well as into different categories of financial instruments. Zooming in on cross-border claims (see Figure 5), we observe that loans and deposits (in blue) were most affected by the retrenchment after the global financial crisis. Within cross-border loans and deposits banks reduced their exposures most vis-à-vis other banks (see Figure 6). At the end of 2015, cross-border interbank lending was more than 40% below its pre-crisis peak, while cross-border lending to the non-bank sector was around its pre-crisis level. Hence, in the following analysis we distinguish between claims in loans and deposits vis-à-vis other banks and non-bank sector.
Figure 5: Cross-border claimsEUR trillion
Figure 6: Cross-border claims vis-à-vis the banking sector
EUR trillion
Source: BIS (LBS), authors’ calculations. Note: Sum of cross-border claims of 15 EU reporting countries on EU28 countries.
3 The BIS also collects data on banks’ country risk exposures and reports them as the consolidated banking statistics (CBS). They include the cross-border consolidated positions of banks headquartered in the BIS reporting countries, including positions of their foreign affiliates net of intragroup positions. See Annex Figure A.1 for an illustration of the BIS locational banking data. 4 The reporting countries are Austria, Belgium, Denmark, Finland, France, Germany, Greece, Ireland, Italy, Luxembourg, Netherlands, Portugal, Spain, Sweden, and the United Kingdom. 5 We can therefore rule out the impact of valuation effects due to exchange rate changes which are particularly relevant as large exchange rate movements tend to coincide with contractions in cross-border lending (Avdjiev and Takats, 2014). For further details on the adjustment of the cross-border claims series see Annex A.1.

7
Banks’ cross-border deleveraging after the global financial crisis was not only heterogeneous across counterparty sectors and financial instruments, but also across country pairs within the EU (see Figure 7).6 When looking at the change in average bilateral cross-border claims in loans and deposits between the pre-crisis (2005-2007) and the post-crisis (2013-2015) periods, we observe that for some country pairs the retrenchment between the two periods was significant (dark red), while for others cross-border positions actually increased (dark green). Several interesting observations emerge: first, there is no single source country that reduced its cross-border exposures against all host countries. Second, an increase of cross-border positions between the two periods was not so rare, as one may have expected.7 Third, many source countries heavily reduced exposures vis-à-vis Austria, reflecting the severe banking sector issues that evolved in the country after the financial crisis. Although less pronounced, Belgium, Greece, Ireland, Portugal and Italy also exhibited retrenchment of cross-border lending from most countries. Overall, the changes in banks’ bilateral cross-border positions after the crisis were quite heterogeneous, which we in turn exploit in the following regression-based analysis examining the underlying drivers of these developments.
Figure 7: heterogeneity in retrenchment across country pairs
Source: BIS (LBS), authors’ calculations. Note: Change in average bilateral cross-border claims in loans and deposits on all sectors between the pre-crisis (2005-07) and the post-crisis (2013-2015) period. Dark red indicates high negative values (i.e. retrenchment) and dark green indicates high positive values.
3. Empirical strategy
3.1 Empirical specifications
In a first step, we employ a gravity model approach using the full panel dimension of the dataset, which provides insights on determinants of cross-border lending in the EU between 2001 and 2014.
(1)
6 See Figure A.3 in the annex for an illustration of the status quo in the level of financial integration via cross-border banking in the EU. 7 Financial centres, through which banking flows from other jurisdictions are often intermediated present a special case. For example, cross-border claims of EU countries on Luxembourg remained mostly unaffected by the crisis or even increased.

8
In this specification, , , and are source and host country fixed effects, as well as year fixed
effects, respectively. While the former two control for unobserved country heterogeneity in source and host countries, the latter tackle common shocks, the importance of which were stressed for instance by Forbes and Warnock (2012) and Rey (2015).
We estimate this equation by OLS, sequentially using data on cross-border claims in loans and deposits vis-à-vis banks and the non-bank sector as the dependent variable. Cross-border loans and deposits are not only the most direct channel of cross-border banking, but were also most affected by the retrenchment after the crisis (as discussed in the previous Section). By separately analysing loans and deposits to banks and non-banks, we account for the fact that developments in cross-border lending to these two sectors and their determinants might differ.
Our main variables of interest include macroprudential policies (MPI), non-performing loans (NPL) and institutional quality (WGI) and are discussed in more detail below. In addition, the matrix
includes push and pull factors of cross-border banking flows such as short- and long-term interest rates, GDP (Herrmann and Mihaljek, 2010; Bremus and Fratzscher, 2015) and variables used in gravity models of international finance such as bilateral distance, bilateral trade and common language and legal origin indicators (Hellmanzik and Schmitz, 2016).8
Claessens (2016) stresses that using bilateral data allows for separating demand from supply factors, since banking systems in various countries face similar demand from a given host country. Hence, relative differences in bilateral lending patterns likely reflect supply-side differences (except for specific bilateral lender–borrower factors, which we control for). We include source and host country fixed effects in our baseline specification and simultaneously control for economic activity in both the source and host countries. Thus, we further alleviate concerns that shifts in lending across the border reflect demand factors. Econometrically, time-varying host country fixed effects would fully capture developments in host countries’ demand. However, including them would wipe out all variation in host country specific variables which are relevant for our analysis as well.9
In a second step, we seek to identify the structural drivers of the changes in EU cross-border banking between the pre-crisis period (2005-2007) and the post-crisis period (2013-2015). To this end we follow the approaches presented by Galstyan and Lane (2013) and Bremus and Fratzscher (2015) and estimate a cross-sectional specification in which most variables are averaged for the respective period and then expressed as differences between the two time windows, except for the time invariant gravity variables, which are reported in levels, and some variables capturing initial conditions.
∆ ln ∆ ∆ ∆ ∆ ∆ ∆
∆ ∆ (2)
In equation (2) ∆ ln ln denotes the change in claims of country i
(source) on country j (host) between the pre- and post-crisis periods. Furthermore, we also control for the pre-crisis level of bilateral trade and bilateral cross border claims following Galstyan and Lane (2013) who find a “reversion to the mean” effect showing that cross-border positions were cut most in the countries where pre-crisis holdings (initial stocks) were the largest.
3.2 Main explanatory variables
Our first explanatory variable of interest is the ratio of non-performing loans to total gross loans ( ) obtained from the World Bank’s Global Financial Development Database (GFDD). We use this 8 The macroeconomic variables are obtained from the IMF’s International Financial Statistics (IFS) and World Economic Outlook databases and the gravity controls are taken from the CEPII database and Mayer and Zignago (2011). 9 As a robustness check we run the regressions including time-varying host and source country fixed effects (see Section 5 for further details).
9
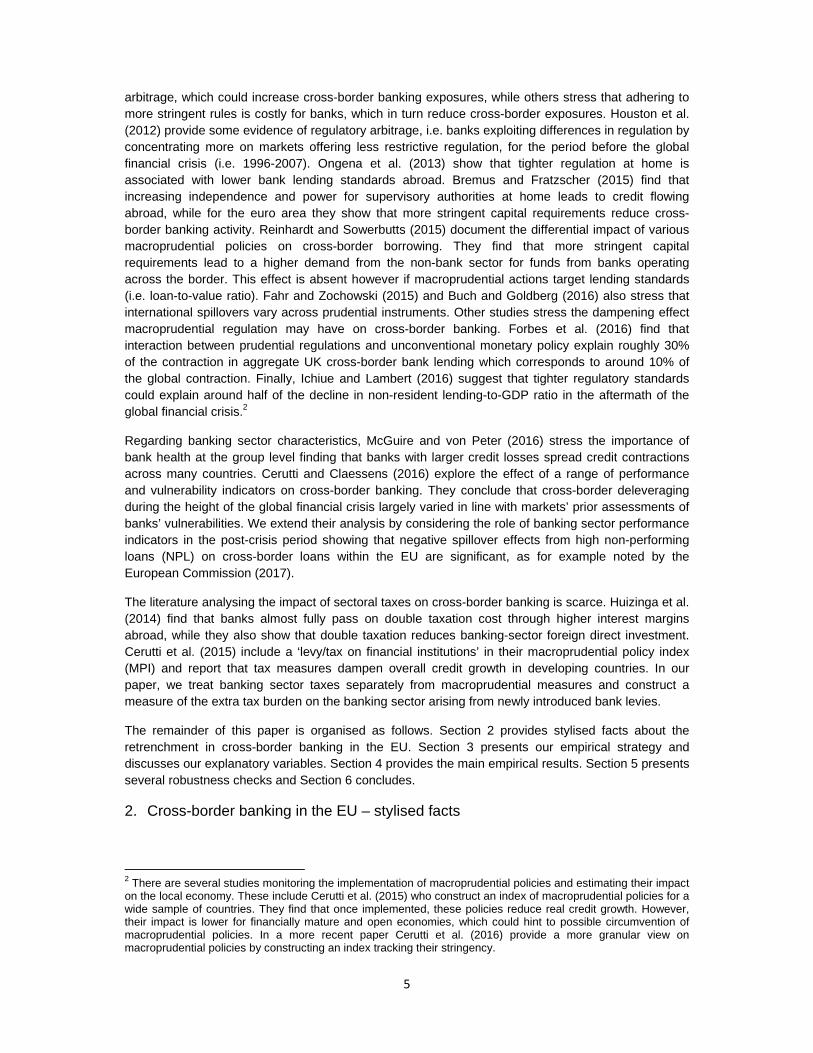
variable as a general measure of banking sector health that signals asset quality problems of the banking sector. A high NPL ratio can be interpreted as an indicator of unresolved financial sector problems, legacy issues and legal framework problems. Furthermore, high NPL ratios, as also evidenced by a negative correlation with return on equity (see Figure 8), weigh on banks’ profitability (Constâncio, 2017) and constrain the ability of banks to provide financing to the economy (ECB, 2017). Developments in NPL ratios have been heterogeneous across the EU in recent years. While, for example, NPL ratios in Greece, Ireland, and Cyprus reached high double-digit values during the period considered, they remained low or even decreased in countries such as Germany or the UK (see Figure 9). One possible source of international spillovers from high NPL arises when banks with asset quality problems cut back their cross-border lending activities and thereby reduce credit supply in other countries (European Commission, 2017).
Figure 8. Return on equity and NPL ratios In percent; 2015
Figure 9. Change in NPL ratios Percentage point change, 2007-2015
Source: World Bank’s GFDD. Note: All EU countries are included in the Figure, with the exception of Cyprus and Greece (to improve readability). The inclusion of both countries accentuates the negate correlation shown in the chart.
Source: World Bank’s GFDD. Note: Dark red indicates high increases in NPL ratios, light red indicates low increases or decreases.
To assess the role of macroprudential policies we construct an index of macroprudential stringency using a database compiled by Cerutti et al. (2016). The database covers six types of commonly implemented macroprudential instruments in 64 countries over the period between 2000Q1 and 2014Q4, namely capital requirements, sector-specific capital buffers, interbank exposure limits, concentration limits, loan-to-value (LTV) ratio limits, and reserve requirements.10 Cerutti et al. (2016) report on changes in their intensity of usage, i.e., the database records the changes in a policy instrument with a value of “1”, “-1” or “0” in a given quarter if the prudential tool was tightened, loosened, or remained unchanged, respectively.11 We construct an annual index of macroprudential stringency by summing the quarterly changes in all instruments for any given year and subsequently across all instruments (thereby excluding reserve requirements, which have often been used for monetary policy rather than macroprudential purposes in the EU). Our final macroprudential policy index ( ) is the cumulative sum of the prudential policy changes since the first quarter of 2000. This cumulative index should well capture the level of “tightness” (“looseness”) of prudential policy in a given country over time. In particular, we alleviate concerns about cross-country comparability due to, for example, differences in the level of an instrument in 2000, by using country fixed effects and
10 Cerutti et al. (2016) provide no information on Cyprus, which we exclude from the further analysis. 11 Cerutti et al. (2016) furthermore code the prudential policy indices as missing if a given tool is not available in a particular country. We set these observations to “0” as the non-introduction of particular policy can be interpreted as a period without change in stringency of this policy.

10
differencing in our respective econometric models.12 As can be seen in Figures 10 and 11 macroprudential policy has become more stringent after the global financial crisis. Especially general capital requirements were increased (via the Basel directives) but also all other instruments recorded an increasing degree of stringency. As stressed by Buch and Goldberg (2016) there is no single theoretical model captures the range of possible international transmission channels to the different prudential policy instruments. On the one hand more stringent regulations might impede banks from moving capital and funds across borders, on the other hand cross-border activity might increase in order to seize opportunities for regulatory arbitrage.
Figure 10. Macroprudential policy index in the EU Figure 11. Change in macroprudential policy index
Source: Cerutti et al. (2016), authors’ calculations. Note: Cumulative indices as of 2000-Q1. Index equals one in the respective quarter if the respective macroprudential instrument became more stringent, zero if no change occurred, and -1 if the instrument became less stringent. Sector-specific capital buffer instruments include instruments regulating real estate credit, consumer credit, and other credit.
To measure the impact of changes in the institutional and regulatory environment which have been identified as important determinants of international capital flows, we include a broad indicator of institutional quality by taking the average score of the World Bank’s Worldwide Governance Indicators ( ) per country and year.13 Institutional quality in the host country is expected to be a pull factor since improving institutional framework should lead to higher inflows of capital (Papaioannou, 2009, Schmitz, 2011, and Bremus and Fratzscher, 2015). The impact of institutional quality in the source country is less clear a priori as banks facing improvements in their domestic institutional framework might focus more on their home market and therefore reduce cross-border activity. On the other hand, banks that are originating from countries with an improved institutional framework may be better equipped to establish cross-border activities.
Finally, in our difference estimations (equation 2), we introduce an explanatory variable measuring the burden from special taxes on banks (bank levies) which were widely introduced in the EU after the financial crisis. Using the National Tax Lists submitted by EU countries to Eurostat14, we construct our measure of sectoral tax burden by scaling tax revenues from bank levies by gross income of the
12 Cerutti et al. (2016) note that changes in the instruments may have different qualitative implications across countries, which may not be captured by the index. 13 This composite index includes the following indicators: voice and accountability, political stability and absence of violence, government effectiveness, regulatory quality, rule of law and control of corruption. 14 The National Tax List contains a detailed list of budget revenues from taxes and social contributions using national classification.
11
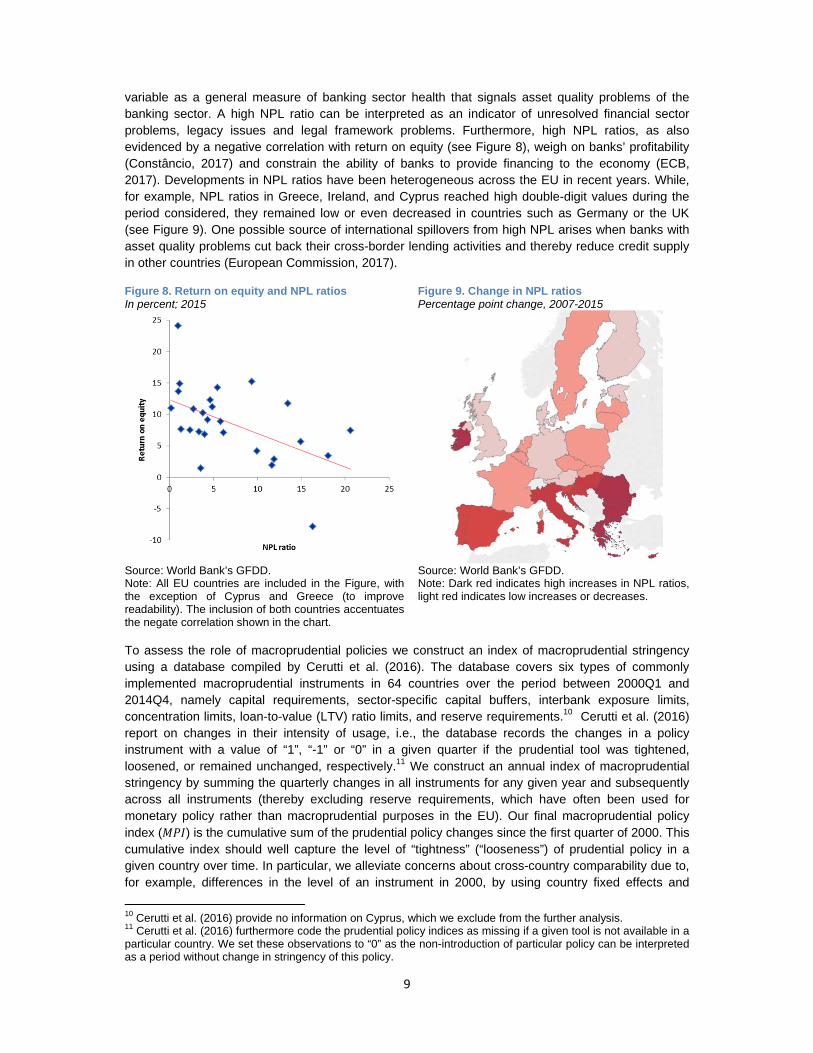
banking sector as reported in the IMF’s Financial Soundness Indicators (FSIs).15 The latter are only available from 2007 onwards for most countries, preventing their use in the panel estimation (1). In the post-crisis period 13 EU countries had introduced bank levies (see Figure 12). Our measure of relative tax burden on the banking sector ( ranges from 0.7% of gross income in Germany to 9.4% in the Netherlands in the post-crisis period (see Figure 13). The size and direction of international spillovers from such bank levies depend crucially on the underlying tax base and corresponding incentives for banks to adjust their lending activity. On the one hand, an additional tax burden at home might constrain banks and hence lead to reduced cross-border lending. On the other hand banks might have an incentive to increase their exposure to the foreign non-bank sector rather than increase cross-border interbank lending, since the latter is in some cases classified as a risk factor that directly leads to higher domestic bank levies.
Figure 12. Incidence of bank levies count
Figure 13. Tax burden from bank levies % of banks’ gross income, ‘13-’15 average
Source: Eurostat, IMF FSIs, authors’ calculations
4. Empirical results
4.1 Panel estimation results
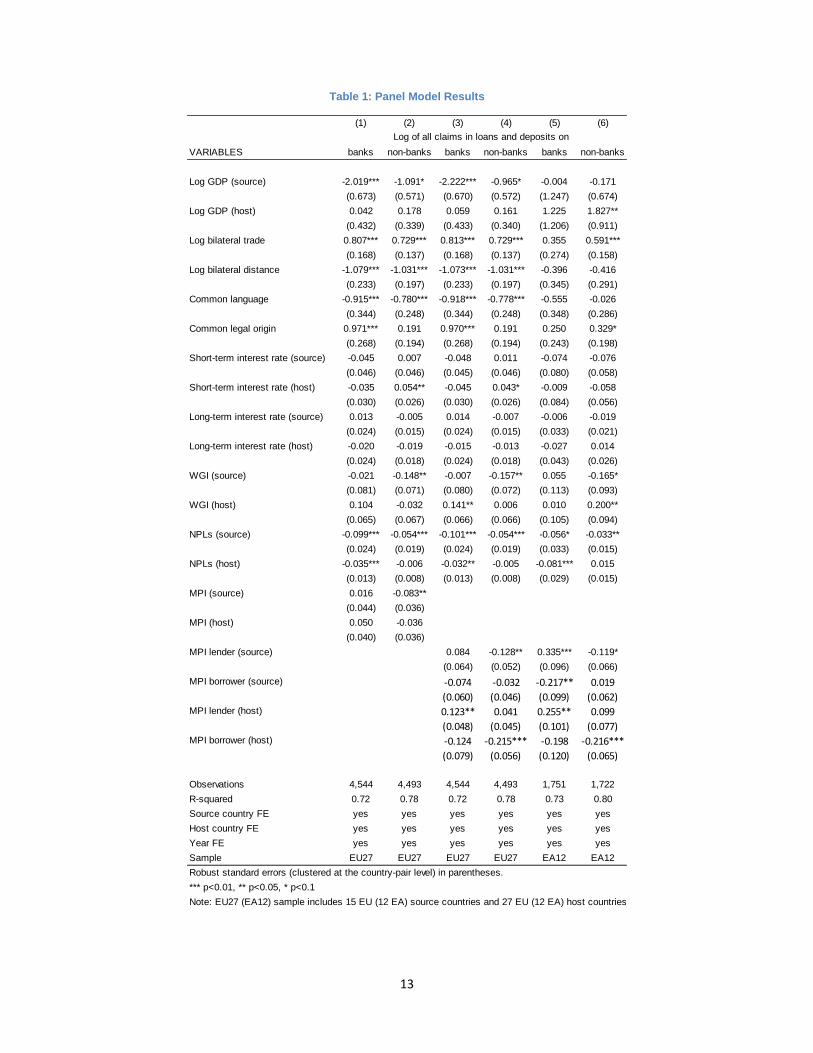
Table 1 reports results from the panel model (1) for cross-border claims in loans and deposits. Columns 1 and 2 report results for our baseline specifications for the entire EU27 sample and results for the MPI index split into borrower and lender specific measures are shown in columns 3 and 4. Columns 5 and 6 depict the latter specifications for a euro area (EA12) sample.16 In general, we find that the main results hold across the EU and the EA samples.
We find that deteriorating banking sector health in the source country, captured by the NPL ratio, is associated with lower cross-border lending. Claims on both banks and the non-bank sector are affected by NPL in the source country, while the estimated impact on the former is larger.17 This
15 See Table A.1 in the Annex for more details. In the cases of Belgium and Portugal this also includes mandatory contributions to the bank resolution funds. Gross income equals net interest income plus non-interest income. For details, see IMF (2006). 16 The EU27 sample includes 15 EU source countries (Austria, Belgium, Denmark, Finland, France, Germany, Greece, Ireland, Italy, Luxembourg, Netherlands, Portugal, Spain, Sweden, and the United Kingdom) and all EU host countries, except for Cyprus. The EA12 sample includes the 11 original euro area Member States and Greece. 17 Differences in the number of observations are due to missing values in the dependent variables. Restricting the sample to cases were both loans and deposits to banks and non-banks are available does not change the results.

12
implies that banks, in response to deteriorating balance sheet quality at home, cut their interbank cross-border positions more significantly compared to cross-border positions to the non-bank sector. This could either reflect the nature of interbank cross-border exposures, which are often of shorter maturities and thus can be terminated more easily (i.e. by not rolling them over at their maturity), or, it could also reflect that EU banks are less keen on cutting their cross-border exposures to the real economy sector, which might have been subject to higher build-up cost. Higher NPL in host countries are associated with lower cross-border interbank lending (column 1). This indicates that in countries where banking sector health deteriorates, cross-border lending to the domestic banking sector dries up, potentially aggravating a domestic credit crunch. Our findings show that bank flows between countries are reduced if banks need to shore up their balance sheets, as for example suggested in Claessens (2016). The health condition of the banking sector is thus confirmed to be an important driver of cross-border credit contractions in the EU (McGuire and von Peter, 2016; EC, 2017), which is not surprising given that high NPL ratios are one of the main factors weighing on banking sector profitability in the EU (Constâncio, 2017).
Turning to the effect of macroprudential policies, we find no significant impact of more stringent policies in source countries on interbank cross-border lending (column 1), but these are associated with a dampening effect on cross-border lending to the non-bank sector (column 2). This might be driven by the fact that banks faced with tighter macroprudential policies at home are more prone to cutting direct cross-border lending activities, rather than reducing domestic lending activities. Moreover, it is in line with Bremus and Fratzscher (2015) who found that higher capital stringency at home discouraged cross-border lending within the euro area.18 The coefficients on the host countries’ MPI index are insignificant for claims on both banks and non-banks (columns 1 and 2).
As stressed in Fahr and Zochowski (2015) and Buch and Goldberg (2016), the international spillovers of macroprudential policies can vary significantly across types of instruments. To shed more light on this, we split the macroprudential policies index into two subcomponents, namely measures aimed at lenders (i.e. capital requirements, capital buffers, interbank exposure limits, concentration limits) and measures aimed at borrowers (i.e. loan-to-value-ratio). Columns 3 and 4 depict the results of the estimations for lending to banks and non-banks, respectively. The overall negative correlation between tighter macroprudential policies in the source country and cross-border lending to the non-bank sector is driven by measures aimed at lenders. On the other hand, a tighter policy framework for lenders in host countries is associated with increased cross-border lending to banks. This hints towards possible regulatory arbitrage since foreign banks might channel more funds to their branches in these countries which might not be subject to tighter regulations.19 Direct cross-border lending to non-banks is reduced by stricter lending standards aimed at borrowers in host countries, which indicates that these measures are also binding for cross-border lending activity. In the euro area some additional effects of macroprudential policies seem to be at work. While all the coefficients found for the EU27 sample are also significant in the euro area sample, we find in addition for the latter that macroprudential policies aimed at lenders in the source country are associated with increased interbank lending, while macroprudential policies aimed at borrowers in the source country are associated with decreased interbank lending (column 5). Hence, euro area banks – if confronted with a more stringent macroprudential policy framework targeted at lenders at home – channel more funds to banks in the rest of the euro area, while they reduce direct cross-border lending to the non-bank sector (as also found for the full sample). Thus, we find evidence that macroprudential policy can entail spillovers via cross-border banking within the EU and the euro area. On the one hand, stricter policies are binding across borders, while on the other hand regulatory arbitrage might be possible via branches.
18 Bremus and Fratzscher (2015) present evidence for 15 source and 46 host countries out of which 9 and 19 are EU Member States, respectively. We provide a more detailed picture of EU cross-border banking by including all available 15 source and 27 receiving countries in the analysis (excluding only Cyprus due to data limitations). 19 Note that the BIS LBS data on interbank lending include both lending to related offices (branches and subsidiaries) and unrelated banks.
13
Table 1: Panel Model Results
(1) (2) (3) (4) (5) (6)
VARIABLES banks non-banks banks non-banks banks non-banks
Log GDP (source) -2.019*** -1.091* -2.222*** -0.965* -0.004 -0.171
(0.673) (0.571) (0.670) (0.572) (1.247) (0.674)
Log GDP (host) 0.042 0.178 0.059 0.161 1.225 1.827**
(0.432) (0.339) (0.433) (0.340) (1.206) (0.911)
Log bilateral trade 0.807*** 0.729*** 0.813*** 0.729*** 0.355 0.591***
(0.168) (0.137) (0.168) (0.137) (0.274) (0.158)
Log bilateral distance -1.079*** -1.031*** -1.073*** -1.031*** -0.396 -0.416
(0.233) (0.197) (0.233) (0.197) (0.345) (0.291)
Common language -0.915*** -0.780*** -0.918*** -0.778*** -0.555 -0.026
(0.344) (0.248) (0.344) (0.248) (0.348) (0.286)
Common legal origin 0.971*** 0.191 0.970*** 0.191 0.250 0.329*
(0.268) (0.194) (0.268) (0.194) (0.243) (0.198)
Short-term interest rate (source) -0.045 0.007 -0.048 0.011 -0.074 -0.076
(0.046) (0.046) (0.045) (0.046) (0.080) (0.058)
Short-term interest rate (host) -0.035 0.054** -0.045 0.043* -0.009 -0.058
(0.030) (0.026) (0.030) (0.026) (0.084) (0.056)
Long-term interest rate (source) 0.013 -0.005 0.014 -0.007 -0.006 -0.019
(0.024) (0.015) (0.024) (0.015) (0.033) (0.021)
Long-term interest rate (host) -0.020 -0.019 -0.015 -0.013 -0.027 0.014
(0.024) (0.018) (0.024) (0.018) (0.043) (0.026)
WGI (source) -0.021 -0.148** -0.007 -0.157** 0.055 -0.165*
(0.081) (0.071) (0.080) (0.072) (0.113) (0.093)
WGI (host) 0.104 -0.032 0.141** 0.006 0.010 0.200**
(0.065) (0.067) (0.066) (0.066) (0.105) (0.094)
NPLs (source) -0.099*** -0.054*** -0.101*** -0.054*** -0.056* -0.033**
(0.024) (0.019) (0.024) (0.019) (0.033) (0.015)
NPLs (host) -0.035*** -0.006 -0.032** -0.005 -0.081*** 0.015
(0.013) (0.008) (0.013) (0.008) (0.029) (0.015)
MPI (source) 0.016 -0.083**
(0.044) (0.036)
MPI (host) 0.050 -0.036
(0.040) (0.036)
MPI lender (source) 0.084 -0.128** 0.335*** -0.119*
(0.064) (0.052) (0.096) (0.066)
MPI borrower (source) ‐0.074 ‐0.032 ‐0.217** 0.019
(0.060) (0.046) (0.099) (0.062)MPI lender (host) 0.123** 0.041 0.255** 0.099
(0.048) (0.045) (0.101) (0.077)MPI borrower (host) ‐0.124 ‐0.215*** ‐0.198 ‐0.216***
(0.079) (0.056) (0.120) (0.065)
Observations 4,544 4,493 4,544 4,493 1,751 1,722
R-squared 0.72 0.78 0.72 0.78 0.73 0.80
Source country FE yes yes yes yes yes yes
Host country FE yes yes yes yes yes yes
Year FE yes yes yes yes yes yes
Sample EU27 EU27 EU27 EU27 EA12 EA12
Robust standard errors (clustered at the country-pair level) in parentheses.
*** p<0.01, ** p<0.05, * p<0.1
Log of all claims in loans and deposits on
Note: EU27 (EA12) sample includes 15 EU (12 EA) source countries and 27 EU (12 EA) host countries

14
We furthermore find that banks reduce cross-border lending when the institutional quality improves in their home country, a result which is also found by, e.g., Bremus and Fratzscher (2015). This seems particularly the case for lending to the non-bank sector, with the coefficient on the WGI index being highly significant and negative (column 2). Hence, an improving institutional framework at home might prompt banks to rebalance towards their country of residence, rather than lending across the border. Conversely, if the institutional quality worsens in the home country, banks tend to look for lending opportunities abroad, in particular to the non-bank sector. Interestingly, institutional quality of the host countries is not a significant pull factor for cross-border lending in the EU.
We find that the monetary policy stance in the source country, approximated by the short-term interest rate, is not significantly associated with cross-border bank lending in the EU. A tighter monetary policy stance in the host country is significant with a positive sign for lending to non-banks (columns 2 and 4), implying that tighter monetary policy in host countries is a pull factor for cross-border lending to the non-bank sector. Thus in the EU banks’ “search for yield” occurs predominantly through increased lending to the non-bank sector. Long-term interest rates show no significant impact on cross-border lending throughout the specifications. Furthermore, for the EA sample the coefficients on the short-term interest rate variables lose their significance, which might be due to fact that the common monetary policy in the euro area is picked up by the year fixed effects.
The gravity control variables have the expected signs across specifications (except for the common language dummy). Bilateral trade has a positive, significant effect on bilateral cross-border claims, in particular for lending to banks, highlighting the strong interlinkages between trade and finance within the EU. Geographical distance, which tends to proxy information asymmetries, has a dampening effect, as common in the gravity literature on international finance. Hence, these asymmetries still play an important role in cross-border bank lending in the EU, but not within the euro area. Finally, a common legal origin is associated with increased cross-border lending, especially to the banking sector.
4.2 Difference estimation results
Table 2 shows the results for specification (2) identifying the structural drivers of the changes in EU cross-border banking between the pre-crisis period (2005-2007) and the post-crisis period (2013-2015). 20 Overall, we observe that the retrenchment was mostly driven by source country specific factors highlighting the role of idiosyncratic supply shocks to a borrower country’s creditor banks during crisis times stressed by Amiti et al. (2017). More specifically, we find that deteriorating banks’ balance sheet quality – approximated by the NPL ratio – in the source countries also matters for the retrenchment in cross-border banking observed in the EU since the global financial crisis. Since, on average, the NPL ratios increased by 6.2 percentage points between the pre- and post-crisis period (see Table A.2) our estimates suggest that, ceteris paribus, cross-border lending to banks (non-banks) would be 58% (33%) higher if NPL ratios were to return to their pre-crisis levels.
Consistent with the results in the previous subsection we find that tighter macroprudential policies relative to the pre-crisis period in host countries had no significant impact on shifts in cross-border lending, while more stringent policies in the source country reduced cross-border lending to the non-bank sector. Hence, our results suggest that, overall, tighter macroprudential policies are not the main driver of markedly lower cross-border bank lending within the EU compared to the pre-crisis period, since the great retrenchment mainly occurred in interbank positions, for which tighter macroprudential policies show no significant impact.
20 Table A.4 in the appendix shows variations of the model including source or host country fixed effects and excluding the corresponding country-specific regressors, respectively (See Section 5 for further details).

15
Table 2: Difference estimation results
As a novelty compared to the analysis in the previous subsection, we analyse the role of bank levies. We find that the introduction of bank levies and the resulting additional tax burden on the banking sector did not have a significantly negative impact on cross-border lending in our sample since the crisis. We do however find evidence that a higher tax burden on banks in their country of residence
(1) (2)
VARIABLES banks non-banks
Log GDP (source) 2.086 2.992**
(2.102) (1.443)
Log GDP (host) 2.468** 1.814**
(1.077) (0.703)
Log bilateral distance -0.382** -0.100
(0.190) (0.132)
Common legal origin 0.488* 0.253
(0.265) (0.170)
Common official language -0.876** 0.220
(0.382) (0.252)
Long-term interest rate (source) 0.299* 0.061
(0.162) (0.101)
Long-term interest rate (host) -0.323*** -0.060
(0.085) (0.064)
Pre-crisis claims -0.085 -0.251***
(0.058) (0.040)
Pre-crisis bilateral trade 0.455*** 0.353***
(0.112) (0.065)
WGI (source) -0.154 -0.576***
(0.301) (0.215)
WGI (host) 0.149 -0.137
(0.176) (0.117)
NPLs (source) -0.095** -0.054**
(0.037) (0.024)
NPLs (host) 0.013 0.005
(0.019) (0.014)
MPI (source) -0.051 -0.136**
(0.076) (0.056)
MPI (host) -0.045 0.006
(0.075) (0.051)
BANKTAX (source) 0.002 0.103***
(0.054) (0.035)
BANKTAX (host) -0.035 -0.031
(0.048) (0.027)
Observations 370 353
R-squared 0.32 0.29
Robust standard errors in parentheses
*** p<0.01, ** p<0.05, * p<0.1
Log of all claims in loans and deposits on
Note: all variables are expressed in differences between the pre- ('05-'07) and post-crisis ('13-15') period, except for the time-invariant gravity variables.

16
increases cross-border lending to the non-bank sector. We take this as an indication that the introduction of bank levies after the financial crisis did not have an adverse effect on cross-border bank lending in the EU, but has shifted the composition of overall cross-border lending. This is not surprising since, although the tax base for the bank levies considered is quite heterogeneous across countries, in some countries the size of the bank levy depends on the size of the bank’s liabilities and additional risk factors, such as the share of interbank loans and deposits abroad. Hence, there is an incentive for banks to reduce this share by lending more directly to the non-bank sector.
Consistent with the results in the previous section, we find that improving institutional quality in the source country is associated with reduced cross-border lending to the non-bank sector. Compared to the pre-crisis period EU countries saw a decline in their average institutional quality (see table A.2), suggesting that the drop in institutional quality acted, on average, as a push factor for cross-border lending to the non-bank sector.21
The gravity and macro variables mostly show the expected signs across the different model specifications. Bilateral geographic distance is significant (with a negative sign) for cross-border lending to banks, suggesting that banks cut their interbank positions especially vis-à-vis those banks located farther away. A common legal origin had a positive impact on changes in interbank positions, while common language has no discernible impact on shifts in cross-border lending since the crisis. The extent of trade linkages between EU countries softens significantly the retrenchment process after the financial crisis, as countries which had higher levels of bilateral trade before the crisis reduced their bilateral cross-border banking activity less. Similarly to Galstyan and Lane (2013), we also find a “reversion to the mean” effect, since countries reduced their claims more vis-à-vis partners with whom they had a larger initial stock of cross-border claims.
5. Robustness tests
As a robustness check we run our panel estimation as presented in equation (1) with time-varying fixed effects at the host and source country level, respectively (see Table A.3 in the Annex). Our results presented in Table 1 remain robust to the inclusion of time-varying country fixed effects. This robustness test offers crucial insights. For instance, in the case of time-varying host county fixed effects, we are able to control for all host country-year specific demand factors such as the extent of provision of central bank liquidity which might affect the demand for cross-border interbank loans.
Similarly, Table A.4 in the appendix shows variations of our difference estimation (2), including source or host country fixed effects and excluding the corresponding country-specific regressors, respectively This approach successively controls for unobserved source and host country characteristics and confirms the findings presented in Table 2.
To test for the robustness of one of our main results – NPL ratios in source countries being a main driver of cross-border banking developments in the EU – we exclude potential outliers from the regression analysis. We note that NPL ratios are exceptionally high in Greece, reaching above 36% in 2015. We re-estimate the two models excluding Greece, which leaves the results qualitatively unchanged compared to our baseline specification, while the coefficients on source country NPL slightly increase in size. Additionally, we re-estimate the models excluding important financial hubs in the EU, namely Luxembourg and the United Kingdom.22 Since these countries intermediate cross-border banking flows from many countries, also from outside the EU, they might be more sensitive to global forces rendering domestic factors less significant in our estimations. The results remain largely
21 See Challe et al. (2016) for details on this decline in institutional quality. 22 The difference estimation results are furthermore robust to a 90% winsorisation of the dependent variables. The full results of these regressions are available upon request.

17
unchanged in this exercise, but the coefficient on NPL in the source country loses significance for cross-border positions vis-à-vis the non-bank sector in the difference estimations.23
Furthermore, we include additional variables tracking banking sector performance from the World Bank’s GFDD into our model specification. In particular, we include return on equity as a measure of bank sector profitability, the regulatory capital to risk weighted assets ratio, and the bank net interest margin.24 These additional controls of banks’ performance leave the main results unchanged (see table A.5).
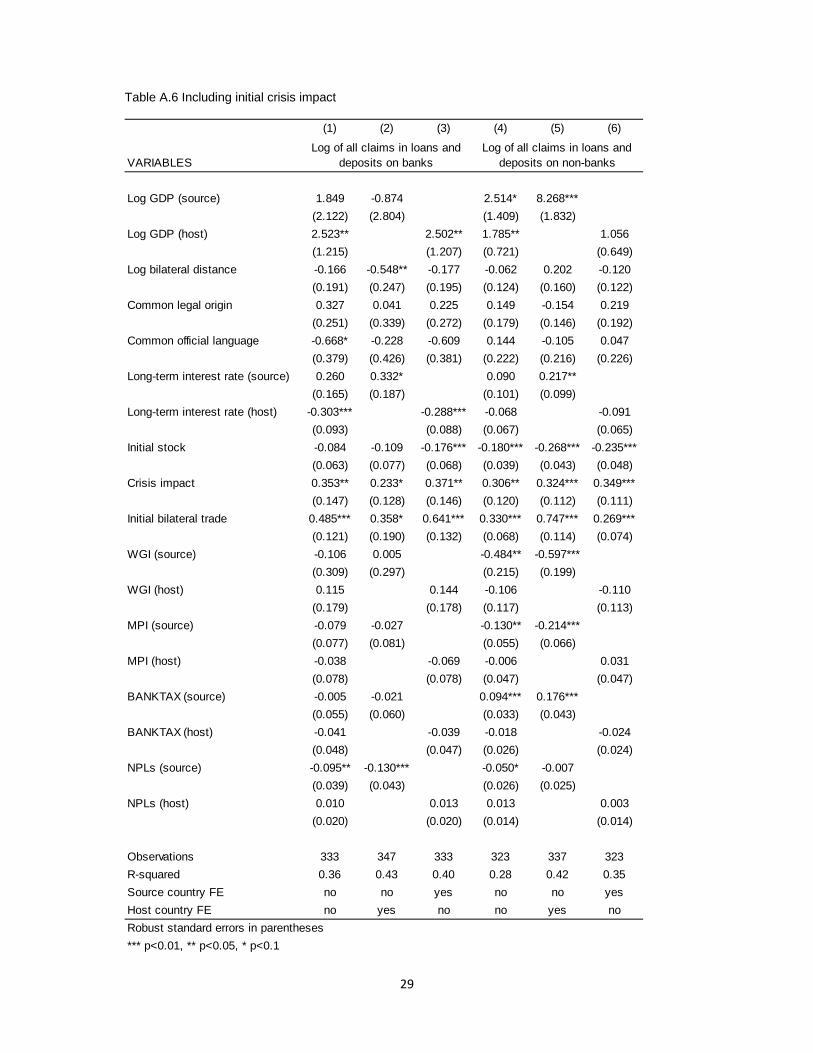
The policy measures targeting banks, which we use as explanatory variables for cross-border deleveraging in our models, are, at least partly, a consequence of the global financial crisis. For instance, countries introduced macroprudential policy measures in order to stabilise the banking sector and, hence, prevent unsustainable developments in the sector that led to the crisis. Furthermore, bank levies were, in part, introduced as punitive taxes aimed at handing banks a share in the cost of the crisis. Therefore, these policy variables might suffer from a reverse causality bias, so that countries which were disproportionally affected by the cross-border deleveraging might have been prompted to introduce more stringent policy responses. While we believe that the use of bilateral data already alleviates this concern to some extent, the econometric setup provided by the difference regression allows to control for the initial crisis impact. We introduce a measure for the immediate crisis impact as an additional explanatory variable in the regression specification defined in model (2) and the results remain qualitatively unchanged (see Table A.6).25 The initial crisis impact shows a positive and significant coefficient in all specifications indicating that banks further reduced cross-border lending to those countries towards which they reduced their exposures during the immediate crisis period.
6. Conclusions
In this paper we examine the drivers of the great retrenchment in cross-border banking across EU countries in the aftermath of the global financial crisis. Our paper contributes to the existing literature by investigating a wide range of possible determinants of cross-border banking in an integrated framework.
We investigate whether tightening of regulatory policies, an increasing relative tax burden on banks and the remnants of the global financial crisis manifested in persistently high shares of non-performing assets on banks’ balance sheets reduced financial integration in the EU. Taking a dis-aggregated view on cross-border bank claims in the EU, we observe that banks’ cross-border loans and deposits vis-à-vis other banks were most affected by deleveraging after the global financial crisis, whereas banks’ cross-border loans and deposits vis-à-vis the non-bank sector even slightly increased. Our analysis shows that explanatory variables show distinct impacts across the two subcategories of cross-border lending.
We employ both a panel data approach for the period of 2001-2014, as well as a cross-sectional difference approach comparing the pre-crisis (2005-07) and post-crisis (2013-2015) periods. We show that an important driver of cross-border bank lending in the EU and in particular since the global
23 Interestingly, improving institutional quality in the host country becomes a significant pull factor in these regressions. This might hint to the fact that including highly developed countries without considerable change in their high levels of institutional quality might have diluted the positive effect of this variable. 24 Due to data availability we cannot include these additional regressors in the panel model.
25 We calculate the initial crisis impact as a difference in bilateral cross-border claims between 2008Q1 and 2009Q2.

18
financial crisis is poor banking sector health as captured by high NPL ratios. Cross-border lending would be significantly higher if banks were not constrained by the unresolved financial sector problems and legal framework bottlenecks associated with the high post-crisis NPL levels in their countries of residence. Our results imply that, ceteris paribus, cross-border lending to banks (non-banks) would be 58% (33%) higher if banks were to return their NPL levels to the pre-crisis average.
Turning towards the estimates of the effect of macroprudential policies on cross-border claims, we find that more stringent policies in source countries reduce lending to the non-bank sector in the EU. Furthermore, we identify tighter macroprudential policies aimed at lenders in the host country as a pull factor for cross-border interbank lending which could be interpreted as a sign of regulatory arbitrage in the EU, with banks increasing lending to their affiliates abroad which are not subject to tighter regulation in the host country. Finally, we find that bank levies in a bank’s country of residence increases cross-border lending to the non-bank sector. One possible explanation for this might be that banks cut cross-border lending to affiliated offices (i.e. interbank claims) serving the non-bank sector in a given country and substitute these by direct cross-border lending to the non-bank sector. We take this as evidence that the introduction of bank levies after the financial crisis did not have an adverse effect on cross-border bank lending in the EU, but might have shifted the composition of cross-border lending.
Our results present a strong case for completing the Banking Union. First, remaining possibilities of regulatory arbitrage should be tackled by increasing use of reciprocity agreements. Second, the rulebook for financial actors in the EU needs to be amended by a chapter on a harmonised approach to NPL resolution, complemented with country-specific elements in each high-NPL constituency, as stressed by Constâncio (2017), in order to allow for a resumption of the cross-border banking integration process in the EU.
19
References
Amiti, M., McGuire, P., & Weinstein, D. E. (2017). Supply-and demand-side factors in global banking. Federal Reserve Bank of New York Staff Reports, no 818.
Avdjiev, S., & Takats, E. (2014). Cross-border bank lending during the taper tantrum: the role of emerging market fundamentals. BIS Quarterly Review September.
Bremus, F., & Fratzscher, M. (2015). Drivers of structural change in cross-border banking since the global financial crisis. Journal of International Money and Finance, 52, 32-59.
Broner, F., Didier, T., Erce, A., & Schmukler, S. L. (2013). Gross capital flows: Dynamics and crises. Journal of Monetary Economics, 60(1), 113-133.
Broner, F., Erce, A., Martin, A., & Ventura, J. (2014). Sovereign debt markets in turbulent times: Creditor discrimination and crowding-out effects. Journal of Monetary Economics, 61, 114-142.
Buch, C. M., & Goldberg, L. (2016). Cross-border prudential policy spillovers: how much? How important? Evidence from the International Banking Research Network (No. w22874). National Bureau of Economic Research.
Cerutti, E. (2015). Drivers of cross-border banking exposures during the crisis. Journal of Banking & Finance, 55, 340-357.
Cerutti, Eugenio, Stijn Claessens, and Luc Laeven (2015). The use and effectiveness of macroprudential policies: new evidence. Journal of Financial Stability.
Cerutti, E., & Claessens, S. (2016). The great cross-border bank deleveraging: supply constraints and intra-group frictions. Review of Finance.
Cerutti, M. E. M., Correa, M. R., Fiorentino, E., & Segalla, E. (2016). Changes in Prudential Policy Instruments—A New Cross-Country Database. International Monetary Fund.
Challe, E., Lopez, J, I,, Mengus, E, (2016). Southern Europe's Institutional Decline. HEC Paris Research Paper No. ECO/SCD-2016-1148.
Claessens, S. (2016). Global Banking: Recent Developments and Insights from Research. Review of Finance, 1, 43.
Claessens, S., & Van Horen, N. (2015). The impact of the global financial crisis on banking globalization. IMF Economic Review, 63(4), 868-918.
Constâncio, V. (2017). Resolving Europe’s NPL burden: challenges and benefits, keynote speech at and event entitled “Tackling Europe’s non-performing loans crisis: restructuring debt, reviving growth”, organised by Bruegel, Brussels.
European Central Bank (2017), Financial integration in Europe, May.
European Commission (2017). Quarterly Report on the Euro Area (QREA), Vol. 16, No. 1, Brussels.
European Systemic Risk Board (2016), A Review of Macroprudential Policy in the EU in 2015, May 2016
Fahr, S., Zochowski, D., (2015). Financial stability review: A framework for analysing and assessing cross-border spillovers from marcroprudential policies. Special feature a., Tech. rep.
20
Forbes, K. (2014). Financial “deglobalization”. Capital flows, banks and the Beatles, speech at Queen Mary University, London.
Forbes, K. J., & Warnock, F. E. (2012). Capital flow waves: Surges, stops, flight, and retrenchment. Journal of International Economics, 88(2), 235-251.
Forbes, K., Reinhardt, D., & Wieladek, T. (2016). The spillovers, interactions, and (un) intended consequences of monetary and regulatory policies (No. w22307). National Bureau of Economic Research.
Galstyan, V., & Lane, P. R. (2013). Bilateral portfolio dynamics during the global financial crisis. European Economic Review, 57, 63-74.
Hellmanzik, C., & Schmitz, M. (2016). Taking gravity online: the role of virtual proximity in international finance. ECB Working Paper No. 1879.
Herrmann, S., & Mihaljek, D. (2010). The determinants of cross-border bank flows to emerging markets: new empirical evidence on the spread of financial crises.
Houston, J. F., Lin, C., & Ma, Y. (2012). Regulatory arbitrage and international bank flows. The Journal of Finance, 67(5), 1845-1895.
Huizinga, H., Voget, J., & Wagner, W. (2014). International taxation and cross-border banking. American Economic Journal: Economic Policy, 6(2), 94-125.
Ichiue, H., & Lambert, F. (2016). Post-crisis International Banking; An Analysis with New Regulatory Survey Data (No. 16/88). International Monetary Fund.
IMF (2006). Financial Soundness Indicators. Compilation guide. Washington.
Kleimeier, S., Sander, H., & Heuchemer, S. (2013). Financial crises and cross-border banking: New evidence. Journal of International Money and Finance, 32, 884-915.
Lane, P. R. (2013). Financial globalisation and the crisis. Open Economies Review, 24(3), 555-580.
Mayer, T., & Zignago, S. (2011). Notes on CEPII’s distances measures: The GeoDist database.
McGuire, P., & Von Peter, G. (2016). The resilience of banks' international operations. BIS Quarterly Review March.
McQuade, P., & Schmitz, M. (2017). The great moderation in international capital flows: a global phenomenon? Journal of International Money and Finance, Vol. 73, 188-2012.
Milesi-Ferretti, G. M., & Tille, C. (2011). The great retrenchment: international capital flows during the global financial crisis. Economic Policy, 26(66), 289-346.
Ongena, S., Popov, A., & Udell, G. F. (2013). “When the cat's away the mice will play”: does regulation at home affect bank risk-taking abroad?. Journal of Financial Economics, 108(3), 727-750.
Papaioannou, E. (2009). What drives international financial flows? Politics, institutions and other determinants. Journal of Development economics, 88(2), 269-281.
Peek, J., & Rosengren, E. S. (2000). Collateral damage: Effects of the Japanese bank crisis on real activity in the United States. American Economic Review, 30-45.
Reinhardt, D., & Riddiough, S. J. (2015). The two faces of cross-border banking flows. IMF Economic Review, 63(4), 751-791.
21
Reinhardt, D., & Sowerbutts, R. (2015). Regulatory arbitrage in action: evidence from banking flows and macroprudential policy. Bank of England Working Paper No. 546.
Rey, H. (2015). Dilemma not trilemma: the global financial cycle and monetary policy independence (No. w21162). National Bureau of Economic Research.
Rose, A. K., & Wieladek, T. (2014). Financial protectionism? First evidence. The Journal of Finance, 69(5), 2127-2149.
Schmitz, M. (2011). Financial reforms and capital flows to emerging Europe. Empirica, 38(4), 579-605.
22
Annex
A.1 Adjustment of BIS data
In a first step, we fill gaps in the time series by using all available data provided by the BIS. If, for example, there is a missing observation in time series for the claims on banks for a country pair, while the claims on non-banks and total claims are available, we fill the gap by subtracting the non-bank claims from the total claims series. Subsequently, we adjust respective stock variables for the exchange rate valuation effects using backward adjustment (i.e. starting from the latest data point of a stock variable we subtract the corresponding FX-adjusted flow reported by the BIS and iterate this procedure for the whole time series). In order to get a complete time series the stock and flow series are corrected for the remaining gaps/breaks as follows: 26 missing FX-adjusted flows are replaced with the change in non-adjusted stocks. If a stock data point is missing it is dervived by multiplying the latest existing value with the growth rate of stocks vis-à-vis the world.27
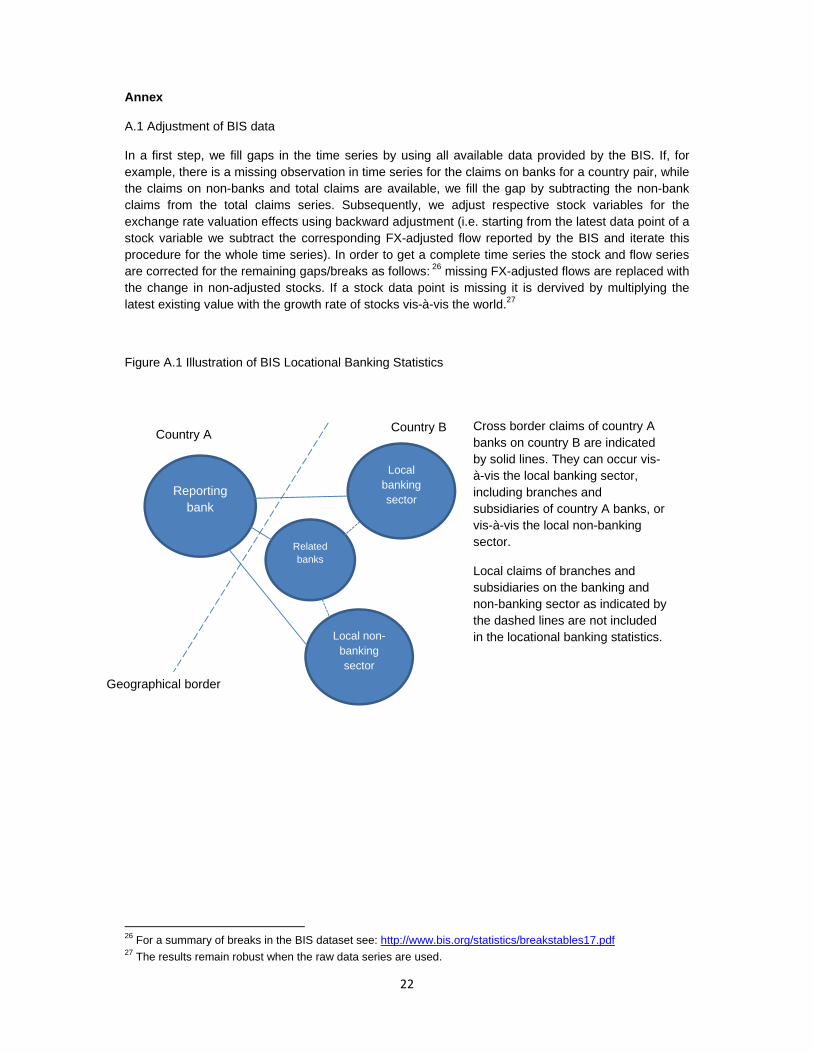
Figure A.1 Illustration of BIS Locational Banking Statistics
26 For a summary of breaks in the BIS dataset see: http://www.bis.org/statistics/breakstables17.pdf 27 The results remain robust when the raw data series are used.
Reporting bank
Local banking sector
Related banks
Local non-banking sector
Geographical border
Cross border claims of country A banks on country B are indicated by solid lines. They can occur vis-à-vis the local banking sector, including branches and subsidiaries of country A banks, or vis-à-vis the local non-banking sector.
Local claims of branches and subsidiaries on the banking and non-banking sector as indicated by the dashed lines are not included in the locational banking statistics.
Country A Country B

23
Figure A.2: Cross-border and domestic lending in the EU Index, 2008q3 = 100, 4 quarter moving average
Sources: BIS LBS and ECB BSI.
Figure A.3: Financial integration in the EU
Germany
France

24
Italy United Kingdom
Note: colour coded values of the log of bilateral cross-border claims in all instruments for selected BIS reporting source countries vis-à-vis all 28 EU countries in 2016Q1. Dark shades of red and blue indicate the highest and lowest levels of bilateral cross-border banking claims, respectively. Source: BIS (LBS), authors’ calculations.
Table A.1 Sectoral taxes on banks
Note: the table depicts revenues from the respective taxes on banks divided by gross income of deposit takers in the IMF’s FSIs and by total tax revenues in 2014. Countries not mentioned in the table did not introduce such taxes.
% banks'
gross
income
% of tax
revenue Tax(es) considered
BE 0.56% 0.11% Contribution for Financial Stability to the Resolution Funds
BG 6.76% 1.53% Banks contributions to DGF and NRF
DE 0.42% 0.08% Bank levy (Bankenabgabe)
IE 1.38% 0.33% Bank Levy on DIRT accounts
HU 0.41% 0.36% Financial institutions special tax, bank tax
NL 14.18% 0.97% Bank Levies
AT 2.60% 0.62% Financial Institutions Stability Fee
PT 1.74% 0.45% Contribution on banking industry, contributions for the Resolution Fund
RO 1.73% 0.26% Tax on profits from commercial banks
SI 1.59% 0.32% Tax on balance wealth paid by banks
SK 6.48% 1.14% Special levy on selected financial institutions
FI 7.37% 0.22% Bank tax
UK 3.37% 0.55% Bank Payroll Tax, Bank Levy
2014 value

25
Table A.2 Summary statistics for difference estimation analysis
Note: This table shows summary statistics for the variables used in the regressions in Section 4.2. All variables, except for the time-invariant ones, are expressed in pre- and post-crisis differences.
Variable Observations Mean Std. Dev. Min Max
Log claims, loans and deposits, banks 370 -1.17 2.24 -9.85 2.90
Log claims, loans and deposits, non banks 353 0.32 1.42 -8.46 5.87
log GDP (source) 390 0.10 0.13 -0.22 0.36
log GDP (host) 390 0.19 0.16 -0.22 0.46
Distance (ln) 390 7.08 0.63 4.09 8.12
Common legal origin 390 0.19 0.39 0.00 1.00
Common language index 390 0.06 0.24 0.00 1.00
Long-term interest rate (source) 390 -1.47 1.87 -2.70 4.88
Long-term interest rate (host) 390 -1.66 1.64 -4.54 4.88
log Initial bilateral trade 390 21.60 2.12 15.29 25.97
WGI composite index (source) 390 -0.42 0.74 -2.62 0.34
WGI composite index (host) 390 -0.15 0.93 -2.62 2.12
MPI (source) 390 2.98 1.78 0.33 7.00
MPI (host) 390 2.55 1.66 -0.67 7.00
Bank tax (source) 390 1.85 2.48 0.00 9.41
Bank tax (host) 390 1.57 2.53 -0.38 9.41
NPLs (source) 390 5.82 8.17 -0.95 28.68
NPLs (host) 390 6.15 7.17 -3.15 28.68

26
Table A.3 Including time-varying host and source country fixed effects
(1) (2) (3) (4)
VARIABLES banks non-banks banks non-banks
Log GDP (source) -1.874*** -1.148**
(0.644) (0.526)
Log bilateral trade 0.895*** 0.756*** 0.819*** 0.754***
(0.178) (0.140) (0.173) (0.140)
Log bilateral distance -0.990*** -0.989*** -1.059*** -0.996***
(0.244) (0.200) (0.237) (0.199)
Common language -0.915*** -0.722*** -0.894** -0.773***
(0.352) (0.265) (0.346) (0.249)
Common legal origin 0.883*** 0.168 0.944*** 0.166
(0.281) (0.200) (0.273) (0.195)
Short-term interest rate (source) -0.049 0.014
(0.045) (0.044)
Long-term interest rate (source) 0.010 -0.011
(0.023) (0.015)
WGI (source) -0.039 -0.153**
(0.077) (0.069)
MPI (source) 0.021 -0.097***
(0.041) (0.035)
NPLs (source) -0.100*** -0.059***
(0.022) (0.018)
Log GDP (host) -0.060 0.185
(0.429) (0.341)
Short-term interest rate (host) -0.028 0.055**
(0.029) (0.025)
Long-term interest rate (host) -0.023 -0.018
(0.024) (0.018)
WGI (host) 0.082 -0.030
(0.066) (0.064)
MPI (host) 0.048 -0.034
(0.040) (0.035)
NPLs (host) -0.036*** -0.006
(0.012) (0.008)
Observations 4,606 4,562 4,586 4,535
R-squared 0.74 0.79 0.73 0.79
Time period '01-'14 '01-'14 '01-'14 '01-'14
Country FE source source host host
Country-year FE host host source source
Robust standard errors (clustered at the country-pair level) in parentheses.
*** p<0.01, ** p<0.05, * p<0.1
Log of all claims in loans and deposits on

27
Table A.4 Difference estimation results with fixed effects
(1) (2) (3) (4) (5) (6)
VARIABLES
Log GDP (source) 2.086 0.480 2.992** 8.325***
(2.102) (2.689) (1.443) (1.902)
Log GDP (host) 2.468** 2.340** 1.814** 1.324**
(1.077) (1.071) (0.703) (0.656)
Log bilateral distance -0.382** -0.646*** -0.366* -0.100 0.118 -0.155
(0.190) (0.244) (0.193) (0.132) (0.165) (0.132)
Common legal origin 0.488* 0.201 0.425 0.253 -0.089 0.301
(0.265) (0.337) (0.283) (0.170) (0.161) (0.187)
Common official language -0.876** -0.487 -0.817** 0.220 0.017 0.150
(0.382) (0.424) (0.390) (0.252) (0.251) (0.263)
Long-term interest rate (source) 0.299* 0.389** 0.061 0.189*
(0.162) (0.180) (0.101) (0.101)
Long-term interest rate (host) -0.323*** -0.333*** -0.060 -0.075
(0.085) (0.080) (0.064) (0.062)
Pre-crisis claims -0.085 -0.097 -0.191*** -0.251*** -0.347*** -0.319***
(0.058) (0.071) (0.062) (0.040) (0.042) (0.047)
Pre-crisis bilateral trade 0.455*** 0.410** 0.595*** 0.353*** 0.749*** 0.339***
(0.112) (0.179) (0.122) (0.065) (0.114) (0.070)
WGI (source) -0.154 -0.038 -0.576*** -0.640***
(0.301) (0.286) (0.215) (0.204)
WGI (host) 0.149 0.145 -0.137 -0.149
(0.176) (0.175) (0.117) (0.113)
MPI (source) -0.051 -0.031 -0.136** -0.216***
(0.076) (0.081) (0.056) (0.065)
MPI (host) -0.045 -0.059 0.006 0.040
(0.075) (0.075) (0.051) (0.051)
NPLs (source) -0.095** -0.118*** -0.054** -0.014
(0.037) (0.040) (0.024) (0.023)
NPLs (host) 0.013 0.013 0.005 -0.001
(0.019) (0.019) (0.014) (0.014)
BANKTAX (source) 0.002 -0.008 0.103*** 0.176***
(0.054) (0.056) (0.035) (0.042)
BANKTAX (host) -0.035 -0.042 -0.031 -0.034
(0.048) (0.047) (0.027) (0.026)
Observations 370 384 370 353 367 353
R-squared 0.32 0.40 0.37 0.29 0.41 0.34
Source country FE no no yes no no yes
Host country FE no yes no no yes no
Robust standard errors in parentheses.
*** p<0.01, ** p<0.05, * p<0.1
Log of all claims in loans and
deposits on banks
Log of all claims in loans and
deposits on non‐banks

28
Table A.5 Including additional banking sector variables
(1) (2)
VARIABLES banks non-banks
Log GDP (source) -1.739*** -0.692
(0.638) (0.499)
Log GDP (host) 0.071 0.413
(0.428) (0.352)
Log bilateral trade 0.794*** 0.723***
(0.168) (0.131)
Log bilateral distance -1.095*** -1.044***
(0.234) (0.198)
Common language -0.853** -0.768***
(0.353) (0.250)
Common legal origin 0.977*** 0.206
(0.273) (0.195)
Short-term interest rate (source) -0.116** -0.086**
(0.050) (0.035)
Short-term interest rate (host) -0.020 0.044*
(0.031) (0.025)
Long-term interest rate (source) 0.021 0.001
(0.026) (0.016)
Long-term interest rate (host) -0.024 -0.009
(0.025) (0.017)
WGI (source) 0.095 -0.039
(0.074) (0.070)
WGI (host) 0.148** 0.012
(0.063) (0.058)
MPI (source) 0.028 -0.101***
(0.044) (0.036)
MPI (host) 0.055 -0.053
(0.038) (0.035)
NPLs (source) -0.079*** -0.016
(0.021) (0.013)
NPLs (host) -0.044*** -0.008
(0.013) (0.008)
Return on equity (source) 0.000 0.008***
(0.003) (0.002)
Return on equity (host) -0.006* -0.006***
(0.003) (0.002)
Regulatory capital to assets (source) -0.023 -0.055***
(0.021) (0.016)
Regulatory capital to assets (host) 0.017 0.003
(0.018) (0.013)
Bank net interest rate margin (source) -0.035 0.006
(0.055) (0.055)
Bank net interest rate margin (host) -0.189*** 0.138***
(0.059) (0.047)
Observations 4,242 4,187
R-squared 0.73 0.79
Time period '01-'14 '01-'14
Source country FE yes yes
Host country FE yes yes
Year FE yes yes
*** p<0.01, ** p<0.05, * p<0.1
Log of all claims in loans and deposits on
Robust standard errors (clustered at the country-pair level) in parentheses.
29
Table A.6 Including initial crisis impact
(1) (2) (3) (4) (5) (6)
VARIABLES
Log GDP (source) 1.849 -0.874 2.514* 8.268***
(2.122) (2.804) (1.409) (1.832)
Log GDP (host) 2.523** 2.502** 1.785** 1.056
(1.215) (1.207) (0.721) (0.649)
Log bilateral distance -0.166 -0.548** -0.177 -0.062 0.202 -0.120
(0.191) (0.247) (0.195) (0.124) (0.160) (0.122)
Common legal origin 0.327 0.041 0.225 0.149 -0.154 0.219
(0.251) (0.339) (0.272) (0.179) (0.146) (0.192)
Common official language -0.668* -0.228 -0.609 0.144 -0.105 0.047
(0.379) (0.426) (0.381) (0.222) (0.216) (0.226)
Long-term interest rate (source) 0.260 0.332* 0.090 0.217**
(0.165) (0.187) (0.101) (0.099)
Long-term interest rate (host) -0.303*** -0.288*** -0.068 -0.091
(0.093) (0.088) (0.067) (0.065)
Initial stock -0.084 -0.109 -0.176*** -0.180*** -0.268*** -0.235***
(0.063) (0.077) (0.068) (0.039) (0.043) (0.048)
Crisis impact 0.353** 0.233* 0.371** 0.306** 0.324*** 0.349***
(0.147) (0.128) (0.146) (0.120) (0.112) (0.111)
Initial bilateral trade 0.485*** 0.358* 0.641*** 0.330*** 0.747*** 0.269***
(0.121) (0.190) (0.132) (0.068) (0.114) (0.074)
WGI (source) -0.106 0.005 -0.484** -0.597***
(0.309) (0.297) (0.215) (0.199)
WGI (host) 0.115 0.144 -0.106 -0.110
(0.179) (0.178) (0.117) (0.113)
MPI (source) -0.079 -0.027 -0.130** -0.214***
(0.077) (0.081) (0.055) (0.066)
MPI (host) -0.038 -0.069 -0.006 0.031
(0.078) (0.078) (0.047) (0.047)
BANKTAX (source) -0.005 -0.021 0.094*** 0.176***
(0.055) (0.060) (0.033) (0.043)
BANKTAX (host) -0.041 -0.039 -0.018 -0.024
(0.048) (0.047) (0.026) (0.024)
NPLs (source) -0.095** -0.130*** -0.050* -0.007
(0.039) (0.043) (0.026) (0.025)
NPLs (host) 0.010 0.013 0.013 0.003
(0.020) (0.020) (0.014) (0.014)
Observations 333 347 333 323 337 323
R-squared 0.36 0.43 0.40 0.28 0.42 0.35
Source country FE no no yes no no yes
Host country FE no yes no no yes no
Robust standard errors in parentheses
*** p<0.01, ** p<0.05, * p<0.1
Log of all claims in loans and deposits on banks
Log of all claims in loans and deposits on non-banks