Embed Size (px)
Citation preview

Cross-Border Banking, Credit Access, and the Financial Crisis∗
Alexander Popov†
European Central BankGregory F. UdellIndiana University
December 2011
Abstract
We study the sensitivity of credit supply to bank financial conditions in 16 emerging Euro-pean countries before and during the financial crisis. We use survey data on 10,701 applicantand non-applicant firms that enable us to disentangle effects driven by positive and negativeshocks to the banking system from demand shocks that may vary across lenders. We find strongevidence that firms’access to credit was affected by changes in the financial conditions of theirbanks. During the crisis firms were more credit constrained if they were dealing with banksthat experienced a decline in equity and Tier 1 capital, as well as losses on financial assets. Wealso find that access to credit reflects the balance sheet conditions of foreign parent banks. Theeffect of positive and negative shocks to a bank is greater for riskier firms and firms with fewertangible assets.JEL classification: E44, E51, F34, G21Keywords: financial crisis, bank lending channel, business lending
∗We thank two anonymous referees, Efraim Benmelech, Willem Buiter, Santiago Carbo-Valverde, Nicola Cetorelli,Ralph De Haas, Simon Gilchrist, Linda Goldberg (the editor), Nandini Gupta, Philip Hartmann, Florian Heider, Vic-toria Ivashina, Sebnem Kalemli-Ozcan, Anil Kashyap, Luc Laeven, Steven Ongena, Marco Pagano, George Pennacchi,Richard Portes, Alberto Pozzolo, Peter Praet, Jorg Rocholl, Philip Strahan, Paul Wachtel, Alberto Zazzaro, and sem-inar participants at the Australian National University, Bank of Finland, Bocconi University, the European CentralBank, the Stockholm School of Economics, the University of Granada, the University of Melbourne, the Universityof New South Wales, the ECB/EC conference “Financial integration and stability: The legacy of the crisis”, the13th Conference of the Swiss Society for Financial Market Research, the BCBS/CEPR/JFI workshop "Systemic riskand financial regulation - causes and lessons from the crisis", the Bundesbank/CFS workshop "Interconnectedness offinancial institutions: Microeconomic evidence, aggregate outcomes, and consequences for economic policy", the NYFed conference "The Global Dimensions of the Crisis", the Western Calilee College "Banking in Light of the GlobalCrisis" conference, the Federal Reserve Board of Kansas, the 2010 FMA annual meeting, the 2011 AEA meeting,EBRD, Bank of Italy, and the Riksbank for useful discussions, as well as Dana Schaffer and Francesca Fabbri foroutstanding research assistance. The opinions expressed herein are those of the authors and do not necessarily reflectthose of the ECB or the Eurosystem.†Corresponding author. European Central Bank, Financial Research Division, Kaiserstrasse 29, D-60311 Frank-
furt, email: [email protected]

1 Introduction
The increasing integration of the European banking industry offers the prospect of important gains
in terms of effi ciency and diversification, but it also creates potential risks. One such risk is that the
effects of a shock to the capital of a bank that is active internationally may be propagated across
borders. Given the size and penetration of western European banks in central and eastern Europe,
the supply of credit to firms and consumers may be sensitive to shocks that these borrowers would
otherwise be spatially insulated from. This would suggest that lending by foreign-owned banks
would likely increase when the financial condition of the parent improved. However, it also implies
that parent bank financial distress, like that associated with the recent financial crisis, would have
the opposite effect.1 The impact of the crisis on borrowers is, of course, a matter of considerable
policy attention.2 This paper confirms that lending in central and eastern Europe is sensitive to
bank financial conditions in general, and to negative shocks and to financial conditions at foreign
parent banks in particular.
We investigate one key mechanism through which the effect of bank financial conditions may
have been transmitted to borrowers, namely through the supply of credit to small and medium
enterprises. SMEs dominate the corporate landscape in central and eastern Europe, comprising
up to 99% of all firms. Moreover, because of their opacity SMEs may be particularly sensitive to
changes in the supply of credit. With immature capital markets and little or no corporate bond
finance, banks are by far the main provider of external funds. An important feature of the central
and eastern European banking market is its ownership structure. In particular, foreign ownership
in the banking sector has grown dramatically in the recent decade —so much so that by 2008 foreign
banks controlled around four fifths of the assets in the region’s banking industry.3 Shocks to the
1See, for example, Brunnermeier (2009), Gorton (2010), and Ivashina and Scharfstein (2010) for a timeline of the2007-2008 global financial crisis.
2Signs of the negative effects of the global financial crisis on business firms in emerging Europe through the channelof bank lending were seen as early as the Fall of 2007. For instance, in October, the EBRD’s chief economist ErikBerglof warned that "the crisis in the West will be a serious one which will last for some time and this means itwill definitely have an impact on our countries [...] due to the diffi culties and higher costs associated with obtainingcredit" (EBRD (2007)). The ECB’s Bank Lending Survey indicated that euro area banks started tightening lendingstandards in Q3:2007 (ECB (2008)).
3For summaries of the literature on the motivations for foreign entry into banking markets and the relative per-formance/behavior of foreign versus domestic banks (including behavior in credit markets) see Degryse, Havrylchyrk,Jurzyk, and Kozak (2010) and Berger, DeYoung, Genay, and Udell (2000).
1

balance sheets of large multinational banks - both positive ones during the early 2000s and negative
ones during the recent financial crisis - provide a natural experiment to study how such shocks are
propagated across borders.4
Our key data come from a survey of a large group of SMEs in emerging Europe administered
in April 2005 and April 2008. These data allow us to directly observe firms’access to finance.
Specifically we observe firms whose loan application was approved or turned down and firms who
were discouraged from applying for bank credit by the anticipation of being turned down, by high
rates, or by unfavorable collateral requirements. While we do not observe the bank which granted
or denied the loan, we observe the extent of the operations of all banks present in the firm’s city of
incorporation. By using balance sheet data on the parent banks, foreign or domestic, we construct
an index of locality-specific financial health (distress) for each locality in 16 countries in the region,
which we then map into data on firm credit constraints. We also separate, for each locality, the
balance sheet conditions of domestic and of foreign banks. The final data consist of 10,701 firms in
1,978 localities served by a total of 155 banks over the 2005-2008 period. The majority of localities,
however, are served by just a handful of banks, with the degree of foreign ownership of those varying
by both country and locality.
This empirical set-up allows us to study the following important questions:
1) How sensitive is the supply of credit to bank balance sheet conditions?,
and, as special cases of 1),
2) What were the consequences to borrowers of bank balance sheet problems in the early stages
of the 2007—2008 crisis?, and
3) Did business lending by the subsidiaries of foreign banks reflect their parents’ financial
condition?
The analysis of shocks to bank balance sheets raises the classic problem of disentangling demand
and supply effects. For example, a firm’s demand for credit likely shifts downward due to the
deterioration of its own balance sheet at the same time that the supply of credit contracts. This
4 It is worth noting that the problems affl icting these banks during the crisis were completely unrelated to theiroperation in central and eastern Europe. They emanated instead from the fallout from the financial crisis that startedin the U.S. and spread throughout the global economy.
2

would not be an issue if the shock to bank balance sheets in our analysis included the cross-border
transmission of financial conditions into an economic area insulated from that shock through all
other channels but the bank lending channel. As the sub-prime mortgage crisis was associated
since its very beginning with the expectations of a global recession, the measured effect of bank
loan supply shocks will likely be contaminated by demand shifts.
Some studies that identify demand use the decline in loan applications across differentially
affected lenders to argue that there haven’t been variations in the decrease in demand across
lenders. One problem with that identification approach may be limited data availability on loan
applications. However, even when one observes the universe of loan applications, applicant firms
could be a systematically truncated sub-sample of all firms: some firms do not apply because they
do not need credit, while others do not apply because they are discouraged. Not accounting for
discouraged firms results in a poor proxy for credit constraints, especially in the region of central
and eastern Europe, where recent studies (Brown, Ongena, Popov, and Yesin (2011)) have shown
that the share of firms discouraged from applying is up to twice as large as the share of firms which
applied and had their loan application rejected. Then it could well be that, for example, for banks
negatively affected by the crisis, it is the financially healthy borrowers that are selecting themselves
out of the application process (firms that do well during a recession), while for other banks, it is the
weak firms that do so, discouraged the contraction in lending. Thus, at different types of banks,
non-applicant firms may have systematically different reasons for selecting themselves out of the
application process, confounding identification and making it diffi cult to separate the bank lending
channel from the balance sheet channel.5
We overcome this obstacle by employing observable survey information on firms that choose to
select themselves out of the bank credit application process, be it because they were discouraged,
or because they do not need credit. Thus we are able to account not just for the change in firms’
demand, but also for the composition of firms that account for the demand shift. While there is
5The balance sheet channel emphasizes that the impact of a macro shock on access to credit runs through thebalance sheets of borrowers. The shock affects the net worth, the collateral and general financial condition of borrowersexacerbating the principle-agent problem that inhibits access to credit. This is in contrast to the lending channelthat emphasizes that a macro shock is amplified through changes in the financial condition of lenders, e.g., banks.
3

already extensive evidence on the real effects of this financial crisis6, our paper is the only one that
we know of which simultaneously 1) studies the transmission of parent bank financial conditions
in foreign markets, 2) accounts for the changes in the level and composition of loan demand, and
3) is able to construct a proxy for credit constraint based on discouragement as well as on actual
rejection. As such, our paper adds to a very scarce literature employing data on the selection
process involved in the granting of business loans.7
This paper confirms the hypothesis that positive and negative shocks to banks’balance sheets
were transmitted from banks to firms in central and eastern Europe. Focusing on the negative
shocks to bank balance sheets in the relatively early stages of the 2007-2008 crisis, for example,
we find a higher probability of firms’being credit constrained in localities served by banks with a
low ratio of equity to total assets, a low Tier 1 capital ratio, and high losses on financial assets,
including ABSs and MBSs. The result is strongest and most consistent for Tier 1 capital. The key
results hold when we assume equal access of each firm to all banks present in the firm’s locality,
when we weight access by the branch penetration of each bank, or when we weight it by bank assets.
Numerically, firms faced a 10% higher probability of being credit constrained if they did business
with banks that experienced at least a one-standard deviation deterioration in their financial health
between 2005 and 2008 relative to otherwise identical firms (evaluated at their sample means) that
did business with banks whose financial health on average declined by less. As a still another special
case, we find that the probability of banks’adjusting their loan portfolio in response to shocks to
their balance sheets is higher for foreign-owned banks than for domestic banks. This confirms that
bank lending is sensitive to the balance sheet conditions of foreign parent banks. Finally, we find
that financial conditions are transmitted differently across firms and industries, in that firms that
are high-risk and firms with fewer tangible assets are most sensitive to shocks to bank balance
sheets.
Our paper relates to a number of studies that have aimed at identifying the transmission of
6De Haas and van Horen (2009), Ivashina and Scharfstein (2010), Cetorelli and Goldberg (2011), Jimenes, Ongena,Peydro, and Saurina (2011), Puri, Rochol, and Steffen (2011), and Santos (2011), among others, all provide evidenceon the credit crunch associated with the 2007-2008 financial crisis.
7The very few studies known to us that do so are Chakravarty and Yilmazer (2009), Brown, Ongena, Popov, andYesin (2011), and Ongena and Popov (2011).
4

shocks from banks’balance sheets to lending activity in various economic circumstances. The bank
lending channel has been studied extensively (e.g., Kashyap and Stein (2000)), and banks have been
found to rely heavily on the use of internal capital markets in order to dampen domestic liquidity
shocks (e.g., Stein (1997); Houston, James, and Marcus (1997)). The U.S. credit crunch in 1990-92
spawned a large literature that investigated its causes and its effects (e.g., Bernanke and Lown
(1991); Berger and Udell (1994); Peek and Rosengren (1995); Wagster (1996); Hancock and Wilcox
(1998)). Banking crises and liquidity shocks elsewhere in the world similarly generated considerable
academic attention (e.g., Woo (1999); Kang and Stulz (2000); Hayashi and Prescott (2002); Khwaja
and Mian (2008); Paravisini (2008)). Peek and Rosengren (1997) were one of the first to identify
the international transmission of financial shocks when they investigated how the collapse of asset
prices in Japan during the early 1990s affected the operations of Japanese bank subsidiaries abroad.
In particular, they show that the decline in the parents’risk-based capital ratio translated into a
significant decline in total loans by their U.S. subsidiaries. Chava and Purnanandam (2010) and
Schnabl (2011) use the exogenous shock provided by the Russian crisis of 1998 to study the effect
on lending to U.S. and Peruvian borrowers, respectively. Cetorelli and Goldberg (2009) show that
the existence of internal capital markets with foreign bank affi liates contributes to an international
propagation of domestic liquidity shocks to lending by affi liated banks abroad.
In the context of the financial crisis of 2007-2008, Ivashina and Scharfstein (2010) document that
new loans to large borrowers declined by 79% by the end of 2008 relative to the peak of the credit
boom (Q2:2007). They analyze the effect that the failure of Lehman Brothers had on the syndicated
loan market to identify the reduction in new lending. Jimenez, Ongena, Peydro, and Saurina (2011)
use the universe of bank loans by Spanish banks to identify separately the bank lending channel
and the balance sheet channel, and find that they dampen each other: more liquid firms are less
vulnerable to the contraction of bank lending, and if banks have ample liquidity, the balance sheet
channel partially shuts down. Puri, Rocholl, and Steffen (2011) test the effect of the deteriorating
condition of German banks hit by the crisis on lending to domestic retail customers. Berrospide,
Black, and Keeton (2011) examine the mortgage lending behavior within the U.S. in the "peripheral
markets" of multi-market banks after these banks suffer mortgage losses in other markets. Finally,
5

Cetorelli and Goldberg (2011) examine the relationships between adverse liquidity shocks on main
developed-country banking systems to emerging markets across Europe, Asia, and Latin America,
isolating lending supply from lending demand shocks. They find that lending supply in emerging
markets was affected through three separate channels: a contraction in direct, cross-border lending
by foreign banks; a contraction in local lending by foreign banks’affi liates in emerging markets; and
a contraction in lending supply by domestic banks as well, as a result of the funding shock to their
balance sheet induced by the decline in interbank, cross-border lending. Our paper contributes to
this emerging literature by presenting evidence for a cross-border transmission by foreign banks in
a large cross-country setting, as well as by incorporating information on discouraged firms in the
empirical proxy for credit constraint.
The paper proceeds as follows. Section 2 presents the data. Section 3 describes the empirical
methodology and the identification strategy. Section 4 presents the main empirical results. Section
5 presents key robustness tests. Section 6 discusses the results. Section 7 concludes with the main
findings of the paper.
2 Data
The data for our analysis come from three main sources. The core firm level data come from
the 2005 and the 2008 waves of the Business Environment and Enterprise Performance Survey
(BEEPS), administered jointly by the World Bank and the European Bank for Reconstruction
and Development. The 2008 survey was carried out between March 10th and April 20th 2008
among 11, 998 firms in 29 central and eastern Europe and the former Soviet Union. 12, 280 firms
were initially targeted, suggesting a response rate of almost 98%. We complement this data with
analogical information on 11, 399 firms operating in the same countries and localities, derived from
the 2005 version of the survey. We focus on a sample of 16 countries for which foreign bank
ownership is suffi ciently relevant over the period in question. The final sample thus consists of
10, 701 firms, observed either in 2005 or in 2008, in the following 16 countries: Albania, Bosnia and
Herzegovina, Bulgaria, Croatia, Czech Republic, Estonia, Hungary, Latvia, Lithuania, Macedonia,
6

Montenegro, Poland, Romania, Serbia, Slovakia, and Slovenia.
The survey contains a variety of firm-level information, like ownership structure, sector of oper-
ation, industry structure, export activities, use of external auditing services, subsidies received from
central and local governments, etc. Respondent firms come from 6 different sectors: construction;
manufacturing (11 sub-sectors); transport; wholesale and retail; IT; and hotels and restaurants.
The number of firms covered is roughly proportional to the number of firms in the country, ranging
from 260 in Albania to 1, 592 in Poland. The survey tried to achieve representativeness in terms
of the size of firms it surveyed: between three quarters and nine tenths of the firms surveyed are
"small" (less than 20 workers) and only around 5% of the firms surveyed are "large" (more than
100 workers).8 The survey also aimed to achieve representativeness in terms of private vs. public
firms, firms with access to foreign product markets, firms which receive government subsidies, etc.
Table 1 provides the summary statistics on the number of firms and their size, ownership, and
market characteristics by country.9 Appendix 1 explains the construction of all firm-level (as well
as industry- and country-level) variables in the data.10
For the purpose of estimating the transmission of bank balance sheet conditions (including the
financial crisis) to firms, we focus on the information on credit constraints faced by the firms in the
past fiscal year. Question K16 asks: "Did the establishment apply for any loans or lines of credit in
fiscal year 2007?"11 For firms that answered "No" to K16, Question K17 subsequently asks: "What
was the main reason the establishment did not apply for any line of credit or loan in fiscal year
2007?". For firms that answered "Yes" to K16, Question K18a subsequently asks: "In fiscal year
2007, did this establishment apply for any new loans or new credit lines that were rejected?". Firms
that answered "No need for a loan" to K17 were classified as firms that do not desire bank credit.
Firms that answered "Yes" to K18a or "Interest rates are not favorable", "Collateral requirements
8See http://www.ebrd.com/country/sector/econo/surveys/beeps.htm for further detailed reports on the represen-tativeness of the survey.
9While foreign ownership is an important determinant of the firm’s need for external credit, this information isonly available in the 2005 survey and not in the 2008.10While it is also important to control for firm foreign ownership (see Antras, Desai, and Foley (2009)), this
information is only available in the 2008 BEEPS.11Fiscal year 2007 refers to the calender year 2007. However, for tax purposes, in the countries in the sample firms
can choose to extend it to March 31, 2008, which is precisely why the Survey was administered in March-April 2008.Given that signs of a credit crunch started emerging right after August 9, 2007 (see ECB (2010)), the data give usat least two and at most three quarters of credit crunch effects potentially experienced by firms.
7

are too high", "Size of loan and maturity are insuffi cient", or "Did not think it would be approved"
to K17 were classified as constrained. This strategy of grouping firms that were turned down and
firms that were discouraged from applying is also employed in Cox and Jappelli (1993) and in Duca
and Rosenthal (1993), who find that rejected and discouraged borrowers are almost identical on
observables, and is fairly standard in studies that rely on detailed questionnaires. Also, it is crucial
given our empirical strategy to separate the firms that did not apply for credit because they didn’t
need it from those that did not apply because they were discouraged. Table 2 presents a summary
by country of the shares of firms in need of bank loans and of constrained firms. As the data
suggest, while fewer firms needed credit in fiscal year 2007 than in fiscal year 2004 (60% vs. 70%),
a larger portion of the firms that needed credit were constrained (37% vs. 34%).
In addition to the information described above, BEEPS contains information on the locality
(city/town/village) where each firm is incorporated. A total of 1, 978 localities are present in
the data, for an average of 5.4 firms per locality. We next set to determine which banks are
physically present (i.e., have at least one branch) in each locality. First, pursuing a trade-off
between representativeness and manageability, we narrowed our focus to the banks that comprise
at least 80% of the banking sector assets in each country. This gives us a range of between 4 banks
in Estonia and 9 banks in Bulgaria, and arguably results in the exclusion of a number of small
banks. Given this criterion, we determined that the localities in the sample are served by a total of
155 banks. Out of those, 28 are domestic banks, and 127 are branches or subsidiaries of 23 foreign
banks. There is considerable variation in foreign bank penetration in the sample: in 2008, foreign
ownership of banking sector assets ranges from 22.8% in Slovenia to 98.9% in Estonia. Finally, we
searched the web sites of the 155 banks in the sample in order to determine in which city/town
each bank was present, and how many branches each bank had in each locality in which it was
present. In this way we could determine not just mere geographical presence, but also each bank’s
market share at the unit of observation of the locality.12
Armed with this bank branching network, we can next construct a locality-specific index of
12 In those cases where the firm is incorporated in a very small locality (for example, a village) where no bank ispresent, we used the branching network of the closest town with non-zero bank presence as a branching network forthis locality.
8

bank health by averaging information on all banks present, and then match this index to all firms
operating in that particular locality.13 To that end, we used Bankscope to extract balance sheet
information on the parent banks of the 155 banks in the sample. We collected data from 2005
to 2008 in order to evaluate how the condition of the banks’balance sheets is associated with a
potential change in credit supply. We chose our potential explanatory variables in the context of the
main issues surrounding the financial crisis of 2007-2008. The bursting of the housing bubble forced
banks to write down several hundred billion dollars in bad loans caused by mortgage delinquencies.
At the same time, the stock market capitalization of the major banks declined by more than twice
that amount. The total loss in financial assets globally is estimated in the trillions of dollars.
Central banks around the world pumped hundreds of billions of dollars in short-term liquidity,
alongside reducing discount rates at an unprecedented speed, in order to prop up illiquid and likely
insolvent banks (Brunnermeier (2009)).
Hence, we focused primarily on banks’capital ratios (Tier 1), equity, and gains/losses on finan-
cial assets. When a bank is foreign-owned, we focused on the financial position of the parent bank
in order to study, for example, how the investment allocation of UniCredit Group into MBSs and
the loss of capital associated with this allocation affects business lending by international branches
and subsidiaries of UniCredit. Table 3 summarizes the main variables of interest which were used
in the final empirical tests. There are apparent cross-country differences - for example, in 2008
Latvian banks had a somewhat low average Tier 1 capital ratio (6.52), close to the 4% regulatory
13The firm-bank matching at the locality level, which is central to the empirical analysis in the paper, helps explainwhy we have included only 16 countries from the original BEEPS survey. For one, we would like to capture at leastpartially the cross-border transmission of bank balance sheet conditions, which is why we exclude a number of countriesin the firm-level dataset for which foreign bank presence is low (we set an arbitrary threshold of 20%). Subsequently,we exclude countries like Azerbaijan (7.5% foreign ownership), Belarus (19.7% foreign ownership), Kazakhstan (5.4%foreign ownership), Russia (17.2% foreign ownership), Tajikistan (6.6% foreign ownership), Turkmenistan (1.1%foreign ownership), and Uzbekistan (4.4% foreign ownership).We also exclude Ukraine, which with 39.4% foreign ownership is in theory a good candidate. However, there are
175 banks operating in Ukraine, meaning that the data collection effort on the bank branching network in Ukrainewould be more extensive than for all of the other 16 countries in the sample. In addition, the banking sector inUkraine is very competitive, and while in the rest of the sample 80% of the assets in each country are held by at most9 banks, in Ukraine the top 9 banks control only 49.8% of the market. In order to get to our representative 80% oftotal assets, we would need to collect data on the branching network of at least 20 banks, which would result in avery noisy measure of locality-specific bank health.The resulting sample of 16 countries represents a good compromise between feasibility and coverage. Nevertheless,
some information on bank lending is lost by not including large countries like Russia, and some information on thecross-border dimension of bank lending is lost by exluding large countries with a substantial foreign bank presence,like Ukraine.
9

requirement, owing to the relative undercapitalization of their parent foreign banks, while Polish
banks had an average Tier 1 capital ratio of 9.39, mostly due to the fact that the largest bank
in Poland was the well-capitalized domestic bank PKO Bank Polski. Also, the banks present in
Macedonia incurred almost no losses on financial assets in 2007-08, while in 2008 the parents of
the banks present in the Czech Republic had an average ratio of gains on financial assets to total
assets of −0.40%. In general, banks were making on average gains on financial assets in 2005 and
losses on financial assets in 2008.
Appendix 2 illustrates the degree of foreign bank penetration in each country in the sample.
Clearly, a group of 23 western European and U.S. banks controls the vast majority of assets in
the region. These are Erste Group, Hypo Group, Raiffeisen, and Volksbank (Austria), Dexia and
KBC (Belgium), Danske Bank (Denmark), Nordea Bank (Finland), Societe Generale (France),
Bayerische Landesbank and Commerzbank (Germany), Alpha Bank, EFG Eurobank, Emporiki
Bank, National Bank of Greece, and Piraeus Bank (Greece), AIB (Ireland), Intesa Sanpaolo and
UniCredit Group (Italy), ING Bank (Netherlands), Swedbank and Skandinaviska Enskilda Bank
(Sweden), and Citibank (U.S.). There is also substantial regional variation in the degree of pene-
tration: for example, the Greek banks operate mostly in south-eastern Europe, the Scandinavian
banks in the Baltic countries, and the Austrian banks in central Europe. In addition, there is one
domestic "global" bank, the Hungarian OTP, as well as cross-border penetration by, for example,
Parex Group - Latvia and Snoras Bank - Lithuania.
3 Empirical methodology and identification
3.1 Transmission of bank financial conditions: Main empirical model
We want to estimate the transmission of balance sheet conditions from banks to businesses. We
hypothesize that 1) banks transmit their parents’conditions locally, and 2) the supply of credit is
more sensitive to parent balance sheet conditions for foreign-owned banks. For example, if bank-
firm relationships are particularly strong and important, banks may be reluctant to reduce credit
to their long-time domestic customers and shift more of the shock to overseas markets in response
10

to a negative shock (Peek and Rosengren (1997)).
We first use the 2008 cross-section data on bank balance sheets, firm characteristics, and access
to credit to check for a supply effect by estimating the following basic model:
Yijkl = β1 ·Xijkl + β2 · Financejk + β3 ·Dk + β4 ·Dl + εijkl (1)
where Yijkl is a dummy variable equal to 1 if firm i in city j in country k in industry l is credit
constrained in fiscal year 2007; Xijkl is a matrix of firm characteristics; Financejk is the index of
average bank balance sheet conditions in city j in country k; Dk is a matrix of country dummies; Dl
is a matrix of industry dummies; and εijkl is an idiosyncratic error term. The firm-level co-variates
control for observable firm-level heterogeneity. The two sets of dummy variables control for any
unobserved market and industry variation. Essentially, they eliminate the contamination of the
estimates by sectoral and macroeconomic circumstances, like growth opportunities, common to all
firms in the same industry, or taxes, common to all firms in a particular country.
Next, we pool the 2005 and 2008 samples in order to be able to conduct a proper pre-post
analysis using the full sample of firms that were observed either in 2007/2008 (the beginning of the
financial crisis) or in 2004/2005 (the peak of the credit cycle). We estimate two different models
on the pooled data. First, we estimate the model
Yijklt = β1 ·Xijklt+β2 ·Postt ·Financejkt+β3 ·Postt+β4 ·Financejkt+β5 ·Dk+β6 ·Dl+ εijklt (2)
In this model, we are able to capture the transmission of bank balance sheet conditions after
the crisis started relative to the transmission of identical bank balance sheet conditions before the
crisis started. We do not include year dummies, as the level effect over time is captured by the
variable Post, a dummy equal to 1 if the year is 2008.14
14BEEPS 2005 uses a SIC 1-digit classification, while BEEPS 2008 uses a SIC 2-digit classification dominated bymanufacturing. In order to match the industrial classification across the 2005 and the 2008 survey, we end up withthe following industries: manufacturing; construction; retail and wholesale; real estate, renting, and business services;and others.
11

Because the above model pools the data for all localities, including those present only in 2005
or only in 2008, we also estimate a model that allows us to compare variations in credit access over
time of "affected" vs. "non-affected" localities. This approach captures the special case of negative
shocks to bank balance sheets. In particular, we estimate the standard difference-in-difference
model
Yijklt = β1 ·Xijklt+β2 ·Non-Affectedjkt ·Postt+β3 ·Postt+β4 ·Non-Affectedjkt+β5 ·Dk+β6 ·Dl+εijklt
(3)
where Affected is a dummy variable equal to 1 if the respective finance variable decreased by
at least 1 standard deviation between 2005 and 2008. Consequently, Non-Affected is a dummy
variable equal to 1 if the respective finance variable decreased by less than 1 standard deviation
between 2005 and 2008.
The main parameter of interest in all three models is β2, which captures the transmission of
bank balance sheet conditions in the early stage of the financial crisis (Model 1), the transmission
of bank balance sheet conditions in 2007/08 relative to 2004/05 (Model 2), and the effect of a
change in the balance sheet conditions (Model 3) of the banks in each locality on credit access by
firms in that locality. As higher values of Financejk(t) are associated with superior balance sheet
conditions, we expect the sign of β2 to be negative in all models: financial health increases the credit
supply while financial distress induces a deterioration of credit conditions. We construct an index of
locality-specific bank balance sheet conditions index by aggregating balance sheet information from
Bankscope after determining which banks were present in that locality, and the original ownership
of each bank in that locality. The underlying assumption in the absence of a direct match of a loan,
a rejection, or a discouragement to a particular bank is that the credit outcome was most likely
the result of interaction with banks in the firms’locality of incorporation. We use three different
weighting criteria in constructing the index, namely, 1) giving equal weight to each bank in that
particular locality, 2) weighting each bank’s financial position by the number of branches it has in
the locality, and 3) weighting each bank’s financial position by the relative share of its subsidiary’s
12

assets.
Here is an example to clarify the above procedure. There are 4 banks in Estonia that hold close
to 100% of the banking assets in the country: Swedbank, SEB, Sampo Pank, and Nordea. They
are subsidiaries of Swedbank - Sweden, SEB - Sweden, Danske Pank - Denmark, and Nordea -
Finland. In 2008, the 4 parent banks had Tier 1 capital ratios of 8.4, 8.4, 6.9, and 12, respectively.
Consider the city Lihula in which only Swedbank has branches. We assign Lihula a Tier 1 capital
ratio of 8.4, and then we match this index of locality-specific bank balance sheet conditions with
all firms present in Lihula. Consider alternatively the city of Kuressaare, in which Swedbank, SEB,
and Nordea are present. They have 2, 1, and 1 branches in that city, respectively. Consequently, in
the main analysis, where we assign equal probability of each firm in that city doing business with
each bank present in that city, we assign a Tier 1 capital ratio of 9.6 = 13 ·8.4+
13 ·8.4+
13 ·12, which
is then matched to all firms located in Kuresaare. In the exercises where we weigh the probability
of each firm doing business with each bank present in Kuresaare by the number of that bank’s
branches in that locality, we assign a Tier 1 capital ratio of 9.3 = 12 · 8.4 +
14 · 8.4 +
14 · 12. When
weighting by subsidiaries’assets, we get a value of 8.4 for Lihula and 8.7 for Kuressaare.
This procedure gives us considerable variation of our main financial variables of interest within
each country, due to the fact that not all banks present in a country are present in each city, and
not to the same extent, if they are. For example, in the 2008 sample of firms, there are 1, 354
localities in the 16 countries in the sample, characterized by 276 unique values of locality-specific
Tier 1 capital when data on all banks in a locality are weighted equally, by 759 unique values of
locality-specific Tier 1 capital when data on all banks are branch-weighted, and by 419 unique
values of locality-specific Tier 1 capital when data on all banks are asset-weighted. Consequently,
there is little reason to worry that the country fixed effects in the regressions capture the same
variation as locality-specific financial conditions.
Second, in order to address question 2), we separate the balance sheet conditions of foreign
and domestic banks in each locality. In practice, we calculate two measures of bank financial
health/distress, one for all foreign-owned banks in a particular locality, and one for all domestic
banks in that same locality. Empirical models (1)-(3) are thus modified to incorporate two rather
13

than one measure of bank balance sheet conditions.
While in our specifications so far we are capable of estimating the transmission of bank financial
conditions net of industry-wide and country-wide economic developments that are common to all
firms in the respective industry (country), they don’t allow us to test whether bank financial
conditions differentially affect firms, and our estimates are prone to contamination by location-
specific unobservables. Regarding the first point, it is generally predicted that riskier firms and firms
with fewer tangible assets are more likely to be shut out of credit markets as a result of a negative
shock (see, for example, Berger, Ofek, and Swary (1996), Beck, Demirgüç-Kunt, and Maksimovic
(2005), and Brown, Jappelli, and Pagano (2009)). Regarding the second one, macroeconomic
circumstances like unemployment usually vary at the city level, and so our specification so far will
be contaminated by this variation. To address both points, we employ one final specification on
the 2008 cross-section:
Yijkl = β1 ·Xijkl + β2 · Financejk · Zl + β3 ·Dl + β4 ·Djk + εijkl (4)
Now the location dummies in Djk absorb the effect of locality-specific unobservables. The
interaction term containing the industry-level benchmark for asset tangibility in Zl allows us to
measure whether the potential credit supply effect is indeed strongest for those firms which theory
predicts are most vulnerable to credit market developments (firms with risky profit prospects, and
firms with little collaterizeable assets, for instance).
Finally, we need to emphasize that throughout the paper, it is implicitly assumed that the
transmission of bank balance sheet conditions is localized and directed to firms headquartered in
the locality in which the bank has operations. All of our empirical specifications presume that firms
borrow from, or are rejected or discouraged by, banks located near their address of incorporation,
which is identical to the approach in, for example, Gormley (2009). In general this is expected to
hold as banks tend to derive market power ex ante from geographical proximity (e.g., Degryse and
Ongena (2005)). Lending support to that conjecture, empirical work regarding lending relationships
in different countries has demonstrated that the average distance between SMEs and their banks is
14

usually very small. For example, Petersen and Rajan (2002) find that the median distance between
a firm and its main bank over the 1973-1993 period was only four miles; in Degryse and Ongena’s
(2005) sample, the median distance between a firm and it’s main bank is 2.25 kilometers (1.6 miles);
and in Agarwal and Hauswald’s (2010) sample, the median distance between a firm and it’s main
bank is 0.55 miles.15
3.2 Isolating demand shocks
It is a common challenge of studies that analyze the association between bank balance sheets and
lending to isolate supply shocks in a satisfactory fashion. In particular, it is likely that not only
does loan demand decline (increase) for all firms in periods when bank capital declines (increases),
but also the composition of firms that demand credit during busts (booms) changes. The solutions
to this problem vary in the literature. For example, Peek and Rosengren (1997) bypass this issue by
claiming that the identification problem is rather weak in the case of the international transmission
of shocks to balance sheets into a recession-free environment. However, the financial crisis of 2007-
2008 was followed by one of the deepest global recessions in post-war history, and this recession
was already being predicted as soon as the extent of the sub-prime mortgage meltdown became
apparent in late summer 2007. Hence, as we observe the firms in our sample in late 2007 and early
2008, it is conceivable that they were already behaving in a way consistent with a global recession
environment. Jimenez, Ongena, Peydro, and Saurina (2011) and Puri, Rocholl, and Steffen (2011)
incorporate data on loan applications to account for the weakening of the firm balance sheet channel.
However, this strategy does not account for the changing composition across business lenders of
firms that demand bank credit as these studies do not observe firms which select themselves out of
the loan application process due to 1) weak own demand for loans, or to 2) being discouraged by
the deteriorating lending environment. Failure to account for this changing composition will result
in a bias in the estimation of the true extent of the transmission of bank financial conditions.
As we explained in Section 2, we eliminate the contamination of the estimates induced by 2) by
incorporating data on discouraged firms in the measure of credit constraint. As for 1), we eliminate
15Arguably, the IT revolution and phone banking have recently diminished the role of geographic distance inbank-firm relationship.
15

the effect of the balance sheet channel by incorporating observable information on firms which did
not apply for bank credit in fiscal year 2007 because they did not need it (see Section 2 for the exact
definition). We apply Heckman’s (1979) selection procedure to eliminate the bias arising from the
left-truncation of the sample in that sense. Thus, credit constraint is only observable when a firm
actually applies for a loan, and the firm only does so if it needs one, or if it is not discouraged. Let
the dummy variable Q equal 1 if the firm desires positive bank credit and 0 otherwise. The value
of Q is in turn determined by the latent variable:
q = ζ · Zijkl + εijkl (5)
where Zijkl contains firm and location variables that may effect the firm’s fixed costs and
convenience associated with using bank credit. The variable Q = 1 if q > 0 and Q = 0 otherwise.
The error εijkl is normally distributed with mean 0 and variance σ2. Models (1)-(4) are then
updated by adding the term σ φ(q)Φ(q) to the RHS, where
φ(q)Φ(q) is the inverse of Mills’ratio (Heckman
(1979)). Identification rests on the exclusion restriction which requires that q has been estimated
on a set of variables that is larger by at least one variable then the set of variables in models (1)-(4),
respectively.
4 Empirical results
4.1 Bank credit application
Before estimating our empirical models, we first consider the bank credit application tests that
we use for our Heckman selection correction. Table 4 presents the results from the first stage
probit regression. The probability of positive demand for bank credit is generally higher for firms
in localities dominated by banks with weaker balance sheets. When balance sheet conditions are
measured in terms of equity (column (2)), Tier 1 capital (column (4)), and gains on financial assets
(column (7)), the effect is also significant in the statistical sense. Not accounting for this selection
would thus bias the estimates of the transmission of balance sheet conditions towards zero.
In terms of the firm-level co-variates, the demand for bank credit increases in the size of the
16

firm. One potential explanation is that small firms face higher application costs (Brown, Ongena,
Popov, and Yesin (2011)). Also, in a beginning-of-a-recession environment it might be that small
firms are better equipped to finance investment with cash flows than - potentially - more highly
leveraged large firms. In addition, some of the size effects may be picked by ownership and structural
characteristics, as sole proprietorships and public companies have a higher demand for loans. The
demand for bank credit is higher for exporters potentially due to their faster expansion, and for
audited firms, which might simply imply that firms choose to be audited (i.e., they are willing
to pay for transparency) when they plan to apply for bank credit.16 It may also be the case that
audited firms have access to financial statement lending which may be a cheaper lending technology.
In terms of the exclusion restriction, the variables "Competition" and "Subsidized" are included
in this demand model, but excluded from the rest of the exercises. The rationale for using these
particular variables as instruments for demand is the following. Firms in more competitive envi-
ronments will likely have a higher demand for external credit due to lower profit margins, but it
is unlikely that credit decisions will be correlated with product market competition. Analogically,
having applied for state subsidies is likely a signal for external financial need. These considerations
make both variables good firm demand shifters.17 Both variables are very positively correlated
with the demand for loans, the effect is statistically significant at the 1% level, and the overall
F -statistics from a first-stage regression of loan demand on the two variables (unreported) is 49.01.
4.2 Transmission of bank balance sheet conditions
4.2.1 Nonparametric difference-in-differences estimates
Table 5 gives a simple non-parametric illustration of our empirical strategy. We separate the data
across geographic and financial dimensions, for the special case of negative shocks to bank balance
16The results are broadly consistent with Ongena and Popov (2011) who apply a double selection technique to theBEEPS 2005 sample.17We cannot ensure, however, that the exclusion restriction is not violated. On the one hand, unlike size, ownership,
whether the firm exports or not, and whether the firm is audited or not (RHS variables in the credit supply equation)are more readily observed by the bank than whether the firm receives subsidies and how many competitors it has. Onthe other hand, firms in more competitive environments could be more effi cient, and if a firm is backed by governmentsubsidies, it can be viewed as less risky. If banks had this information, the validity of the instrument could be putinto question. While the two variables appear to be uncorrelated in a statistical sense with the probability of a firmbeing constrained - all else equal - we need to acknowledge this caveat.
17

sheets. Specifically, we average the data on credit constraints, across all localities in the dataset,
for the 2005 vs. the 2008 samples, and also for affected vs. non-affected localities. In determining
which localities are affected, we use Tier 1 capital and define "affected" as localities where the
average Tier 1 capital ratio of banks present in that locality decreased by at least one standard
deviation between 2005 and 2008.18 The table implies that credit constraints vary over time,
given different bank balance sheet conditions. In particular, average rejection rates for non-affected
localities didn’t change much between 2005 and 2008: they went from 32.9% to 34.3%, and this
increase is not statistically significant. In comparison, in affected localities rejection rates went up
to 40.2% in 2008, from 34.2% in 2005, with this increase being significant at the 1% level. Looking
at the same development from another angle, while rejection rates were similar for all banks in
2005, in 2008 they were much higher in localities where banks experienced a substantial decline in
core capital in the meantime. This result is the first piece of evidence that banks (both foreign
and domestic) reacted to their respective financial troubles early in the 2007-08 financial crisis by
shrinking their loan portfolios.
4.2.2 Transmission of bank balance sheet conditions: Cross-section results
We start the discussion of the results from our parametric tests by reporting in Table 6 the estimates
of the effect of bank balance sheet conditions on access to credit for all firms present in BEEPS 2008.
We report the results of the model in equation (1) alongside the results from the Heckman selection-
corrected version in order to contrast the two approaches. The three main financial conditions of
interest are: the ratio of equity to total assets; Tier 1 capital ratio; and the ratio of gains on
financial assets to total assets.
We first report the results from the model in which in calculating locality-specific measure of
bank balance sheet conditions, each bank is given equal weight in each locality where the bank is
present (Panel A). As expected, all else equal, small firms and sole proprietorships are more credit
constrained, potentially indicating lower ability to tap alternative capital markets; audited firms are
less constrained, implying gains from the reduction of informational opacity; and firms that export
18The results are qualitatively unchanged when we use a two standard deviation decline instead.
18

part of their production are less constrained, potentially signalling the willingness of banks to lend
to firms with higher growth prospects. The variables of interest have a generally insignificant impact
on the probability of firms being constrained in the credit market when selection is accounted for,
with the sign of Tier 1 capital going in the expected direction.
When we apply our preferred weighting criterion in Panel B, namely, weighting the probability
of the firm doing business with each particular bank by the number of branches the bank has in that
locality, we find a large, negative, and significant impact of a bank Tier 1 capital ratio on rejection
rates. The magnitude of the effect is also economically meaningful: for example, a 2-standard
deviation increase in the average Tier 1 capital ratio for banks in a particular locality decreases the
probability of identical firms in this locality being credit constrained by about 8.5% (column (4)).
Gains on financial assets seem to be associated with higher constraints (column (5)).
Panel C, where we construct each financial variable by weighting parent bank health by sub-
sidiaries’assets, confirms this result: higher Tier 1 capital is associated with lower credit constraints
(columns (4)), while gains on financial assets are associated with higher constraints (columns (5)
and (6)). This implies that banks tend to contract their balance sheets in response to capital losses,
but expand them in response to asset losses. In all panels, the sign of the inverse of Mills’ratio is
generally positive, but insignificant.
Finally, recall that by looking at fiscal year 2007, we are capturing only the initial stages of
the crisis up to March 31, 2008. In addition to that, our results are contaminated by months of
pre-crisis experience before August 2007. In that sense, if there is bias in our estimates, it only
goes against finding any transmission of crisis-related bank conditions. The large and statistically
significant effect of low Tier 1 capital, for example, on rejection rates could thus only be a lower
bound of the true effect.
4.2.3 Transmission of bank balance sheet conditions over time
We now turn to the transmission of bank balance sheet conditions to firms that are present either
in the 2008 or in the 2005 BEEPS, employing the Heckman selection-corrected version of model
(2). This allows us to account for the changing composition of firms that select themselves out of
19

the application process, going from the peak to the trough of the credit cycle. In other words, the
information on whether firms do not apply for credit because they don’t need it, or because they
are discouraged, and how that changes over time, is used to eliminate the potential contamination
of our estimates by the correlation between credit needs and bank balance sheet conditions. In
addition, we can compare the effect of an identical bank balance sheet condition in 2008 relative
to 2005.
These results are reported in Table 7, Panel A.19 In this specification, we find conflicting evidence
on the effect of equity capital on credit constraints (columns (1) and (2)). Similar to Table 6, we
again find that higher Tier 1 capital is associated with lower credit constraints when we weight
each bank’s presence in a locality equally (column (4)) or by number of branches (column (5)).
The interpretation of the coeffi cient on the branch-weighted Tier 1 capital is that for the sample
average Tier 1 capital, for example, an identical firm had a 6% higher chance of being constrained in
fiscal year 2007 than in fiscal year 2004. Importantly, we confirm that not accounting for selection
introduces downward bias. The sign of the inverse of Mills’ ratio is generally negative, and this
time significantly so, implying that firms which did not apply for a loan would have faced a higher
probability of being rejected. Finally, this time we find that gains (losses) on financial assets are
associated with lower (higher) credit constraints (Columns (8) and (9)), implying that over the
credit cycle, firms’access to credit was higher if they were borrowing from banks whose financial
assets were appreciating rather than depreciating in value.
In panel B of Table 9, we look at the special case of negative shocks to bank balance sheets
(Model (3)). We only look at localities for which at least 1 firm is present both in 2005 and in
2008. Now instead of levels, we look at changes in bank balance sheet conditions over time. We
define affected localities as ones in which the financial variable of interest declined by at least one
standard deviation between 2005 and 2008.20
In this specification, we find that changes in equity capital and in Tier 1 capital are transmitted
to the corporate sector through business lending. For example, consider our measure of average Tier
19 In all tables to follow, only coeffi cients of interest are reported for brevity.20This procedure is robust to taking a two-standard deviation decline instead, and to using the top quartile change
vs. the bottom quartile change (results available upon request).
20

1 capital constructed by weighting information on each bank present in a locality by subsidiaries’
assets (column (6)). We find, for example, that in localities where Tier 1 capital declined by at least
one standard deviation between 2005 and 2008, the probability of a firm being credit constrained
increased by 10.2% more than for an identical firm in a locality where whose banks’equity capital
increased or declined by less.
We use these estimates to assess the overall change in lending due to the change in banks’
balance sheet conditions in the beginning of the 2007-08 financial crisis. For example, at the onset
of the crisis around 64.8% of the firms in localities present in both the 2005 and the 2008 survey
had a positive demand for bank credit in 2007/08. In 82.8% of these localities, the parent banks
experienced at least one standard deviation decrease in Tier 1 capital between 2005 and 2008, and
our difference-in-differences estimates imply a 10.2% increase in the probability of a firm being
credit constrained (all else equal) associated with deteriorating balance sheet conditions of parent
banks. This implies that 5.4% of the overall population of firms were credit constrained (in terms
of new lending) above and beyond what would have been the case if Tier 1 capital at parent banks
had declined by less than one standard deviation.
4.2.4 Transmission of bank balance sheet conditions: Foreign vs. domestic banks
The evidence so far raises the question whether the elasticity of credit supply to bank balance sheet
conditions is different for foreign and for domestic banks? We have so far only investigated the effect
of bank balance sheet conditions on access to finance for the average bank in a locality, regardless
of its ownership. Now we explicitly test for the variation in the transmission of bank balance sheets
conditions between foreign-owned and domestic-owned banks. We do so by calculating two measures
of balance sheet conditions for each locality: one constructed by averaging the respective average
financial condition for all foreign banks in a locality, and one by averaging financial conditions for
all domestic banks in that same locality.
Before we report the estimates, recall that our empirical strategy relies on gauging the intra-
country cross-locality variation in access to finance. Therefore, in this specification we are not
comparing changes in credit supply in a foreign bank-dominated country, like Estonia, to changes
21

in credit supply in a domestic bank-dominated country, like Slovenia. We are instead comparing
changes in credit supply within the same country across foreign bank-dominated and domestic
bank-dominated localities, as well as between foreign banks and domestic banks within the same
locality.
Table 8 reports the estimates from models (1)-(3), after splitting the bank balance sheet con-
dition variable(s) into a foreign component and a domestic component. In the 2008 cross-sectional
tests, the sensitivity of credit supply to bank balance sheet conditions turns out to vary between
foreign and domestic banks. For example, firms are considerably less credit constrained if the for-
eign banks in their locality of operation have more equity capital (column (1)). At the same time,
bank credit supply seems to respond to changes in the Tier 1 capital of both foreign banks (column
(4)) and of domestic banks (column (5)).
Turning to the transmission of bank balance sheet conditions over time, the results are somewhat
ambiguous in the case of bank capital. For example, firms doing business with foreign banks which
experienced a decline in Tier 1 capital between 2005 and 2008 were more constrained in 2008
(column (5)), while they were less constrained in localities where domestic banks went through this
kind of experience (column (4)). At the same time, the direction of the effect is reversed in the
case of equity capital. However, in the case of gains or losses on financial assets, the estimates
consistently point to the fact that firms were more credit constrained in localities where the foreign
banks experience losses on financial assets, but less constrained if domestic banks experienced them.
The combined evidence is thus weakly suggestive of the fact that domestic banks facing similar
shocks were less likely to abandon their customers than foreign banks whose principal customer
base is abroad (Peek and Rosengren (1997)).
4.2.5 Transmission of bank balance sheet conditions and firm characteristics
Next, we ask which firms are most sensitive to the transmission of bank balance sheet conditions.
There are clear arguments in the literature on which firms and industries should be most affected
by a decline in credit. Firm risk and the tangibility of the firm’s assets, for example, are expected
to play an important role in explaining differences in credit availability across firms. High-risk firms
22

tend to be most affected by changes in credit conditions, especially when foreign bank lending is
involved (Berger, Klapper, and Udell (2001)). Regarding asset tangibility, Berger, Ofek, and Swary
(1996) show that firms with less tangible assets are more likely to lose access to credit when banks
reprice risk. The rationale is that lenders rely more on collateral when making lending decision
rather than investing in costly screening technologies, and this problem will tend to be exacerbated
in an environment where risk is suddenly priced higher.
We proceed by collecting data on mature U.S. firms and using it to construct industry bench-
marks for riskiness and asset tangibility. The rationale for doing so goes back to Rajan and Zin-
gales (1998) who argued that the actual corporate structure of small firms is a function of financial
constraints, while the corporate structure of large mature firms is more representative of the cross-
industry variations in the scale of projects, gestation period, the ratio of tangible vs. intangible
assets, R&D investment, etc. In addition, doing so for large U.S. firms ensures that what is taken
as a "natural" industry feature is not contaminated by shallow financial markets. The idea is that
large listed U.S. firms are not constrained in their choice of a corporate structure, so their financing
decisions reflect the industry’s natural demand for funds.
We start by taking all Compustat firms between 1990 and 2000. We first exclude all firms that
are young in the sense that they have gone public only recently (in the last 10 years) to make
sure that we are not capturing the excessive appetite for funds exhibited during the early life of a
public firm. For each firm, we sum across all years its ratio of research and development expenses
over sales. We take the median industry value of that ratio and this value constitutes our industry
benchmark for "R&D intensity". This is both a measure of risk and of asset tangibility: firms with
a lot of R&D investment will simultaneously have riskier returns due to more uncertain profits, and
less collaterizeable assets. Second, we sum across all years each firm’s ratio of total physical capital
used in production over the number of employees. The industry median value of that variable
constitutes our industry benchmark for "Capital intensity", which again captures partially risk and
partially asset tangibility.
Table 9 reports the estimates of equation (4) where each measure of bank balance sheet con-
ditions has been interacted with the industry benchmark for "R&D intensity" and for "Capital
23
intensity". A negative coeffi cient on the interaction term in the first case and a positive coeffi cient
in the second case would imply that the transmission of identical changes in the banks’balance
sheets is larger for firms with fewer collateralizeable assets to pledge. We only focus on financial
conditions as measured by Tier 1 capital ratios, as this is the one measure that is most consistently
significant in the analysis so far. Importantly, this specification gives us interaction at the city
and industry level, and thus we can include city dummies in the regression. The direct effect of
local bank conditions is now fully absorbed by the city dummies, along with any unobservable
variation in macroeconomic conditions at the location level. The effect on credit constraints of the
sector-wide variation in growth opportunities is absorbed by the industry dummies, as before.
The results confirm the intuition: the transmission of bank balance sheet conditions to the cor-
porate sector is stronger for firms which have riskier growth prospects, or do not have enough assets
to pledge as collateral. Numerically, the same branch-weighted Tier 1 capital ratio is associated
with a 6% higher probability of loan rejection for firms in industries with the highest R&D intensity
than for firms in industries with the lowest R&D intensity; and with a 31.2% higher probability of
loan rejection for firms in industries with the lowest per-worker capital than for firms in industries
with the highest per-worker capital.21 We are only capturing bank behavior with respect to new
loans, so this evidence is insuffi cient to alleviate concerns for a Japanese-style evergreening in the
early stages of the 2007-08 crisis. However, the evidence does suggest that in the special case of
negative balance sheet shocks, banks did not respond to financial distress by extending more loans
to high-risk high-return projects.
5 Endogeneity and robustness
Finally, in Table 10, we address various potential problems with our data and with our empirical
methodology. Probably the most important of these is the issue of the endogeneity of foreign bank
entry: for example, foreign banks may in particular enter countries which grow faster during good
21 In unreported exercises, we performed a robustness check interacting the industry benchmarks with the Frisch-Waugh residuals derived from a regression of the finance variable on each industry benchmark. This procedure isaimed at hedging against a spurious interaction term (see Ozer-Balli and Sorenson (2010) for details), and it leavesour estimates qualitatively unchanged (results available upon request).
24

times but where demand deteriorates more during recessions because of the industrial or trade mix
of the country’s economy. On the face of it, given our within-country cross-locality identification
strategy, we shouldn’t worry about this as much as studies which use country-level foreign bank
presence as explanatory variable (see, for example, Giannetti and Ongena (2009)): the dominant
mode of entry for foreign banks in the region was through purchasing existing banks rather than
through greenfielding, and so while the entry choice is endogenous, the variation of local presence
is somewhat predetermined conditional on entry. Nevertheless, it is still entirely possible that the
purchaser took into account the conditions of the target bank, including its customer base and
geographic outreach. In this case, the composition of local presence by foreign banks will not be a
randomly applied treatment.
In order to address this problem, we attempt to extract the endogenous element of entry using
an instrumental variable (IV) procedure. To that end, we need instrumental variables which are
correlated with the entry choice but not with local variations in the customer base. The set of
instruments that we use includes: 1) geographical distance to bank headquarters; 2) local protection
of creditors’rights; 3) whether the country is a member of the euro area; and 4) whether the country
is a member of the EU. The rationale behind this choice is that banks prefer to enter and extend
loans in markets that are more institutionally similar (geographic proximity, common currency,
common legal framework), and where their investments are better protected. This procedure is
reminiscent of Jayaratne and Strahan (1996) who use the removal of barriers to bank entry in the
U.S. as an instrument to show that improvements in the quality of bank lending are causally related
to economic performance. As column (1) indicates, our results are only strengthened by this IV
procedure.
The next problem relates to the possibility that year-end 2008 data do an inferior job of captur-
ing bank balance sheet conditions at year-end 2007/start of 2008. Year-end 2007 data are clearly
more contemporaneous to our sample period, however, our choice of using year-end 2008 data
throughout the paper is motivated by the fact that accounting performance data arguably lag real
performance. For example, Citibank looked in relatively good financial health in year-end 2007,
but only because much of their financials were not marked to market. Nevertheless, we perform
25

a robustness check in which all locality-specific bank balance sheet conditions are calculated using
year-end 2007 data from Bankscope. As indicated by column (2), while the statistical effect of
Tier 1 capital on bank lending decreases somewhat relative to column (4) in Table 7, Panel C, it is
nevertheless still statistically significant, implying that 2007 and 2008 data give a somewhat similar
picture of the phenomenon we are attempting to capture.
Another problem might be the fact that throughout the paper, we have been using consolidated
data to calculate locality-specific measures of bank balance sheet conditions. This is consistent
with the purpose of the paper, namely, to partially capture the effect of parent-bank conditions
on lending abroad.22 However, parent banks in our sample are almost exclusively present through
subsidiaries, and not through branches, and it is tempting to argue that parent health should matter
very little next to subsidiary health given that subsidiaries tend to be separately capitalized. The
cross-border internal capital markets in the region have been shown to be very active (De Haas
and van Lelyveld (2011)), and the Vienna Initiative from early 200923 is a clear indication that
governments and regulators in host countries were worried about a capital outflow regardless of
local subsidiary health. We nevertheless take this concern to the data. In column (3), we include
in the regression a measure of local bank conditions which is calculated using year-end 2008 data
on the local subsidiaries. On its own, the effect of local subsidiary balance sheet strength turns
out to be uncorrelated with bank lending, while parent bank balance sheet conditions continue to
command a significant and large effect.
Another concern is that accounting data may capture poorly - even with the appropriate lag
- the bank’s actual financial situation, and so market indicators of bank stress, like CDS spreads,
would be a better indicator. In addition, because these indicators have a higher frequency, they
could capture better the actual bank stress at the time of the survey. We proceed to collect data on
22We note that our data, unlike the U.S. data used in Ceterolli and Goldberg (2009), do not permit us to directlyobserve the workings of the internal capital markets of the foreign banks in our sample so we cannot identify theprecise mechanism through which the spillover effect operates. In this regard our approach is similar to recent studiesof cross border spillover effects within the U.S. (Berrospide, Black, and Keeton 2011) and internationally (Ceterolliand Goldberg 2010).23The Vienna Initiative was launched in January 2009 by the IMF, EBRD, EIB, the World Bank, the EU, ECB,
home and host country regulators and the largest bank groups present in the region of central and eastern Europe to"[...] prevent a large-scale and uncoordinated withdrawal of cross-border bank groups from the region." See EBRD(2010) for details
26

CDS spreads for all parent banks for 2008:Q1 (the last quarter before the survey was administered).
Unfortunately, the data do not exist for some of the banks in the sample (notably, all Greek banks,
as well as Swedbank). This results in a somewhat reduced sample. Nevertheless, we confirm our
main result: firms in localities dominated by banks whose CDS spreads were higher in the beginning
of 2008 faced higher credit constraints (column (4)). Therefore, the transmission of financial distress
we detected in our main tests seems to be robust to using market instead of accounting data.
Also potentially problematic are two natural objections to our procedure of calculating an
average index of local bank conditions and then matching it to all firms in that locality. The first is
that many firms which can afford it could be doing business with banks outside of their locality of
incorporation, in a hunt for better credit conditions. The second is that the more banks there are
in this locality, the more poorly our measure of average bank balance sheet conditions will capture
actual firm experience. We address the first concern by looking only at small young firms for which
the cost of applying for credit far from their locality of incorporation is too high given the expected
gain in loan terms (Degryse and Ongena (2005)) and which should therefore be more restricted
in their geographic choice of a main bank (column (5)). We address the second by looking at the
experience of the same set of firms, but only in localities where there are at most two banks (column
(6)). Both procedures do not eliminate the significance of our results, so we conclude that they are
not driven by mismeasuring true financial distress or by imposing non-existing bank relationships.
Finally, while our procedure is by its nature tailored to eliminate the effect of demand on
the measured transmission of shocks, the firms in the data come from a relatively export-driven
economic region. It is possible then that both firm demand for credit and banks’assessment of
the market for firms’products may be heavily influenced by whether the firms export to the most
crisis-affected countries. If they do, then any observed decline in lending may be due declining
foreign demand for the output of the firms that do business with these banks. Credit demand
and credit supply would then be driven by the same shock and our identification strategy would
break down. While we have so far controlled for whether firms export, we have not controlled for
where they export to. As this information is not available, we check whether our results are robust
to excluding all exporting firms from the sample (column (7)). Our main result survives with
27

an undiminished magnitude, suggesting that the effects we document are not due to the demand
channel contaminating the supply channel.
6 Discussion of results
It is important to reconcile our findings with, for example, Navaretti, Calzolari, Possolo, and Levi
(2010) and Cetorelli and Goldberg (2011), who find that total outstanding loans by foreign affi liates
in central and eastern Europe did not decrease in the early stages of the crisis. Given that these
papers look at total loans outstanding, while we look at new bank credit, our evidence does not
necessarily contradict these other results. The two sets of findings can be reconciled by the simple
difference between stocks and flows: a decline in new loans does not necessarily imply a decline
in total loans outstanding, if the unused portion of credit lines and overdraft facilities are utilized.
The evidence suggests that this occurred in the early stages of the crisis in the U.S., as argued
by Cohen-Cole, Duygan-Bump, Fillat, and Garriga (2008) in response to Chari, Christiano, and
Kehoe (2008): while new bank credit declined dramatically after the collapse of Lehman Brothers,
total credit outstanding remained almost flat as firms started drawing extensively on their existing
credit lines.
Our results offer important insights into the role of foreign banks in emerging markets. In
general, the effect of foreign banks on business lending in the literature is ambiguous. A large
literature has found that foreign bank presence is associated with higher access to loans (Clarke,
Cull, and Peria (2006)), higher firm-level sales (Giannetti and Ongena (2009)), and lower loan rates
and higher firm leverage (Ongena and Popov (2011)). On the other hand, Berger, Klapper, and
Udell (2001), Mian (2006), and Gormley (2009) show that foreign banks tend to finance only larger,
established, and more profitable firms. Such evidence is mostly derived from experience during
"good times". Our paper complements that picture by providing evidence that foreign-owned
banks tend to adjust their loan portfolios following shocks to their parent’s financial condition.
Managerial issues might be important here given the managerial challenges associated with cross
border banking (e.g., Berger, DeYoung, Genay, and Udell (2000)). Managerial focus on solving
28

problems at the headquarters level in the home country could reduce the ability of the parent bank
to monitor lending activities in its foreign facilities. Given the organizational frictions associated
with lending a la Stein (2002), this reduced monitoring ability could have a disproportional effect
on the contraction of credit by foreign banks. Perhaps our results on foreign bank behavior are
also related to the more general finding in the literature that lending tends to be pro-cyclical (e.g.,
Borio, Furfine, and Lowe (2001), Dell’Ariccia, Igan, and Laeven (2008), Pannetta et al. (2009)).
Our finding that riskier borrowers are more affected might even suggest a link to the institutional
memory explanations of pro-cyclical lending behavior (e.g., Berger and Udell (2004)) where eroded
lending expertise is more problematic at foreign banks.
Finally, we need to acknowledge one caveat. While balance sheet conditions of domestic banks
reflect local market conditions, balance sheet conditions of foreign parent banks would be dominated
by conditions elsewhere, suggesting that the average financial condition in a locality may depend on
the extent to which local market conditions differ from the average of markets in which the foreign
owned banks operate. Moreover, foreign banks have operations in lots of different locations and
countries, so there is an issue about how their internal capital markets work to allocate resources
across their web of banks. Whether a multinational bank allocates more resources to, or pulls
back from, a particular location may depend on the opportunities in that location relative to its
opportunities in its other far-flung operations. While it is next to impossible to account for such
differential opportunities directly (for example, UniCredit has over 10,000 branches in 22 countries,
and Citigroup operates in more than 100 countries), and while the consolidated data we use by
construction capture the parent bank’s overall financial conditions, it is fair to admit that our
empirical models based on measures of parent bank condition may not fully capture this effect.
7 Conclusion
A substantial amount of financial services in emerging Europe are delivered by foreign banks, and
evidence amounts of the benefits of foreign bank ownership when credit markets function properly.
However, borrowers are not insulated from negative shocks to bank financial conditions, should
29

such arise. Since the early stages of the 2007-08 financial crisis, policy-makers have been concerned
that banks might curtail lending to retail customers in response to declining bank capital and to
mounting asset losses. Because of the dominant role western European banks hit by the crisis play
in the region, it was feared that firms in central and eastern Europe would be particularly heavily
hit, despite the fact that the negative shocks to their parents’balance sheets originated elsewhere.
In this paper, we use survey data on 10, 701 SMEs in 16 emerging European countries to
investigate empirically the transmission of financial conditions from banks to business customers
before and during the financial crisis. The major benefit of the data is that we observe firms
that were discouraged from applying for bank credit by unfavourable credit market conditions, in
addition to firms that received a loan or were denied one. Several recent studies have documented
a credit supply effect during both good and bad times. However, our paper is the first one to
simultaneously capture the indirect cross-border dimensions of this phenomenon, as well as to
eliminate the contamination of the lending channel by the selection bias resulting from changes in
firms’demand for credit and by the failure to account for discouragement in proxying for credit
constraints.
We find that different types of financial shocks - both positive and negative - at foreign as well
as domestic banks are associated with a significant impact on business lending to firms in emerging
Europe over the credit cycle. Our evidence shows that SMEs report higher credit constraints
in localities dominated by branches or subsidiaries of banks which have low equity capital and
low Tier 1 capital ratios, and which have recorded losses on financial assets. The evidence is
particularly strong during the early stages of the 2007-08 financial crisis. Our results are robust
to controlling for the endogeneity of foreign bank entry, to the choice of end-2007 vs. end-2008
data and of accounting vs. market data on financial conditions, to accounting for the possibility
that weakening credit demand and weakening credit supply originate from the same shock, and
to eliminating the bias resulting from the systematic self-selection of firms out of the application
process. We also find that high-risk firms and firms with fewer tangible assets are relatively more
sensitive to shocks to bank capital. Our evidence also implies that all else equal, firms in countries
where major portions of the banking market were held by relatively undercapitalized foreign banks
30
were more credit constrained than identical firms in countries served by better capitalized foreign
banks. Our paper thus presents evidence of the transmission of negative shocks to bank balance
sheets in the relatively early stages of the 2007-2008 financial crisis, in a way unrelated to the
demand for loans in local markets.
The global nature of the financial crisis has finally laid to rest the idea that the effect of large
financial shocks can be confined locally. While the financial crisis only started in the third quarter
of 2007, European banks continued tightening credit standards deep into 2010.24 Thus, despite the
coordinated actions of various national and supranational authorities to keep the global financial
system operational once tensions emerged in interbank markets in August 2007, it is likely that the
losses that the financial system endured have induced a much larger impact on the real sector than
the one estimated in this paper. The true extent of the financial crisis and its effect on firm access
to finance will only become clear when new, more comprehensive data become available.
24See ECB (2010) for details.
31

References
[1] Agarwal, S., and R. Hauswald, 2010. Distance and private information in lending. Review of
Financial Studies 23, 2757-2788.
[2] Antras, P., Desai, M., Foley. F., 2009. Multinational firms, FDI, and imperfect capital markets.
Quarterly Journal of Economics 124, 1171-1219.
[3] Beck, T., Demirgüç-Kunt, A., Maksimovic, V., 2005. Financial and legal constraints to growth:
Does firm size matter? Journal of Finance 60, 137-177.
[4] Berger, A., DeYoung, R., Genay, H., Udell, G., 2000. Globalization of financial institutions:
Evidence from cross-border banking performance. Brookings-Wharton Papers on Financial
Services, 23-120.
[5] Berger, A., Klapper, L., Udell, G., 2001. The ability of banks to lend to informationally opaque
small businesses. Journal of Banking and Finance 25, 2127-2167.
[6] Berger, A., Udell, G., 1994. Did risk-based capital allocate bank credit and cause a "credit
crunch" in the United States? Journal of Money, Credit, and Banking 26, 585-628.
[7] Berger, A., Udell, G., 2004. The institutional memory hypothesis and the procyclicality of
bank lending behavior. Journal of Financial Intermediation 13, 458-495.
[8] Berger, P., Ofek, E., Swary, I., 1996. Investor valuation of the abandonment option. Journal
of Financial Economics 42, 257-287.
[9] Bernanke, B., Lown, C., 1991. The credit crunch. Brookings Papers on Economics Activity 2,
205-248.
[10] Berrospide, J., Black, L., Keeton, W., 2011. The cross-market spillover of economic shocks
through multi-market banks. Federal Reserve Board working paper.
[11] Borio, C., Furfine, C., Lowe, P., 2001. Procyclicality of the financial system and financial
stability: Issues and policy options. BIS Papers No. 1, March 1-57.
32

[12] Brown, M., Jappelli, T., Pagano, M., 2009. Information sharing and credit: Firm-level evidence
from transition countries. Journal of Financial Intermediation 18, 151-172.
[13] Brown, M., Ongena, S., Popov, A., Yesin, P. 2011. Who needs credit and who gets credit in
Eastern Europe? Economic Policy 26(65), 93-130.
[14] Brunnermeier, M., 2009. Deciphering the liquidity and credit crunch 2007-2008. Journal of
Economic Perspectives 23, 77-100.
[15] Cetorelli, N., Goldberg, L., 2009. Banking globalization and monetary transmission. Federal
Reserve Bank of New York Staff Reports No. 333.
[16] Cetorelli, N., Goldberg, L., 2011. Global banks and international shock transmission: Evidence
from the crisis. IMF Economic Review 59, 41-76.
[17] Chakravarty, S., Yilmazer, T., 2009. A multistage model of loans and the role of relationships.
Financial Management 38, 781-816.
[18] Chari, V., Christiano, L., Kehoe, P., 2008. Facts and myths about the financial crisis of 2008.
Working Papers 666, Federal Reserve Bank of Minneapolis.
[19] Chava, S., Purnanandam, A., 2010. The effect of a banking crisis on bank-dependent borrowers.
Journal of Financial Economics 99, 116-135.
[20] Clarke, G., Cull, R., Peria, M., 2006. Foreign banks participation and access to credit across
firms in developing countries. Journal of Comparative Economics 34, 774-795.
[21] Cohen-Cole, E., Duygan-Bump, B., Fillat, J., Montoriol-Garriga, J., 2008. Looking behind the
aggregates: A reply to "Facts and Myths about the Financial Crisis of 2008", Quantitative
Analysis Unit Working Paper QAU08-5, Federal Reserve Bank of Boston.
[22] Cox, D., Jappelli, T., 1993. The effect of borrowing constraints on consumer liabilities. Journal
of Money, Banking and Credit 25, 197-213.
33

[23] De Haas, R., van Horen, N., 2009. The crisis as a wake-up call: Do banks tighten lending
standards during a financial crisis? European Bank for Reconstruction and Development
mimeo.
[24] De Haas, R., van Horen, N, 2011. Running for the exit: International banks and crisis trans-
mission. European Bank for Reconstruction and Development Working Papers 124.
[25] De Haas, R., van Lelyveld, I., 2010. Internal capital markets and lending by multinational
bank subsidiaries. Journal of Financial Intermediation 19, 1-25.
[26] Degryse, H., Ongena, S., 2005. Distance, lending relationships, and competition. Journal of
Finance 51, 231-266.
[27] Degryse, H., Havrylchyrk, O., Jurzyk, E., Kozak, S., 2010. Foreign bank entry and credit
allocation in emerging markets. Tilburg University working paper.
[28] Dell’Ariccia, G., Igan, D., Laeven, L., 2008. Credit booms and lending standards: Evidence
from the subprime mortgage market. IMF Working Paper, WP/08/106.
[29] Duca J., Rosenthal, S., 1993. Borrowing constraints, household debt, and racial discrimination
in loan markets. Journal of Financial Intermediation 3, 77-103.
[30] EBRD, 2007. "Credit Crunch". Interview with Erik Berglof, Chief economist of the European
Bank for Reconstruction and Development.
[31] EBRD, 2010. "Vienna Initiative Factsheet".
[32] ECB, 2008. "Financial Stability Review." December 2008.
[33] ECB, 2010. "Financial Stability Review." December 2010.
[34] Giannetti, M., Ongena, S., 2009. Financial integration and firm performance: Evidence from
foreign bank entry in emerging markets. Review of Finance 13, 181-223.
[35] Gormley, T., 2010. The impact of foreign bank entry in emerging markets: Evidence from
India. Journal of Financial Intermediation 19, 26-51.
34

[36] Gorton, G., 2010. Slapped by the Invisible Hand: The Panic of 2007. Oxford University Press.
[37] Hancock, D., Wilcox, J.A., 1998. The "credit crunch" and the availability of credit to small
business. Journal of Banking and Finance 22, 983-1014.
[38] Hayashi, F., Prescott, E., 2002. The 1990s in Japan: A lost decade. Review of Economic
Dynamics 5, 206-235.
[39] Heckman, J., 1979. Sample selection bias as specification error. Econometrica 47, 153-161.
[40] Houston, J., James, C., Marcus, D., 1997. Capital market frictions and the role of internal
capital markets in banking. Journal of Financial Economics 46, 135-164.
[41] Ivashina, V., Scharfstein, D., 2010. Bank lending during the financial crisis of 2008. Journal of
Financial Economics 97, 319-338.
[42] Jayaratne, J., Strahan, P.E., 1996. The finance-growth nexus: Evidence from bank branch
deregulation. Quarterly Journal of Economics 111, 639-670
[43] Jimenez, G., Ongena, S., Peydro, J., Saurina, J., 2011. Monetary policy and credit crunch:
Identifying simultaneously the bank lending and balance sheet channels. American Economic
Review, forthcoming.
[44] Kang, J., Stulz, R., 2000. Do banking shocks affect borrower firm performance? An analysis
of the Japanese experience. Journal of Business 73, 1-23.
[45] Kashyap, A., Stein, J., 2000. What do a million observations on banks say about the trans-
mission of monetary policy? American Economic Review 90, 407-428.
[46] Khwaja, A., Mian, A., 2008. Tracing the impact of bank liquidity shocks: Evidence from an
emerging market. American Economic Review 98, 1413—1442.
[47] Mian, A., 2006. Distance constraints: The limits of foreign lending to poor economies. Journal
of Finance 61, 1465-1505.
35

[48] Navaretti, G., Calzolari, G., Pozzolo, A., Levi, M., 2010. Multinational banking in Europe:
Financial stability and regulatory implications - lessons from the financial crisis. Economic
Policy 25(64), 703-753.
[49] Ongena, S., Popov, A., 2011. Interbank market integration, loan rates, and firm leverage.
Journal of Banking and Finance 35, 544-560.
[50] Ozer-Balli, H., Sorenson, B., 2010. Interaction effects in econometrics. University of Houston
mimeo.
[51] Pannetta, F., Angenlini, P., Albertazzi, U., Columba, F., Cornacchia, W., Di Cesare, A.,
Pilati, A., Salleo, C., Santini, G., 2009. Financial sector pro-cycliclity: Lessons from the crisis.
Bank of Italy Occasional Papers No. 44.
[52] Paravisini, D., 2008. Local bank financial constraints and firm access to external finance.
Journal of Finance 63, 2161-2193.
[53] Peek, J., Rosengren, E., 1995. The capital crunch: Neither a borrower nor a lender be. Journal
of Money, Credit and Banking 27, 625-638.
[54] Peek, J., Rosengren, E., 1997. The international transmission of financial shocks: The case of
Japan. American Economic Review 87, 495-505.
[55] Petersen, M., Rajan, R., 2002. Does distance still matter? The information revolution in small
business lending. Journal of Finance 57, 2533-2570.
[56] Puri, M., Rocholl, J., Steffen, S., 2011. Global retail lending in the aftermath of the US financial
crisis: Distinguishing between demand and supply effects. Journal of Financial Economics 100,
556-578.
[57] Rajan, R., Zingales, L., 1998. Financial dependence and growth. American Economic Review
88, 559-586.
[58] Santos, J., 2011. Bank corporate loan pricing following the sub-prime crisis. Review of Financial
Studies 24, 1916-1943.
36

[59] Schnabl, P., 2011. The international transmission of bank liquidity shocks: Evidence from an
emerging market. Journal of Finance, forthcoming.
[60] Stein, J.C., 1997. Internal capital markets and the competition for corporate resources. Journal
of Finance 52, 111-134.
[61] Stein, J.C., 2002. Information production and capital allocation: decentralized versus hierar-
chical firms. Journal of Finance 57, 1891-1921.
[62] Wagster, J. D., 1996. Impact of the 1988 Basle Accord on international banks. Journal of
Finance 51, 1321-1346.
[63] Woo, D. 2003. In search of capital crunch: Supply factors behind the credit slowdown in Japan.
Journal of Money, Credit and Banking 35, 1019-1038.
37

38
Figure 1. Home and host countries
The map shows the cross-border dimension of the underlying data. Countries in dark color (Austria, Belgium, Denmark, Finland, France, Germany, Greece, Ireland, Netherlands, and Sweden) are those in which the parents of the foreign-owned banks in the dataset are incorporated. Countries in light color (Albania, Bosnia and Herzegovina, Bulgaria, Croatia, Czech Republic, Estonia, Hungary, Latvia, Lithuania, Macedonia, Montenegro, Poland, Romania, Serbia, Slovakia, and Slovenia) are those where the firms in the dataset are incorporated.

39
Table 1. Summary statistics: Firm characteristics
Country # firms Small firm Big firm Public
company Private
company Sole
proprietorship Privatized Exporter Audited Subsidized Competition Albania 260 0.90 0.03 0.01 0.19 0.74 0.06 0.31 0.74 0.04 0.74 Bosnia and Herzegovina 607 0.78 0.03 0.14 0.54 0.40 0.22 0.35 0.53 0.10 0.79 Bulgaria 609 0.84 0.03 0.05 0.38 0.51 0.12 0.24 0.42 0.06 0.62 Croatia 372 0.79 0.05 0.06 0.41 0.44 0.23 0.36 0.47 0.18 0.79 Czech Republic 670 0.79 0.04 0.04 0.48 0.41 0.08 0.35 0.43 0.16 0.82 Estonia 557 0.79 0.03 0.13 0.55 0.27 0.11 0.34 0.80 0.14 0.77 Hungary 992 0.80 0.04 0.01 0.32 0.63 0.12 0.36 0.74 0.22 0.88 Latvia 529 0.73 0.04 0.01 0.56 0.36 0.13 0.31 0.68 0.12 0.79 Lithuania 544 0.77 0.02 0.02 0.68 0.24 0.16 0.37 0.40 0.15 0.78 Macedonia 611 0.81 0.03 0.05 0.48 0.32 0.16 0.39 0.54 0.04 0.84 Montenegro 151 0.86 0.01 0.04 0.25 0.71 0.12 0.15 0.48 0.04 0.69 Poland 1,592 0.83 0.02 0.05 0.12 0.78 0.09 0.26 0.37 0.13 0.84 Romania 1,247 0.73 0.04 0.04 0.73 0.17 0.13 0.20 0.37 0.09 0.71 Serbia 734 0.72 0.05 0.13 0.42 0.49 0.19 0.38 0.54 0.08 0.81 Slovakia 610 0.74 0.05 0.06 0.29 0.54 0.11 0.34 0.55 0.13 0.79 Slovenia 616 0.74 0.05 0.08 0.50 0.29 0.21 0.56 0.43 0.22 0.79 Total 10,701 0.79 0.03 0.05 0.42 0.46 0.12 0.32 0.51 0.13 0.79
Note: The table presents statistics on the number of firms and the share of firms by size, ownership, privatization history, access to foreign product markets, access to international auditing, subsidies from central and local governments, and degree of competition, by country. See Appendix 1 for exact definitions. Source: BEEPS (2008 and 2005).
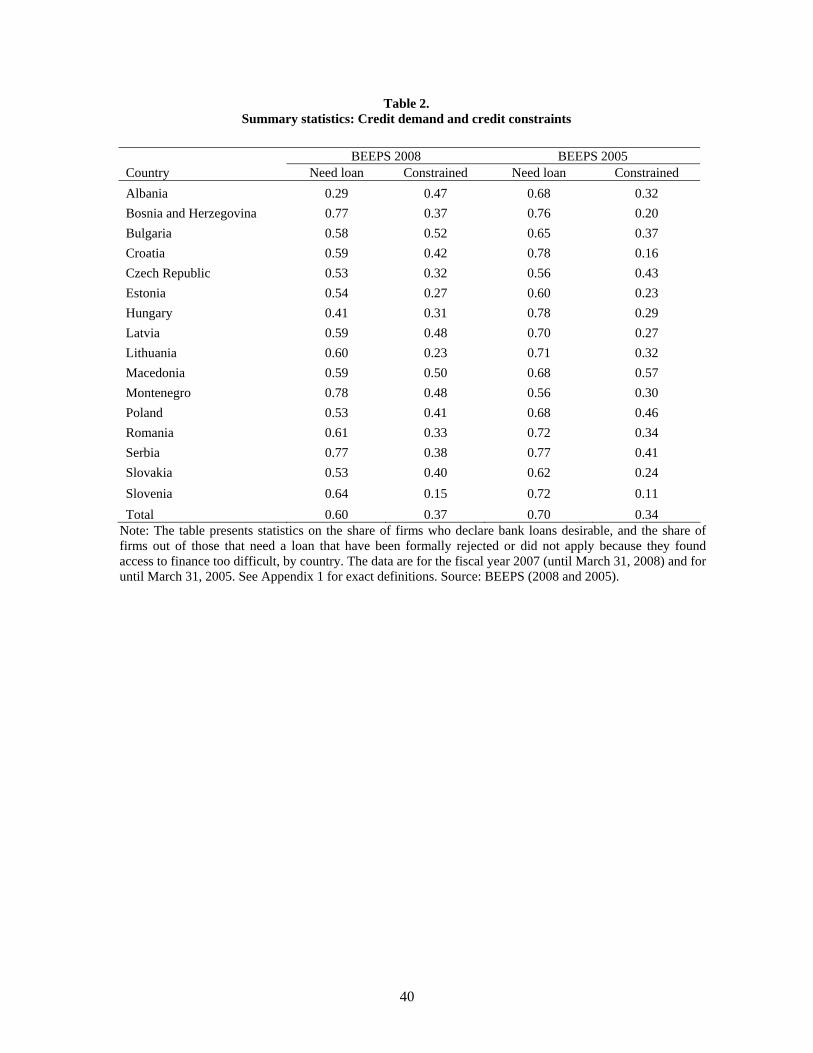
40
Table 2. Summary statistics: Credit demand and credit constraints
BEEPS 2008 BEEPS 2005 Country Need loan Constrained Need loan Constrained Albania 0.29 0.47 0.68 0.32 Bosnia and Herzegovina 0.77 0.37 0.76 0.20 Bulgaria 0.58 0.52 0.65 0.37 Croatia 0.59 0.42 0.78 0.16 Czech Republic 0.53 0.32 0.56 0.43 Estonia 0.54 0.27 0.60 0.23 Hungary 0.41 0.31 0.78 0.29 Latvia 0.59 0.48 0.70 0.27 Lithuania 0.60 0.23 0.71 0.32 Macedonia 0.59 0.50 0.68 0.57 Montenegro 0.78 0.48 0.56 0.30 Poland 0.53 0.41 0.68 0.46 Romania 0.61 0.33 0.72 0.34 Serbia 0.77 0.38 0.77 0.41 Slovakia 0.53 0.40 0.62 0.24 Slovenia 0.64 0.15 0.72 0.11 Total 0.60 0.37 0.70 0.34
Note: The table presents statistics on the share of firms who declare bank loans desirable, and the share of firms out of those that need a loan that have been formally rejected or did not apply because they found access to finance too difficult, by country. The data are for the fiscal year 2007 (until March 31, 2008) and for until March 31, 2005. See Appendix 1 for exact definitions. Source: BEEPS (2008 and 2005).

41
Table 3. Bank ownership and balance sheet data
2005 2008 2005 2008 2005 2008 2005 2008 Country % foreign owned bank assets Equity/assets Tier 1 capital ratio Gain on financial assets Albania 0.92 0.94 0.065 0.053 8.39 7.88 0.120 -0.333 Bosnia and Herzegovina 0.91 0.94 0.048 0.054 7.26 7.85 0.091 -0.370 Bulgaria 0.75 0.82 0.069 0.064 10.10 8.89 0.230 -0.200 Croatia 0.91 0.90 0.066 0.061 7.33 7.56 0.151 -0.126 Czech Republic 0.82 0.86 0.041 0.042 7.74 8.29 0.423 -0.401 Estonia 0.99 0.99 0.047 0.038 8.88 8.69 0.185 -0.095 Hungary 0.83 0.64 0.068 0.065 8.89 8.51 0.098 -0.306 Latvia 0.58 0.64 0.076 0.049 7.98 6.52 -0.048 -0.379 Lithuania 0.92 0.92 0.058 0.054 8.14 8.19 0.194 -0.158 Macedonia 0.51 0.86 0.076 0.071 10.37 8.60 0.319 -0.037 Montenegro 0.88 0.79 0.144 0.094 16.91 9.45 0.759 -0.127 Poland 0.74 0.76 0.082 0.081 10.32 9.39 0.076 -0.183 Romania 0.59 0.87 0.059 0.053 8.31 7.81 0.266 -0.217 Serbia 0.66 0.76 0.084 0.077 9.19 8.63 0.206 -0.173 Slovakia 0.97 0.99 0.058 0.055 7.93 8.21 0.079 -0.287 Slovenia 0.23 0.29 0.058 0.050 8.86 8.82 0.348 -0.509 Total 0.76 0.81 0.066 0.060 8.92 8.36 0.170 -0.241
Note: The table reports summary statistics on the share of the domestic banking system owned by branches and subsidiaries of foreign banks, of the average ratio of equity financing to total bank assets, of the average Tier 1 capital ratio, and of average gains on financial assets by the parent of the banks operating in each country, by country. The data are averaged for end-2005 and end-2008, respectively. ‘Equity/assets’ is a simple ratio, ‘Tier 1 capital ratio’ and ‘Gains on financial assets’ are ratios multiplied by 100. See Appendix 1 for exact definitions. Source: EBRD Transition Report (2008) and Bankscope (2005 and 2008).

42
Table 4. Credit demand
(1) (2) (3) (4) (5) (6) (7) (8) (9) Finance = Equity/assets Finance = Tier 1 capital ratio Finance = Gains on fin assets Equally-
weighted Branch-weighted
Asset- weighted
Equally- weighted
Branch-weighted
Asset- weighted
Equally- weighted
Branch-weighted
Asset- weighted
Finance -0.027 -0.031 -0.007 -0.039 -0.030 -0.021 -0.312 -0.151 -0.178 (0.018) (0.018)* (0.016) (0.020)* (0.021) (0.017) (0.100)*** (0.123) (0.112) Small firm -0.123 -0.123 -0.122 -0.126 -0.126 -0.130 -0.120 -0.120 -0.121 (0.043)*** (0.043)*** (0.044)*** (0.043)*** (0.043)*** (0.044)*** (0.044)*** (0.044)*** (0.044)*** Big firm 0.189 0.188 0.217 0.192 0.190 0.212 0.180 0.181 0.219 (0.091)** (0.091)** (0.092)** (0.091)** (0.091)** (0.092)** (0.091)** (0.091)** (0.092)** Public company 0.007 0.009 0.004 0.009 0.011 0.010 0.002 0.002 -0.002 (0.069) (0.069) (0.070) (0.070) (0.070) (0.070) (0.070) (0.070) (0.070) Sole proprietorship 0.148 0.151 0.130 0.150 0.153 0.133 0.144 0.143 0.127 (0.036)*** (0.036)*** (0.036)*** (0.036)*** (0.036)*** (0.036)*** (0.036)*** (0.036)*** (0.036)*** Privatized 0.055 0.056 0.041 0.059 0.057 0.045 0.062 0.061 0.042 (0.048) (0.048) (0.049) (0.048) (0.048) (0.049) (0.049) (0.049) (0.049) Exporter 0.181 0.181 0.190 0.181 0.180 0.188 0.177 0.178 0.189 (0.035)*** (0.035)*** (0.035)*** (0.035)*** (0.035)*** (0.035)*** (0.035)*** (0.035)*** (0.035)*** Audited 0.084 0.084 0.072 0.082 0.082 0.069 0.079 0.081 0.071 (0.033)*** (0.033)** (0.034)** (0.033)*** (0.033)** (0.034)** (0.033)** (0.033)** (0.034)** Competition 0.177 0.176 0.181 0.177 0.177 0.182 0.173 0.174 0.180 (0.036)*** (0.036)*** (0.037)*** (0.036)*** (0.036)*** (0.037)*** (0.037)*** (0.037)*** (0.037)*** Subsidized 0.331 0.333 0.330 0.332 0.333 0.334 0.332 0.333 0.327 (0.048)*** (0.048)*** (0.048)*** (0.048)*** (0.048)*** (0.048)*** (0.048)*** (0.048)*** (0.048)*** Fixed effects Country Industry Year Observations 8,097 8,097 7,941 8,095 8,095 7,895 8,035 8,035 7,941 Pseudo R-squared 0.05 0.05 0.05 0.05 0.05 0.05 0.05 0.05 0.05
Note: The dependent variable is a dummy variable equal to 1 if the firm desires bank credit. ‘Finance’ is one of the three balance sheet variables from Table 4. Each finance variable is locality-specific and is constructed by weighting equally (Columns labeled “Equally-weighted”), by number of branches (Columns labeled “Branch-weighted”), or by subsidiaries’ assets (Columns labeled “Asset-weighted”) the respective financial variable for each parent bank which has at least one branch or subsidiary in that locality. ‘Small firm’ is a dummy equal to 1 if the firm has fewer than 20 employees. ‘Big firm’
43
is a dummy equal to 1 if the firm has more than 100 employees. ‘Public company’ is a dummy equal to 1 if the firm is a shareholder company, or its shares traded in the stock market. ‘Sole proprietorship’ is a dummy equal to 1 if the firms is a sole proprietorship. ‘Privatized’ is a dummy equal to 1 if the firm is a former state-owned company. ‘Exporter’ is a dummy equal to 1 if the firm exports to non-local markets. ‘Audited’ is a dummy equal to 1 if the firm employs external auditing services. ‘Competition’ is a dummy equal to 1 if the firm faces fairly, very, or extremely strong competition. ‘Subsidized’ is a dummy equal to 1 if the firm has received in the last 3 years subsidies from central or local government. Omitted category in firm size is ‘Medium firm’. Omitted category in firm ownership is ‘Private company’. The analysis is performed on all firms present either in the 2005 or in the 2008 survey. All regressions include country, industry, and year fixed effects. White (1980) robust standard errors are reported in parentheses, where *** indicates significance at the 1% level, ** at the 5% level, and * at the 10% level. See Appendix 1 for exact definitions. Source: BEEPS (2005 and 2008) and Bankscope (2005 and 2008).

44
Table 5.
Affected vs. non-affected banks: Rejection rates pre- vs. post-
2005 2008 Difference Affected localities 0.342 0.402 -0.060*** Non-affected localities 0.329 0.343 -0.014 Difference 0.013 0.059** -0.046***
Note: The table reports a difference-in-differences estimate from a Mann-Whitney two-sided test. ‘Affected’ are localities where the average Tier 1 capital ratio of the parents of all banks present decreased by at least 1 standard deviation between fiscal year 2004 and fiscal year 2007. The statistical significance of the difference-in-differences estimate can be found next to the difference, where *** indicates significance at the 1% level. Source: BEEPS (2005 and 2008) and Bankscope (2005 and 2008).

45
Table 6.
Transmission of bank balance sheet conditions (2008 sample)
Panel A. Equally-weighted bank data for each locality (1) (2) (3) (4) (5) (6)
Finance = Equity/assets Finance =
Tier 1 capital Finance =
Gains on fin assets Finance 0.043 0.035 -0.058 -0.068 0.395 0.365 (0.031) (0.031) (0.054) (0.055) (0.270) (0.376) Small firm 0.364 0.399 0.362 0.391 0.361 0.388 (0.072)*** (0.078)*** (0.072)*** (0.078)*** (0.072)*** (0.078)*** Big firm 0.044 0.003 0.051 0.020 0.028 -0.001 (0.162) (0.162) (0.162) (0.161) (0.164) (0.163) Public company 0.418 0.437 0.419 0.432 0.414 0.428 (0.105)*** (0.108)*** (0.105)*** (0.108)*** (0.105)*** (0.108)*** Sole proprietorship 0.155 0.141 0.155 0.143 0.151 0.140 (0.069)** (0.070)** (0.069)** (0.070)** (0.069)** (0.071)** Privatized 0.026 0.015 0.020 0.013 0.028 0.019 (0.081) (0.082) (0.081) (0.083) (0.082) (0.083) Exporter -0.214 -0.239 -0.211 -0.230 -0.208 -0.226 (0.063)*** (0.067)*** (0.063)*** (0.067)*** (0.063)*** (0.067)** Audited -0.232 -0.235 -0.229 -0.227 -0.234 -0.233 (0.060)*** (0.062)*** (0.060)*** (0.062)*** (0.061)*** (0.063)*** Inverse Mills' ratio 0.093 0.071 0.070 (0.080) (0.079) (0.079) Fixed effects Country Industry Observations 2,502 2,470 2,501 2,469 2,471 2,439 Pseudo R-squared 0.07 0.07 0.07 0.07 0.07 0.07

46
Table 6.
Transmission of bank balance sheet conditions (2008 sample)
Panel B. Branch-weighted bank data for each locality (1) (2) (3) (4) (5) (6)
Finance = Equity/assets Finance =
Tier 1 capital Finance =
Gains on fin assets Finance -0.021 -0.026 -0.162 -0.167 0.431 0.392 (0.031) (0.032) (0.057)*** (0.057)*** (0.257)* (0.258) Small firm 0.361 0.396 0.361 0.394 0.361 0.390 (0.072)*** (0.078)*** (0.072)*** (0.078)*** (0.072)*** (0.078)*** Big firm 0.043 0.002 0.057 0.018 0.028 -0.006 (0.162) (0.162) (0.161) (0.161) (0.164) (0.164) Public company 0.420 0.437 0.418 0.435 0.416 0.429 (0.105)*** (0.108)*** (0.105)*** (0.108)*** (0.105)*** (0.108)*** Sole proprietorship 0.158 0.144 0.159 0.145 0.153 0.141 (0.069)** (0.070)** (0.069)** (0.071)** (0.069)** (0.071)** Privatized 0.022 0.013 0.023 0.014 0.029 0.021 (0.081) (0.082) (0.081) (0.083) (0.082) (0.083) Exporter -0.214 -0.238 -0.208 -0.231 -0.208 -0.228 (0.063)*** (0.067)*** (0.063)*** (0.067)*** (0.063)*** (0.067)*** Audited -0.232 -0.234 -0.227 -0.229 -0.234 -0.233 (0.060)*** (0.062)*** (0.060)*** (0.062)*** (0.061)*** (0.063)*** Inverse Mills' ratio 0.091 0.089 0.073 (0.080) (0.080) (0.081) Fixed effects Country Industry Observations 2,502 2,470 2,501 2,469 2,471 2,439 Pseudo R-squared 0.07 0.07 0.07 0.07 0.07 0.07

47
Table 6. Transmission of bank balance sheet conditions (2008 sample)
Panel C. Asset-weighted bank data for each locality
(1) (2) (3) (4) (5) (6)
Finance = Equity/assets Finance =
Tier 1 capital Finance =
Gains on fin assets Finance 0.048 0.041 -0.094 -0.084 0.599 0.589 (0.027)* (0.027) (0.045)** (0.045)* (0.274)** (0.274)** Small firm 0.367 0.400 0.361 0.402 0.368 0.413 (0.071)*** (0.078)*** (0.072)*** (0.079)*** (0.071)*** (0.078)*** Big firm 0.054 0.012 0.057 0.011 0.049 -0.001 (0.162) (0.162) (0.161) (0.161) (0.162) (0.163) Public company 0.412 0.431 0.415 0.436 0.414 0.438 (0.104)*** (0.107)*** (0.105)*** (0.107)*** (0.104)*** (0.107)*** Sole proprietorship 0.130 0.117 0.140 0.124 0.134 0.118 (0.069)* (0.071)* (0.070)** (0.071)* (0.069)* (0.071)* Privatized 0.019 0.010 0.020 0.010 0.022 0.017 (0.081) (0.082) (0.081) (0.083) (0.081) (0.083) Exporter -0.209 -0.236 -0.212 -0.242 -0.212 -0.245 (0.063)*** (0.067)*** (0.063)*** (0.067)*** (0.063)*** (0.067)*** Audited -0.237 -0.238 -0.232 -0.234 -0.237 -0.239 (0.060)*** (0.062)*** (0.061)*** (0.062)*** (0.060)*** (0.062)*** Inverse Mills' ratio 0.091 0.103 0.109 (0.081) (0.079) (0.079) Fixed effects Country Industry Observations 2,495 2,463 2,473 2,441 2,495 2,441 Pseudo R-squared 0.07 0.07 0.07 0.07 0.07 0.07
Note: The dependent variable is a dummy variable equal to 1 if the firm is credit constrained. ‘Finance’ is one of the three balance sheet variables from Table 4. Each finance variable is locality-specific and is constructed by weighting equally (Panel A), by number of branches (Panel B), or by subsidiaries assets (Panel C) the respective financial variable for each parent bank which has at least one branch or subsidiary in that locality. ‘Small firm’ is a dummy equal to 1 if the firm has fewer than 20 employees. ‘Big firm’ is a dummy equal to 1 if the firm has more than 100 employees. ‘Public company’ is a dummy equal to 1 if the firm is a shareholder company, or its shares traded in the stock market. ‘Sole proprietorship’ is a dummy equal to 1 if the firms is a sole proprietorship. ‘Privatized’ is a dummy equal to 1 if the firm is a former state-owned company. ‘Exporter’ is a dummy equal to 1 if the firm exports to non-local markets. ‘Audited’ is a dummy equal to 1 if the firm employs external auditing services. ‘Inverse Mills' ratio’ is the inverse of Mills' ratio from the probit model in Table 4 for each respective financial variable. Omitted category in firm size is ‘Medium firm’. Omitted category in firm ownership is ‘Private company’. Omitted variables from the probit equation in Table 4 are ‘Competition’ and ‘Subsidized’. The analysis is performed on all firms present in the 2008 survey. All regressions include country and industry fixed effects. White (1980) robust standard errors are reported in parentheses, where *** indicates significance at the 1% level, ** at the 5% level, and * at the 10% level. See Appendix 1 for exact definitions. Source: BEEPS (2008) and Bankscope (2008).

48
Table 7. Transmission of bank balance sheet conditions: 2005 and 2008 samples
(1) (2) (3) (4) (5) (6) (7) (8) (9)
Panel A. Difference-in-differences 1 Finance = Equity/assets Finance = Tier 1 capital ratio Finance = Gains on fin assets Equally-
weighted Branch-weighted
Asset- weighted
Equally- weighted
Branch-weighted
Asset- weighted
Equally- weighted
Branch-weighted
Asset- weighted
PostFinance 0.075 -0.042 0.011 -0.088 -0.203 -0.070 -0.301 -0.514 -0.562 (0.033)** (0.027)* (0.022) (0.051)* (0.043)*** (0.032)** (0.342) (0.322)* (0.354)* Finance -0.073 -0.013 -0.033 -0.005 0.044 -0.039 0.316 0.495 0.782 (0.030)** (0.028) (0.026) (0.028) (0.028) (0.024)* (0.281) (0.263)* (0.316)** Post -0.354 0.374 0.063 0.864 1.857 0.726 0.180 0.205 0.296 (0.216) (0.181)** (0.144) (0.444)** (0.371)*** (0.257)*** (0.102) (0.095)** (0.089)*** Inverse Mills' ratio -0.143 -0.151 -0.151 -0.138 -0.137 -0.133 -0.160 -0.163 -0.150 (0.056)*** (0.056)*** (0.056)*** (0.055)*** (0.055)*** (0.055)*** (0.058)*** (0.057)*** (0.060)** Fixed effects Country Industry Observations 5,182 5,182 5,089 5,181 5,181 5,060 5,149 5,149 5,089 Pseudo R-squared 0.08 0.08 0.08 0.08 0.09 0.09 0.08 0.08 0.09

49
Panel B. Difference-in-differences 2 Finance = Equity/assets Finance = Tier 1 capital ratio Finance = Gains on fin assets Equally-
weighted Branch-weighted
Asset- weighted
Equally- weighted
Branch-weighted
Asset- weighted
Equally- weighted
Branch-weighted
Asset- weighted
PostNon-Affected 0.049 -0.024 -0.431 -0.053 -0.122 -0.297 0.244 0.155 -0.036 (0.091) (0.092) (0.110)*** (0.090) (0.096) (0.118)** (0.273) (0.316) (0.114) Non-Affected -0.055 0.048 0.068 0.162 0.044 -0.276 -0.472 -0.744 -0.038 (0.114) (0.072) (0.089) (0.092)* (0.087) (0.163)* (0.156)*** (0.190)*** (0.100) Post 0.104 0.143 0.479 0.161 0.209 0.381 0.116 0.121 0.154 (0.074) (0.079) (0.104)*** (0.072)** (0.081)*** (0.110)*** (0.061)* (0.060)** (0.063)** Inverse Mills’ ratio -0.203 -0.203 -0.188 -0.188 -0.197 -0.187 -0.204 -0.204 -0.187 (0.057)*** (0.060)*** (0.057)*** (0.058)*** (0.057)*** (0.058)*** (0.059)*** (0.059)*** (0.056)*** Fixed effects Country Industry Observations 4,289 4,289 4,189 4,288 4,288 4,179 4,273 4,273 4,189 Pseudo R-squared 0.09 0.09 0.09 0.09 0.09 0.09 0.09 0.09 0.09
Note: The dependent variable is a dummy variable equal to 1 if the firm is credit constrained. ‘Finance’ is one of the three balance sheet variables from Table 4. Each finance variable is locality-specific and is constructed by weighting equally (Columns labeled “Equally-weighted”), by number of branches (Columns labeled “Branch-weighted”), or by subsidiaries’ assets (Columns labeled “Asset-weighted”) the respective financial variable for each parent bank which has at least one branch or subsidiary in that locality. ‘Post’ is a dummy variable equal to 1 if the observation is in 2008, and to 0 if it is in 2005. ‘Non-Affected’ is a dummy variable equal to 1 if the respective finance variable declined by less than 1 standard deviation between 2005 and 2008. ‘Inverse Mills' ratio’ is the inverse of Mills' ratio from the probit model in Table 5 for each respective financial variable. The regressions also include the rest of the independent variables from Table 6 (unreported for brevity). Omitted variables from the probit equation in Table 4 are ‘Competition’ and ‘Subsidized’. The analysis is performed on all firms present either in the 2005 or in the 2008 survey (Panel A), and on all firms present in localities which appeared both in the 2005 and the 2008 survey (Panel B). All regressions include country and industry fixed effects. White (1980) robust standard errors are reported in parentheses, where *** indicates significance at the 1% level, ** at the 5% level, and * at the 10% level. See Appendix 1 for exact definitions. Source: BEEPS (2005 and 2008) and Bankscope (2005 and 2008).

50
Table 8.
Transmission of bank balance sheet conditions: Foreign-owned vs. domestic banks (1) (2) (3) (4) (5) (6) (7) (8) (9)
Panel A. 2008 sample Finance = Equity/assets Finance = Tier 1 capital ratio Finance = Gains on fin assets Equally-
weighted Branch-weighted
Asset- weighted
Equally- weighted
Branch-weighted
Asset- weighted
Equally- weighted
Branch-weighted
Asset- weighted
Finance foreign -0.042 0.052 0.055 -0.040 -0.051 0.019 0.976 0.485 0.588 (0.025)* (0.054) (0.052) (0.016)** (0.059) (0.050) (0.397)** (0.378) (0.421) Finance domestic -0.006 -0.025 0.075 -0.002 -0.081 0.056 -0.177 0.569 -0.234 (0.013) (0.027) (0.042)* (0.014) (0.034)** (0.058) (1.405) (1.286) (0.955) Observations 1,898 1,898 1,898 1,898 1,898 1,898 1,898 1,898 1,898 Pseudo R-squared 0.07 0.07 0.07 0.07 0.07 0.07 0.07 0.07 0.07
Panel B. 2005 and 2008 samples, difference-in-differences Finance = Equity/assets Finance = Tier 1 capital ratio Finance = Gains on fin assets Equally-
weighted Branch-weighted
Asset- weighted
Equally- weighted
Branch-weighted
Asset- weighted
Equally- weighted
Branch-weighted
Asset- weighted
PostFinance foreign -0.003 -0.026 0.188 -0.023 -0.148 0.032 -0.167 -0.738 -1.231 (0.034) (0.048) (0.060)*** (0.021) (0.047)*** (0.046) (0.657) (0.413)* (0.365)*** PostFinance domestic 0.026 0.004 -0.115 0.030 -0.001 -0.002 3.312 2.756 1.963 (0.018) (0.017) (0.031)*** (0.015)** (0.013) (0.018) (1.399)** (0.917)*** (0.662)*** Finance foreign -0.038 0.122 -0.122 -0.019 0.120 0.037 0.620 0.850 1.319 (0.026) (0.038)*** (0.052)** (0.016) (0.026)*** (0.030) (0.554) (0.336)** (0.345)*** Finance domestic -0.026 -0.031 0.059 -0.027 -0.003 -0.020 -0.598 0.617 0.195 (0.014) (0.019)* (0.030)* (0.012)** (0.014) (0.015) (0.515) (0.284)*** (0.297) Post 0.146 0.324 0.381 0.206 1.332 -0.091 0.250 0.497 0.505 (0.065)** (0.263) (0.408) (0.066)*** (0.396)*** (0.404) (0.058)*** (0.100)*** (0.098)*** Observations 4,294 4,294 3,886 4,294 4,294 3,886 4,294 4,294 3,886 Pseudo R-squared 0.09 0.09 0.09 0.09 0.09 0.09 0.09 0.09 0.09
Note: The dependent variable is a dummy variable equal to 1 if the firm is credit constrained. ‘Finance foreign (domestic)’ is one of the three balance sheet variables from Table 4, calculated for the foreign-owned (domestic-owned) banks in each locality. Each finance variable is locality-specific and is constructed by weighting equally (Columns labeled “Equally-weighted”), by number of branches (Columns labeled “Branch-weighted”), or by subsidiaries’ assets (Columns labeled “Asset-weighted”) the respective financial variable for each parent bank which has at least one branch or subsidiary in that locality.

51
‘Post’ is a dummy variable equal to 1 if the observation is in 2008, and to 0 if it is in 2005. The regressions also include the rest of the independent variables from Table 6, including the inverse of Mills' ratio, as well as all double interaction terms between Post, Non-Affected, and Foreign (unreported for brevity). Omitted cvariables from the probit equation in Table 4 are ‘Competition’ and ‘Subsidized’. The analysis is performed on all firms present in the 2008 survey (Panel A) and on all firms present either in the 2005 or the 2008 survey (Panel B). All regressions include country and industry fixed effects. White (1980) robust standard errors are reported in parentheses, where *** indicates significance at the 1% level, ** at the 5% level, and * at the 10% level. See Appendix 1 for exact definitions. Source: BEEPS (2005 and 2008) and Bankscope (2005 and 2008).

52
Table 9. Transmission of bank balance sheet conditions: Differential effects
(1) (2) (3) (4) (5) (6)
Equally- weighted
Branch-weighted
Asset- weighted
Equally- weighted
Branch-weighted
Asset- weighted
Tier 1 capitalR&D intensity -0.104 -0.122 -0.087 (0.055)** (0.040)*** (0.023)*** Tier 1 capitalCapital intensity 0.013 0.013 0.009 (0.005)** (0.004)*** (0.002)*** Fixed effects Locality Industry Observations 1,683 1,683 1,669 1,683 1,683 1,669 Pseudo R-squared 0.13 0.13 0.13 0.13 0.13 0.13
Note: The dependent variable is a dummy variable equal to 1 if the firm is credit constrained. ‘Tier 1 capital’ is the ratio of Tier 1 capital to total assets. It is locality-specific and is constructed by weighting equally (Columns labeled “Equally-weighted”), by number of branches (Columns labeled “Branch-weighted”), or by subsidiaries’ assets (Columns labeled “Asset-weighted”) the Tier 1 capital ratio for each parent bank which has at least one branch or subsidiary in that locality. ‘R&D intensity’ is the industry median ratio of research and development expenses to sales for mature Compustat firms over the period 1990-2000. ‘Capital intensity’ is the industry median capital usage per worker for mature Compustat firms over the period 1990-2000. The regressions also include the rest of the independent variables from Table 6, including the inverse of Mills' ratio (unreported for brevity). Omitted categories from the probit equation in Table 4 are ‘Competition’ and ‘Subsidized’. The analysis is performed on all firms present in the 2008 survey. All regressions include locality and industry fixed effects. White (1980) robust standard errors are reported in parentheses, where *** indicates significance at the 1% level, ** at the 5% level, and * at the 10% level. See Appendix 1 for exact definitions. Source: BEEPS (2008) and Bankscope (2008).

53
Table 10. Transmission of bank balance sheet conditions: Endogeneity and robustness
(1) (2) (3) (4) (5) (6) (7)
2SLS 2007 financial
data Subsidiaries’
health
CDS spreads Small firms only <3 banks and
small firms only Non-exporting
firms only
Tier 1 capital -0.695 -0.028 -0.119 -0.083 -0.938 -0.095 (0.040)*** (0.016)* (0.056)** (0.049)* (0.404)** (0.056)* Tier 1 capital 0.037 (subsidiaries) (0.052) CDS spreads 0.022 (0.011)** Fixed effects Country Industry Observations 2,473 2,145 2,385 2,057 1,739 45 1,298 Pseudo R-squared 0.06 0.06 0.07 0.07 0.05 0.27 0.07
Note: The dependent variable is a dummy variable equal to 1 if the firm is credit constrained. ‘Tier 1 capital’ is the ratio of Tier 1 capital to total assets. It is locality-specific and is constructed by weighting by subsidiaries’ assets the Tier 1 capital ratio for each parent bank which has at least one branch or subsidiary in that locality. ‘Tier 1 capital (subsidiaries)’ is locality-specific and is constructed by weighting by subsidiaries’ assets the Tier 1 capital ratio for each bank present in that locality. In column (1), bank distress is instrumented using average distance to bank headquarters, an index of host-country creditor protection, a dummy equal to 1 if the country is in the EU, and a dummy equal to 1 if the country is in the euro zone. In column (2), the bank financial condition is constructed using data for 2007. In column (4), the bank financial condition is constructed by weighting by subsidiaries’ branches the average CDS spread for 2008:Q1 for each parent bank which has at least one branch or subsidiary in that locality. In column (5), the sample is restricted to small firms younger than 12 years. In column (6), the sample is restricted to small firms younger than 12 years in localities with a maximum of 2 banks present. In column (7), the sample is restricted to firms in non-exporting industries only. The regressions also include the rest of the independent variables from Table 7, including the inverse of Mills' ratio (unreported for brevity). The analysis is performed on firms present in the 2008 survey. All regressions include country and industry fixed effects. White (1980) robust standard errors are reported in parentheses, where *** indicates significance at the 1% level, ** at the 5% level, and * at the 10% level. See Appendix 1 for exact definitions. Source: BEEPS (2008), Bankscope (2008), and Thomson Financial.

54
Appendix 1. Variables – definitions and sources
Variable Name Definition Source
Firm characteristics Small firm Dummy=1 if firm has fewer than 20 employees BEEPS 2005 & 2008
Medium firm Dummy=1 if the firm has between 20 and 100 employees BEEPS 2005 & 2008
Big firm Dummy=1 if firm has more than 100 employees BEEPS 2005 & 2008
Public company Dummy=1 if firm is a shareholder company / shares traded in the stock market BEEPS 2005 & 2008
Private company Dummy=1 if firm is a shareholder company / shares traded privately if at all BEEPS 2005 & 2008
Sole proprietorship Dummy=1 if firm is a sole proprietorship BEEPS 2005 & 2008
Privatized Dummy=1 if the firm went from state to private ownership in the past BEEPS 2005 & 2008
Subsidized Dummy=1 if the firm has received state subsidized in the past year BEEPS 2005 & 2008
Exporter Dummy=1 if firm’s production is at least partially exported BEEPS 2005 & 2008
Competition Dummy=1 if pressure from competitors is “fairly” or “very” severe BEEPS 2005 & 2008
Audited Dummy=1 if the firm has its financial accounts externally audited BEEPS 2005 & 2008
Credit demand and credit access Need loan Dummy=1 if the firm doesn’t need a loan because it has sufficient capital BEEPS 2005 & 2008
Constrained Dummy=1 if the firm was refused a loan or didn’t apply for one because of adverse loan conditions
BEEPS 2005 & 2008
Industry benchmarks R&D intensity Median proportion of the ratio of research and development expenses to sales for mature
Compustat firms over the period 1990-2000 Compustat
Capital intensity Median proportion of capital usage per worker for mature Compustat firms over the period 1990-2000
Compustat
Bank-level variables

55
% foreign owned bank assets
Share of banking sector assets owned by branches or subsidiaries of foreign banks EBRD Transition report 2008
Equity/assets Ratio of total equity to total assets Bankscope 2005 & 2008
Tier 1 capital Ratio of Tier 1 capital to total risk-weighted assets Bankscope 2005 & 2008
Gain on financial assets Gain on financial assets held by the bank Bankscope 2005 & 2008
CDS spreads Spreads on credit default swap for parent bank in 2008:Q1 Thomson Financial
Distance to headquarters Geographical distance to parent bank’s headquarters
Country variables
Creditor protection An index of host-country protection of creditors’ rights WB Doing Business Database
EU Dummy=1 if the country is a member of the EU
Euro Dummy=1 if the country is a member of the euro area

56
Appendix 2. Domestic and parent banks in the sample Country Bank Parent bank and country of incorporation Albania Alpha Bank Alpha Bank – Greece Raiffeisen Raiffeisen – Austira Banka Kombetare Trektare domestic Tirana Bank Pireus Bank – Greece Intessa San Paolo Bank Albania Intesa Sanpaolo – Italy National Bank of Greece National Bank of Greece - Greece Emporiki Emporiki Bank – Greece Banka Credins domestic Bulgaria Alpha Bank Alpha Bank – Greece Unicredit Bulbank UniCredit Group – Italy DSK OTP – Hungary First Investment Bank domestic PostBank EFG Eurobank – Greece Expressbank Societe Generale – France United Bulgarian Bank National Bank of Greece - Greece Reiffeisen Raiffeisen – Austira Piraeus Piraeus Bank – Greece Bosnia and Raiffeisen Bank Bosna i Hercegovina Raiffeisen – Austira Herzegovina UniCredit Bank UniCredit Group – Italy Hypo Alpe-Adria-Bank Mostar Hypo Group - Austria Intesa Sanpaolo Banka Bosna i Hercegovina Intesa Sanpaolo – Italy NLB Tuzlanska Banka KBC - Belgium Volksbank Sarajevo Volksbank - Austria Croatia Zagrebaska Bank UniCredit Group - Italy Privredna Bank Zagreb Intesa Sanpaolo - Italy Erste & Steiermarkische Bank Erste Group - Austria Raiffeisen Bank Raiffeisen - Austria Societe Generale - Splitska Banka Societe Generale - France Hypo Alde Adria Bank Hypo Group - Austria OTP Banka Hrvatska OTP - Hungary Slavonska Banka domestic Hrvatska Postanska Banka domestic Czech Republic Ceska Sporitelna Erste Group - Austria CSOB KBC - Belgium Komercni Banka Societe Generale - France UniCredit Bank CR UniCredit Group - Italy Citibank Citibank - US Ceskomoravska zarucni a rozvojova banka domestic GE Money Bank GE Money - US Hypotecni Banka KBC - Belgium Raiffeisenbank Raiffeisen - Austira Estonia Swedbank Estonia Swedbank - Sweden SEB Skandinavska Enskilda Banken - Sweden Sampo Bank Danske Bank - Denmark Nordea Nordea Bank - Finland Hungary OTP Bank domestic K&H Commercial and Credit Bank KBC - Belgium

57
MKB Bank Bayerische Landesbank - Germany CIB Bank Intesa Sanpaolo – Italy Raiffeisen Bank Raiffeisen - Austira Erste Bank Hungary Erste Group - Austria KDB Bank KDB Seoul - Korea UniCredit Bank Hungary UniCredit Group - Italy Latvia Parex domestic Hansabank Swedbank - Sweden Latvijas Krajbanka Snoras Bank - Lithuania SMP Bank domestic Rietumu Banka domestic Trasta Komercbanka domestic Lithuania SEB Skandinavska Enskilda Banken - Sweden Sampo Bank Danske Bank - Denmark Nordea Nordea Bank - Finland Snoras Bank domestic Ukio Bankas domestic Hansabankas Swedbank - Sweden Parex Bankas Parex Group - Latvia Macedonia Alpha Bank Alpha Bank - Greece Stopanska Banka National Bank of Greece - Greece Komercijalna Banka domestic NLB Tutunska Banka NLB - Slovenia Ohridska Banka Societe Generale - France Pro Credit Bank Pro Credit Group Montenegro AtlasMont Bank domestic Crnogorska Komercijalna Banka OTP - Hungary Hypo-Alpe-Adria Bank Hypo Group - Austria Komercijalna Banka ad Budva domestic NLB Montenegro Banka KBC - Belgium Prva Banka Crne Gore domestic Invest Banka Montenegro domestic Podgoricka Banka SG Societe Generale - France Opportunity Bank domestic Poland PKO Bank domestic Bank Pekao UniCredit Group - Italy Bank BPH UniCredit Group - Italy Bank Zachodni WBK AIB - Ireland ING Bank Slaski ING Bank - Netherlands Bank Pocztowy domestic Kredyt Bank KBC - Belgium mBank Commerzbank - Germany Getin Bank domestic Romania BCR Erste Group - Austria BRD Group Societe General Societe Generale - France Volksbank Romania Volksbank - Austria Raiffeisen Bank Raiffeisen - Austira Alpha Bank Romania Alpha Bank - Greece UniCredit Tiriac Bank UniCredit Group - Italy Banca Transilvania domestic Bancpost EFG Eurobank - Greece

58
CEC Bank domestic Serbia Banca Intesa Intesa Sanpaolo - Italy Komercijalna Banka domestic Raiffeisen Banka Raiffeisen - Austria Eurobank RFG EFG Eurobank - Greece Hypo Alde-Adria-Bank Hypo Group - Austria UniCredit Bank UniCredit Group - Italy Vojvodanska Banka National Bank of Greece - Greece Aik Banka Nis domestic Societe Generale Banka Societe Generale - France Slovakia Vseobecna Uverova banka Intesa Sanpaolo – Italy Slovenska Sporitelna Erste Group - Austria Tatra Banka Raiffeisen - Austira OTP Banka Slovensko OTP - Hungary Dexia Banka Slovensko Dexia - Belgium UniCredit Bank Slovakia UniCredit Group - Italy Volksbank Slovensko Volksbank - Austria CSOB Slovakia KBC - Belgium Slovenia Nova Ljubljanska Banka KBC - Belgium Nova Kreditna Banka Maribor domestic Abanka domestic SKB Societe Generale - France UniCredit UniCredit Group - Italy Banka Koper Intesa Sanpaolo – Italy Banka Celje domestic Reiffeisen Krekova banka Raiffeisen - Austira

59
Appendix 3. Bank data coverage
Country Ratio assets of the banks in the data set to total assets of the country’s banking sector
Albania 0.982 Bosnia 0.842 Bulgaria 0.857 Croatia 0.887 Czech Republic 0.913 Estonia 0.956 Hungary 0.948 Latvia 0.851 Lithuania 0.896 Macedonia 0.877 Montenegro 0.862 Poland 0.859 Romania 0.904 Serbia 0.782 Slovakia 0.925 Slovenia 0.862
Source: Bankscope (2008).