Embed Size (px)
Citation preview

Critical Heat Flux Phenomena at High Pressure & Low Mass Fluxes:
NEUP Final Report Part I: Experiments
Reactor Concepts Dr. Michael Corradini
University of Wisconsin-‐Madison
In collabora2on with: Oregon State University
Timothy Beville, Federal POC Brian Robinson, Technical POC
Project No. 11-3080
i
NEUP 11-3080
Critical Heat Flux Phenomena at High Pressure & Low Mass Fluxes:
NEUP Final Report Part I: Experiments
PART I: Experiments
Michael Corradini (UW PI) and M.Scott Greenwood
Department of Engineering Physics, UW-Madison
PART II: Modeling
Qiao Wu (OSU Co-PI) and Jeff Luitjens
Department of Nuclear Engineering, Oregon State University
October 15, 2014
ii
Abstract
This report is a preliminary document presenting an overview of the Critical Heat Flux (CHF)
phenomenon, the High Pressure Critical Heat Flux facility (HPCHF), preliminary CHF data acquired, and
the future direction of the research. The HPCHF facility has been designed and built to study CHF at high
pressure and low mass flux ranges in a rod bundle prototypical of conceptual Small Modular Reactor
(SMR) designs. The rod bundle is comprised of four electrically heated rods in a 2x2 square rod bundle
with a prototypic chopped-cosine axial power profile and equipped with thermocouples at various axial
and circumferential positions embedded in each rod for CHF detection. Experimental test parameters for
CHF detection range from pressures of ~80 – 160 bar, mass fluxes of ~400 – 1500 kg/m2s, and inlet water
subcooling from ~30 – 70°C. The preliminary data base established will be further extended in the future
along with comparisons to existing CHF correlations, models, etc. whose application ranges may be
applicable to the conditions of SMRs.
iii
Table of Contents
Abstract i!
Acknowledgments Error! Bookmark not defined.!
Table of Contents iii!
List of Figures v!
List of Tables viii!
Nomenclature ix!
I.! Introduction 1!
I.A.! The Critical Heat Flux Phenomenon ..............................................................................................3!
I.A.1.! Nomenclature .........................................................................................................................4!
I.B.! The Small Modular Reactor ...........................................................................................................7!
I.C.! Concept Design ..............................................................................................................................9!
I.D.! Research Goals .............................................................................................................................10!
II.! Literature Review 11!
II.A.! Existing Rod Bundle CHF Data ...................................................................................................12!
II.B.! Parametric Trends ........................................................................................................................13!
II.B.1.! Inlet Subcooling ...................................................................................................................14!
II.B.2.! Influence of Pressure ............................................................................................................15!
II.B.3.! Mass Flux .............................................................................................................................17!
II.B.4.! Non-Uniform Axial Heat Flux .............................................................................................18!
II.B.5.! Grid Spacer Effects ..............................................................................................................18!
II.C.! CHF Prediction Methods .............................................................................................................20!
II.C.1.! Experimental Correlations & Look-Up Tables ....................................................................21!
II.C.2.! Departure from Nuclear Boiling Mechanistic Models .........................................................23!
II.C.3.! Computational Techniques: Subchannel Analysis and CMFD ............................................25!
III.! Experimental Facility 27!
III.A.! Facility Overview .....................................................................................................................28!
III.B.! Design Guidelines and Goals ...................................................................................................29!
III.C.! Primary System Details ............................................................................................................29!
III.C.1.! Main Loop Details ...............................................................................................................30!
III.C.2.! Test Section ..........................................................................................................................31!
iv
III.C.3.! High Pressure Heat Exchanger ............................................................................................50!
III.C.4.! High Pressure Pump .............................................................................................................51!
III.C.5.! Test Bypass Section .............................................................................................................52!
III.C.6.! Pressurization System ..........................................................................................................53!
III.C.7.! Emergency Pressure Relief System .....................................................................................57!
III.D.! Secondary Systems Details ......................................................................................................57!
III.D.1.! Main Supporting Structure ...................................................................................................57!
III.D.2.! Weight Bearing Spring Supports .........................................................................................58!
III.D.3.! Secondary Cooling and Pressure Systems ...........................................................................60!
III.D.4.! Data Acquisition System ......................................................................................................64!
III.E.! Pressure & Temperature Rating ...............................................................................................65!
IV.! Facility Performance 66!
IV.A.! Safety Considerations ..............................................................................................................66!
IV.B.! Start-Up ....................................................................................................................................67!
IV.C.! Steady State ..............................................................................................................................68!
IV.D.! Experimental Run ....................................................................................................................68!
IV.E.! Shutdown .................................................................................................................................70!
IV.F.! Error Analysis ..........................................................................................................................70!
V.! Preliminary Critical Heat Flux Data 72!
V.A.! Inlet Subcooling ...........................................................................................................................72!
V.B.! Inlet Pressure ................................................................................................................................73!
V.C.! Mass Flux .....................................................................................................................................74!
V.D.! Thermodynamic Quality ..............................................................................................................74!
V.E.! CHF Location ...............................................................................................................................75!
V.F.! Repeatability ................................................................................................................................76!
VI.! Summary & Future Work 78!
Bibliography 79!
Appendix A! Official Documents 84!
Appendix B! Facility Operation Procedures 88!

v
List of Figures
Fig. 1 – The first published ‘boiling curve’ by Nukiyama in 1934 2 ............................................................ 2!Fig. 2 – Representative boiling curve indicating various regions of boiling 11 ............................................ 4!Fig. 3 – Linear effect of inlet subcooling on the critical heat flux for fixed inlet condition 32 ................... 15!Fig. 4 – Influence of pressure on the critical heat flux for a fixed inlet condition 5 . .................................. 16!Fig. 5 – Illustration of the abrupt drop in CHF over the LQR due to a shift in mechanism 25 ................... 17!Fig. 6 – Quasi linear effect of mass flux on the critical heat flux for fixed inlet condition 33 .................... 18!Fig. 7 – Enhancement of the heat transfer properties of a the coolant near a grid spacer 37 ....................... 19!Fig. 8 – Effect of grid spacers on the critical heat flux 38 ........................................................................... 20!Fig. 9 – Portion of the 2006 LUT entered into a searchable spreadsheet ................................................... 23!Fig. 10 – Schematic of the near-wall bubble crowding model 41 ................................................................ 24!Fig. 11 – DNB CHF caused by the formation of a vapor blanket 42 ........................................................... 25!Fig. 12 – (Left) Channel centered and (Right) rod centered subchannels .................................................. 26!Fig. 13 – (Left) Secondary Systems (includes TRIGA CHF Facility) and (Right) Primary Test Loop of HPCHF Facility ........................................................................................................................................... 27!Fig. 14 – (Left) 2-D drawing and (Right) photo of the HPCHF primary system. ...................................... 29!Fig. 15 – Basic process flow diagram and 3-D model (accumulator not shown) of the HPCHF facility ... 30!Fig. 16 – Test section of the HPCHF facility with removable portion and start of the square flow channel indicated. ..................................................................................................................................................... 32!Fig. 17 – Detailed drawing of heater elements (in mm) as provided by Stern Laboratories 46 . ................. 33!Fig. 18 – (Left) Lower end of copper leads connecting to power cables (green wires for ground reference). (Right) Each cable leads to a SCR via conduit piping (top silver pipe) and attach on right of SCR. Top wires are AC power cables. ......................................................................................................................... 34!Fig. 19 – Modified top hub with installed copper cooling block. The moisture seal can be seen between the white disc and cooling block and a portion of the threaded packing seal is visible between the cooling block and the Grayloc hub. ......................................................................................................................... 35!Fig. 20 – (Left) Bottom hub cooling block. (Middle) Modified bottom hub and cooling block. (Right) 15 cm standoff. ................................................................................................................................................. 36!Fig. 21 – Power profile of non-uniform heater elements as a function of heated length ............................ 36!Fig. 22 – TC orientation of each heater element type, heater number reference used in paper, and heater element locations. ........................................................................................................................................ 38!Fig. 23 – Chopped cosine power profile and associated axial thermocouple location on each heater element. Green markers indicate possible location of a grid spacer. .......................................................... 38!Fig. 24 – Visual comparison of the flow into the first 2.54 cm of the square channel for four inlet plenum options. The outline of the heater elements can be seen in the lower portion of each figure. Vertical and inner diameter dimensions are given for reference as images are not scaled the same. Inlet (In), tee section (Tee) and outlet (Out) have the same dimensions. Velocity color scheme is identical across all figures. . 40!Fig. 25 – Velocity contour plot of each plenum in Fig. 24 at (Left) the transition and (Right) 2.54 cm after the transition. ............................................................................................................................................... 41!Fig. 26 – Velocity contour plots of a straight plenum of 1) 25.4 cm, 2) 15.2 cm, and 3) 2.54 cm ............. 42!
vi
Fig. 27 – Temperature contours capturing the transition (left to right) of preferential heat distribution from between the heating elements to between the heating elements and wall based on hgap/Ggap ratio ............. 44!Fig. 28 – (Left) 3-D internal view of the support plate. (Right) Actual support place welded in place. .... 45!Fig. 29 – SS316 channel pieces (thickness of 0.3175 cm) comprising the square flow channel. Dimensions are in cm. ................................................................................................................................. 45!Fig. 30 – (Left) Top end of square channel inserted into piping (Right) 3-D view of channel inserted into square plate. ................................................................................................................................................ 46!Fig. 31 – Custom grid spacers used in HPCHF facility. (Right) Installed grid spacer on actual heater elements. ..................................................................................................................................................... 46!Fig. 32 – Comparison of predicted pressure drop from ASME correlation to calibration data of the orifice flow meter scaled to water at 275°C and 12.8 MPa. ................................................................................... 48!Fig. 33 – (Left) Schematic of axial bulk TC position. (Right) Bulk TCs 5-8 distribution with representation of minimal entrance into flow channel. ............................................................................... 49!Fig. 34 – (Counter Clockwise from Top Left) Pressure tubes and support/mixing baffles, tube sheet, high pressure inlet/outlet, installed heat exchanger with bypass valve. .............................................................. 50!Fig. 35 – Installed primary heat exchanger bypass valve. .......................................................................... 51!Fig. 36 – HPCHF Facility primary loop pump ........................................................................................... 52!Fig. 37 – HPCHF Facility primary loop pump curve ................................................................................. 52!Fig. 38 – Simple diagram of the pressurization/thermal expansion system. ............................................... 54!Fig. 39 – (Clockwise from top left) Pneumatic control valves, pressurization tanks, concentric tube heat exchanger. ................................................................................................................................................... 55!Fig. 40 – Primary support structure and location of test loop weight bearing supports ............................. 57!Fig. 41 – (Left) 2-D side and top view and (Right) photo of primary loop spring support ........................ 59!Fig. 42 – Support system for the high pressure heat exchanger ................................................................. 60!Fig. 43 – Modified TRIGA CHF Facility ................................................................................................... 61!Fig. 44 – (Left) Plate heat exchanger. (Middle) Glycol/Water tank. (Right) Glycol/water air chiller. ...... 61!Fig. 45 – TRIGA facility (Left) before and (Right) after addition of distribution manifold ...................... 62!Fig. 46 – (Left) High pressure pump heat exchanger. (Right) Glycol/water control valves. ..................... 62!Fig. 47 – Secondary cooling manifold and flowmeters for rod pressure boundaries, pressurizer concentric tube heat exchanger and shell side of high pressure heat exchanger (flowmeter with blue top). ............... 63!Fig. 48 – (Left) Primary hardware for DAQ system. (Right) Screenshot of portion of LabVIEW interface. ..................................................................................................................................................................... 64!Fig. 49 – Test inlet pressure (Pin) at CHF occurrence as a function of the test section mass flux (Gtest) based on an initial cold starting pressure (lines) with an initial cold pressurizer water height (Hpress) of 137 cm. ............................................................................................................................................................... 68!Fig. 50 – Heater element thermocouple measurements for an experimental run indicating a CHF event. 69!Fig. 51 – (Left) All bulk thermocouples at CHF occurrence. (Right) Bulk thermocouples at the same axial height. .......................................................................................................................................................... 71!Fig. 52 – The CHF as a function of inlet subcooling .................................................................................. 73!Fig. 53 – The CHF as a function of inlet pressure ...................................................................................... 73!Fig. 54 – The CHF as a function of mass flux ............................................................................................ 74!Fig. 55 – The CHF as a function of thermodynamic quality ...................................................................... 75!Fig. 56 – The thermodynamic exit quality as a function of (Left) mass flux and (Right) inlet pressure .... 75!

vii
Fig. 57 – Axial and circumferential location of CHF occurrence detected with embedded thermocouples. ..................................................................................................................................................................... 76!

viii
List of Tables
Table I – Summary of operating parameters of LWR SMR designs as reported by IAEA 16 ...................... 9!Table II –Operating Range of HPCHF Facility .......................................................................................... 28!Table III – Summary of test section and heater element dimensions ......................................................... 28!Table IV – Thermocouple axial location from beginning of the heated length and circumferential location (0° is TC #9 for Type 1 and TC #3 for Type 2 from the orientations shown in Fig. 22) of the two types of heater elements ............................................................................................................................................ 37!Table V – Outlet cross sectional plenum velocity data (m/s) ..................................................................... 41!Table VI – Summary of Square Channel Geometry Parameters ................................................................ 44!Table VII – Custom orifice plate dimensions and regressed Cd ................................................................. 48!Table VIII – Bulk thermocouple axial location .......................................................................................... 49!Table IX – Main components of the DAQ system ...................................................................................... 65!Table X – Summary of Test Range of Preliminary CHF Data ................................................................... 72!Table XI – Average deviation between identical tests ................................................................................ 77!

ix
Nomenclature
CHF critical heat flux (kW/m2s)
BO burnout
DO dryout
BC boiling crisis
SMR small modular reactor
LWR light water reactor
NEUP nuclear energy university program
DOE department of energy
CFD computational fluid dynamics
SS stainless steel or steady state
htr heater/heater element
D diameter
P pitch
hgap heater element to wall distance
Ggap distance between surfaces of heater elements
LHL heated length of heater elements
q power
qmax maximum power
qavg average power
1
I. Introduction
In 1937, Thomas B. Drew and Alfred C. Mueller presented a paper at the American Institute of
Chemical Engineers meeting in Toronto exploring an interesting link largely dismissed by the scientific
base at the time 1 . In this paper, the authors discuss how since man first put a pot of water on a fire it was
known that the water would boil and the pot would, relatively, never be much hotter than the liquid inside
it. Furthermore, if the temperature of the fire was increased, the violence of boiling would also increase.
Although the Leidenfrost effect was known, it is noted that of all the investigators of heat transfer at the
time, only Nukiyama appeared to recognize and investigate the existence of a ‘maximum boiling rate’
beyond which additional heating through a surface would actually decrease the heat transfer, exactly
opposite the normal behavior associated with the boiling pot scenario. Nukiyama first presented his
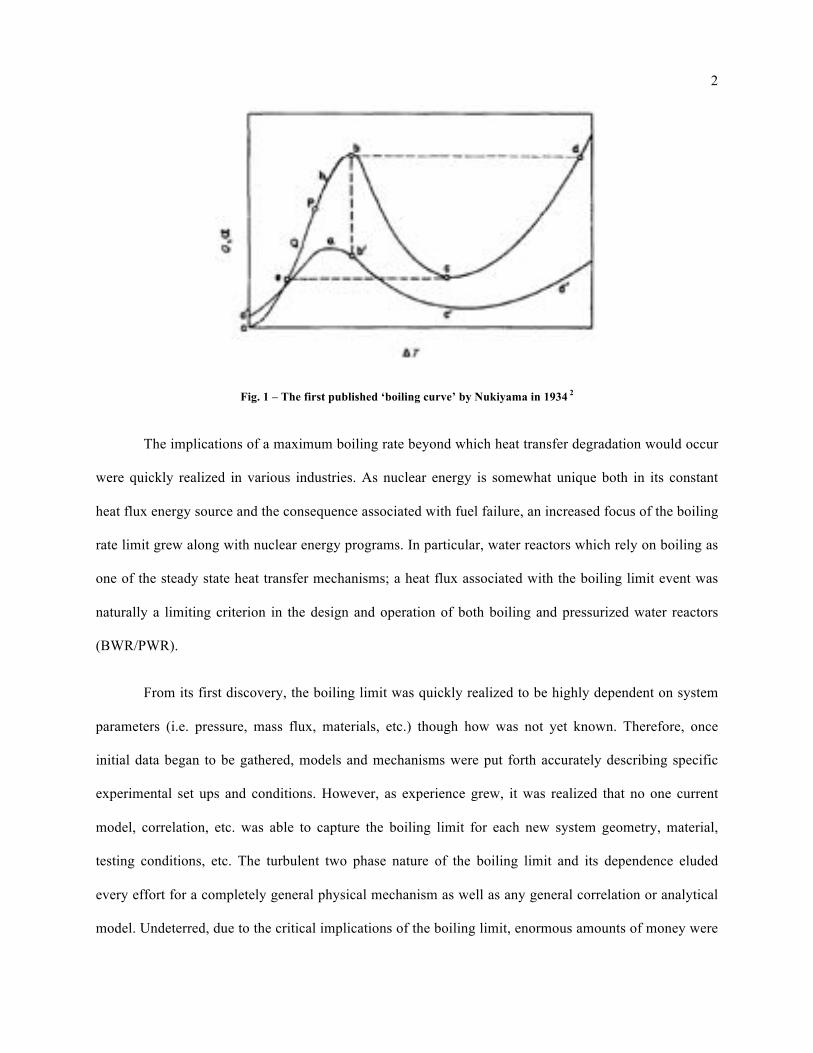
important findings and the first ‘boiling curve’ (Fig. 1) in the Japanese Journal Society of Mechanical
Engineers in 1934 (reproduced in English for the first time in 1966 2 ). The paper by Drew and Mueller
presented additional data using steam heating to ‘fill in’ the gaps (between b and c in Fig. 1) with
experimental data using steam heating and re-evaluated numerous data from other researches for
indications of the maximum boiling rate. Their results confirmed the conclusions of Nukiyama who
perhaps may be credited with the birth of the study of critical heat flux (CHF).
2
Fig. 1 – The first published ‘boiling curve’ by Nukiyama in 1934 2
The implications of a maximum boiling rate beyond which heat transfer degradation would occur
were quickly realized in various industries. As nuclear energy is somewhat unique both in its constant
heat flux energy source and the consequence associated with fuel failure, an increased focus of the boiling
rate limit grew along with nuclear energy programs. In particular, water reactors which rely on boiling as
one of the steady state heat transfer mechanisms; a heat flux associated with the boiling limit event was
naturally a limiting criterion in the design and operation of both boiling and pressurized water reactors
(BWR/PWR).
From its first discovery, the boiling limit was quickly realized to be highly dependent on system
parameters (i.e. pressure, mass flux, materials, etc.) though how was not yet known. Therefore, once
initial data began to be gathered, models and mechanisms were put forth accurately describing specific
experimental set ups and conditions. However, as experience grew, it was realized that no one current
model, correlation, etc. was able to capture the boiling limit for each new system geometry, material,
testing conditions, etc. The turbulent two phase nature of the boiling limit and its dependence eluded
every effort for a completely general physical mechanism as well as any general correlation or analytical
model. Undeterred, due to the critical implications of the boiling limit, enormous amounts of money were
3
and continue to be invested in experiments. To date, tens of thousands of public data points alone have
been gathered for various purpose be it basic scientific research or for the design and operation of nuclear
reactors.
This paper is a direct result of the situation previously described. New, untested systems designs
(namely small modular reactors) are in need of empirical data to determine if existing methods can predict
this boiling limit. If not, new methods must be determined in order to safely and efficiently design and
operate this new set of systems. This paper focuses on proposed pressurized light water small modular
nuclear reactor designs and their high pressure, low mass flux operating conditions as its focus.
A few references for information on two phase flow, critical heat flux, and related material in
addition to and beyond what is discussed in this paper can be found in the bibliography 3 4 5 6 7 8 9 10 .
I.A. The Critical Heat Flux Phenomenon
The boiling limit or Critical Heat Flux (CHF) is a two-phase flow phenomenon that is
characterized by a flow regime change near the heater wall which rapidly decreases the efficiency of the
heat transfer performance at the heater surface. The CHF condition is characterized by a local increase in
vapor void fraction which covers the heater surface. The increased vapor void fraction triggers an abrupt
and significant decrease in heat transfer rate between the heated surface and the two-phase coolant. The
system response to a CHF event depends on the heat source; constant temperature or constant heat flux.
The decrease in the heat transfer coefficient of a constant temperature heat source (e.g. steam heating)
will cause the heat flux through the system to quickly decrease. A constant heat flux source (e.g. nuclear
reactor, Ohmic heating) will have a rapid rise in the heating element wall temperature. The rise in
temperature can lead to melting, enhanced chemical attack, and/or other metallurgical changes.
Although strictly applicable quantitatively to pool boiling, Fig. 2 qualitatively generalizes the
transition in flow regime which triggers the CHF phenomenon previously described. As the temperature
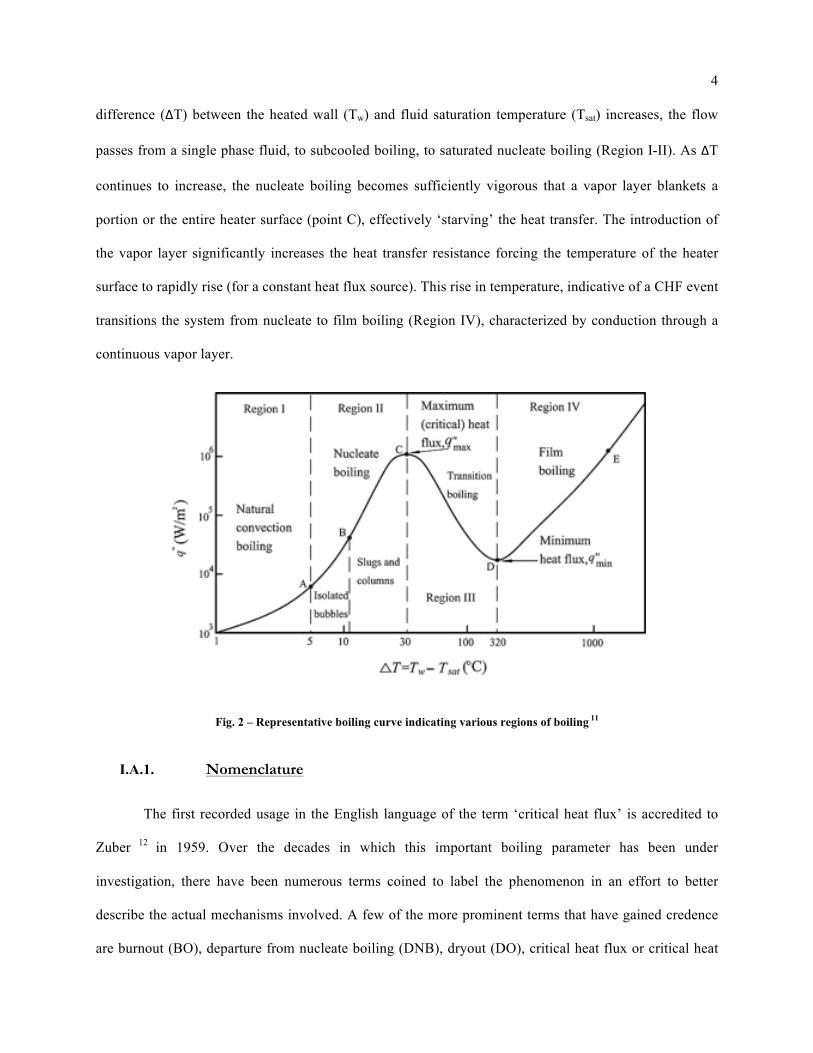
4
difference (ΔT) between the heated wall (Tw) and fluid saturation temperature (Tsat) increases, the flow
passes from a single phase fluid, to subcooled boiling, to saturated nucleate boiling (Region I-II). As ΔT
continues to increase, the nucleate boiling becomes sufficiently vigorous that a vapor layer blankets a
portion or the entire heater surface (point C), effectively ‘starving’ the heat transfer. The introduction of
the vapor layer significantly increases the heat transfer resistance forcing the temperature of the heater
surface to rapidly rise (for a constant heat flux source). This rise in temperature, indicative of a CHF event
transitions the system from nucleate to film boiling (Region IV), characterized by conduction through a
continuous vapor layer.
Fig. 2 – Representative boiling curve indicating various regions of boiling 11
I.A.1. Nomenclature
The first recorded usage in the English language of the term ‘critical heat flux’ is accredited to
Zuber 12 in 1959. Over the decades in which this important boiling parameter has been under
investigation, there have been numerous terms coined to label the phenomenon in an effort to better
describe the actual mechanisms involved. A few of the more prominent terms that have gained credence
are burnout (BO), departure from nucleate boiling (DNB), dryout (DO), critical heat flux or critical heat

5
flux condition (CHFC), and boiling crisis (BC). However, by the late 80s to early 90s, the term critical
heat flux had become the most widely used generic term. The evolution of the use of CHF can be
captured by two statements from prominent researchers. Burnout, for example, was used by G. F. Hewitt
in his classic two phase text book published in 1970 8 . In his chapter, prominently titled ‘Burnout’,
Hewitt states the following:
“The large diversity of terms tends to be confusing and this diversity reflects a continuing search for a
term which is both descriptive and scientifically accurate... Although all the terms are, in one way or
another, unsatisfactory... [burnout] is chosen because, for most purposes, it is the least unsatisfactory of
those listed above and also because it has the widest acceptance. However, the reader should be quite
clear that in a heat flux controlled system the term ‘burnout’… does not necessarily imply physical
melting of the wall… In our view [critical heat flux] nomenclature… is clumsy and should not be
employed.”
In contrast to Hewitt’s comments in 1970, and as a reflection of the transition to ‘critical heat
flux’, J. G. Collier and J. R. Thome stated in their 1994 textbook 5 :
“There is considerable disparity in nomenclature for the critical heat flux condition. The most common
name is ‘burnout’ but this implies a physical destruction of the heated surface… The alternative forms
‘DNB’… and ‘dryout’ [and ‘boiling crisis’] are equally unsatisfactory for a general description of the
phenomenon since they imply definite mechanisms. The term ‘critical heat flux condition’ has therefore
been chosen to denote the state of the system when the characteristic reduction in heat transfer coefficient
has just occurred… The term ‘burnout heat flux’… has been abused by many who use it to denote the
heat flux at which the rapid deterioration of the cooling process occurs…”
In accordance with the apparent acceptance of ‘critical heat flux’ as the best generic term, this
paper will employ the usage put forth by Collier and Thome above. Specifically, a critical heat flux
condition (or event, occurrence, etc.) will characterize the state of the system when an abrupt reduction in
6
heat transfer occurs while the critical heat flux will refer to the heat flux of the system at the initiation of
the event. Generally accepted descriptions of the primary terms noted above used to designate a CHF
conditions are presented below for reference.
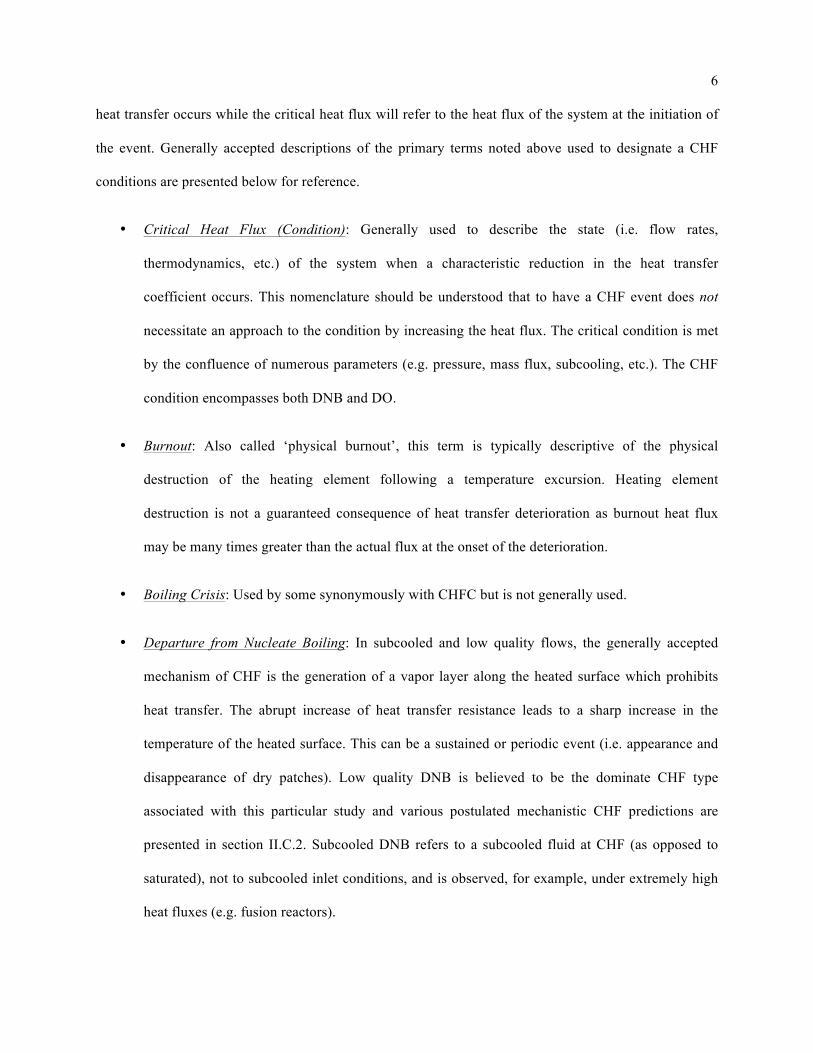
• Critical Heat Flux (Condition): Generally used to describe the state (i.e. flow rates,
thermodynamics, etc.) of the system when a characteristic reduction in the heat transfer
coefficient occurs. This nomenclature should be understood that to have a CHF event does not
necessitate an approach to the condition by increasing the heat flux. The critical condition is met
by the confluence of numerous parameters (e.g. pressure, mass flux, subcooling, etc.). The CHF
condition encompasses both DNB and DO.
• Burnout: Also called ‘physical burnout’, this term is typically descriptive of the physical
destruction of the heating element following a temperature excursion. Heating element
destruction is not a guaranteed consequence of heat transfer deterioration as burnout heat flux
may be many times greater than the actual flux at the onset of the deterioration.
• Boiling Crisis: Used by some synonymously with CHFC but is not generally used.
• Departure from Nucleate Boiling: In subcooled and low quality flows, the generally accepted
mechanism of CHF is the generation of a vapor layer along the heated surface which prohibits
heat transfer. The abrupt increase of heat transfer resistance leads to a sharp increase in the
temperature of the heated surface. This can be a sustained or periodic event (i.e. appearance and
disappearance of dry patches). Low quality DNB is believed to be the dominate CHF type
associated with this particular study and various postulated mechanistic CHF predictions are
presented in section II.C.2. Subcooled DNB refers to a subcooled fluid at CHF (as opposed to
saturated), not to subcooled inlet conditions, and is observed, for example, under extremely high
heat fluxes (e.g. fusion reactors).

7
• Dryout: In high quality regions, the balance of evaporation, entrainment, and liquid deposition on
the heated surface lead to the depletion or ‘dryout’ of the thin liquid film layer. Typical dryout
conditions occur in annular flows where high velocities are prevalent. These high flows lead to a
post CHF heat transfer case with mildly reduced heat transfer coefficients. Since heat transfer is
still relatively effective, the characteristic spike in heated surface temperature observed is
reduced.
I.B. The Small Modular Reactor
From increasing contributions of intermittent power sources, introduction of micro-grids, aging
infrastructure, negative anthropogenic impacts on the environment (including effects of the modernization
of the ‘South’), and increasing regulation to name a few; there are numerous challenges the energy
industry are working to address. Solutions for the variety of challenges faced, along with their
complexity, will require the development and application of new technologies and political savvy. From
a technological standpoint, a more compact nuclear reactor design dubbed a ‘Small Modular Reactor’
(SMR) has gained significant attention as a promising option to meet several of the challenges of the 21st
century.
A ‘small’ nuclear power reactor is categorized according to an electrical power output of 300
MWe or less (typical based load plants are typically around 1000 MWe). The size of the reactor naturally
lends itself to potential hybridization with other energy sources and industry applications along with an
ability to contribute to micro-grids although it will most likely sacrifice thermal efficiency and neutron
economy.
‘Modular’ refers to the ability to manufacture the major components of the reactor in a factory
setting and then ship the components to the point of use. This modularity also may include all reactor
cooling components (e.g. steam generator) enclosed within a single pressure vessel (also known as an
integrated reactor design, IPWR). The modularity of the reactor is envisioned to significantly reduce

8
construction time/cost and improve standardization, quality control, etc. through an assembly line type
production. Furthermore, the size and modularity of the reactor is predicted to lower capital investment by
permitting additional modules to be purchased as the customers power demands change. In addition to
potentially improved economics, SMR designs are focused on simplicity of design with enhanced safety
features 13 . For more information, a publication of small modular reactors and specifically the NuScale
Power approach 14 is recommended as a starting point in addition to numerous other resources (e.g. NRC
meetings 15 , company websites, numerous conferences presentations, etc.)
Though the successfulness of the business model is debatable (as it is still in its infancy), there are
numerous reactors under design around the world ranging from traditional light water reactors (LWRs) to
gas cooled to liquid metal cooled reactors. The IAEA has provided a useful overview of the status of
numerous SMR designs 16 from which a summary of the LWR SMR designs is presented in Table I. Lui
and Fan 17 provide a brief overview of a few SMR designs along with a qualitative evaluation of the
technological ‘readiness’ of the most mature SMR LWR designs. Their assessment indicates an
approximate ten year lead time until full deployment of a SMR. This corresponds well with timelines set
forth by companies such as Oregon USA based NuScale Power which is expected to submit its design
certification (DC) in the second half of 2016 18 corresponding to end of year three of a ten year projected
timeline presented to Energy NorthWest by NuScale Power 19 . First SMR commercial deployment is thus
expected in the 2020s.
9
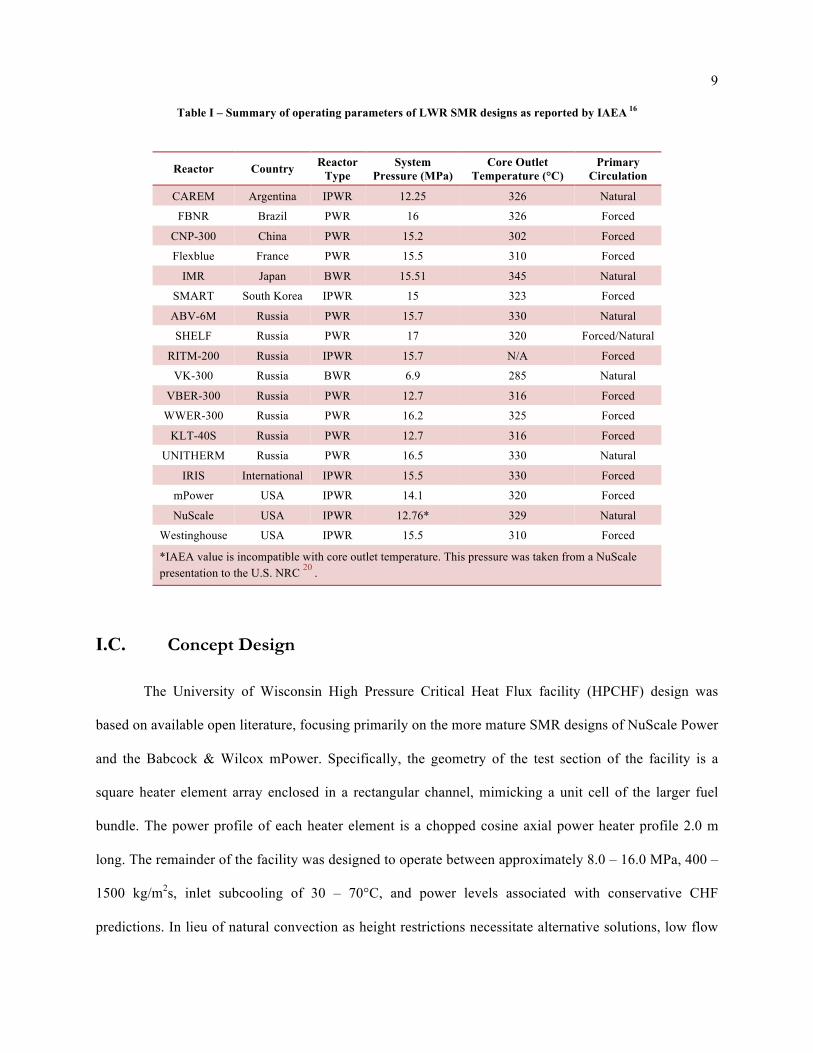
Table I – Summary of operating parameters of LWR SMR designs as reported by IAEA 16
Reactor Country Reactor Type
System Pressure (MPa)
Core Outlet Temperature (°C)
Primary Circulation
CAREM Argentina IPWR 12.25 326 Natural
FBNR Brazil PWR 16 326 Forced
CNP-300 China PWR 15.2 302 Forced
Flexblue France PWR 15.5 310 Forced
IMR Japan BWR 15.51 345 Natural
SMART South Korea IPWR 15 323 Forced
ABV-6M Russia PWR 15.7 330 Natural
SHELF Russia PWR 17 320 Forced/Natural
RITM-200 Russia IPWR 15.7 N/A Forced
VK-300 Russia BWR 6.9 285 Natural
VBER-300 Russia PWR 12.7 316 Forced
WWER-300 Russia PWR 16.2 325 Forced
KLT-40S Russia PWR 12.7 316 Forced
UNITHERM Russia PWR 16.5 330 Natural
IRIS International IPWR 15.5 330 Forced
mPower USA IPWR 14.1 320 Forced
NuScale USA IPWR 12.76* 329 Natural
Westinghouse USA IPWR 15.5 310 Forced
*IAEA value is incompatible with core outlet temperature. This pressure was taken from a NuScale presentation to the U.S. NRC 20 .
I.C. Concept Design
The University of Wisconsin High Pressure Critical Heat Flux facility (HPCHF) design was
based on available open literature, focusing primarily on the more mature SMR designs of NuScale Power
and the Babcock & Wilcox mPower. Specifically, the geometry of the test section of the facility is a
square heater element array enclosed in a rectangular channel, mimicking a unit cell of the larger fuel
bundle. The power profile of each heater element is a chopped cosine axial power heater profile 2.0 m
long. The remainder of the facility was designed to operate between approximately 8.0 – 16.0 MPa, 400 –
1500 kg/m2s, inlet subcooling of 30 – 70°C, and power levels associated with conservative CHF
predictions. In lieu of natural convection as height restrictions necessitate alternative solutions, low flow

10
forced convection of the coolant was applied via a high pressure pump. It has been determined that this is
an acceptable alternative as there is no apparent dependency of the CHF on the circulation type, only the
actual flow rate 21 22 .
I.D. Research Goals
As outlined in the summary of the funding proposal to the Nuclear Energy University Program
(NEUP) funded by the U.S. Department of Energy (see Appendix A), the purpose of this research is to
provide ‘validation data for an updated critical heat flux model for use in thermal-hydraulic computer
codes’ and improve ‘understanding of the CHF process… in a rod bundle geometry’ for SMR designs
(e.g. NuScale PWR, Babcock-Wilcox mPower) for which data do not currently exist. In fulfillment of the
scope of the project, the necessary work was divided in to four specific goals/tasks.
1. Perform a scaling analysis for rod bundle geometry appropriate for SMR designs
2. Design and construct a CHF test facility
3. Create a CHF database from gathered experimental data
4. Compare the CHF data with current correlations and develop a more mechanistic model
Requirements of the first task are with described in section III.C.2 as appropriate. The second task
is the focus of section III with the basic performance of the facility discussed in section IV. The third and
fourth goals are in progress. Preliminary data and the future work necessary to satisfy the third and fourth
goal are discussed in sections V and VI respectively.

11
II. Literature Review
Over the last several decades, enormous amount of monetary and person resources have been
spent on acquiring CHF data for a myriad conditions. The data bank collected by Atomic Energy of
Canada Limited (AECL) and Institute of Physics and Power Engineering (IPPE) contains over 30,000
non-proprietary data points for water cooled tubes dating from as far back as the 1964 publication of the
first collection of CHF data (3,800 points) 23 . It is from this database that the oft referenced ‘Look-Up
Tables’ (LUT) are derived (i.e. the 1986 23 , 1995 24 , and 2006 25 versions). Experimental CHF data, such
as that mentioned above, is typically used to create correlations for CHF prediction and validate
mechanistic models. Unfortunately, once derived, these methods still suffer from narrow regions of
application, bounded by the data from which they are built. The complex, two phase nature of the CHF
condition has so far thwarted the scientific community’s ability to generalize the prediction of the CHF
condition. It is for this reason more than 1000 correlations have been presented for varying conditions 25 .
Whatever the limitations, given the large number of experiments performed using simple tube
type geometries, many attempts have been made to use existing databases, correlations, and mechanistic
models to create a general and reliable prediction method for more complex geometries and parameters
(e.g. rod bundles and non-uniform heat fluxes). The general approach of relating uniform tube data to
other conditions is with the application of a correction coefficient that attempts to capture trends observed
by experimental data (e.g. Tong F-Factor Method). These methods have been met with varying levels of
success that are once again bounded, just as with the tube data, by the narrow ranges of data upon which
their derivation is based. Therefore, owing to the critical importance of the CHF phenomenon limitation
in design and operation of various systems, continued resources have been allotted to numerous rod
bundle CHF experiments.
12
II.A. Existing Rod Bundle CHF Data
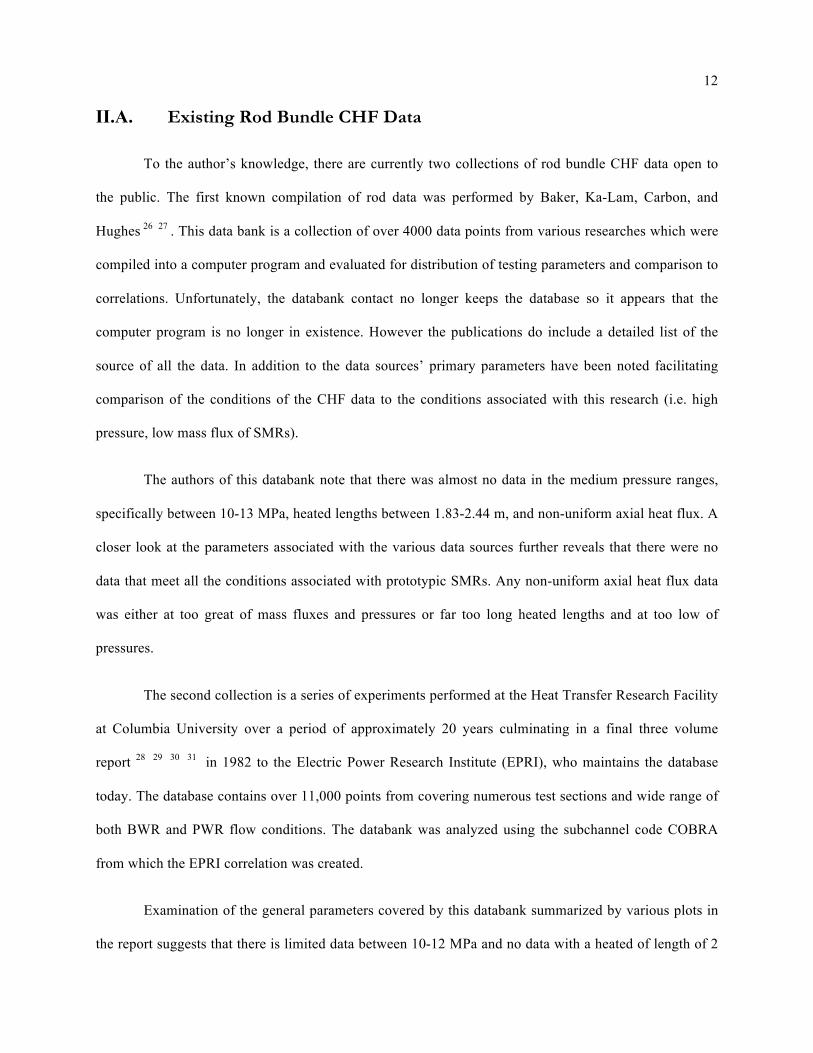
To the author’s knowledge, there are currently two collections of rod bundle CHF data open to
the public. The first known compilation of rod data was performed by Baker, Ka-Lam, Carbon, and
Hughes 26 27 . This data bank is a collection of over 4000 data points from various researches which were
compiled into a computer program and evaluated for distribution of testing parameters and comparison to
correlations. Unfortunately, the databank contact no longer keeps the database so it appears that the
computer program is no longer in existence. However the publications do include a detailed list of the
source of all the data. In addition to the data sources’ primary parameters have been noted facilitating
comparison of the conditions of the CHF data to the conditions associated with this research (i.e. high
pressure, low mass flux of SMRs).
The authors of this databank note that there was almost no data in the medium pressure ranges,
specifically between 10-13 MPa, heated lengths between 1.83-2.44 m, and non-uniform axial heat flux. A
closer look at the parameters associated with the various data sources further reveals that there were no
data that meet all the conditions associated with prototypic SMRs. Any non-uniform axial heat flux data
was either at too great of mass fluxes and pressures or far too long heated lengths and at too low of
pressures.
The second collection is a series of experiments performed at the Heat Transfer Research Facility
at Columbia University over a period of approximately 20 years culminating in a final three volume
report 28 29 30 31 in 1982 to the Electric Power Research Institute (EPRI), who maintains the database
today. The database contains over 11,000 points from covering numerous test sections and wide range of
both BWR and PWR flow conditions. The databank was analyzed using the subchannel code COBRA
from which the EPRI correlation was created.
Examination of the general parameters covered by this databank summarized by various plots in
the report suggests that there is limited data between 10-12 MPa and no data with a heated of length of 2
13
m nor any in a 2x2 array (smallest is 3x3). Further inspection of the experimental data indicates little, if
any, data with a non-uniform axial flux at low mass flux (less than approximately 1300 kg/m2s). If
additional sub categorization of the experimental data was performed further limitations of the parameters
covered would likely be evident. This suggests that while various aspects of SMR conditions are covered
by this database, there is limited to no data available that satisfies a multiple parameter criteria (i.e.
pressure, subcooling, mass flux, and non-uniform axial flux) necessary to predict relevant CHF
conditions.
II.B. Parametric Trends
As part of the effort to define mechanisms and produce accurate correlations, the scientific
community has gone to great lengths to understand what system parameters influence the CHF. It has
been determined that there are two general categories in which system variables may be categorized:
primary and secondary. Primary variables are defined as those which significantly alter the CHF
condition. These primary parameters have been determined to be inlet subcooling, system pressure, mass
flux (velocity), geometry (e.g. length, diameter). Secondary parameters are those whose influence is
generally dominated by the primary variables’ effects. These secondary variables therefore have, in
general, little effect on the CHF. Examples of secondary variables include the method of heating, system
materials (including heated wall thickness and surface roughness), and channel orientation. It should be
noted that certain ‘secondary’ parameters (e.g. channel orientation) may change the CHF value
significantly but is still controlled by the primary parameters (i.e. difference in CHF between horizontal
and vertical channels decreases as the mass velocity and/or system pressure is increased and the system
diameter is decreased 5 ).
The wide range of investigated parameters and the amount of literature summarizing the results
do not lend themselves to a completely inclusive discussion within this document as the primary scope of
this research is on rod bundle power reactors. Therefore, only pertinent parameters with direct
14
implications to this thesis (e.g. saturated DNB CHF) will be discussed in additional detail. Any variables
not discussed are assumed to negligibly affect the CHF in this study or are not applicable based on
discussions in the literature.
It is evident from the literature that there are a significant variety of approaches to viewing data in
efforts characterize parameter effects. A useful approach is to entertain the study of a topic based on what
will be termed the ‘fixed inlet’ approach. This terminology is not unique to the present discussion. In the
operation of the facility the controlled and measured flow parameters are inlet subcooling, inlet pressure,
and mass flux. ‘Fixing’ all but one of these parameters is known as a fixed inlet condition. CHF trends
associated with variation of these measurables will be described. A shortcoming of this approach is that
this method fails to capture some less obvious variations such property changes associated with pressure.
However, in the author’s opinion, this simple and general approach captures the macro view of the CHF
phenomenon thereby permitting an easily understood foundation from which more in depth examinations
can be initiated.
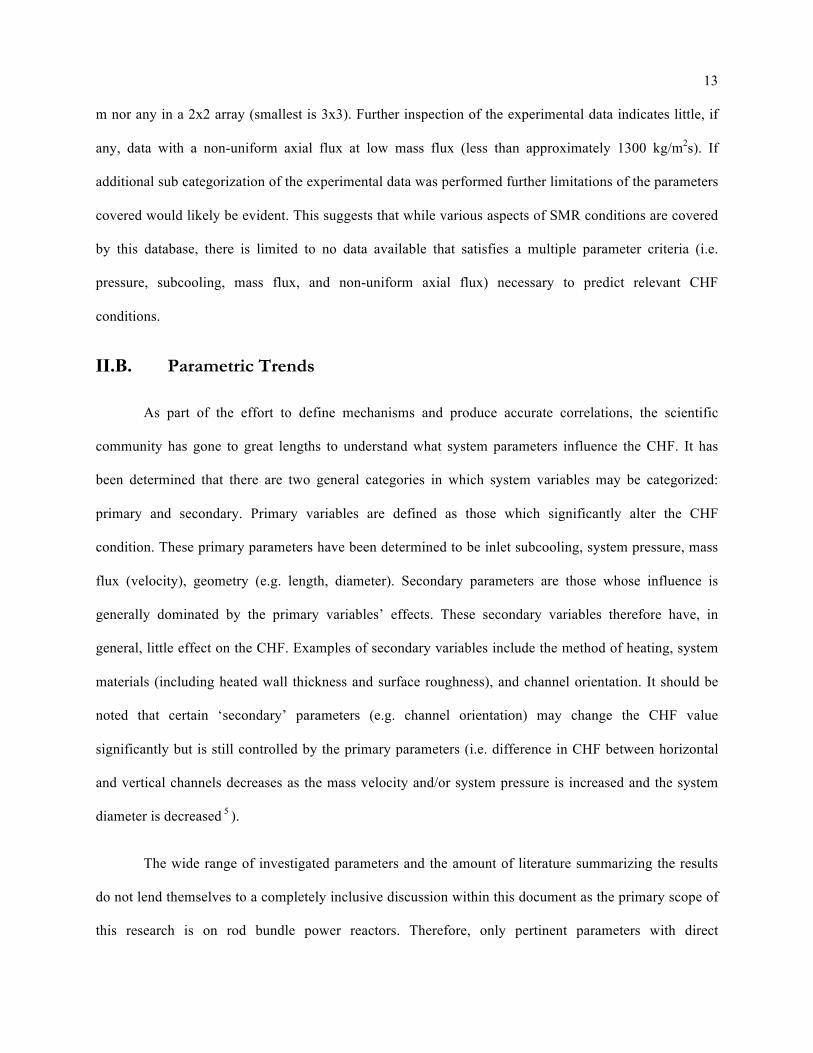
II.B.1. Inlet Subcooling
Inlet subcooling (enthalpy, Δhsub or Δisub, or temperature, ΔTsub) is the difference of the saturated
(hfsat, Tsat) and the inlet (hin, Tin) enthalpy/temperature. Over wide ranges of subcooling the CHF increases
approximately linearly with increased inlet subcooling. A set experimental data often referenced in
literature is that of Weatherhead 32 plotted in Fig. 3 illustrating this linear dependence. Additional studies
33 34 suggest that at low mass fluxes (G < 500 kg/m2s) the effects of subcooling are diminished and are
potentially negligible. Likewise at other extreme conditions (e.g. very high subcooling) other non-linear
behaviors may be observed 7 33 .
15
Fig. 3 – Linear effect of inlet subcooling on the critical heat flux for fixed inlet condition 32
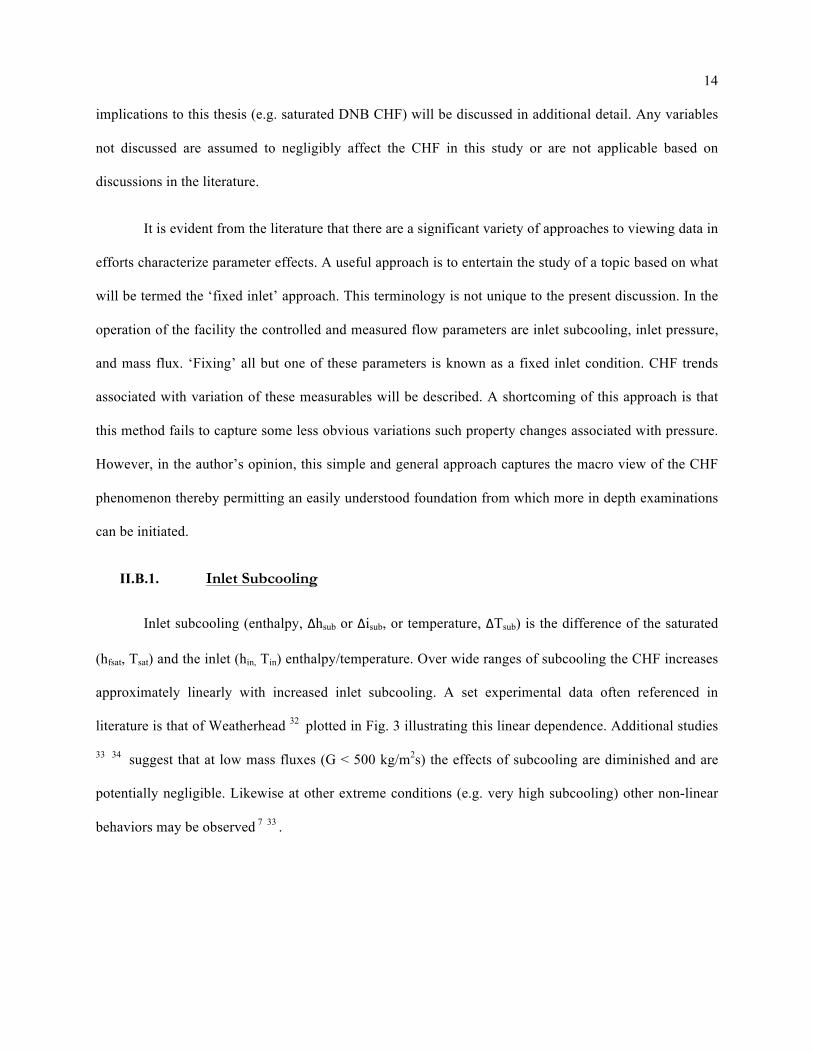
II.B.2. Influence of Pressure
The pressure (P - local, inlet, or exit) is often referred to as the system pressure. With this usage,
it is assumed that the channel pressure loss as compared to the static system pressure is negligible.
Pressure effects on the CHF are complex though some generalities may be made. In the fixed inlet
approach, CHF typically increases with pressure at low pressures, attains a maximum, and then decreases
with increasing pressure (Fig. 4). Additional discussions on other trends observed with pressure are
readily available 5 9 .
16
Fig. 4 – Influence of pressure on the critical heat flux for a fixed inlet condition 5 .
A proposed explanation of this parabolic behavior is based on a balance of evaporation rate and
entrainment. The evaporation rate increases as pressure increases due to a decreasing latent heat of
vaporization which is reflected in a decreasing CHF value. Entrainment rate is proportional to the ratio of
the specific volume of the steam to water. Therefore, if the entrainment rate is larger, the CHF will
increase due to enhanced wetting and more uniform dispersion of the vapor. As pressure increases the
specific volume ratio decreases, thereby reducing the entrainment rate and diminishing CHF
enhancement. These two competing forces are believed to contribute to the behavior of the CHF and
pressure and, thus, may explain the diminishing CHF value at higher pressures 35 .
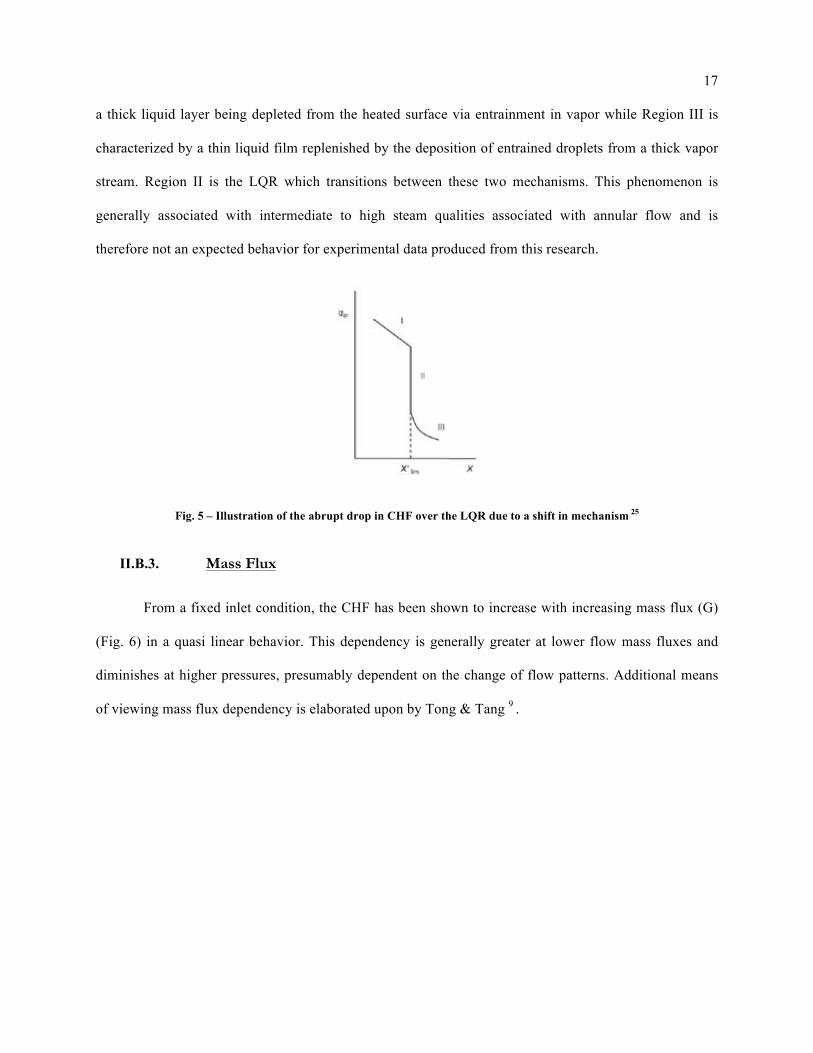
An additional observation requiring mention is the second maximum occurring in high pressure
region. This phenomenon is believed to be attributed to the limiting quality region (LQR). This region is
defined where the CHF rapidly decreases with an increase in steam quality associated with what is
believed to be a change in mechanism as the steam quality changes. Bennet et al. 36 and Groeneveld et al.
25 among others illustrate this approach in their papers as shown in Figure 8. Region I is characterized by
17
a thick liquid layer being depleted from the heated surface via entrainment in vapor while Region III is
characterized by a thin liquid film replenished by the deposition of entrained droplets from a thick vapor
stream. Region II is the LQR which transitions between these two mechanisms. This phenomenon is
generally associated with intermediate to high steam qualities associated with annular flow and is
therefore not an expected behavior for experimental data produced from this research.
Fig. 5 – Illustration of the abrupt drop in CHF over the LQR due to a shift in mechanism 25
II.B.3. Mass Flux
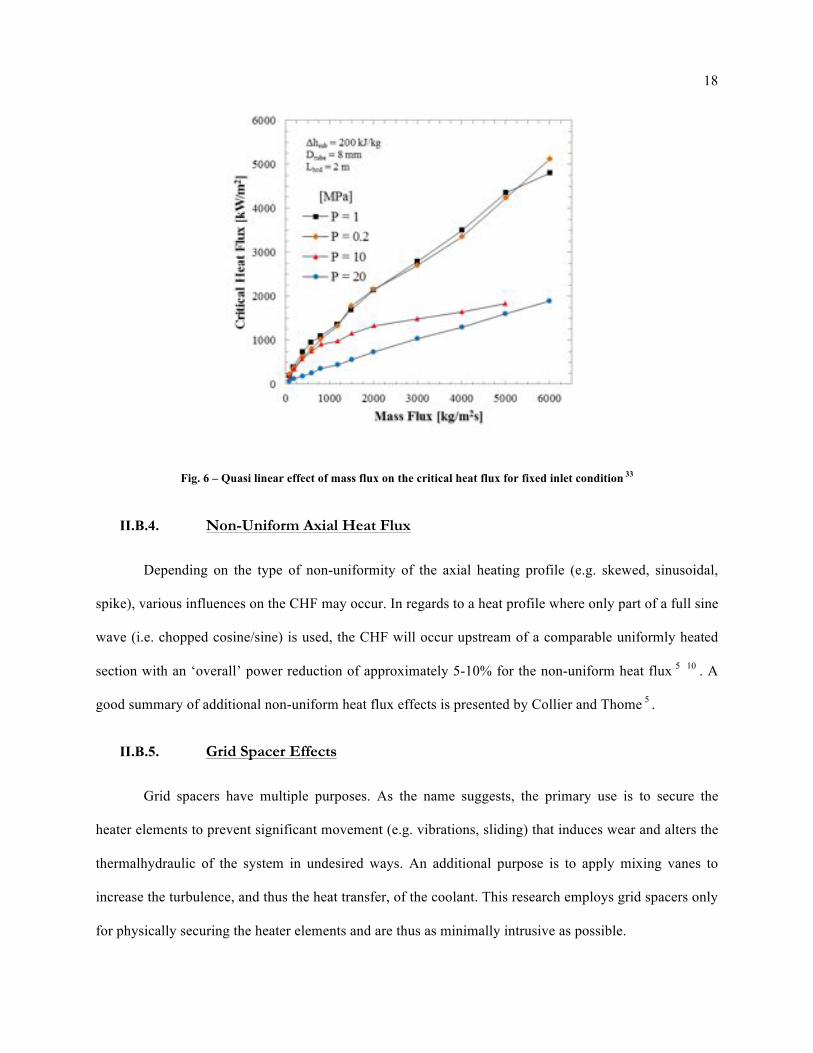
From a fixed inlet condition, the CHF has been shown to increase with increasing mass flux (G)
(Fig. 6) in a quasi linear behavior. This dependency is generally greater at lower flow mass fluxes and
diminishes at higher pressures, presumably dependent on the change of flow patterns. Additional means
of viewing mass flux dependency is elaborated upon by Tong & Tang 9 .
18
Fig. 6 – Quasi linear effect of mass flux on the critical heat flux for fixed inlet condition 33
II.B.4. Non-Uniform Axial Heat Flux
Depending on the type of non-uniformity of the axial heating profile (e.g. skewed, sinusoidal,
spike), various influences on the CHF may occur. In regards to a heat profile where only part of a full sine
wave (i.e. chopped cosine/sine) is used, the CHF will occur upstream of a comparable uniformly heated
section with an ‘overall’ power reduction of approximately 5-10% for the non-uniform heat flux 5 10 . A
good summary of additional non-uniform heat flux effects is presented by Collier and Thome 5 .
II.B.5. Grid Spacer Effects
Grid spacers have multiple purposes. As the name suggests, the primary use is to secure the
heater elements to prevent significant movement (e.g. vibrations, sliding) that induces wear and alters the
thermalhydraulic of the system in undesired ways. An additional purpose is to apply mixing vanes to
increase the turbulence, and thus the heat transfer, of the coolant. This research employs grid spacers only
for physically securing the heater elements and are thus as minimally intrusive as possible.
19
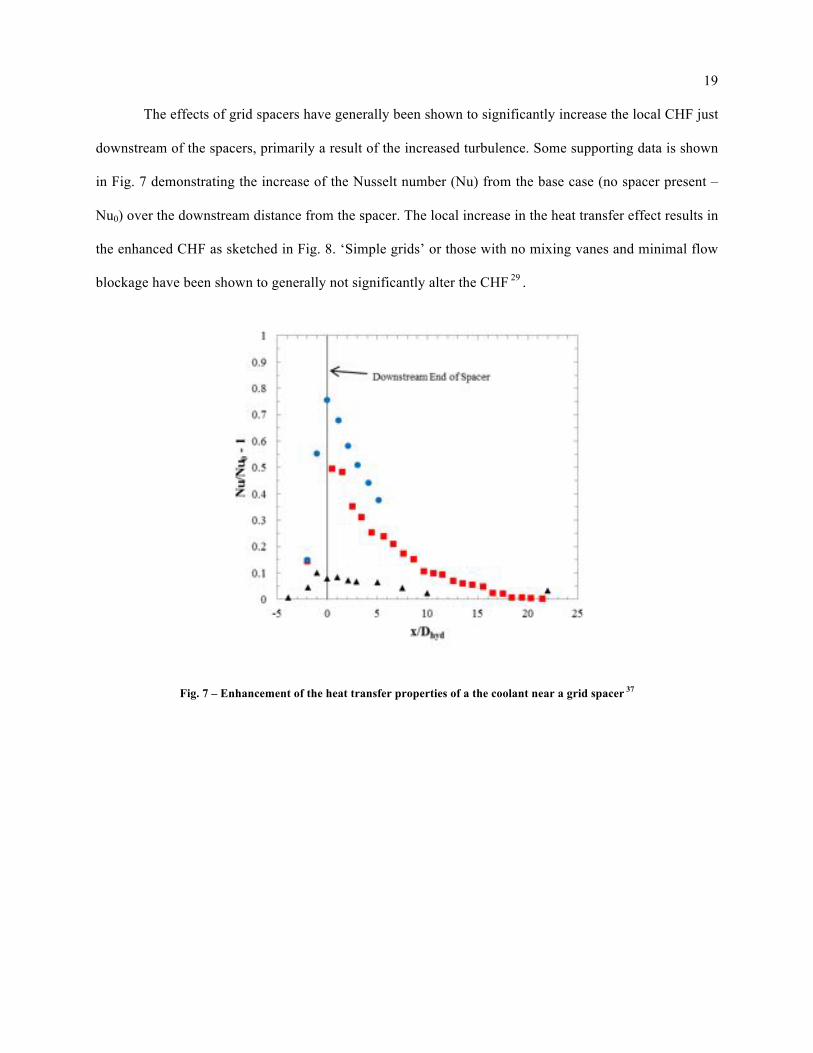
The effects of grid spacers have generally been shown to significantly increase the local CHF just
downstream of the spacers, primarily a result of the increased turbulence. Some supporting data is shown
in Fig. 7 demonstrating the increase of the Nusselt number (Nu) from the base case (no spacer present –
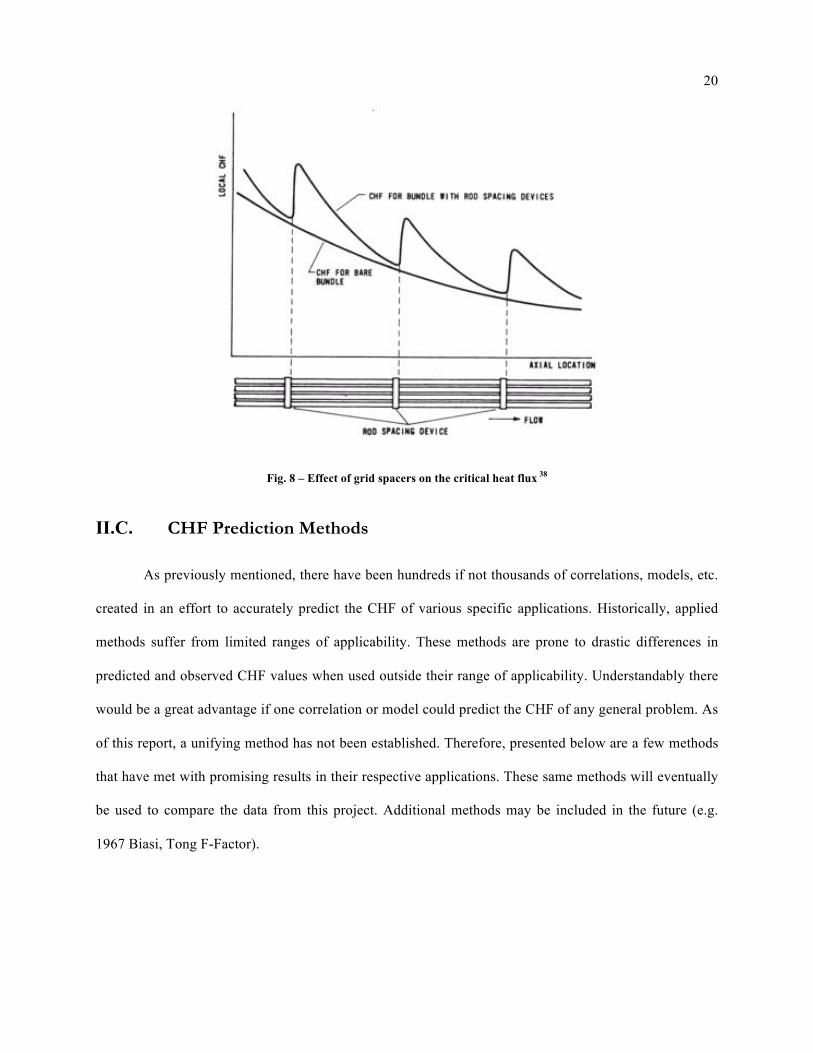
Nu0) over the downstream distance from the spacer. The local increase in the heat transfer effect results in
the enhanced CHF as sketched in Fig. 8. ‘Simple grids’ or those with no mixing vanes and minimal flow
blockage have been shown to generally not significantly alter the CHF 29 .
Fig. 7 – Enhancement of the heat transfer properties of a the coolant near a grid spacer 37
20
Fig. 8 – Effect of grid spacers on the critical heat flux 38
II.C. CHF Prediction Methods
As previously mentioned, there have been hundreds if not thousands of correlations, models, etc.
created in an effort to accurately predict the CHF of various specific applications. Historically, applied
methods suffer from limited ranges of applicability. These methods are prone to drastic differences in
predicted and observed CHF values when used outside their range of applicability. Understandably there
would be a great advantage if one correlation or model could predict the CHF of any general problem. As
of this report, a unifying method has not been established. Therefore, presented below are a few methods
that have met with promising results in their respective applications. These same methods will eventually
be used to compare the data from this project. Additional methods may be included in the future (e.g.
1967 Biasi, Tong F-Factor).
21
II.C.1. Experimental Correlations & Look-Up Tables
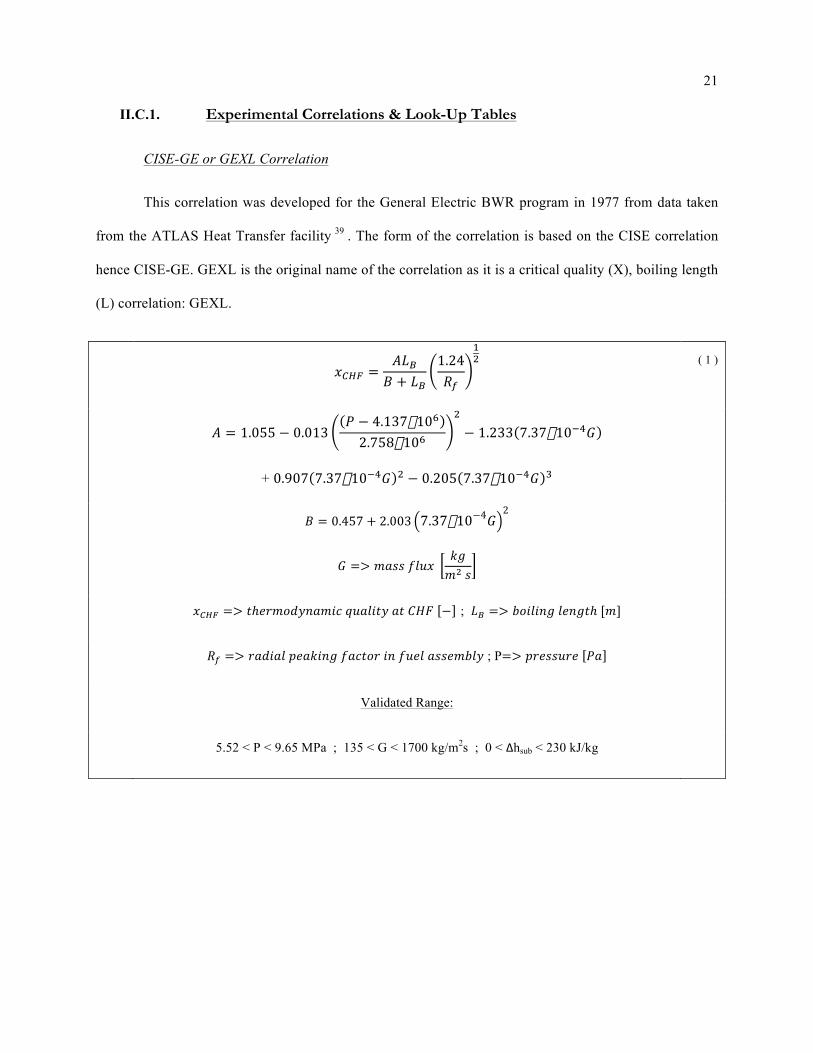
CISE-GE or GEXL Correlation
This correlation was developed for the General Electric BWR program in 1977 from data taken
from the ATLAS Heat Transfer facility 39 . The form of the correlation is based on the CISE correlation
hence CISE-GE. GEXL is the original name of the correlation as it is a critical quality (X), boiling length
(L) correlation: GEXL.
!!"# =!!!! + !!
1.24!!
!!
( 1 )
! = 1.055 − 0.013 ! − 4.137�10!
2.758�10!!− 1.233 7.37�10!!!
+ 0.907 7.37�10!!! ! − 0.205 7.37�10!!! !
! = 0.457 + 2.003 7.37�10−4! 2
! => !"##!!"#$! !"!!!!
!!"# => !ℎ!"#$%&'(#)*!!"#$%&'!!"!!"#! − ; !! => !"#$#%&!!"#$%ℎ![!]
!! => !"#$"%!!"#$%&'!!"#$%&!!"!!"#$!!""#$%&' ; P=> !"#$$%"#! !"
Validated Range:
5.52 < P < 9.65 MPa ; 135 < G < 1700 kg/m2s ; 0 < Δhsub < 230 kJ/kg
22
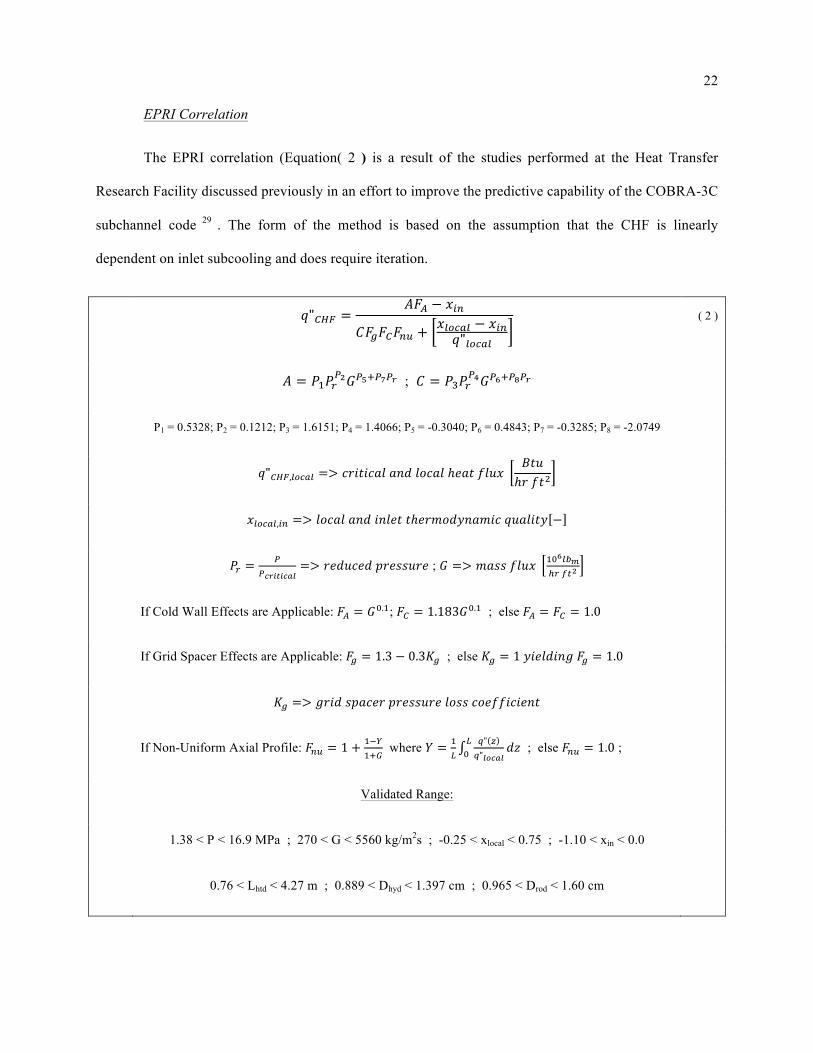
EPRI Correlation
The EPRI correlation (Equation( 2 ) is a result of the studies performed at the Heat Transfer
Research Facility discussed previously in an effort to improve the predictive capability of the COBRA-3C
subchannel code 29 . The form of the method is based on the assumption that the CHF is linearly
dependent on inlet subcooling and does require iteration.
!"!"# =!!! − !!"
!!!!!!!" + !!"#$! − !!"!"!"#$!
( 2 )
! = !!!!!!!!!!!!!! ! ; ! = !!!!!!!!!!!!!!
P1 = 0.5328; P2 = 0.1212; P3 = 1.6151; P4 = 1.4066; P5 = -0.3040; P6 = 0.4843; P7 = -0.3285; P8 = -2.0749
!"!"#,!"#$! => !"#$#!%&!!"#!!"#$!!ℎ!"#!!"#$! !"#ℎ!!!!!
!!"#$!,!" => !"#$!!!"#!!"#$%!!ℎ!"#$%&'(#)*!!"#$%&' −
!! = !!!"#$#!%&
=> !"#$%"#!!"#$$%"# ; ! => !"##!!"#$! !"!!!!!!!!!!
If Cold Wall Effects are Applicable: !! = !!.!; !! = 1.183!!.! ; else !! = !! = 1.0
If Grid Spacer Effects are Applicable: !! = 1.3 − 0.3!! ; else !! = 1 !"#$%"&' !! = 1.0
!! => !"#$!!"#$%&!!"#$$%"#!!"##!!"#$$%!%#&'
If Non-Uniform Axial Profile: !!" = 1 + !!!!!! where ! = !
!!" !!"!"#$!
!"!! ; else !!" = 1.0 ;
Validated Range:
1.38 < P < 16.9 MPa ; 270 < G < 5560 kg/m2s ; -0.25 < xlocal < 0.75 ; -1.10 < xin < 0.0
0.76 < Lhtd < 4.27 m ; 0.889 < Dhyd < 1.397 cm ; 0.965 < Drod < 1.60 cm
23
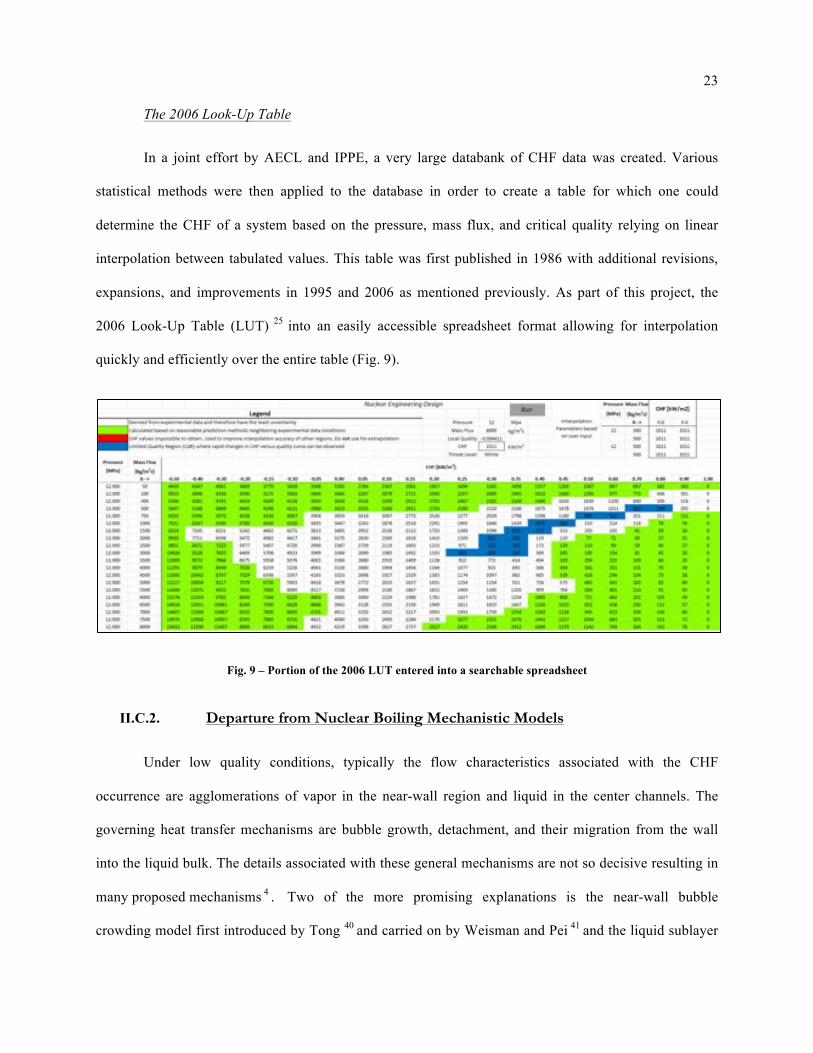
The 2006 Look-Up Table
In a joint effort by AECL and IPPE, a very large databank of CHF data was created. Various
statistical methods were then applied to the database in order to create a table for which one could
determine the CHF of a system based on the pressure, mass flux, and critical quality relying on linear
interpolation between tabulated values. This table was first published in 1986 with additional revisions,
expansions, and improvements in 1995 and 2006 as mentioned previously. As part of this project, the
2006 Look-Up Table (LUT) 25 into an easily accessible spreadsheet format allowing for interpolation
quickly and efficiently over the entire table (Fig. 9).
Fig. 9 – Portion of the 2006 LUT entered into a searchable spreadsheet
II.C.2. Departure from Nuclear Boiling Mechanistic Models
Under low quality conditions, typically the flow characteristics associated with the CHF
occurrence are agglomerations of vapor in the near-wall region and liquid in the center channels. The
governing heat transfer mechanisms are bubble growth, detachment, and their migration from the wall
into the liquid bulk. The details associated with these general mechanisms are not so decisive resulting in
many proposed mechanisms 4 . Two of the more promising explanations is the near-wall bubble
crowding model first introduced by Tong 40 and carried on by Weisman and Pei 41 and the liquid sublayer
24
dryout theory proposed by Lee and Mudawwar 42 and extended to low quality flows by Lin, Lee, and Pei
43 .
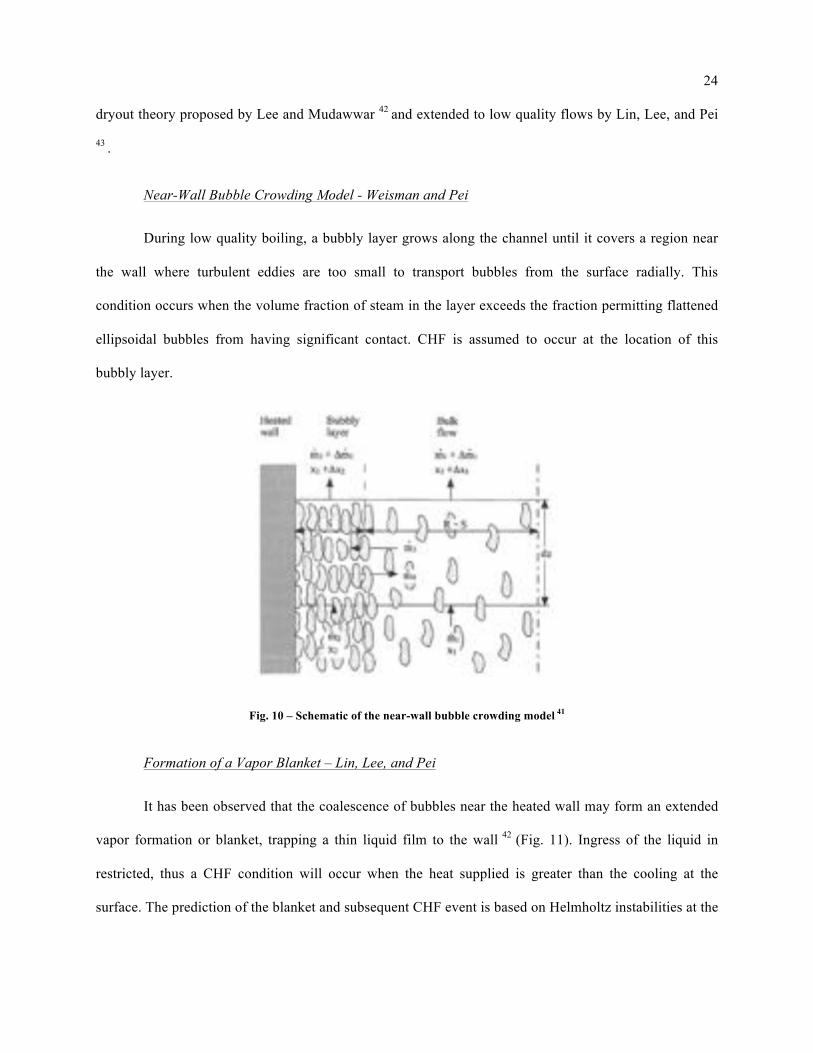
Near-Wall Bubble Crowding Model - Weisman and Pei
During low quality boiling, a bubbly layer grows along the channel until it covers a region near
the wall where turbulent eddies are too small to transport bubbles from the surface radially. This
condition occurs when the volume fraction of steam in the layer exceeds the fraction permitting flattened
ellipsoidal bubbles from having significant contact. CHF is assumed to occur at the location of this
bubbly layer.
Fig. 10 – Schematic of the near-wall bubble crowding model 41
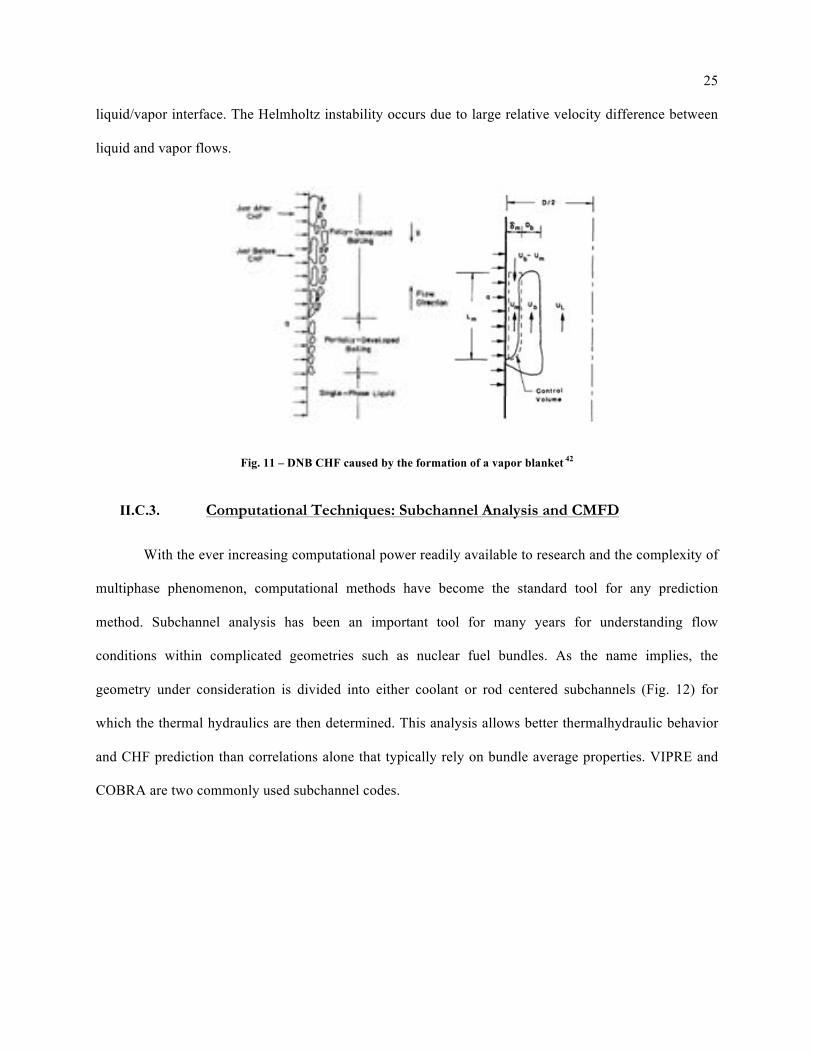
Formation of a Vapor Blanket – Lin, Lee, and Pei
It has been observed that the coalescence of bubbles near the heated wall may form an extended
vapor formation or blanket, trapping a thin liquid film to the wall 42 (Fig. 11). Ingress of the liquid in
restricted, thus a CHF condition will occur when the heat supplied is greater than the cooling at the
surface. The prediction of the blanket and subsequent CHF event is based on Helmholtz instabilities at the
25
liquid/vapor interface. The Helmholtz instability occurs due to large relative velocity difference between
liquid and vapor flows.
Fig. 11 – DNB CHF caused by the formation of a vapor blanket 42
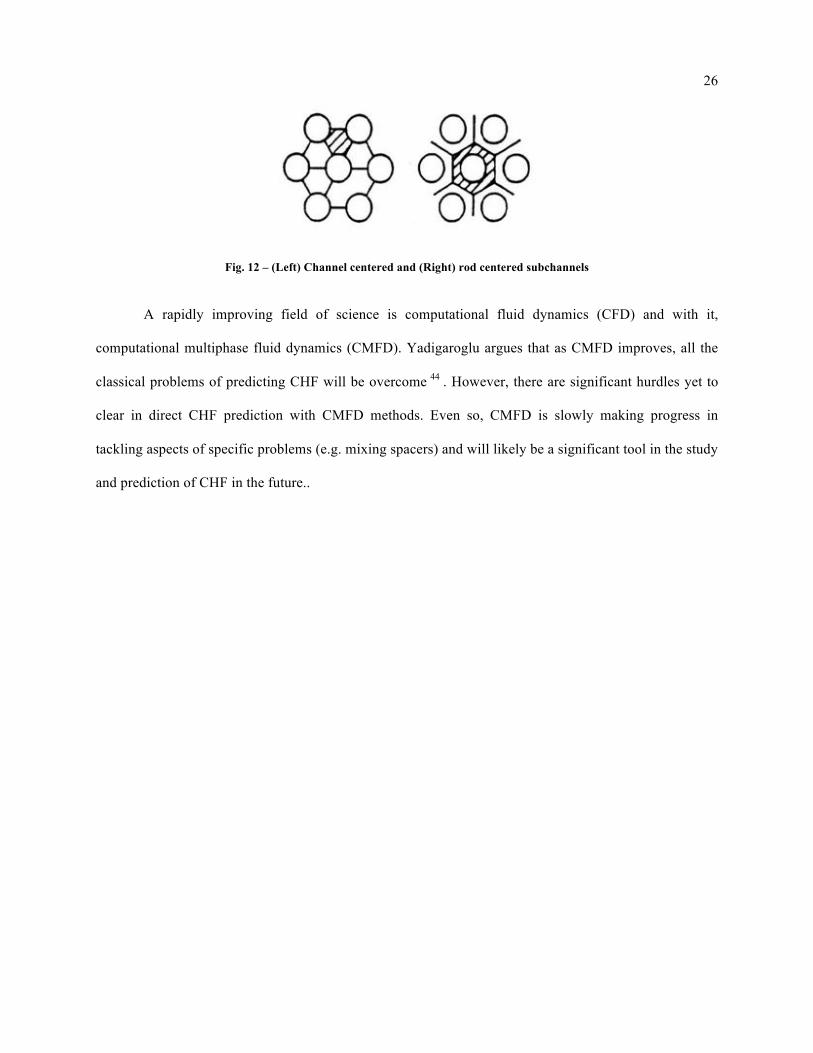
II.C.3. Computational Techniques: Subchannel Analysis and CMFD
With the ever increasing computational power readily available to research and the complexity of
multiphase phenomenon, computational methods have become the standard tool for any prediction
method. Subchannel analysis has been an important tool for many years for understanding flow
conditions within complicated geometries such as nuclear fuel bundles. As the name implies, the
geometry under consideration is divided into either coolant or rod centered subchannels (Fig. 12) for
which the thermal hydraulics are then determined. This analysis allows better thermalhydraulic behavior
and CHF prediction than correlations alone that typically rely on bundle average properties. VIPRE and
COBRA are two commonly used subchannel codes.
26
Fig. 12 – (Left) Channel centered and (Right) rod centered subchannels
A rapidly improving field of science is computational fluid dynamics (CFD) and with it,
computational multiphase fluid dynamics (CMFD). Yadigaroglu argues that as CMFD improves, all the
classical problems of predicting CHF will be overcome 44 . However, there are significant hurdles yet to
clear in direct CHF prediction with CMFD methods. Even so, CMFD is slowly making progress in
tackling aspects of specific problems (e.g. mixing spacers) and will likely be a significant tool in the study
and prediction of CHF in the future..
27
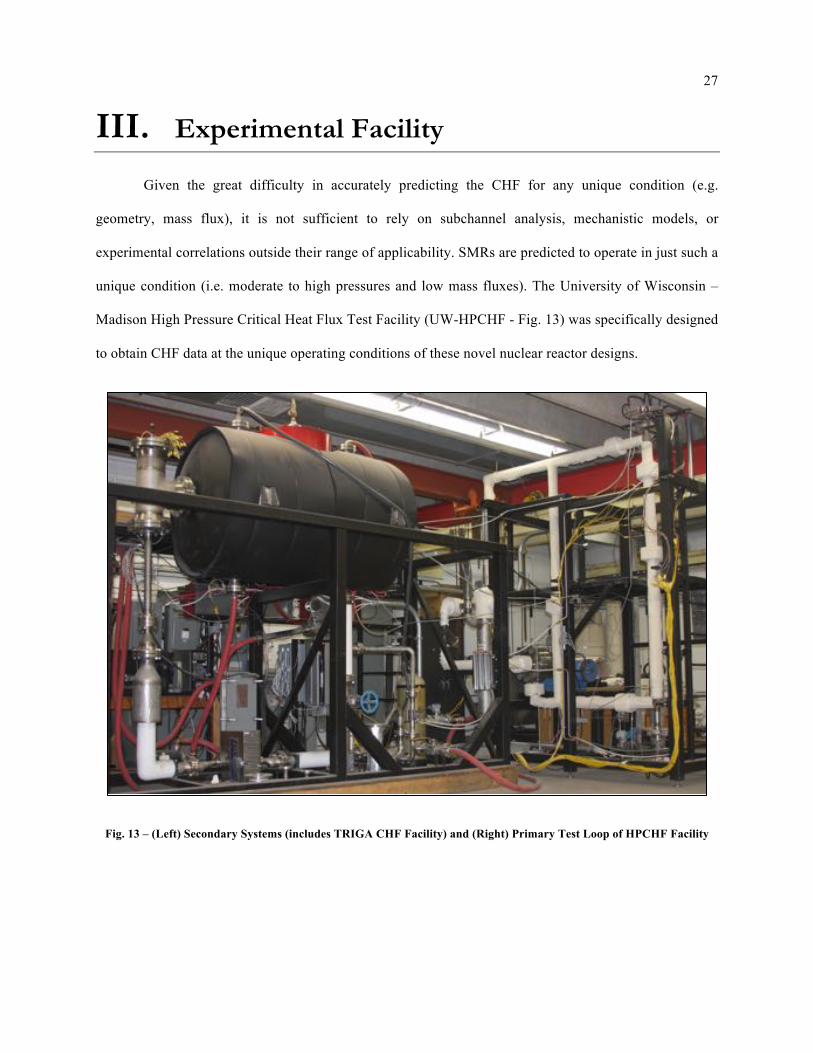
III. Experimental Facility
Given the great difficulty in accurately predicting the CHF for any unique condition (e.g.
geometry, mass flux), it is not sufficient to rely on subchannel analysis, mechanistic models, or
experimental correlations outside their range of applicability. SMRs are predicted to operate in just such a
unique condition (i.e. moderate to high pressures and low mass fluxes). The University of Wisconsin –
Madison High Pressure Critical Heat Flux Test Facility (UW-HPCHF - Fig. 13) was specifically designed
to obtain CHF data at the unique operating conditions of these novel nuclear reactor designs.
Fig. 13 – (Left) Secondary Systems (includes TRIGA CHF Facility) and (Right) Primary Test Loop of HPCHF Facility
28
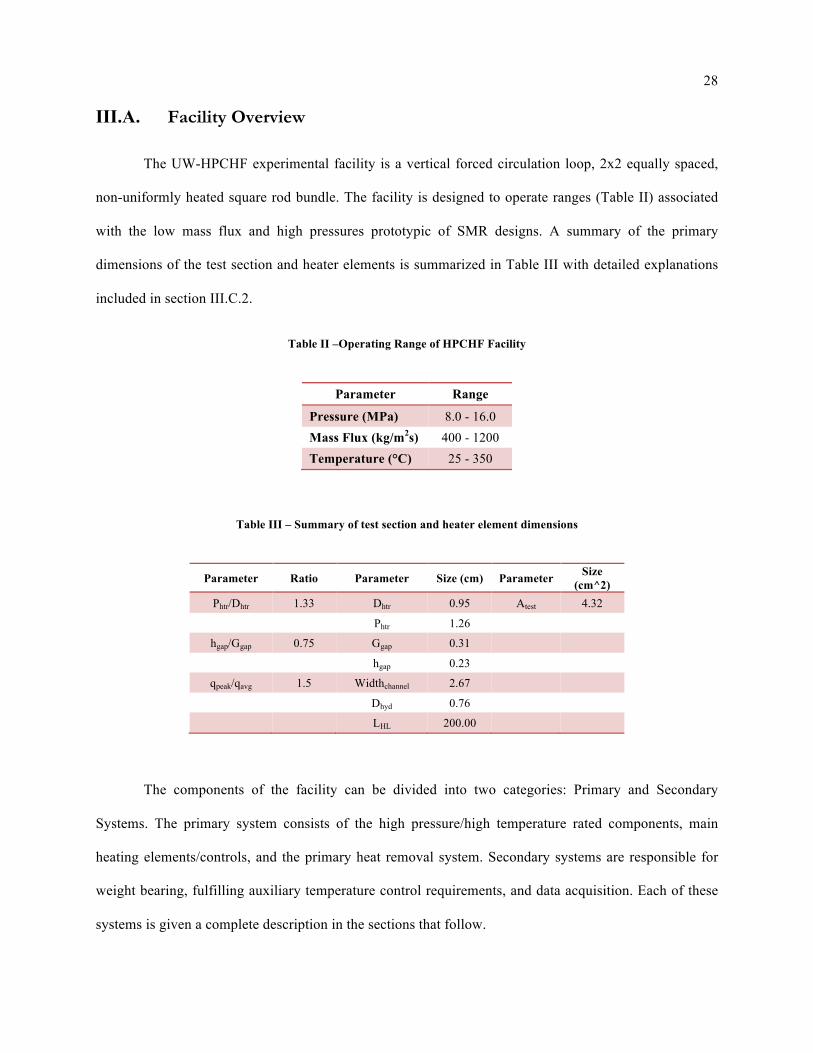
III.A. Facility Overview
The UW-HPCHF experimental facility is a vertical forced circulation loop, 2x2 equally spaced,
non-uniformly heated square rod bundle. The facility is designed to operate ranges (Table II) associated
with the low mass flux and high pressures prototypic of SMR designs. A summary of the primary
dimensions of the test section and heater elements is summarized in Table III with detailed explanations
included in section III.C.2.
Table II –Operating Range of HPCHF Facility
Parameter Range
Pressure (MPa) 8.0 - 16.0 Mass Flux (kg/m2s) 400 - 1200 Temperature (°C) 25 - 350
Table III – Summary of test section and heater element dimensions
Parameter Ratio Parameter Size (cm) Parameter Size (cm^2)
Phtr/Dhtr 1.33 Dhtr 0.95 Atest 4.32
Phtr 1.26 hgap/Ggap 0.75 Ggap 0.31
hgap 0.23 qpeak/qavg 1.5 Widthchannel 2.67
Dhyd 0.76
LHL 200.00
The components of the facility can be divided into two categories: Primary and Secondary
Systems. The primary system consists of the high pressure/high temperature rated components, main
heating elements/controls, and the primary heat removal system. Secondary systems are responsible for
weight bearing, fulfilling auxiliary temperature control requirements, and data acquisition. Each of these
systems is given a complete description in the sections that follow.
29
III.B. Design Guidelines and Goals
As mentioned in the introduction, the overall goal of the facility is to provide ‘validation data for
an updated critical heat flux model for use in thermal-hydraulic computer code’ and improve
‘understanding of the CHF process… in a rod bundle geometry’ for SMR designs. In achieving the
overall purpose of the facility, special considerations were given to the recording of key parameters (e.g.
temperatures, flow rates, pressures) and permitting a flexible design for future experimental investigations
(e.g. flow visualization, higher operating pressures/temperatures). These considerations are discussed in
each section as appropriate and served as general guidelines in the overall facility design.
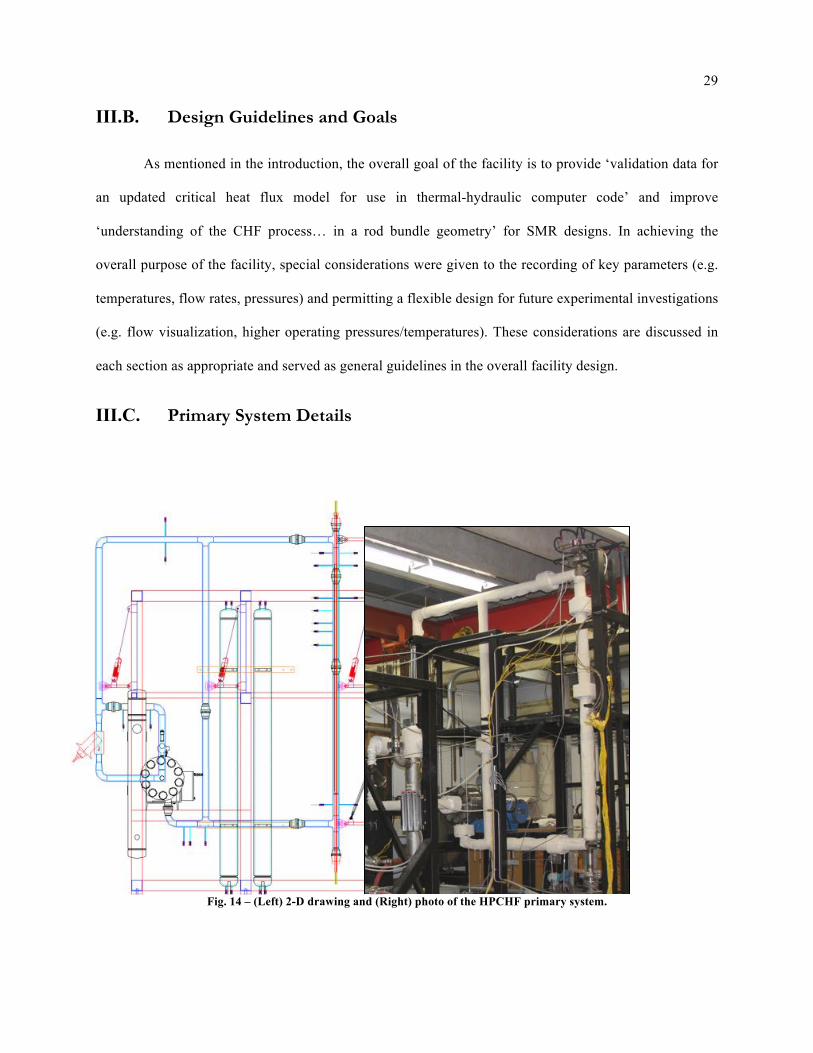
III.C. Primary System Details
Fig. 14 – (Left) 2-D drawing and (Right) photo of the HPCHF primary system.
30
III.C.1. Main Loop Details
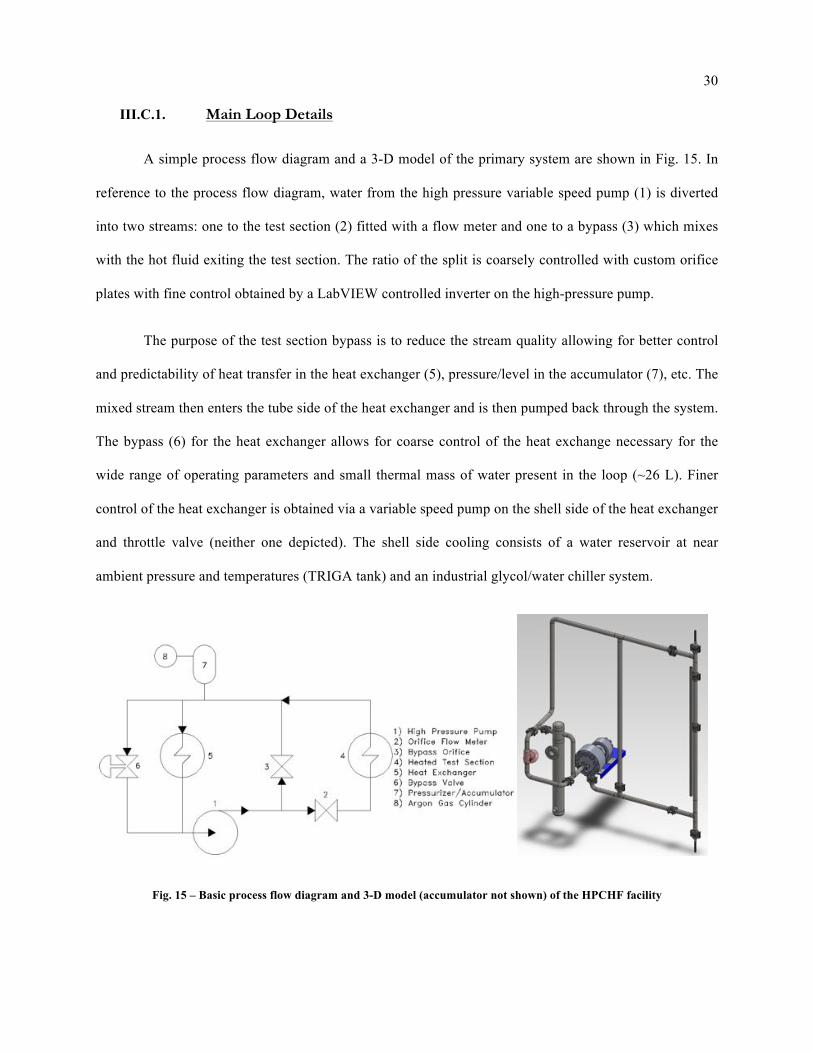
A simple process flow diagram and a 3-D model of the primary system are shown in Fig. 15. In
reference to the process flow diagram, water from the high pressure variable speed pump (1) is diverted
into two streams: one to the test section (2) fitted with a flow meter and one to a bypass (3) which mixes
with the hot fluid exiting the test section. The ratio of the split is coarsely controlled with custom orifice
plates with fine control obtained by a LabVIEW controlled inverter on the high-pressure pump.
The purpose of the test section bypass is to reduce the stream quality allowing for better control
and predictability of heat transfer in the heat exchanger (5), pressure/level in the accumulator (7), etc. The
mixed stream then enters the tube side of the heat exchanger and is then pumped back through the system.
The bypass (6) for the heat exchanger allows for coarse control of the heat exchange necessary for the
wide range of operating parameters and small thermal mass of water present in the loop (~26 L). Finer
control of the heat exchanger is obtained via a variable speed pump on the shell side of the heat exchanger
and throttle valve (neither one depicted). The shell side cooling consists of a water reservoir at near
ambient pressure and temperatures (TRIGA tank) and an industrial glycol/water chiller system.
Fig. 15 – Basic process flow diagram and 3-D model (accumulator not shown) of the HPCHF facility

31
Two pressurizers (7) are used to control the operating pressure, dampen pressure oscillations, and
serve as overflow reservoirs as the water is heated from ambient to test conditions. The volume of each
pressurizer is approximately 43.5 L. Pressurization of the loop is accomplished via a compressed cover
gas supplied by a ~41 MPa argon gas cylinder.
All primary process pressure piping and Grayloc fittings (2GR16) are SMLS 2 inch (5.08cm)
NPS SS316 SCH 160 unless otherwise noted. Employed ¼ inch (0.635 cm) tubing is SS316 but the
thickness varies and will be indicated in the appropriate section. All necessary design calculations prior to
construction (e.g. heat transfer and pressure drop calculations) were performed jointly with Matthew De
Angelis and are recorded in his Master’s Thesis 45 .
III.C.2. Test Section
The ‘Test Section’ as used in this document encompasses the vertical section of piping containing
the full length (heated and unheated) of the heating elements. In reference to Fig. 15, and reproduced in
Fig. 16, the test section starts at the ‘tee’ located at the bottom right of the 3-D model and continues to the
other ‘tee’ at the top right of the 3-D model. There is a removable portion of the section built into the test
section to provide flexibility for possible future experiments (e.g. viewing window) and contains all the
bulk thermocouples but otherwise does not currently affect any other features of the test section. The
entrance to the square channel is initiated by a square support plate welded to the inside of the piping,
creating the transition from the inlet plenum (Fig. 16). Each aspect of the test section is discussed in detail
below.
32
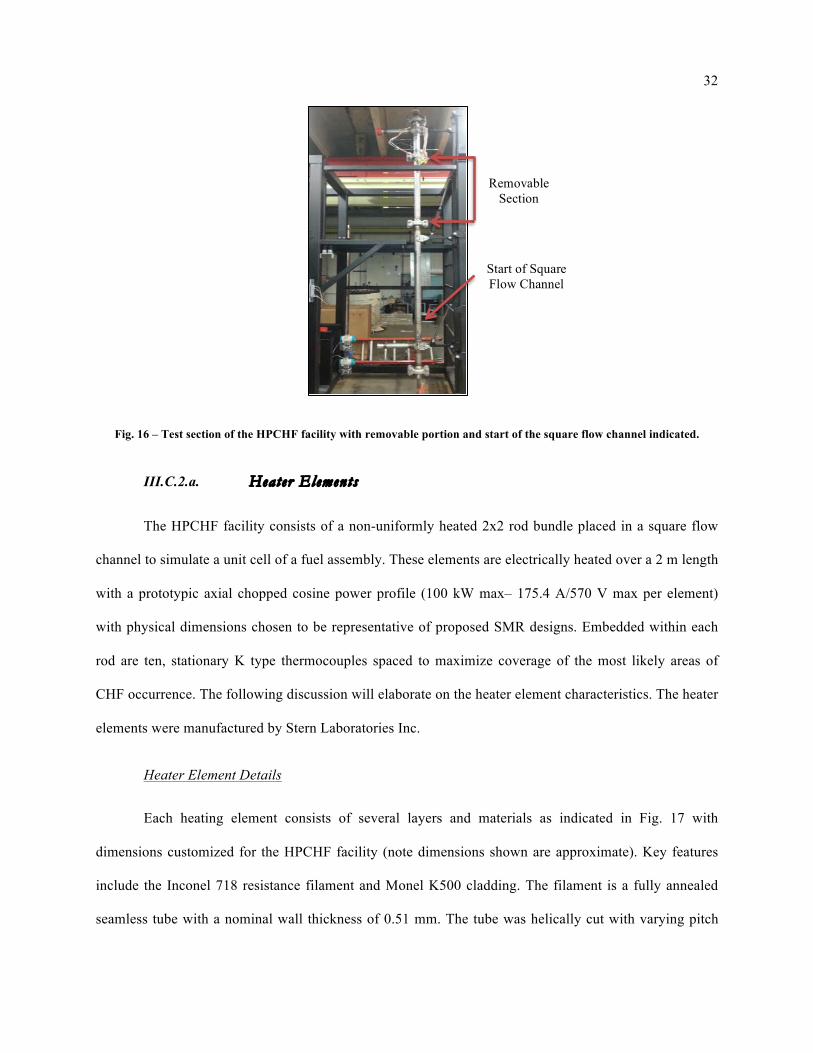
Fig. 16 – Test section of the HPCHF facility with removable portion and start of the square flow channel indicated.
III.C.2.a. Heater Elements
The HPCHF facility consists of a non-uniformly heated 2x2 rod bundle placed in a square flow
channel to simulate a unit cell of a fuel assembly. These elements are electrically heated over a 2 m length
with a prototypic axial chopped cosine power profile (100 kW max– 175.4 A/570 V max per element)
with physical dimensions chosen to be representative of proposed SMR designs. Embedded within each
rod are ten, stationary K type thermocouples spaced to maximize coverage of the most likely areas of
CHF occurrence. The following discussion will elaborate on the heater element characteristics. The heater
elements were manufactured by Stern Laboratories Inc.
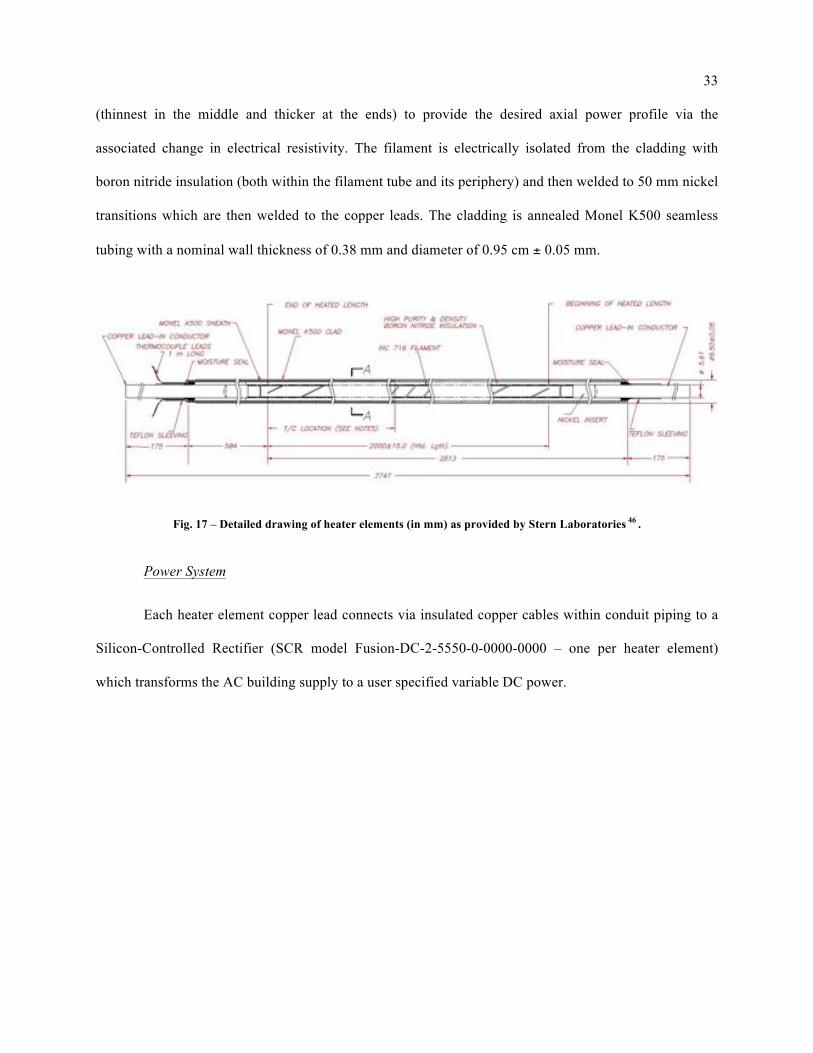
Heater Element Details
Each heating element consists of several layers and materials as indicated in Fig. 17 with
dimensions customized for the HPCHF facility (note dimensions shown are approximate). Key features
include the Inconel 718 resistance filament and Monel K500 cladding. The filament is a fully annealed
seamless tube with a nominal wall thickness of 0.51 mm. The tube was helically cut with varying pitch
Start of Square Flow Channel
Removable Section
33
(thinnest in the middle and thicker at the ends) to provide the desired axial power profile via the
associated change in electrical resistivity. The filament is electrically isolated from the cladding with
boron nitride insulation (both within the filament tube and its periphery) and then welded to 50 mm nickel
transitions which are then welded to the copper leads. The cladding is annealed Monel K500 seamless
tubing with a nominal wall thickness of 0.38 mm and diameter of 0.95 cm ± 0.05 mm.
Fig. 17 – Detailed drawing of heater elements (in mm) as provided by Stern Laboratories 46 .
Power System
Each heater element copper lead connects via insulated copper cables within conduit piping to a
Silicon-Controlled Rectifier (SCR model Fusion-DC-2-5550-0-0000-0000 – one per heater element)
which transforms the AC building supply to a user specified variable DC power.
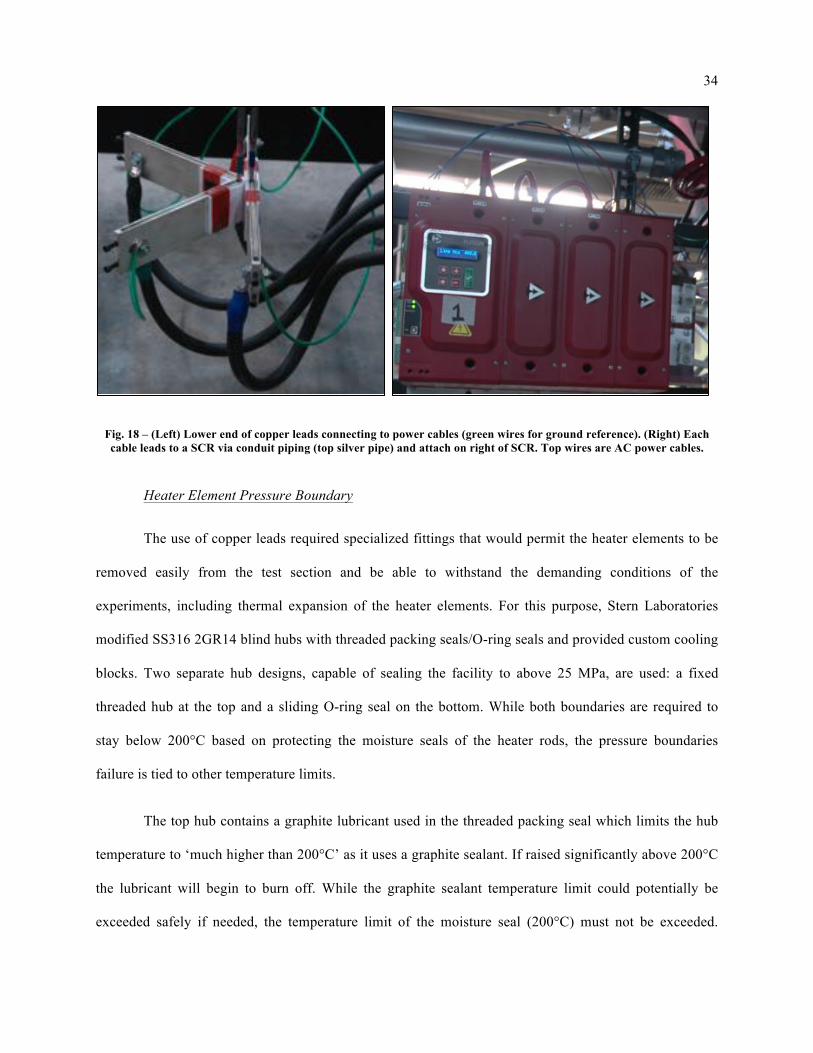
34
Fig. 18 – (Left) Lower end of copper leads connecting to power cables (green wires for ground reference). (Right) Each cable leads to a SCR via conduit piping (top silver pipe) and attach on right of SCR. Top wires are AC power cables.
Heater Element Pressure Boundary
The use of copper leads required specialized fittings that would permit the heater elements to be
removed easily from the test section and be able to withstand the demanding conditions of the
experiments, including thermal expansion of the heater elements. For this purpose, Stern Laboratories
modified SS316 2GR14 blind hubs with threaded packing seals/O-ring seals and provided custom cooling
blocks. Two separate hub designs, capable of sealing the facility to above 25 MPa, are used: a fixed
threaded hub at the top and a sliding O-ring seal on the bottom. While both boundaries are required to
stay below 200°C based on protecting the moisture seals of the heater rods, the pressure boundaries
failure is tied to other temperature limits.
The top hub contains a graphite lubricant used in the threaded packing seal which limits the hub
temperature to ‘much higher than 200°C’ as it uses a graphite sealant. If raised significantly above 200°C
the lubricant will begin to burn off. While the graphite sealant temperature limit could potentially be
exceeded safely if needed, the temperature limit of the moisture seal (200°C) must not be exceeded.
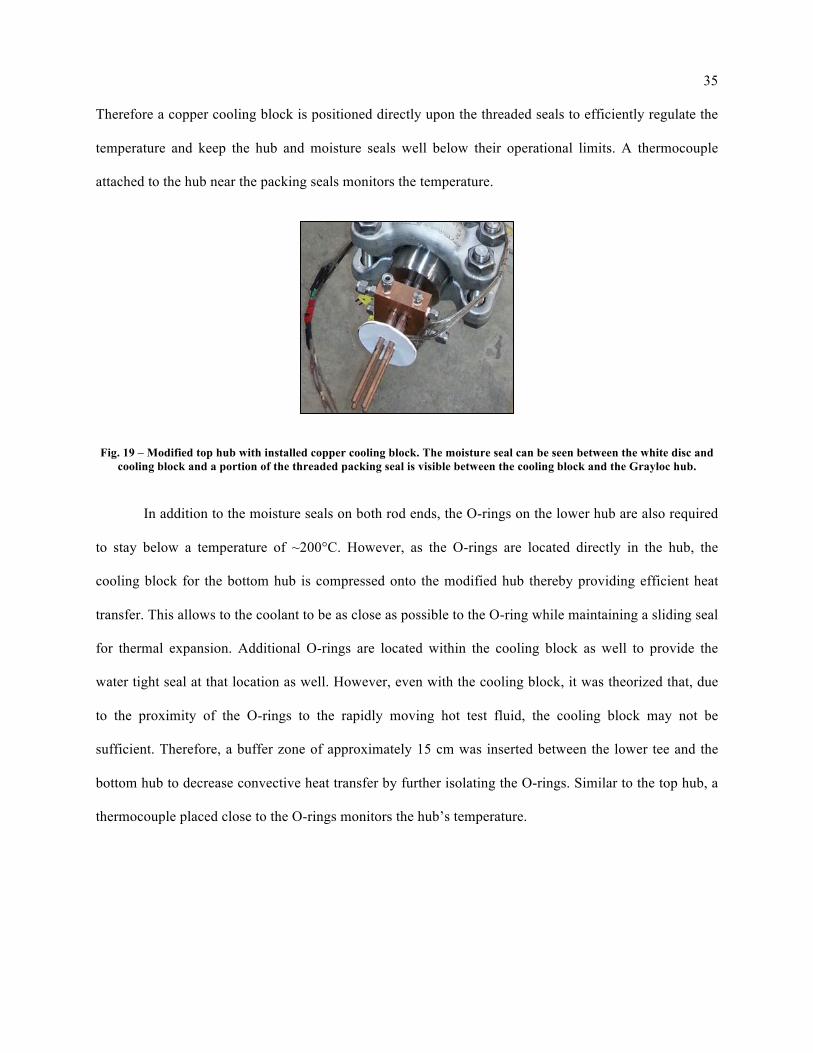
35
Therefore a copper cooling block is positioned directly upon the threaded seals to efficiently regulate the
temperature and keep the hub and moisture seals well below their operational limits. A thermocouple
attached to the hub near the packing seals monitors the temperature.
Fig. 19 – Modified top hub with installed copper cooling block. The moisture seal can be seen between the white disc and cooling block and a portion of the threaded packing seal is visible between the cooling block and the Grayloc hub.
In addition to the moisture seals on both rod ends, the O-rings on the lower hub are also required
to stay below a temperature of ~200°C. However, as the O-rings are located directly in the hub, the
cooling block for the bottom hub is compressed onto the modified hub thereby providing efficient heat
transfer. This allows to the coolant to be as close as possible to the O-ring while maintaining a sliding seal
for thermal expansion. Additional O-rings are located within the cooling block as well to provide the
water tight seal at that location as well. However, even with the cooling block, it was theorized that, due
to the proximity of the O-rings to the rapidly moving hot test fluid, the cooling block may not be
sufficient. Therefore, a buffer zone of approximately 15 cm was inserted between the lower tee and the
bottom hub to decrease convective heat transfer by further isolating the O-rings. Similar to the top hub, a
thermocouple placed close to the O-rings monitors the hub’s temperature.
36
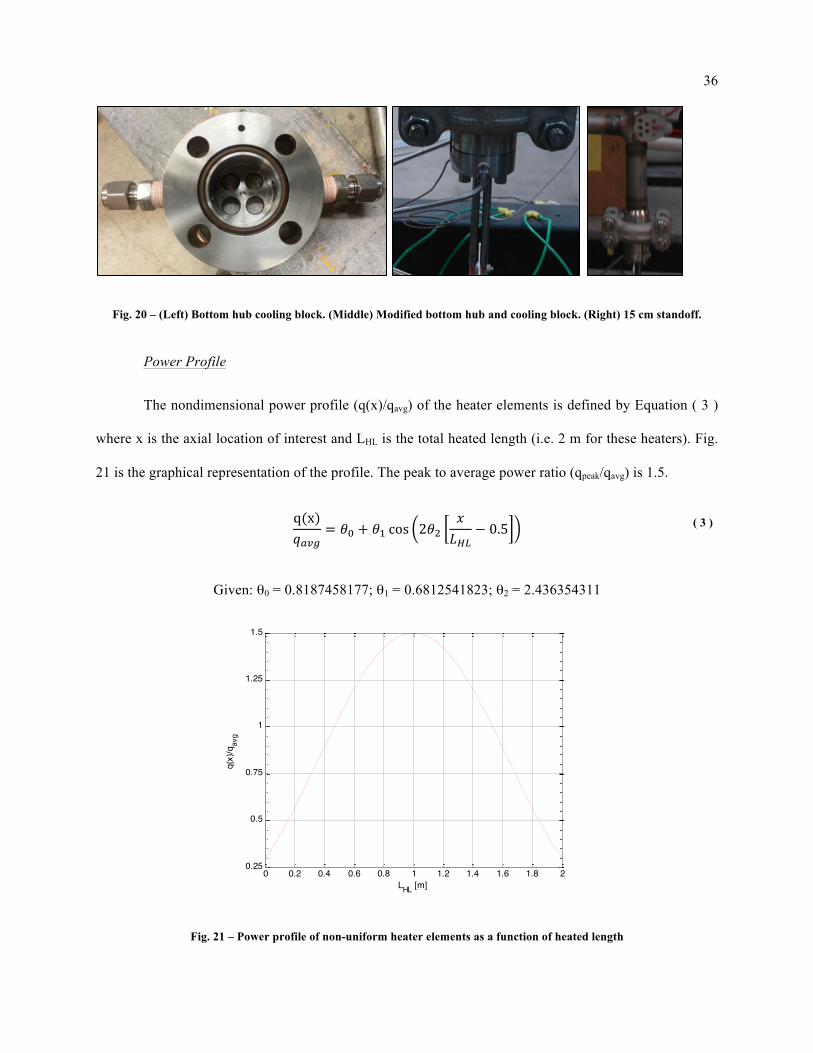
Fig. 20 – (Left) Bottom hub cooling block. (Middle) Modified bottom hub and cooling block. (Right) 15 cm standoff.
Power Profile
The nondimensional power profile (q(x)/qavg) of the heater elements is defined by Equation ( 3 )
where x is the axial location of interest and LHL is the total heated length (i.e. 2 m for these heaters). Fig.
21 is the graphical representation of the profile. The peak to average power ratio (qpeak/qavg) is 1.5.
q(x)!!"#
= !! + !! cos 2!!!!!"
− 0.5 ( 3 )
Given: θ0 = 0.8187458177; θ1 = 0.6812541823; θ2 = 2.436354311
Fig. 21 – Power profile of non-uniform heater elements as a function of heated length
0 0.2 0.4 0.6 0.8 1 1.2 1.4 1.6 1.8 20.25
0.5
0.75
1
1.25
1.5
LHL [m]
q(x)
/qav
g

37
Thermocouples for CHF Detection
Within each heating element are ten ANSI Type K, ungrounded thermocouples (TC) embedded in
grooves cut into the Monel sheath 46 . The thermocouples are placed at various axial and circumferential
locations (Table IV) to maximize the coverage of the regions of the flow channel in which CHF is most
likely to occur while avoiding direct coverage by grid spacers. Based on maximizing coverage of
potential CHF locations, two different heater element ‘types’ (Type 1 and 2) with different thermocouple
circumferential orientations, but otherwise identical (i.e. power profile, axial thermocouple location, etc.),
were constructed.
Table IV – Thermocouple axial location from beginning of the heated length and circumferential location (0° is TC #9 for Type 1 and TC #3 for Type 2 from the orientations shown in Fig. 22) of the two types of heater elements
Type
1 H
eate
r El
emen
t
Thermocouple # 1 2 3 4 5 6 7 8 9 10 Distance from
Beginning of HL (cm)
96.2 103.8 133.4 133.4 146.2 146.2 153.8 177.8 177.8 197.5
Circumferential Location (°) 90° 30° 120° 225° 150° 270° 60° 180° 0° 315°
Type
2 H
eate
r El
emen
t
Thermocouple # 1 2 3 4 5 6 7 8 9 10 Distance from
Beginning of HL (cm)
96.2! 103.8! 133.4! 146.2! 133.4! 146.2! 153.8! 177.8! 177.8! 197.5!
Circumferential Location (°) 300°! 45°! 0°! 90°! 180°! 270°! 210°! 330°! 135°! 240°!
Additional views of the axial and circumferential thermocouple locations are shown in Fig. 22
and Fig. 23. Note that any given thermocouple number can be referenced between the two figures and the
power profile to understand where exactly in the channel the thermocouple is located. Any reference to a
heater and thermocouple number in this paper will be referenced to the locations specified by these two
figures.
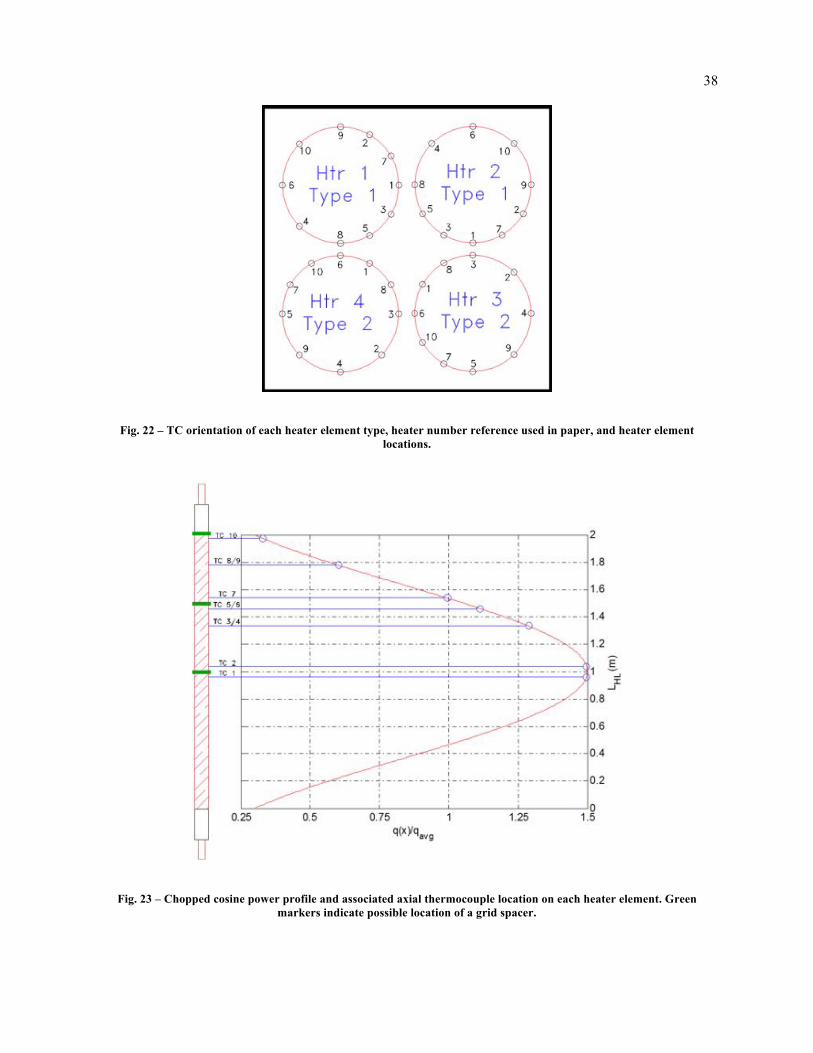
38
Fig. 22 – TC orientation of each heater element type, heater number reference used in paper, and heater element locations.
Fig. 23 – Chopped cosine power profile and associated axial thermocouple location on each heater element. Green markers indicate possible location of a grid spacer.

39
The number of embedded thermocouples was limited to ten along with a minimum
circumferential spacing of 30° due to rod fabrication considerations. It is noted that sliding TCs have been
shown to be better options to accurately detect the initial CHF location but this was not an available
option.
III.C.2.b. Inle t Plenum
Before entering the heated portion of the test section, the flow turns 90° from a horizontal to a
vertical flow and passes through a ‘plenum’. The purpose of the plenum is to stabilize the flow so upon
entering the square channel the flow is evenly distributed in order to avoid any biased flow effects on the
CHF. Determination of the inner diameter and length of the plenum necessary to accomplish this goal
required the use of a computational fluid dynamics package (CFD). In this study ANSYS FLUENT was
used for all CFD applications. Convergence was determined based on the agreement between solutions
and arrival an asymptotic limit for the residuals between various iteration lengths. Additionally, the
coarseness of the mesh was varied to further validate the solutions.
Plenum Type
Fig. 24 is a visual representation of the evaluation of four plenum candidates with the transition to
the square channel indicated. The color shift from dark blue to red indicates increasing fluid velocity.
Initially two different plenums were evaluated: a straight section of pipe (A) and a 12.2 cm inner diameter
(ID) plenum directly connected to the tee joint (B). The behavior of the flow preferentially passing on the
far side of the inlet in the large plenum led to an expansion to two more plenum options: a 12.2 cm ID
plenum (C) and an 8.5 cm ID plenum (D) each with a 7.62 cm straight section to suppress the flow
behavior noted. As shown, the larger the plenum, the more static the flow behavior. Also, the straight
section improves the behavior by impeding reducing the momentum of the fluid as it races through the
tee. A smaller plenum appears to approach the solution of the straight section as would be expected. As
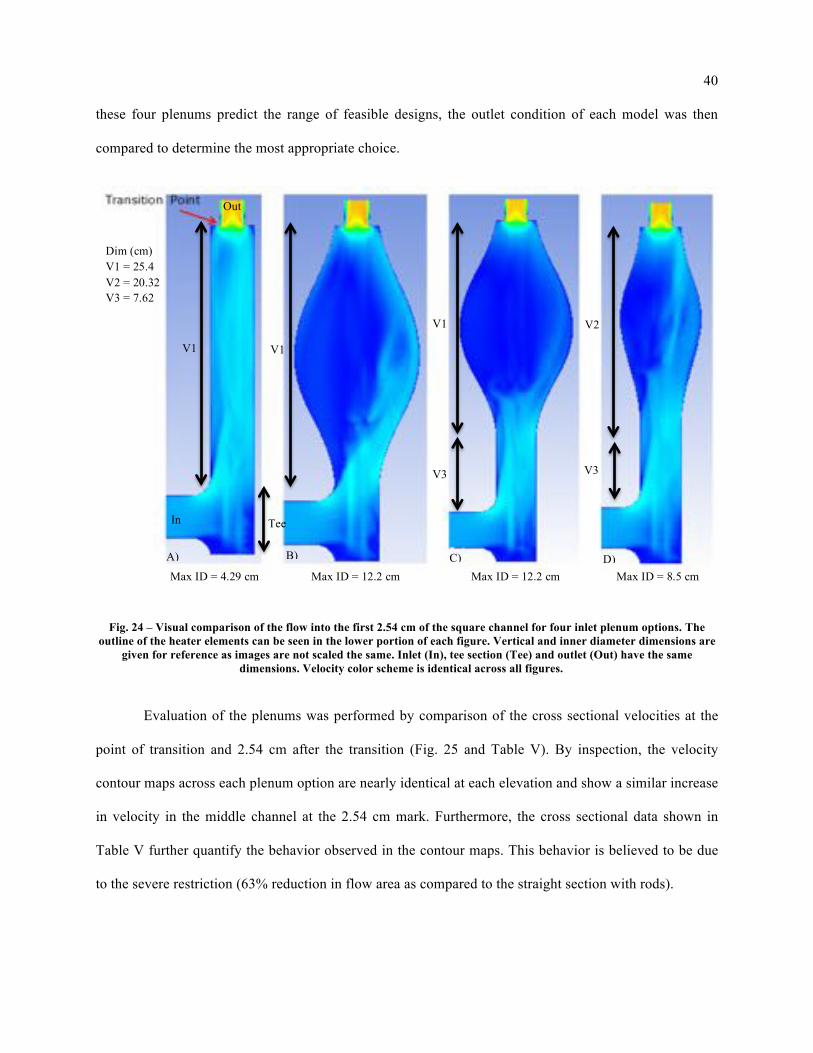
40
these four plenums predict the range of feasible designs, the outlet condition of each model was then
compared to determine the most appropriate choice.
Fig. 24 – Visual comparison of the flow into the first 2.54 cm of the square channel for four inlet plenum options. The outline of the heater elements can be seen in the lower portion of each figure. Vertical and inner diameter dimensions are
given for reference as images are not scaled the same. Inlet (In), tee section (Tee) and outlet (Out) have the same dimensions. Velocity color scheme is identical across all figures.
Evaluation of the plenums was performed by comparison of the cross sectional velocities at the
point of transition and 2.54 cm after the transition (Fig. 25 and Table V). By inspection, the velocity
contour maps across each plenum option are nearly identical at each elevation and show a similar increase
in velocity in the middle channel at the 2.54 cm mark. Furthermore, the cross sectional data shown in
Table V further quantify the behavior observed in the contour maps. This behavior is believed to be due
to the severe restriction (63% reduction in flow area as compared to the straight section with rods).
Max ID = 12.2 cm Max ID = 4.29 cm Max ID = 8.5 cm Max ID = 12.2 cm
Dim (cm) V1 = 25.4 V2 = 20.32 V3 = 7.62
Out
Tee
V1
In
V1 V1
V3
V2
A) B) C) D)
V3
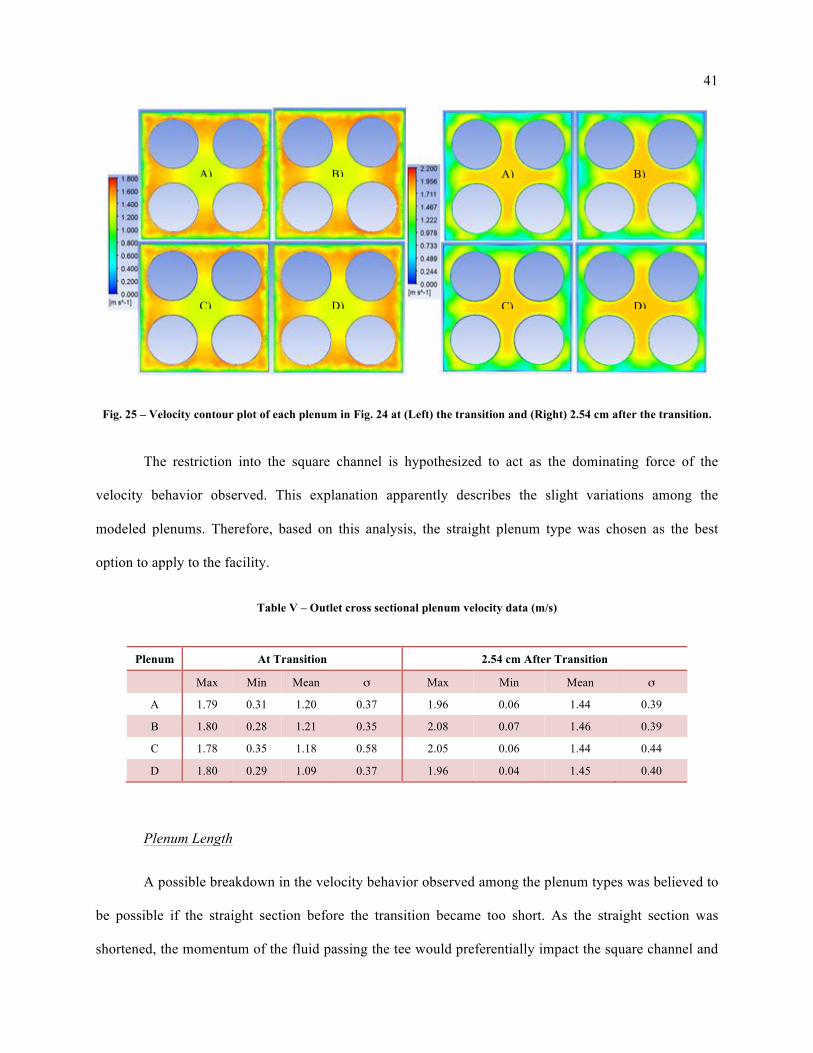
41
Fig. 25 – Velocity contour plot of each plenum in Fig. 24 at (Left) the transition and (Right) 2.54 cm after the transition.
The restriction into the square channel is hypothesized to act as the dominating force of the
velocity behavior observed. This explanation apparently describes the slight variations among the
modeled plenums. Therefore, based on this analysis, the straight plenum type was chosen as the best
option to apply to the facility.
Table V – Outlet cross sectional plenum velocity data (m/s)
Plenum At Transition 2.54 cm After Transition
Max Min Mean σ Max Min Mean σ
A 1.79 0.31 1.20 0.37 1.96 0.06 1.44 0.39
B 1.80 0.28 1.21 0.35 2.08 0.07 1.46 0.39
C 1.78 0.35 1.18 0.58 2.05 0.06 1.44 0.44
D 1.80 0.29 1.09 0.37 1.96 0.04 1.45 0.40
Plenum Length
A possible breakdown in the velocity behavior observed among the plenum types was believed to
be possible if the straight section before the transition became too short. As the straight section was
shortened, the momentum of the fluid passing the tee would preferentially impact the square channel and
A) B)
C) D)
A) B)
C) D)
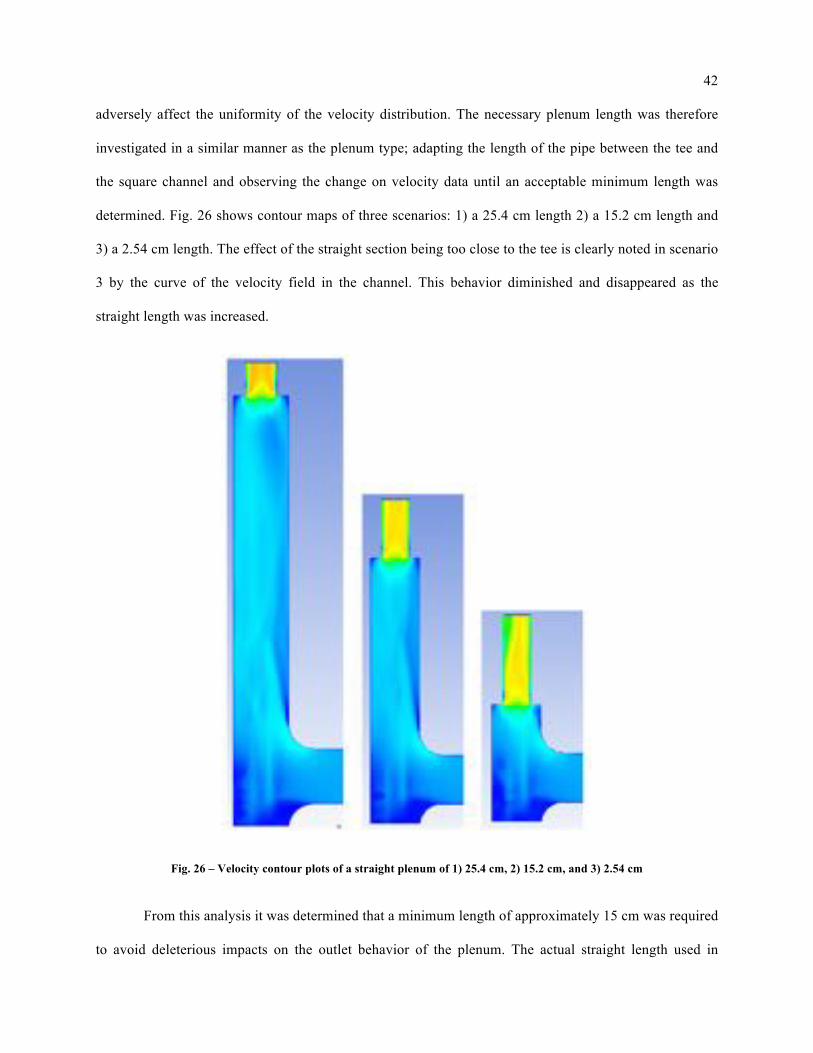
42
adversely affect the uniformity of the velocity distribution. The necessary plenum length was therefore
investigated in a similar manner as the plenum type; adapting the length of the pipe between the tee and
the square channel and observing the change on velocity data until an acceptable minimum length was
determined. Fig. 26 shows contour maps of three scenarios: 1) a 25.4 cm length 2) a 15.2 cm length and
3) a 2.54 cm length. The effect of the straight section being too close to the tee is clearly noted in scenario
3 by the curve of the velocity field in the channel. This behavior diminished and disappeared as the
straight length was increased.
Fig. 26 – Velocity contour plots of a straight plenum of 1) 25.4 cm, 2) 15.2 cm, and 3) 2.54 cm
From this analysis it was determined that a minimum length of approximately 15 cm was required
to avoid deleterious impacts on the outlet behavior of the plenum. The actual straight length used in
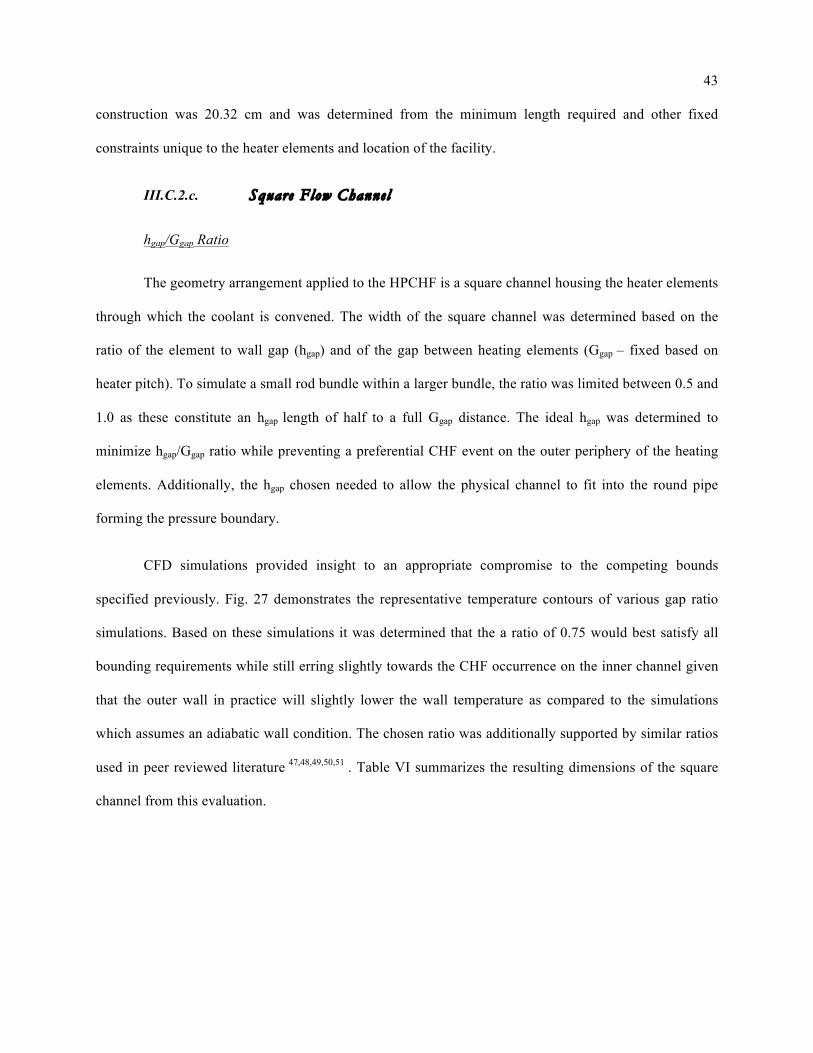
43
construction was 20.32 cm and was determined from the minimum length required and other fixed
constraints unique to the heater elements and location of the facility.
III.C.2.c. Square Flow Channel
hgap/Ggap Ratio
The geometry arrangement applied to the HPCHF is a square channel housing the heater elements
through which the coolant is convened. The width of the square channel was determined based on the
ratio of the element to wall gap (hgap) and of the gap between heating elements (Ggap – fixed based on
heater pitch). To simulate a small rod bundle within a larger bundle, the ratio was limited between 0.5 and
1.0 as these constitute an hgap length of half to a full Ggap distance. The ideal hgap was determined to
minimize hgap/Ggap ratio while preventing a preferential CHF event on the outer periphery of the heating
elements. Additionally, the hgap chosen needed to allow the physical channel to fit into the round pipe
forming the pressure boundary.
CFD simulations provided insight to an appropriate compromise to the competing bounds
specified previously. Fig. 27 demonstrates the representative temperature contours of various gap ratio
simulations. Based on these simulations it was determined that the a ratio of 0.75 would best satisfy all
bounding requirements while still erring slightly towards the CHF occurrence on the inner channel given
that the outer wall in practice will slightly lower the wall temperature as compared to the simulations
which assumes an adiabatic wall condition. The chosen ratio was additionally supported by similar ratios
used in peer reviewed literature 47,48,49,50,51 . Table VI summarizes the resulting dimensions of the square
channel from this evaluation.
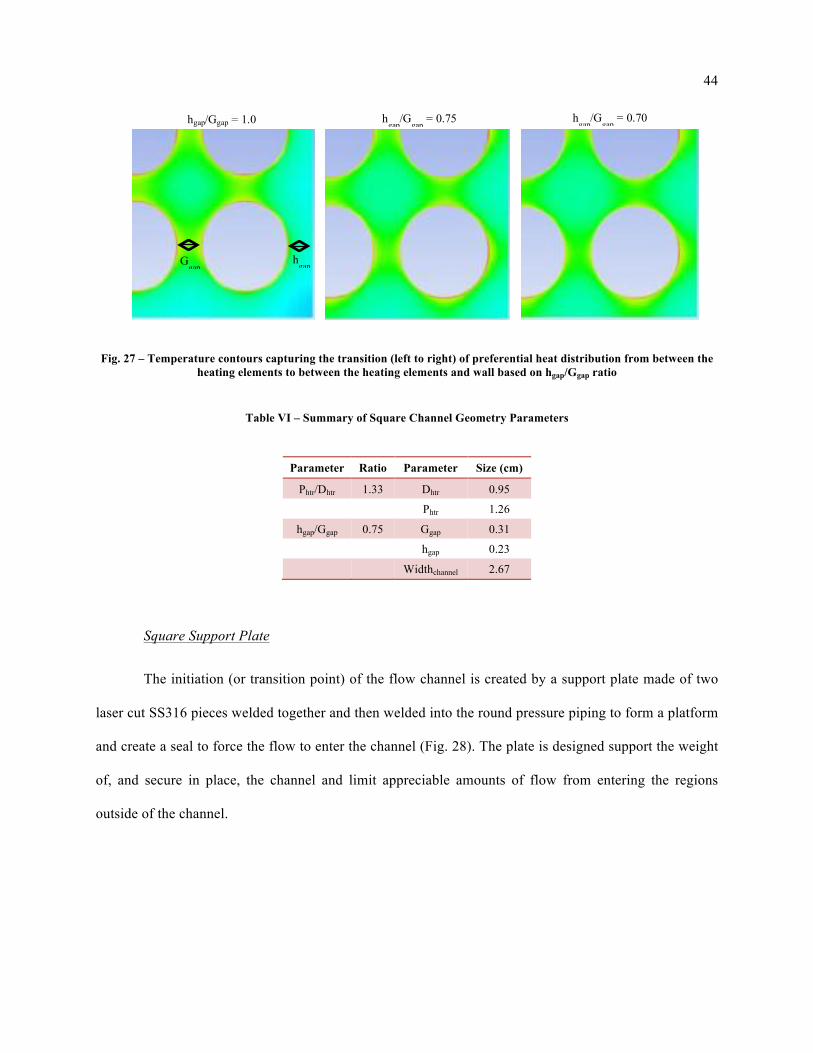
44
Fig. 27 – Temperature contours capturing the transition (left to right) of preferential heat distribution from between the heating elements to between the heating elements and wall based on hgap/Ggap ratio
Table VI – Summary of Square Channel Geometry Parameters
Parameter Ratio Parameter! Size (cm)
Phtr/Dhtr 1.33 Dhtr 0.95
! !Phtr 1.26
hgap/Ggap 0.75 Ggap 0.31
! !hgap 0.23
! !Widthchannel 2.67
Square Support Plate
The initiation (or transition point) of the flow channel is created by a support plate made of two
laser cut SS316 pieces welded together and then welded into the round pressure piping to form a platform
and create a seal to force the flow to enter the channel (Fig. 28). The plate is designed support the weight
of, and secure in place, the channel and limit appreciable amounts of flow from entering the regions
outside of the channel.
hgap/Ggap = 1.0 hgap
/Ggap
= 0.75 hgap
/Ggap
= 0.70
hgap
Ggap
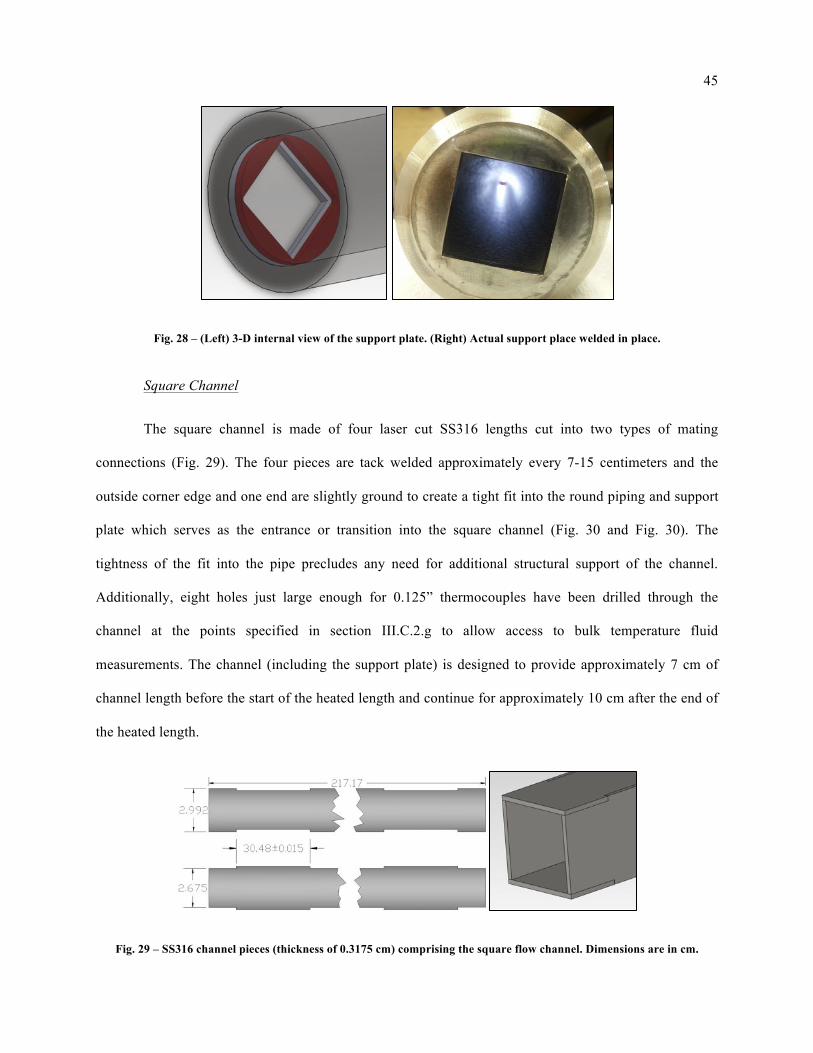
45
Fig. 28 – (Left) 3-D internal view of the support plate. (Right) Actual support place welded in place.
Square Channel
The square channel is made of four laser cut SS316 lengths cut into two types of mating
connections (Fig. 29). The four pieces are tack welded approximately every 7-15 centimeters and the
outside corner edge and one end are slightly ground to create a tight fit into the round piping and support
plate which serves as the entrance or transition into the square channel (Fig. 30 and Fig. 30). The
tightness of the fit into the pipe precludes any need for additional structural support of the channel.
Additionally, eight holes just large enough for 0.125” thermocouples have been drilled through the
channel at the points specified in section III.C.2.g to allow access to bulk temperature fluid
measurements. The channel (including the support plate) is designed to provide approximately 7 cm of
channel length before the start of the heated length and continue for approximately 10 cm after the end of
the heated length.
Fig. 29 – SS316 channel pieces (thickness of 0.3175 cm) comprising the square flow channel. Dimensions are in cm.
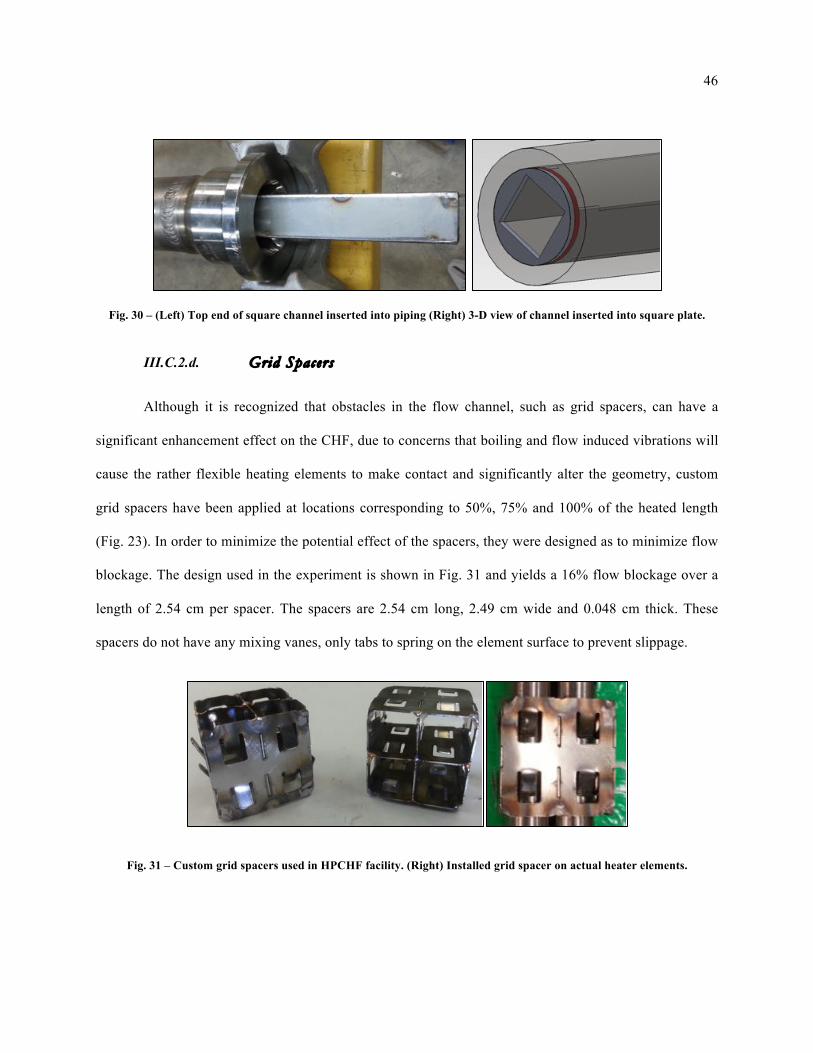
46
Fig. 30 – (Left) Top end of square channel inserted into piping (Right) 3-D view of channel inserted into square plate.
III.C.2.d. Grid Spacers
Although it is recognized that obstacles in the flow channel, such as grid spacers, can have a
significant enhancement effect on the CHF, due to concerns that boiling and flow induced vibrations will
cause the rather flexible heating elements to make contact and significantly alter the geometry, custom
grid spacers have been applied at locations corresponding to 50%, 75% and 100% of the heated length
(Fig. 23). In order to minimize the potential effect of the spacers, they were designed as to minimize flow
blockage. The design used in the experiment is shown in Fig. 31 and yields a 16% flow blockage over a
length of 2.54 cm per spacer. The spacers are 2.54 cm long, 2.49 cm wide and 0.048 cm thick. These
spacers do not have any mixing vanes, only tabs to spring on the element surface to prevent slippage.
Fig. 31 – Custom grid spacers used in HPCHF facility. (Right) Installed grid spacer on actual heater elements.
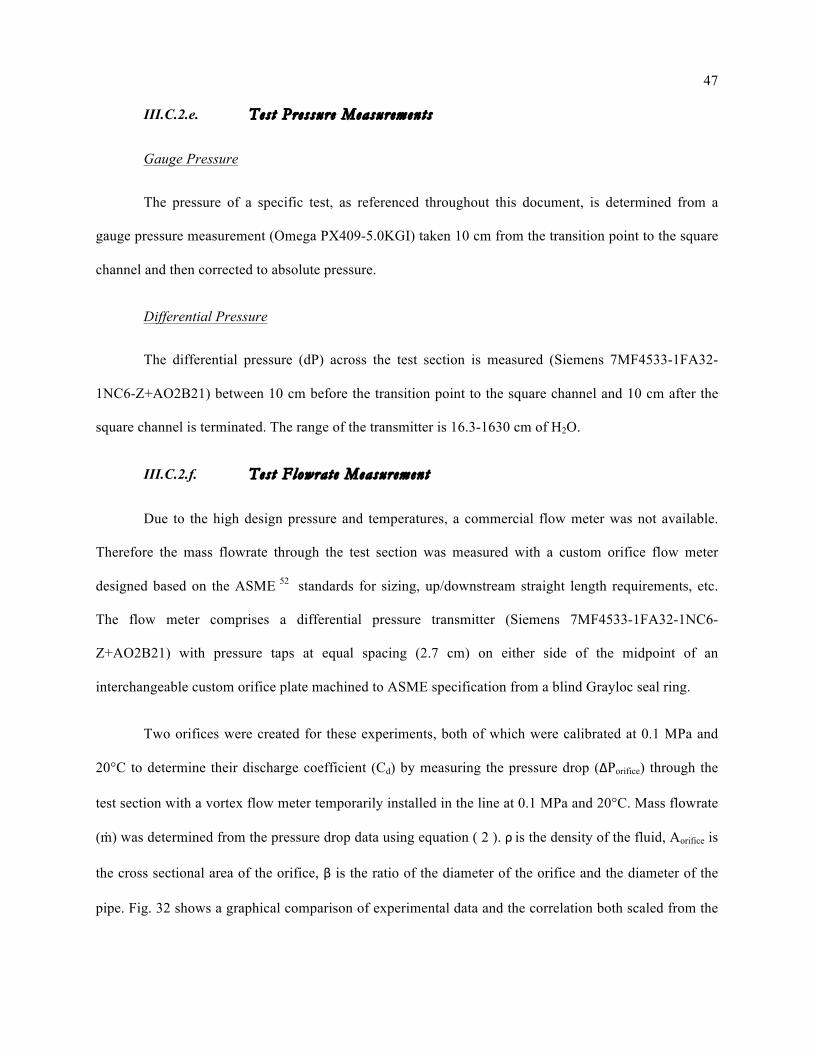
47
III.C.2.e. Test Pressure Measurements
Gauge Pressure
The pressure of a specific test, as referenced throughout this document, is determined from a
gauge pressure measurement (Omega PX409-5.0KGI) taken 10 cm from the transition point to the square
channel and then corrected to absolute pressure.
Differential Pressure
The differential pressure (dP) across the test section is measured (Siemens 7MF4533-1FA32-
1NC6-Z+AO2B21) between 10 cm before the transition point to the square channel and 10 cm after the
square channel is terminated. The range of the transmitter is 16.3-1630 cm of H2O.
III.C.2.f. Test Flowrate Measurement
Due to the high design pressure and temperatures, a commercial flow meter was not available.
Therefore the mass flowrate through the test section was measured with a custom orifice flow meter
designed based on the ASME 52 standards for sizing, up/downstream straight length requirements, etc.
The flow meter comprises a differential pressure transmitter (Siemens 7MF4533-1FA32-1NC6-
Z+AO2B21) with pressure taps at equal spacing (2.7 cm) on either side of the midpoint of an
interchangeable custom orifice plate machined to ASME specification from a blind Grayloc seal ring.
Two orifices were created for these experiments, both of which were calibrated at 0.1 MPa and
20°C to determine their discharge coefficient (Cd) by measuring the pressure drop (ΔPorifice) through the
test section with a vortex flow meter temporarily installed in the line at 0.1 MPa and 20°C. Mass flowrate
(ṁ) was determined from the pressure drop data using equation ( 2 ). ρ is the density of the fluid, Aorifice is
the cross sectional area of the orifice, β is the ratio of the diameter of the orifice and the diameter of the
pipe. Fig. 32 shows a graphical comparison of experimental data and the correlation both scaled from the
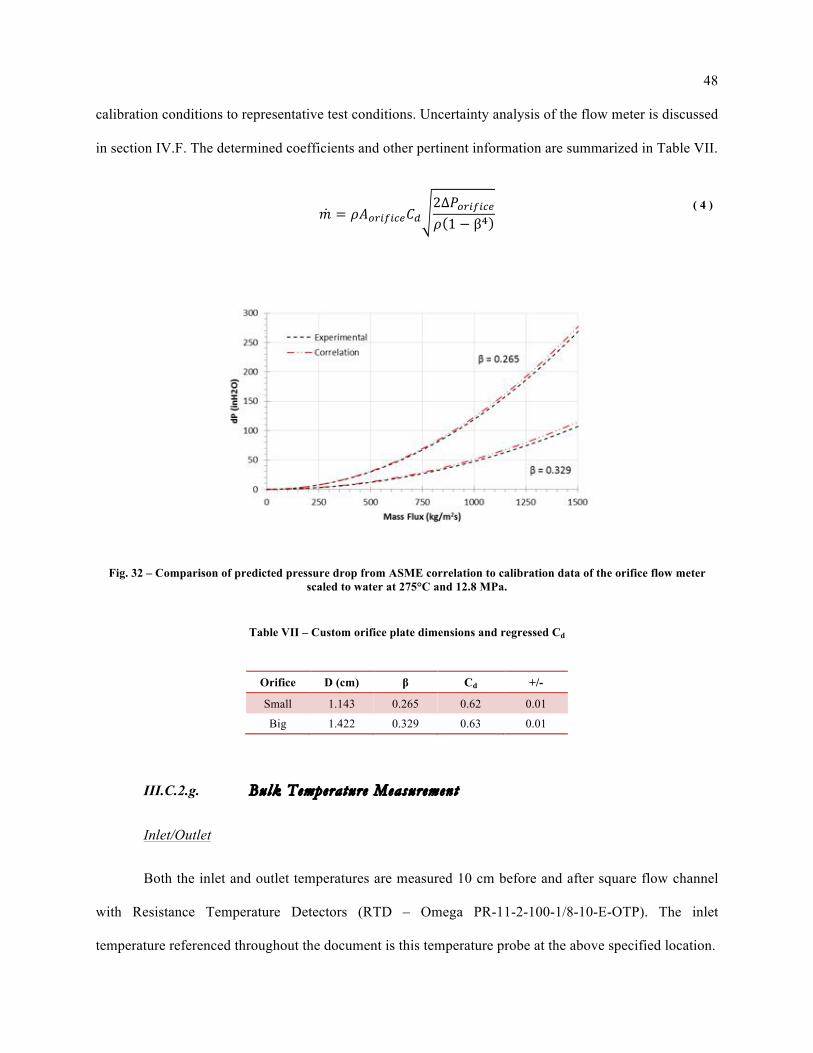
48
calibration conditions to representative test conditions. Uncertainty analysis of the flow meter is discussed
in section IV.F. The determined coefficients and other pertinent information are summarized in Table VII.
! = !!!"#$#%&!!2Δ!!"#$#%&! 1 − β!
( 4 )
Fig. 32 – Comparison of predicted pressure drop from ASME correlation to calibration data of the orifice flow meter scaled to water at 275°C and 12.8 MPa.
Table VII – Custom orifice plate dimensions and regressed Cd
Orifice D (cm) β Cd +/-
Small 1.143 0.265 0.62 0.01
Big 1.422 0.329 0.63 0.01
III.C.2.g. Bulk Temperature Measurement
Inlet/Outlet
Both the inlet and outlet temperatures are measured 10 cm before and after square flow channel
with Resistance Temperature Detectors (RTD – Omega PR-11-2-100-1/8-10-E-OTP). The inlet
temperature referenced throughout the document is this temperature probe at the above specified location.
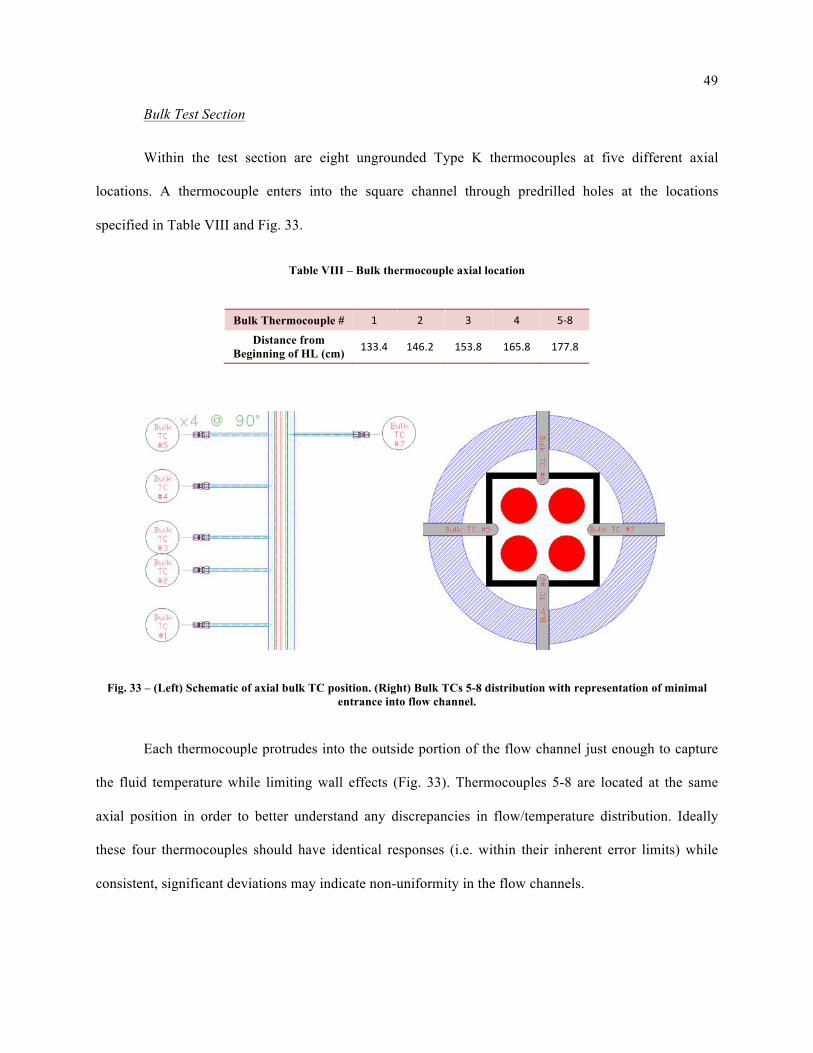
49
Bulk Test Section
Within the test section are eight ungrounded Type K thermocouples at five different axial
locations. A thermocouple enters into the square channel through predrilled holes at the locations
specified in Table VIII and Fig. 33.
Table VIII – Bulk thermocouple axial location
Bulk Thermocouple # 1! 2! 3! 4! 518!
Distance from Beginning of HL (cm) 133.4! 146.2! 153.8! 165.8! 177.8!
Fig. 33 – (Left) Schematic of axial bulk TC position. (Right) Bulk TCs 5-8 distribution with representation of minimal entrance into flow channel.
Each thermocouple protrudes into the outside portion of the flow channel just enough to capture
the fluid temperature while limiting wall effects (Fig. 33). Thermocouples 5-8 are located at the same
axial position in order to better understand any discrepancies in flow/temperature distribution. Ideally
these four thermocouples should have identical responses (i.e. within their inherent error limits) while
consistent, significant deviations may indicate non-uniformity in the flow channels.
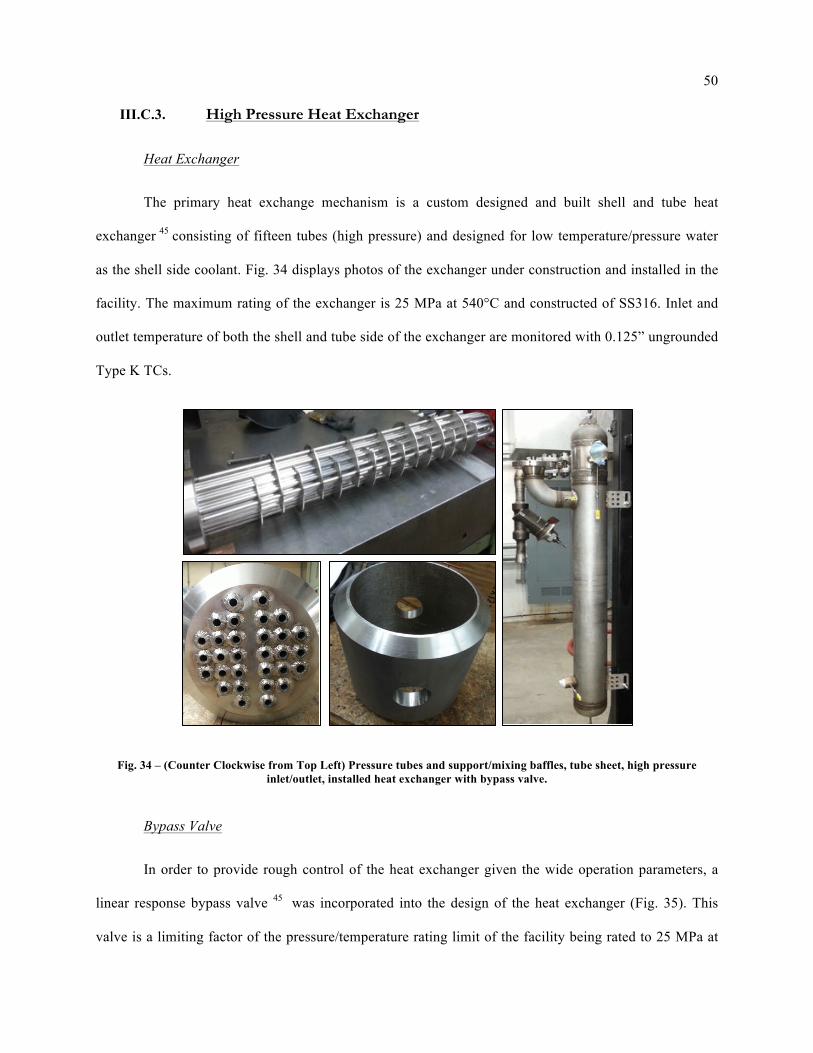
50
III.C.3. High Pressure Heat Exchanger
Heat Exchanger
The primary heat exchange mechanism is a custom designed and built shell and tube heat
exchanger 45 consisting of fifteen tubes (high pressure) and designed for low temperature/pressure water
as the shell side coolant. Fig. 34 displays photos of the exchanger under construction and installed in the
facility. The maximum rating of the exchanger is 25 MPa at 540°C and constructed of SS316. Inlet and
outlet temperature of both the shell and tube side of the exchanger are monitored with 0.125” ungrounded
Type K TCs.
Fig. 34 – (Counter Clockwise from Top Left) Pressure tubes and support/mixing baffles, tube sheet, high pressure inlet/outlet, installed heat exchanger with bypass valve.
Bypass Valve
In order to provide rough control of the heat exchanger given the wide operation parameters, a
linear response bypass valve 45 was incorporated into the design of the heat exchanger (Fig. 35). This
valve is a limiting factor of the pressure/temperature rating limit of the facility being rated to 25 MPa at
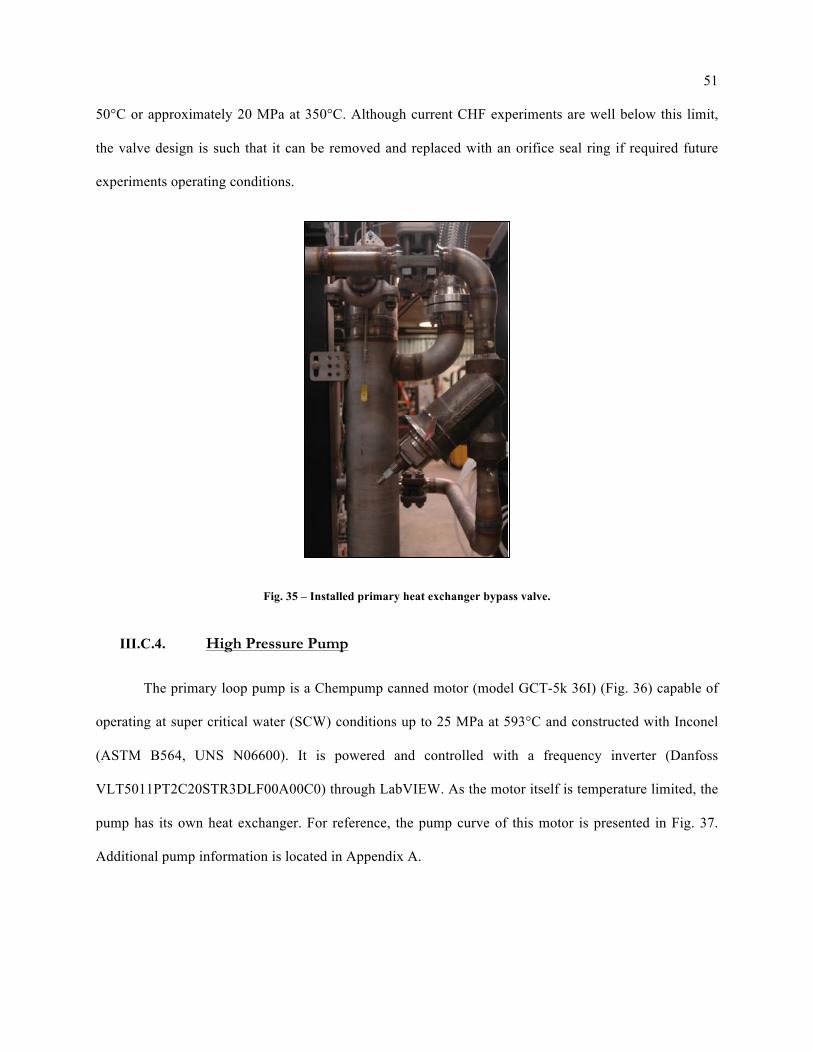
51
50°C or approximately 20 MPa at 350°C. Although current CHF experiments are well below this limit,
the valve design is such that it can be removed and replaced with an orifice seal ring if required future
experiments operating conditions.
Fig. 35 – Installed primary heat exchanger bypass valve.
III.C.4. High Pressure Pump
The primary loop pump is a Chempump canned motor (model GCT-5k 36I) (Fig. 36) capable of
operating at super critical water (SCW) conditions up to 25 MPa at 593°C and constructed with Inconel
(ASTM B564, UNS N06600). It is powered and controlled with a frequency inverter (Danfoss
VLT5011PT2C20STR3DLF00A00C0) through LabVIEW. As the motor itself is temperature limited, the
pump has its own heat exchanger. For reference, the pump curve of this motor is presented in Fig. 37.
Additional pump information is located in Appendix A.
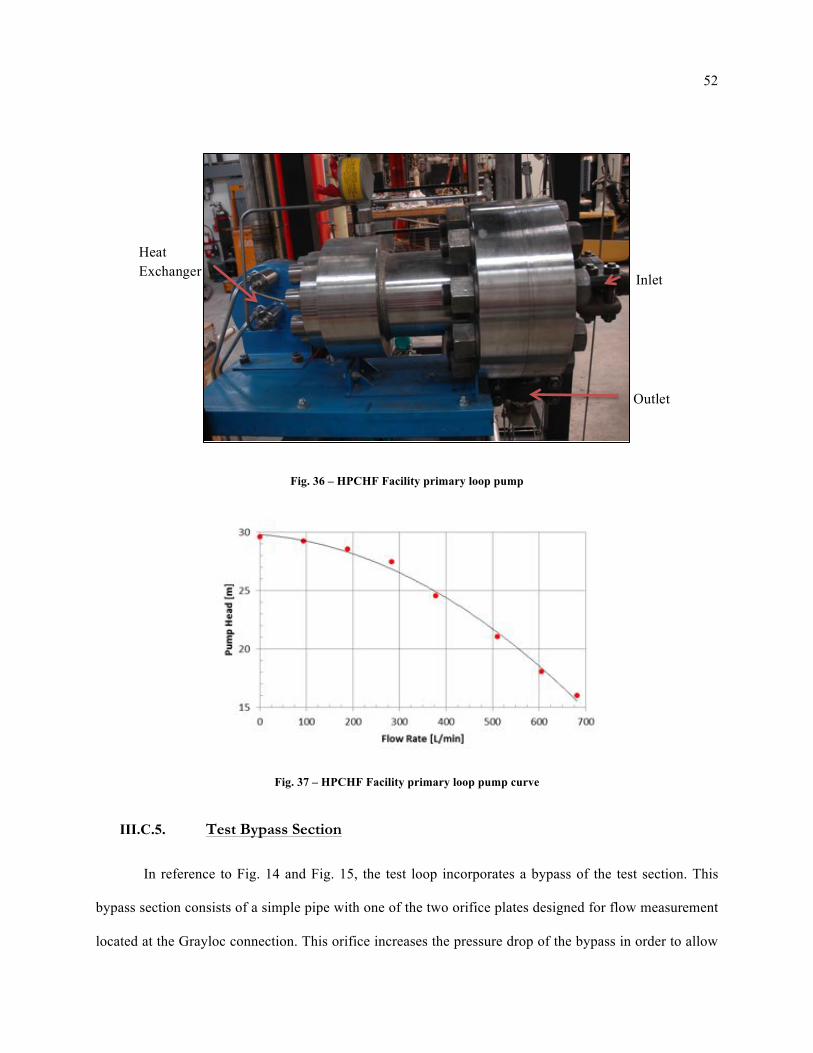
52
Fig. 36 – HPCHF Facility primary loop pump
Fig. 37 – HPCHF Facility primary loop pump curve
III.C.5. Test Bypass Section
In reference to Fig. 14 and Fig. 15, the test loop incorporates a bypass of the test section. This
bypass section consists of a simple pipe with one of the two orifice plates designed for flow measurement
located at the Grayloc connection. This orifice increases the pressure drop of the bypass in order to allow
Inlet
Outlet
Heat Exchanger
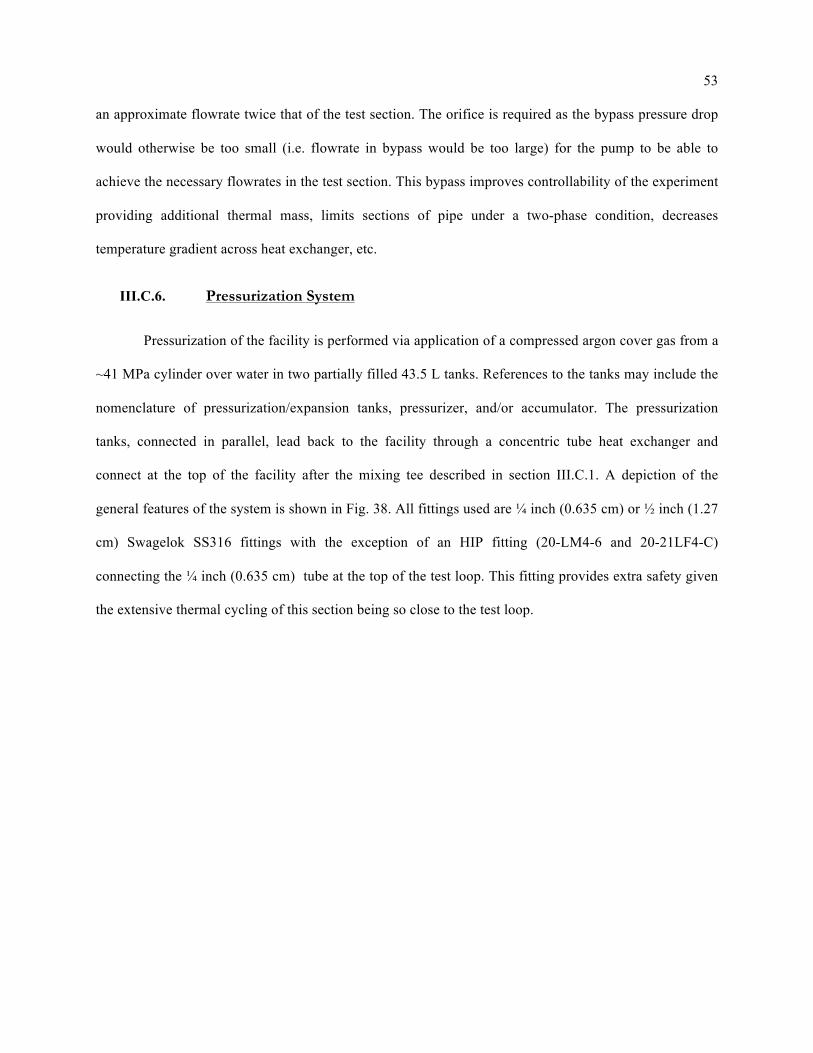
53
an approximate flowrate twice that of the test section. The orifice is required as the bypass pressure drop
would otherwise be too small (i.e. flowrate in bypass would be too large) for the pump to be able to
achieve the necessary flowrates in the test section. This bypass improves controllability of the experiment
providing additional thermal mass, limits sections of pipe under a two-phase condition, decreases
temperature gradient across heat exchanger, etc.
III.C.6. Pressurization System
Pressurization of the facility is performed via application of a compressed argon cover gas from a
~41 MPa cylinder over water in two partially filled 43.5 L tanks. References to the tanks may include the
nomenclature of pressurization/expansion tanks, pressurizer, and/or accumulator. The pressurization
tanks, connected in parallel, lead back to the facility through a concentric tube heat exchanger and
connect at the top of the facility after the mixing tee described in section III.C.1. A depiction of the
general features of the system is shown in Fig. 38. All fittings used are ¼ inch (0.635 cm) or ½ inch (1.27
cm) Swagelok SS316 fittings with the exception of an HIP fitting (20-LM4-6 and 20-21LF4-C)
connecting the ¼ inch (0.635 cm) tube at the top of the test loop. This fitting provides extra safety given
the extensive thermal cycling of this section being so close to the test loop.
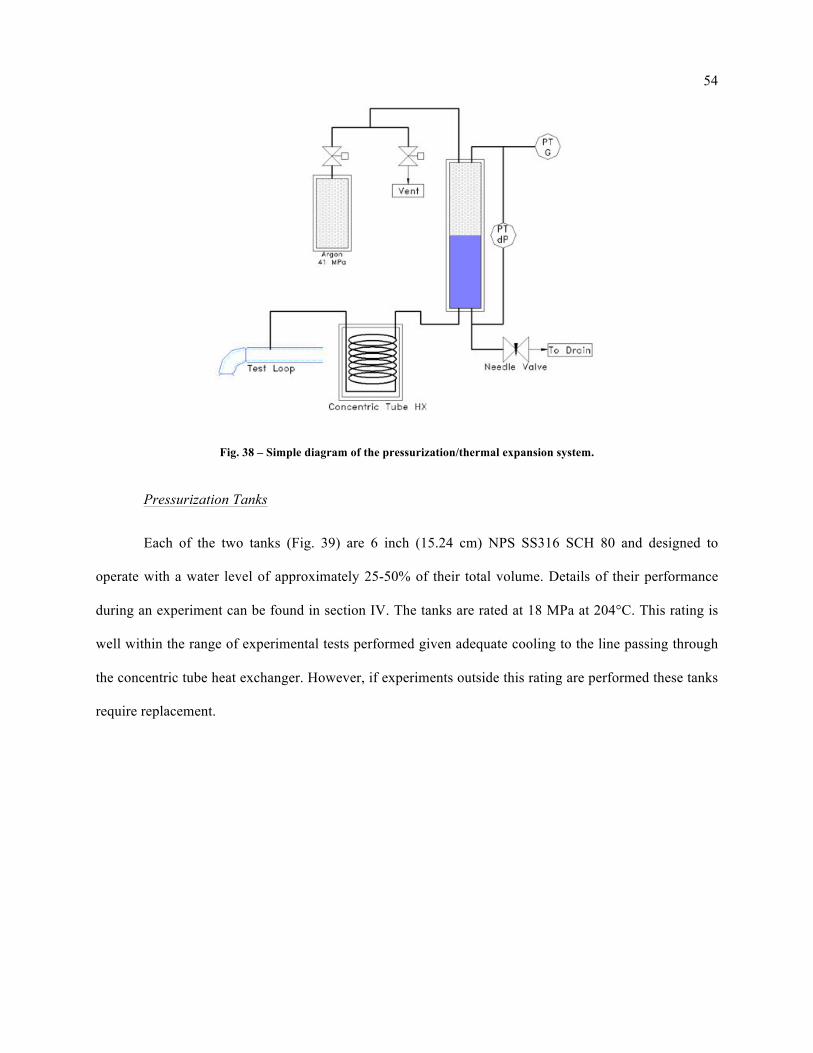
54
Fig. 38 – Simple diagram of the pressurization/thermal expansion system.
Pressurization Tanks
Each of the two tanks (Fig. 39) are 6 inch (15.24 cm) NPS SS316 SCH 80 and designed to
operate with a water level of approximately 25-50% of their total volume. Details of their performance
during an experiment can be found in section IV. The tanks are rated at 18 MPa at 204°C. This rating is
well within the range of experimental tests performed given adequate cooling to the line passing through
the concentric tube heat exchanger. However, if experiments outside this rating are performed these tanks
require replacement.
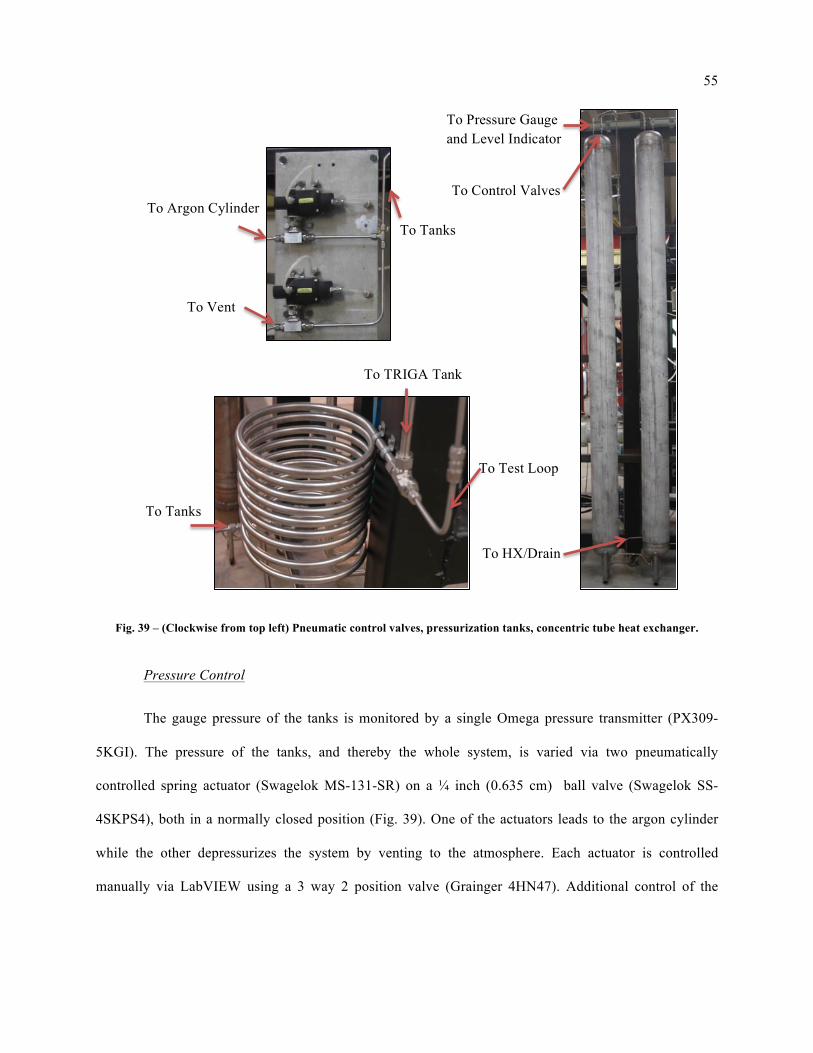
55
Fig. 39 – (Clockwise from top left) Pneumatic control valves, pressurization tanks, concentric tube heat exchanger.
Pressure Control
The gauge pressure of the tanks is monitored by a single Omega pressure transmitter (PX309-
5KGI). The pressure of the tanks, and thereby the whole system, is varied via two pneumatically
controlled spring actuator (Swagelok MS-131-SR) on a ¼ inch (0.635 cm) ball valve (Swagelok SS-
4SKPS4), both in a normally closed position (Fig. 39). One of the actuators leads to the argon cylinder
while the other depressurizes the system by venting to the atmosphere. Each actuator is controlled
manually via LabVIEW using a 3 way 2 position valve (Grainger 4HN47). Additional control of the
To Test Loop
To Argon Cylinder
To Vent
To HX/Drain
To TRIGA Tank
To Tanks
To Tanks
To Control Valves
To Pressure Gauge and Level Indicator

56
pressure is available by removing water from the system during an experiment via use of a needle valve
(Swagelok SS-4GUF4-G) leading to the drain.
Gauge and Level Indicator
The water level within the tanks is monitored using a single 0-250 mbar Rosemount differential
pressure (dP) transmitter (3051CD2A22A1AM5DFE5L4Q4). This is possible because the tanks are
connected in parallel. Truly, the transmitter measures the differential pressure between a tube filled with
water to the same height of the tanks and the pressure from the unknown height of fluid. The result is the
approximate height of the argon cover gas from which the level of the water can be backed out by simple
subtraction.
Concentric Tube Heat Exchanger
Given the proximity of the rating to the limits of the experiments and the increased hazard of
having unnecessary hot, pressurized lines, it was advantageous to cool the connecting line between the
primary test loop and the pressurization tanks. The heat exchanger is created from a SMLS ¼ inch (0.635
cm) OD 0.065 inch (1.65 mm) wall SS316 tube (high pressure) and a SMLS ½ inch (1.27cm) OD 0.035
inch (0.89 mm) wall SS316 tube both initially 6 m in length. To construct the heat exchanger, the ¼ inch
(0.635 cm) tube is fed completely through the ½ inch (1.27 cm) tube, swaged on one end, and then the
two tubes are turned slowly in a lathe to coil the tubes together. Once coiled, any slack of the ¼ inch
(0.635 cm) tube was pulled through and then the two tubes were swaged in the exact same manner as the
other end. Fig. 39 shows the heat exchanger and a swaged end and the ¼ inch (0.635 cm) tube leading to
another fitting that leads to the primary test loop.
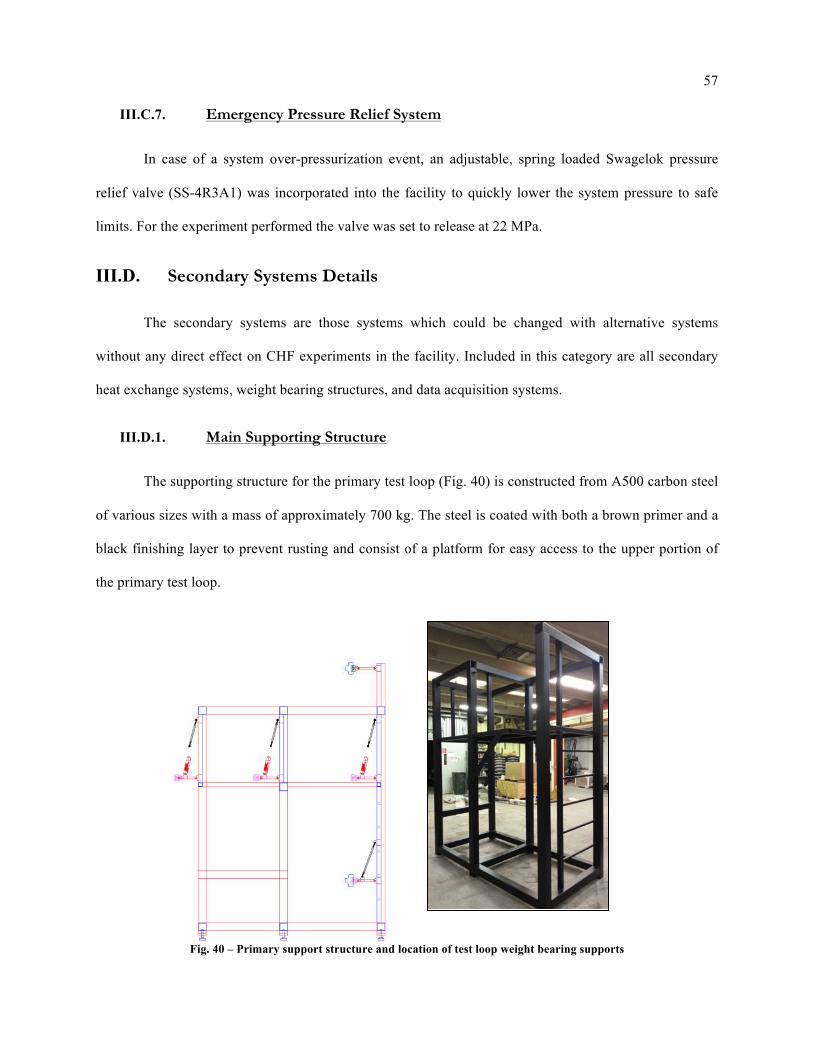
57
III.C.7. Emergency Pressure Relief System
In case of a system over-pressurization event, an adjustable, spring loaded Swagelok pressure
relief valve (SS-4R3A1) was incorporated into the facility to quickly lower the system pressure to safe
limits. For the experiment performed the valve was set to release at 22 MPa.
III.D. Secondary Systems Details
The secondary systems are those systems which could be changed with alternative systems
without any direct effect on CHF experiments in the facility. Included in this category are all secondary
heat exchange systems, weight bearing structures, and data acquisition systems.
III.D.1. Main Supporting Structure
The supporting structure for the primary test loop (Fig. 40) is constructed from A500 carbon steel
of various sizes with a mass of approximately 700 kg. The steel is coated with both a brown primer and a
black finishing layer to prevent rusting and consist of a platform for easy access to the upper portion of
the primary test loop.
Fig. 40 – Primary support structure and location of test loop weight bearing supports
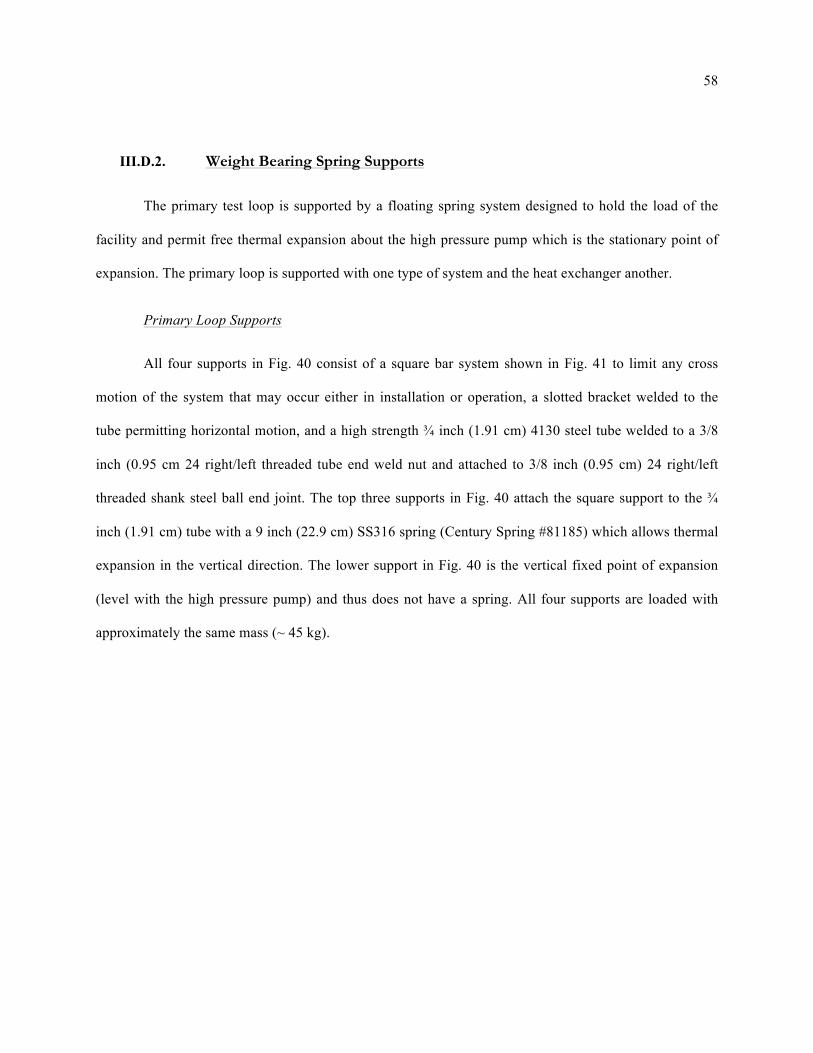
58
III.D.2. Weight Bearing Spring Supports
The primary test loop is supported by a floating spring system designed to hold the load of the
facility and permit free thermal expansion about the high pressure pump which is the stationary point of
expansion. The primary loop is supported with one type of system and the heat exchanger another.
Primary Loop Supports
All four supports in Fig. 40 consist of a square bar system shown in Fig. 41 to limit any cross
motion of the system that may occur either in installation or operation, a slotted bracket welded to the
tube permitting horizontal motion, and a high strength ¾ inch (1.91 cm) 4130 steel tube welded to a 3/8
inch (0.95 cm 24 right/left threaded tube end weld nut and attached to 3/8 inch (0.95 cm) 24 right/left
threaded shank steel ball end joint. The top three supports in Fig. 40 attach the square support to the ¾
inch (1.91 cm) tube with a 9 inch (22.9 cm) SS316 spring (Century Spring #81185) which allows thermal
expansion in the vertical direction. The lower support in Fig. 40 is the vertical fixed point of expansion
(level with the high pressure pump) and thus does not have a spring. All four supports are loaded with
approximately the same mass (~ 45 kg).
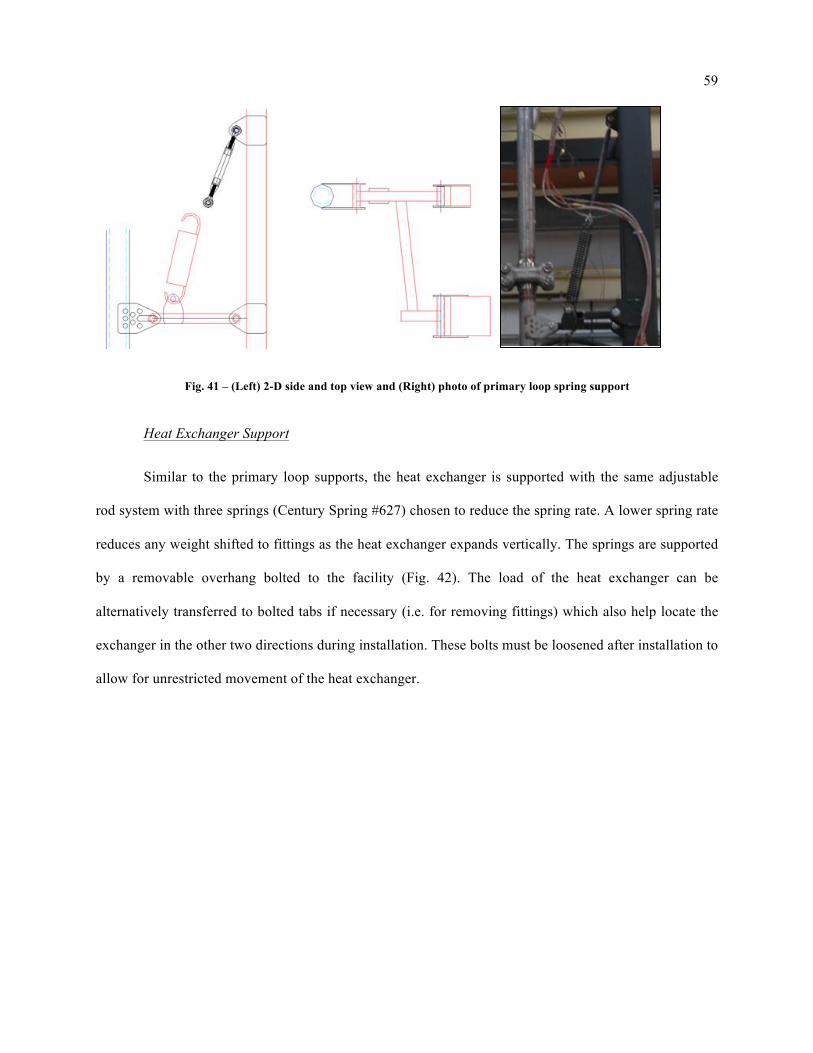
59
Fig. 41 – (Left) 2-D side and top view and (Right) photo of primary loop spring support
Heat Exchanger Support
Similar to the primary loop supports, the heat exchanger is supported with the same adjustable
rod system with three springs (Century Spring #627) chosen to reduce the spring rate. A lower spring rate
reduces any weight shifted to fittings as the heat exchanger expands vertically. The springs are supported
by a removable overhang bolted to the facility (Fig. 42). The load of the heat exchanger can be
alternatively transferred to bolted tabs if necessary (i.e. for removing fittings) which also help locate the
exchanger in the other two directions during installation. These bolts must be loosened after installation to
allow for unrestricted movement of the heat exchanger.
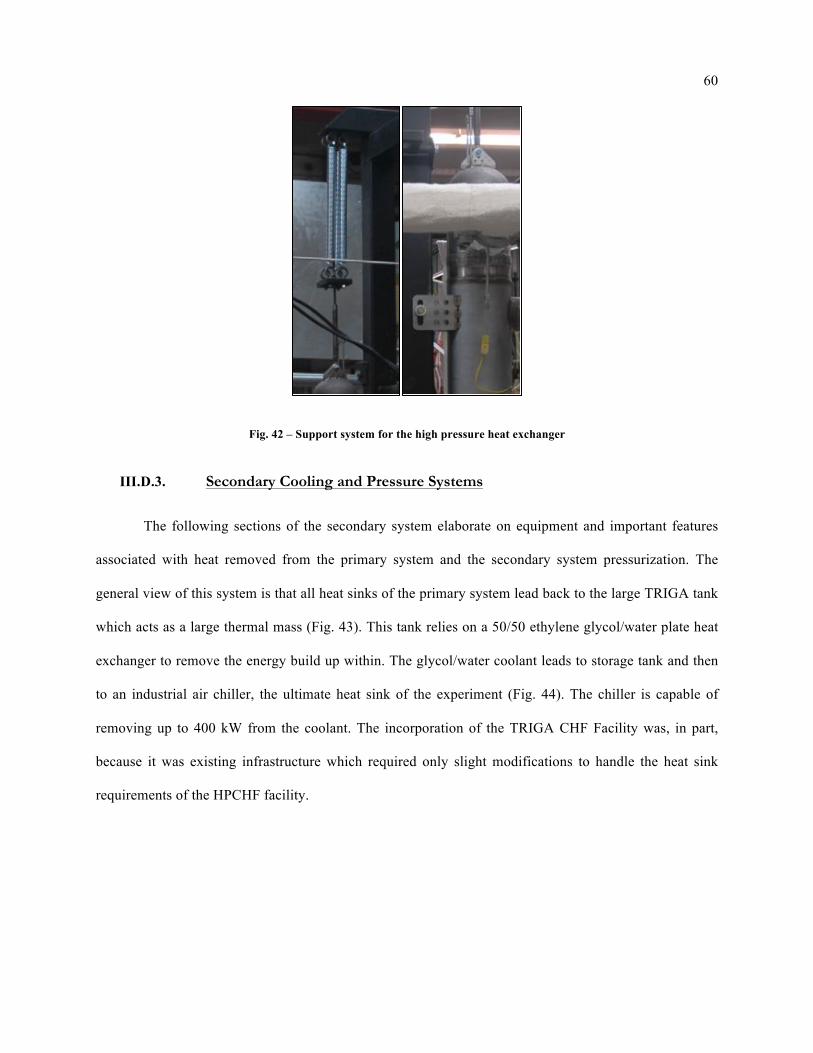
60
Fig. 42 – Support system for the high pressure heat exchanger
III.D.3. Secondary Cooling and Pressure Systems
The following sections of the secondary system elaborate on equipment and important features
associated with heat removed from the primary system and the secondary system pressurization. The
general view of this system is that all heat sinks of the primary system lead back to the large TRIGA tank
which acts as a large thermal mass (Fig. 43). This tank relies on a 50/50 ethylene glycol/water plate heat
exchanger to remove the energy build up within. The glycol/water coolant leads to storage tank and then
to an industrial air chiller, the ultimate heat sink of the experiment (Fig. 44). The chiller is capable of
removing up to 400 kW from the coolant. The incorporation of the TRIGA CHF Facility was, in part,
because it was existing infrastructure which required only slight modifications to handle the heat sink
requirements of the HPCHF facility.
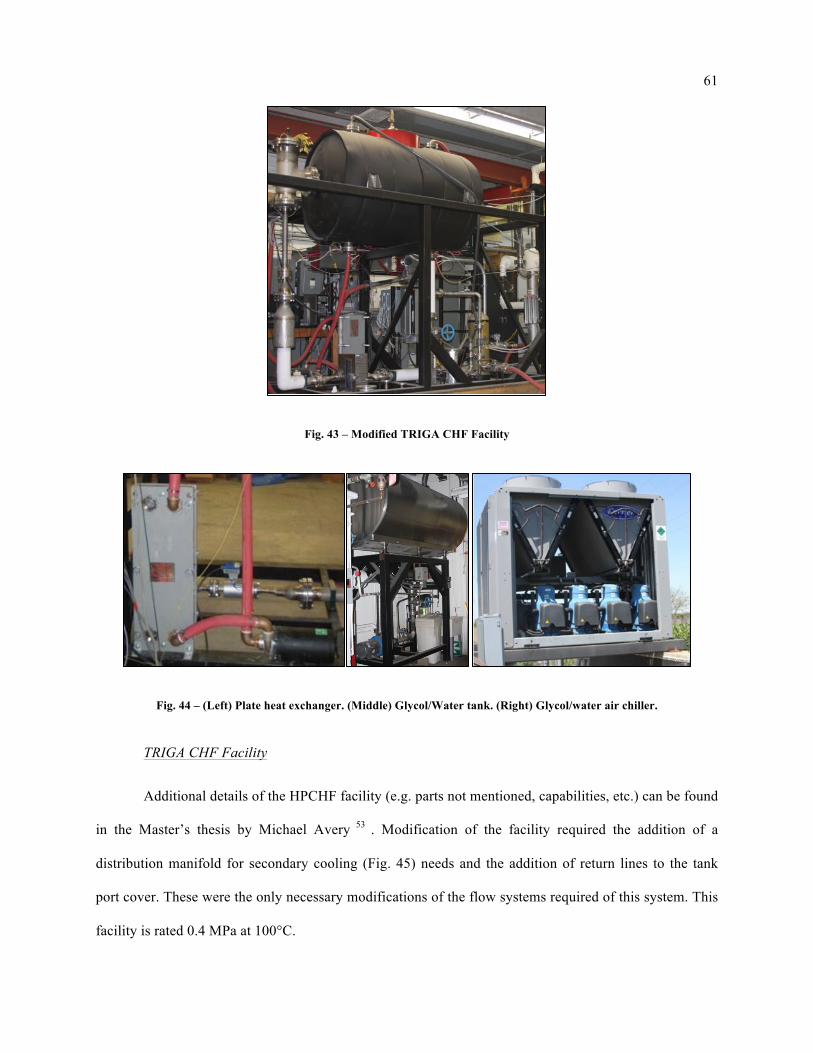
61
Fig. 43 – Modified TRIGA CHF Facility
Fig. 44 – (Left) Plate heat exchanger. (Middle) Glycol/Water tank. (Right) Glycol/water air chiller.
TRIGA CHF Facility
Additional details of the HPCHF facility (e.g. parts not mentioned, capabilities, etc.) can be found
in the Master’s thesis by Michael Avery 53 . Modification of the facility required the addition of a
distribution manifold for secondary cooling (Fig. 45) needs and the addition of return lines to the tank
port cover. These were the only necessary modifications of the flow systems required of this system. This
facility is rated 0.4 MPa at 100°C.
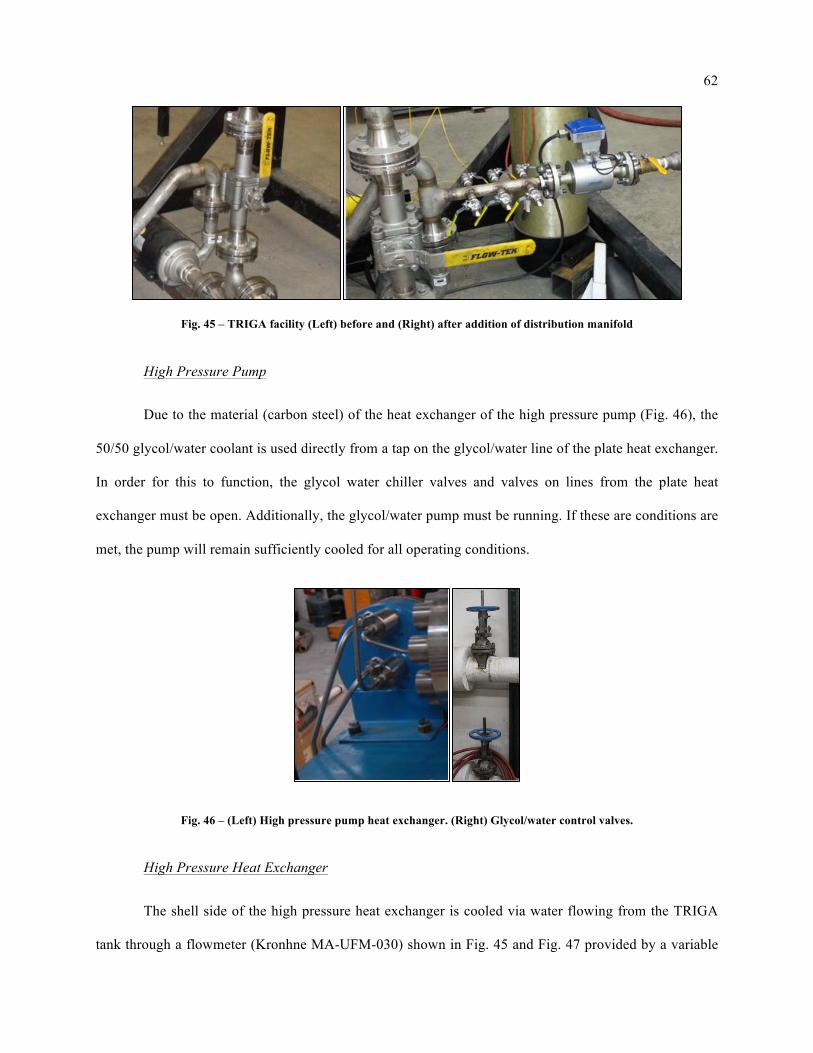
62
Fig. 45 – TRIGA facility (Left) before and (Right) after addition of distribution manifold
High Pressure Pump
Due to the material (carbon steel) of the heat exchanger of the high pressure pump (Fig. 46), the
50/50 glycol/water coolant is used directly from a tap on the glycol/water line of the plate heat exchanger.
In order for this to function, the glycol water chiller valves and valves on lines from the plate heat
exchanger must be open. Additionally, the glycol/water pump must be running. If these are conditions are
met, the pump will remain sufficiently cooled for all operating conditions.
Fig. 46 – (Left) High pressure pump heat exchanger. (Right) Glycol/water control valves.
High Pressure Heat Exchanger
The shell side of the high pressure heat exchanger is cooled via water flowing from the TRIGA
tank through a flowmeter (Kronhne MA-UFM-030) shown in Fig. 45 and Fig. 47 provided by a variable

63
speed pump. As this flow path shares that of the rod pressure boundaries and concentric tube heat
exchanger, an adjustable valve is located after the flow meter in order to better control the heat removal
(i.e. coolant flow rate) from the primary system while still providing adequate cooling to all other
connected systems.
Rod Pressure Boundaries
As discussed in section III.C.2, the rod ends require constant cooling to protect the integrity of the
pressure boundary and heater elements. From the distribution manifold, water lines run to and from each
rod boundary at a rate of at least 4 L/min monitored with the flow meter shown in Fig. 47.
Fig. 47 – Secondary cooling manifold and flowmeters for rod pressure boundaries, pressurizer concentric tube heat exchanger and shell side of high pressure heat exchanger (flowmeter with blue top).
Pressurizer Concentric Tube Heat Exchanger
Similar to the rod pressure boundaries, the concentric tube heat exchanger uses the same
distribution manifold to provide a flowrate of at least 4 L/min. Note, as boiling in the test section
increases the flow through the high pressure side of the heat exchanger increases slightly. The high
temperature of the fluid may boil the coolant slightly and the coolant lines may shake. This behavior is
normal. Additionally, when a CHF event occurs and the heater elements turn off there may the sound of
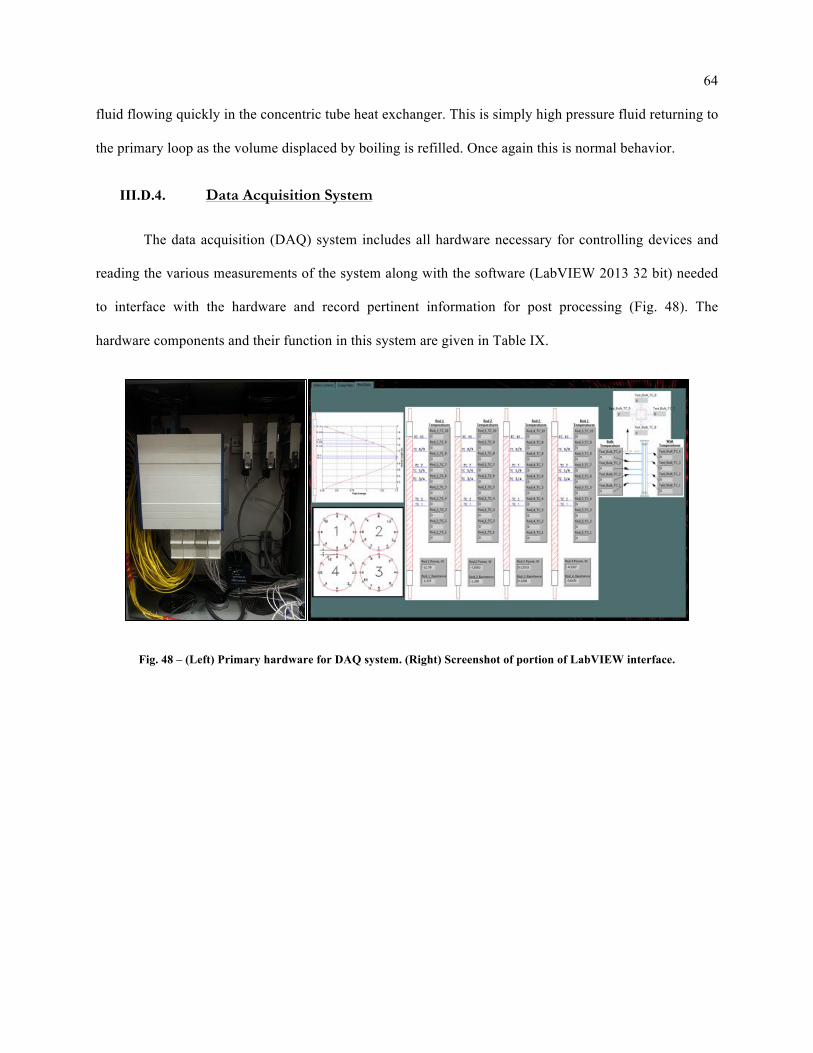
64
fluid flowing quickly in the concentric tube heat exchanger. This is simply high pressure fluid returning to
the primary loop as the volume displaced by boiling is refilled. Once again this is normal behavior.
III.D.4. Data Acquisition System
The data acquisition (DAQ) system includes all hardware necessary for controlling devices and
reading the various measurements of the system along with the software (LabVIEW 2013 32 bit) needed
to interface with the hardware and record pertinent information for post processing (Fig. 48). The
hardware components and their function in this system are given in Table IX.
Fig. 48 – (Left) Primary hardware for DAQ system. (Right) Screenshot of portion of LabVIEW interface.
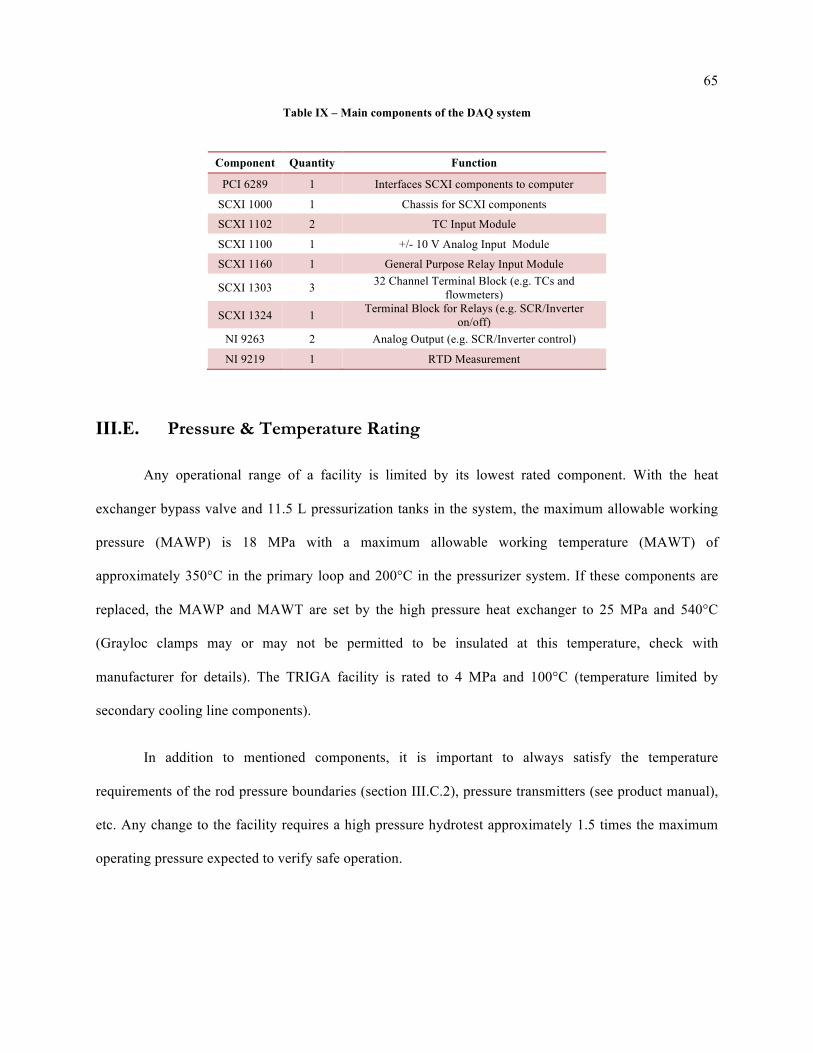
65
Table IX – Main components of the DAQ system
Component Quantity Function
PCI 6289 1 Interfaces SCXI components to computer
SCXI 1000 1 Chassis for SCXI components
SCXI 1102 2 TC Input Module
SCXI 1100 1 +/- 10 V Analog Input Module
SCXI 1160 1 General Purpose Relay Input Module
SCXI 1303 3 32 Channel Terminal Block (e.g. TCs and flowmeters)
SCXI 1324 1 Terminal Block for Relays (e.g. SCR/Inverter on/off)
NI 9263 2 Analog Output (e.g. SCR/Inverter control)
NI 9219 1 RTD Measurement
III.E. Pressure & Temperature Rating
Any operational range of a facility is limited by its lowest rated component. With the heat
exchanger bypass valve and 11.5 L pressurization tanks in the system, the maximum allowable working
pressure (MAWP) is 18 MPa with a maximum allowable working temperature (MAWT) of
approximately 350°C in the primary loop and 200°C in the pressurizer system. If these components are
replaced, the MAWP and MAWT are set by the high pressure heat exchanger to 25 MPa and 540°C
(Grayloc clamps may or may not be permitted to be insulated at this temperature, check with
manufacturer for details). The TRIGA facility is rated to 4 MPa and 100°C (temperature limited by
secondary cooling line components).
In addition to mentioned components, it is important to always satisfy the temperature
requirements of the rod pressure boundaries (section III.C.2), pressure transmitters (see product manual),
etc. Any change to the facility requires a high pressure hydrotest approximately 1.5 times the maximum
operating pressure expected to verify safe operation.
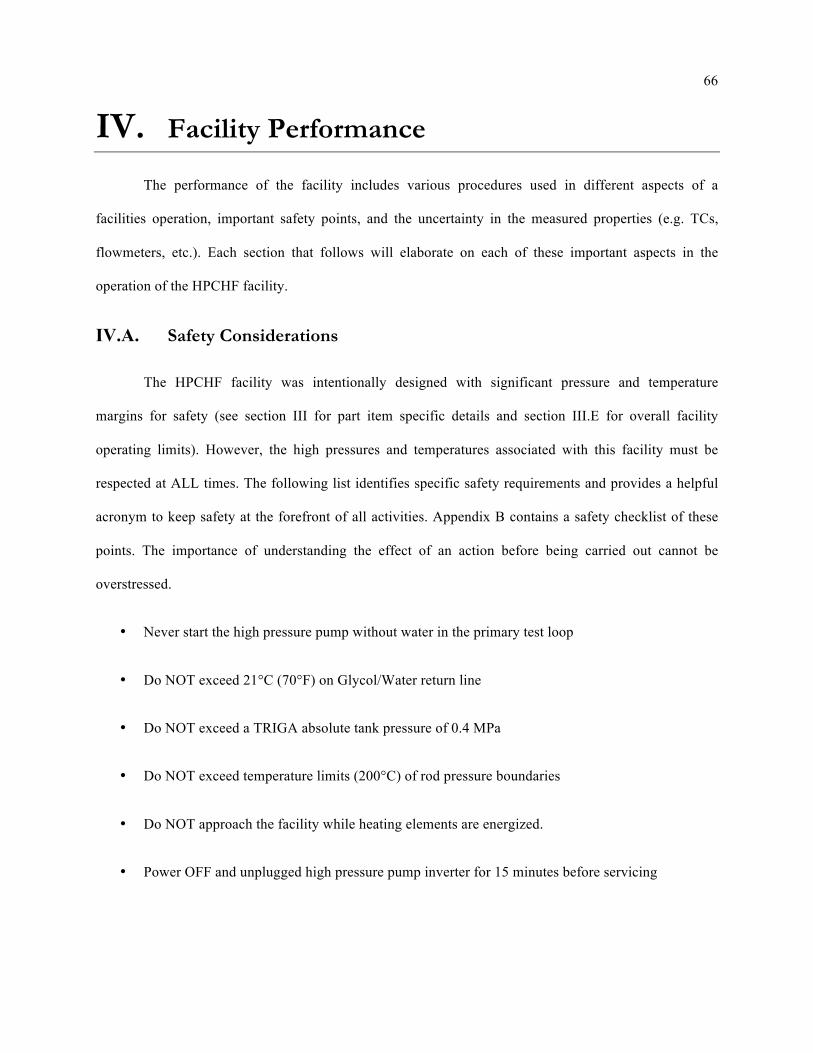
66
IV. Facility Performance
The performance of the facility includes various procedures used in different aspects of a
facilities operation, important safety points, and the uncertainty in the measured properties (e.g. TCs,
flowmeters, etc.). Each section that follows will elaborate on each of these important aspects in the
operation of the HPCHF facility.
IV.A. Safety Considerations
The HPCHF facility was intentionally designed with significant pressure and temperature
margins for safety (see section III for part item specific details and section III.E for overall facility
operating limits). However, the high pressures and temperatures associated with this facility must be
respected at ALL times. The following list identifies specific safety requirements and provides a helpful
acronym to keep safety at the forefront of all activities. Appendix B contains a safety checklist of these
points. The importance of understanding the effect of an action before being carried out cannot be
overstressed.
• Never start the high pressure pump without water in the primary test loop
• Do NOT exceed 21°C (70°F) on Glycol/Water return line
• Do NOT exceed a TRIGA absolute tank pressure of 0.4 MPa
• Do NOT exceed temperature limits (200°C) of rod pressure boundaries
• Do NOT approach the facility while heating elements are energized.
• Power OFF and unplugged high pressure pump inverter for 15 minutes before servicing
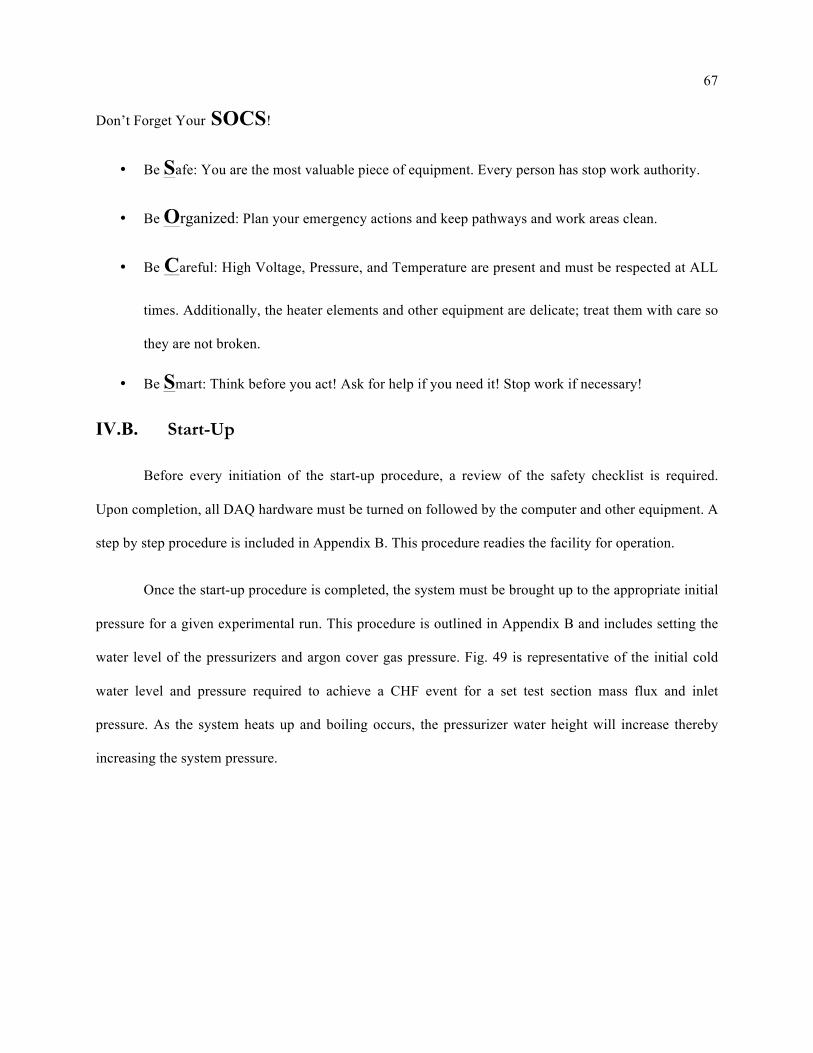
67
Don’t Forget Your SOCS!
• Be Safe: You are the most valuable piece of equipment. Every person has stop work authority.
• Be Organized: Plan your emergency actions and keep pathways and work areas clean.
• Be Careful: High Voltage, Pressure, and Temperature are present and must be respected at ALL
times. Additionally, the heater elements and other equipment are delicate; treat them with care so
they are not broken.
• Be Smart: Think before you act! Ask for help if you need it! Stop work if necessary!
IV.B. Start-Up
Before every initiation of the start-up procedure, a review of the safety checklist is required.
Upon completion, all DAQ hardware must be turned on followed by the computer and other equipment. A
step by step procedure is included in Appendix B. This procedure readies the facility for operation.
Once the start-up procedure is completed, the system must be brought up to the appropriate initial
pressure for a given experimental run. This procedure is outlined in Appendix B and includes setting the
water level of the pressurizers and argon cover gas pressure. Fig. 49 is representative of the initial cold
water level and pressure required to achieve a CHF event for a set test section mass flux and inlet
pressure. As the system heats up and boiling occurs, the pressurizer water height will increase thereby
increasing the system pressure.
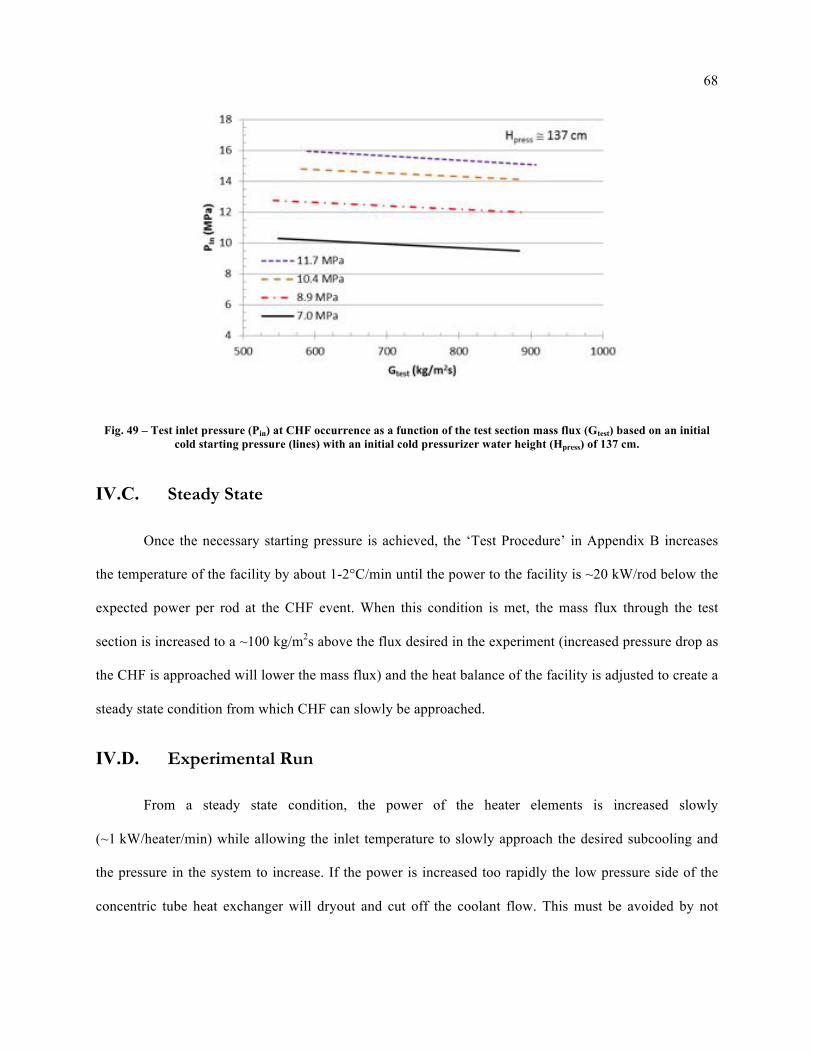
68
Fig. 49 – Test inlet pressure (Pin) at CHF occurrence as a function of the test section mass flux (Gtest) based on an initial cold starting pressure (lines) with an initial cold pressurizer water height (Hpress) of 137 cm.
IV.C. Steady State
Once the necessary starting pressure is achieved, the ‘Test Procedure’ in Appendix B increases
the temperature of the facility by about 1-2°C/min until the power to the facility is ~20 kW/rod below the
expected power per rod at the CHF event. When this condition is met, the mass flux through the test
section is increased to a ~100 kg/m2s above the flux desired in the experiment (increased pressure drop as
the CHF is approached will lower the mass flux) and the heat balance of the facility is adjusted to create a
steady state condition from which CHF can slowly be approached.
IV.D. Experimental Run
From a steady state condition, the power of the heater elements is increased slowly
(~1 kW/heater/min) while allowing the inlet temperature to slowly approach the desired subcooling and
the pressure in the system to increase. If the power is increased too rapidly the low pressure side of the
concentric tube heat exchanger will dryout and cut off the coolant flow. This must be avoided by not
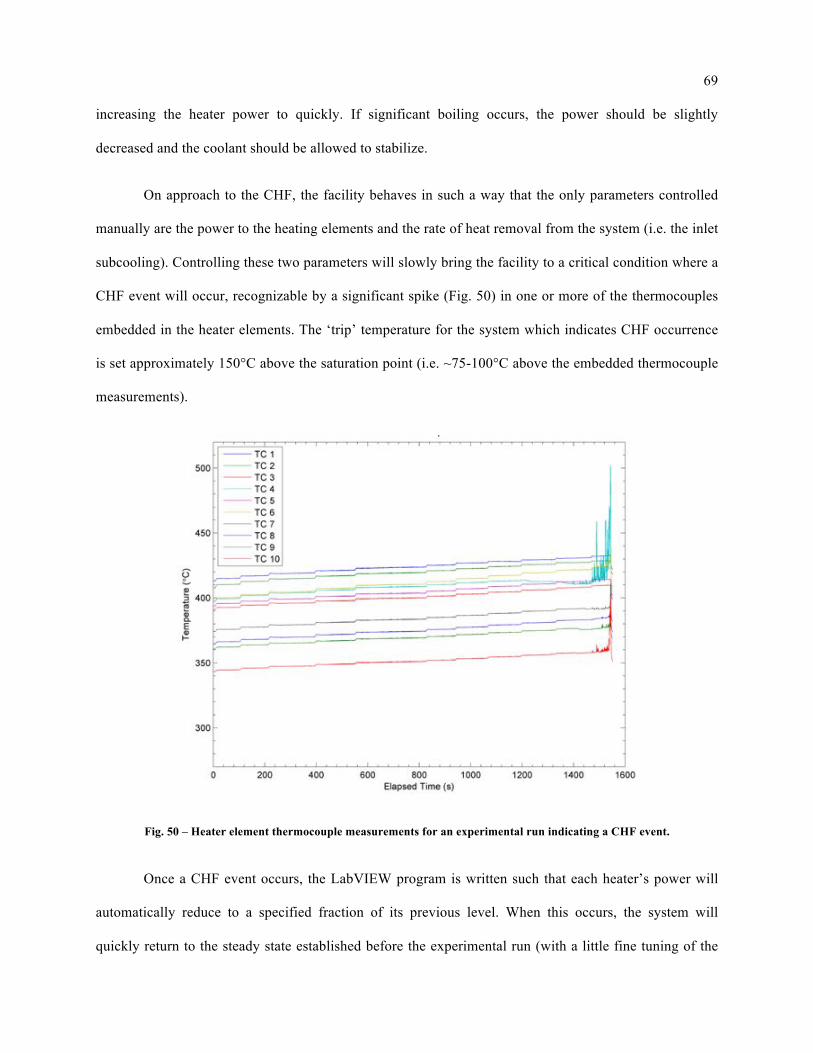
69
increasing the heater power to quickly. If significant boiling occurs, the power should be slightly
decreased and the coolant should be allowed to stabilize.
On approach to the CHF, the facility behaves in such a way that the only parameters controlled
manually are the power to the heating elements and the rate of heat removal from the system (i.e. the inlet
subcooling). Controlling these two parameters will slowly bring the facility to a critical condition where a
CHF event will occur, recognizable by a significant spike (Fig. 50) in one or more of the thermocouples
embedded in the heater elements. The ‘trip’ temperature for the system which indicates CHF occurrence
is set approximately 150°C above the saturation point (i.e. ~75-100°C above the embedded thermocouple
measurements).
Fig. 50 – Heater element thermocouple measurements for an experimental run indicating a CHF event.
Once a CHF event occurs, the LabVIEW program is written such that each heater’s power will
automatically reduce to a specified fraction of its previous level. When this occurs, the system will
quickly return to the steady state established before the experimental run (with a little fine tuning of the
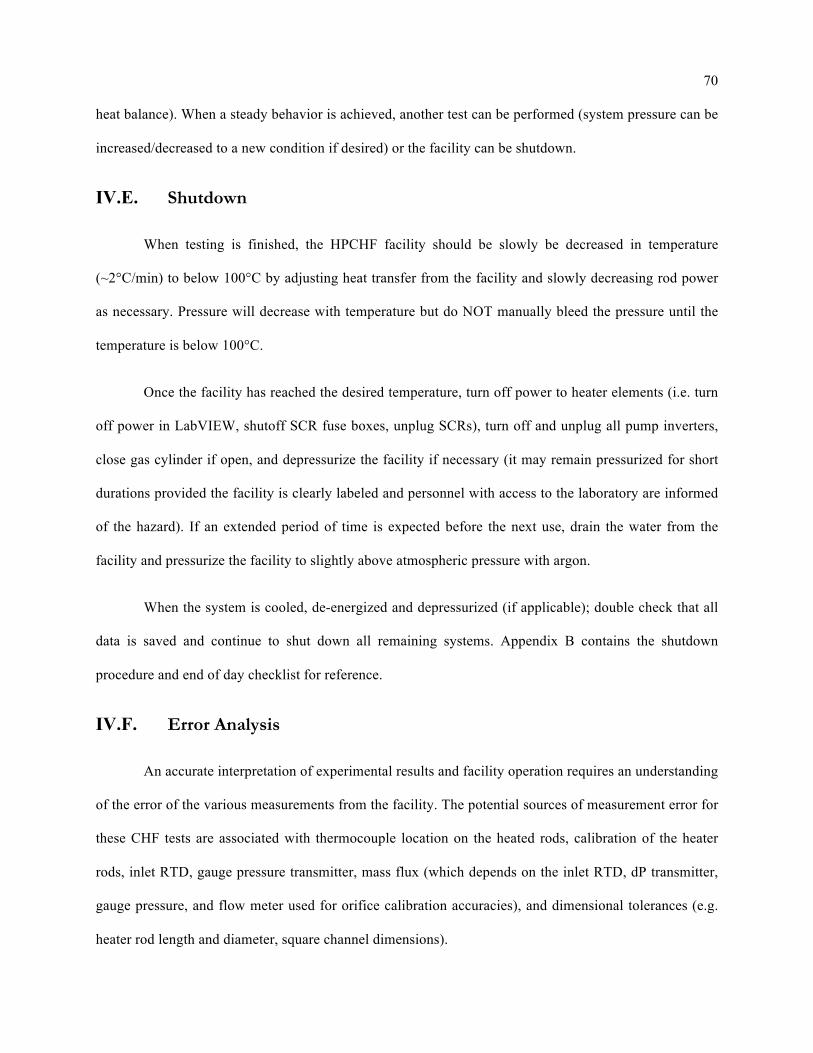
70
heat balance). When a steady behavior is achieved, another test can be performed (system pressure can be
increased/decreased to a new condition if desired) or the facility can be shutdown.
IV.E. Shutdown
When testing is finished, the HPCHF facility should be slowly be decreased in temperature
(~2°C/min) to below 100°C by adjusting heat transfer from the facility and slowly decreasing rod power
as necessary. Pressure will decrease with temperature but do NOT manually bleed the pressure until the
temperature is below 100°C.
Once the facility has reached the desired temperature, turn off power to heater elements (i.e. turn
off power in LabVIEW, shutoff SCR fuse boxes, unplug SCRs), turn off and unplug all pump inverters,
close gas cylinder if open, and depressurize the facility if necessary (it may remain pressurized for short
durations provided the facility is clearly labeled and personnel with access to the laboratory are informed
of the hazard). If an extended period of time is expected before the next use, drain the water from the
facility and pressurize the facility to slightly above atmospheric pressure with argon.
When the system is cooled, de-energized and depressurized (if applicable); double check that all
data is saved and continue to shut down all remaining systems. Appendix B contains the shutdown
procedure and end of day checklist for reference.
IV.F. Error Analysis
An accurate interpretation of experimental results and facility operation requires an understanding
of the error of the various measurements from the facility. The potential sources of measurement error for
these CHF tests are associated with thermocouple location on the heated rods, calibration of the heater
rods, inlet RTD, gauge pressure transmitter, mass flux (which depends on the inlet RTD, dP transmitter,
gauge pressure, and flow meter used for orifice calibration accuracies), and dimensional tolerances (e.g.
heater rod length and diameter, square channel dimensions).
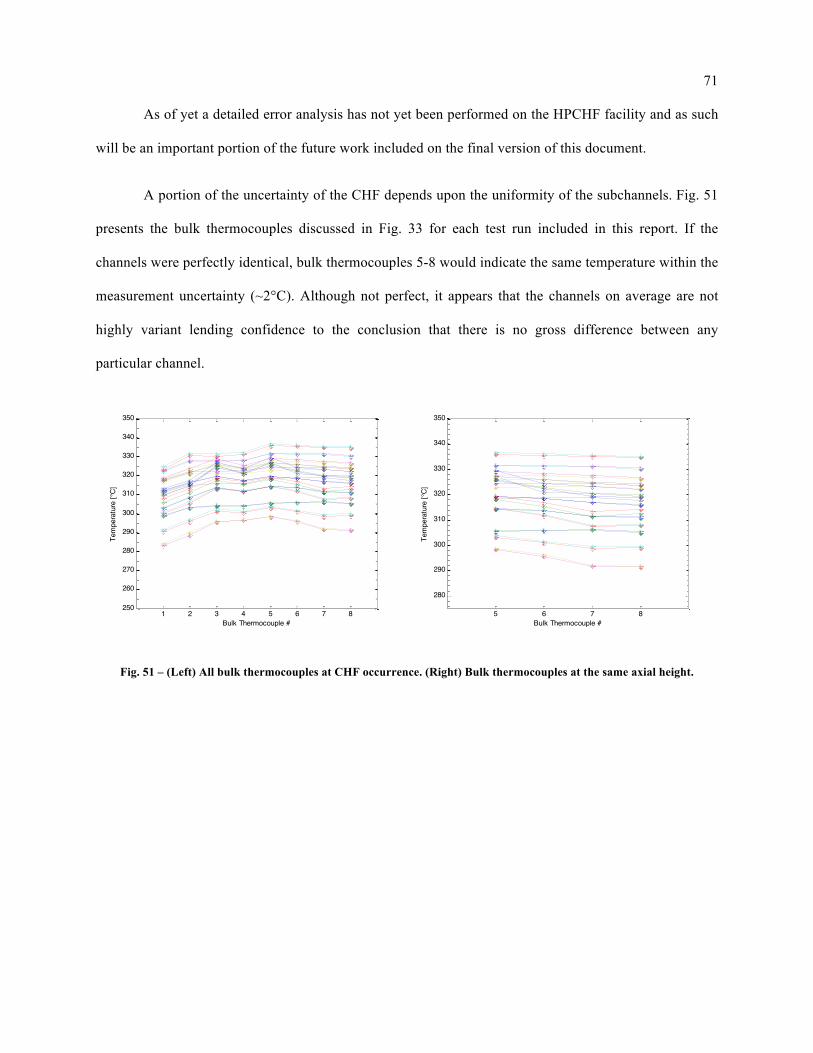
71
As of yet a detailed error analysis has not yet been performed on the HPCHF facility and as such
will be an important portion of the future work included on the final version of this document.
A portion of the uncertainty of the CHF depends upon the uniformity of the subchannels. Fig. 51
presents the bulk thermocouples discussed in Fig. 33 for each test run included in this report. If the
channels were perfectly identical, bulk thermocouples 5-8 would indicate the same temperature within the
measurement uncertainty (~2°C). Although not perfect, it appears that the channels on average are not
highly variant lending confidence to the conclusion that there is no gross difference between any
particular channel.
Fig. 51 – (Left) All bulk thermocouples at CHF occurrence. (Right) Bulk thermocouples at the same axial height.
1 2 3 4 5 6 7 8250
260
270
280
290
300
310
320
330
340
350
Bulk Thermocouple #
Tem
pera
ture
[°C]
5 6 7 8
280
290
300
310
320
330
340
350
Bulk Thermocouple #
Tem
pera
ture
[°C]
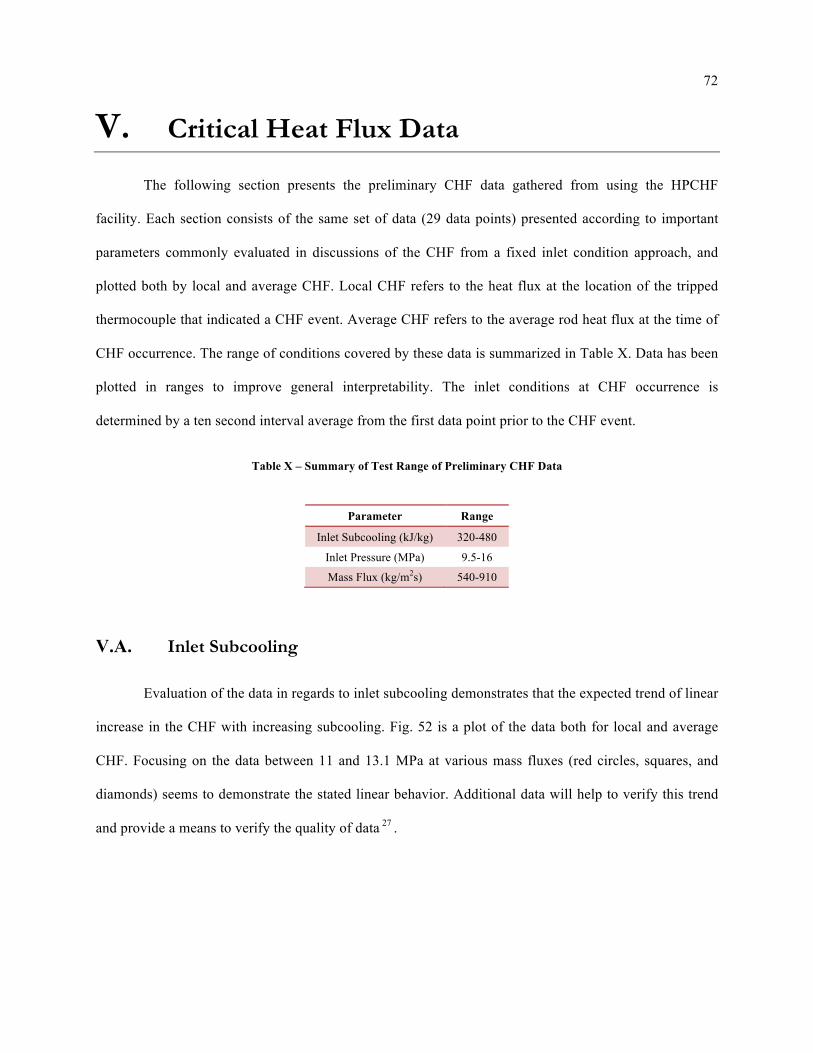
72
V. Critical Heat Flux Data
The following section presents the preliminary CHF data gathered from using the HPCHF
facility. Each section consists of the same set of data (29 data points) presented according to important
parameters commonly evaluated in discussions of the CHF from a fixed inlet condition approach, and
plotted both by local and average CHF. Local CHF refers to the heat flux at the location of the tripped
thermocouple that indicated a CHF event. Average CHF refers to the average rod heat flux at the time of
CHF occurrence. The range of conditions covered by these data is summarized in Table X. Data has been
plotted in ranges to improve general interpretability. The inlet conditions at CHF occurrence is
determined by a ten second interval average from the first data point prior to the CHF event.
Table X – Summary of Test Range of Preliminary CHF Data
Parameter Range
Inlet Subcooling (kJ/kg) 320-480
Inlet Pressure (MPa) 9.5-16
Mass Flux (kg/m2s) 540-910
V.A. Inlet Subcooling
Evaluation of the data in regards to inlet subcooling demonstrates that the expected trend of linear
increase in the CHF with increasing subcooling. Fig. 52 is a plot of the data both for local and average
CHF. Focusing on the data between 11 and 13.1 MPa at various mass fluxes (red circles, squares, and
diamonds) seems to demonstrate the stated linear behavior. Additional data will help to verify this trend
and provide a means to verify the quality of data 27 .
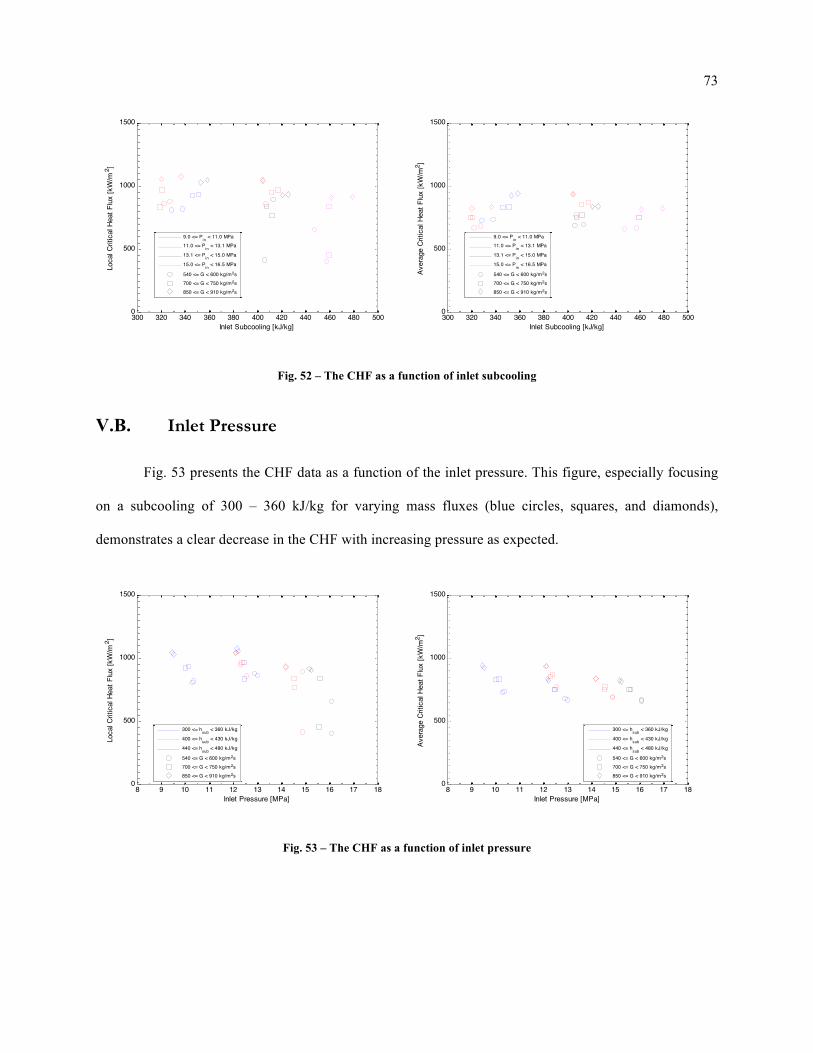
73
Fig. 52 – The CHF as a function of inlet subcooling
V.B. Inlet Pressure
Fig. 53 presents the CHF data as a function of the inlet pressure. This figure, especially focusing
on a subcooling of 300 – 360 kJ/kg for varying mass fluxes (blue circles, squares, and diamonds),
demonstrates a clear decrease in the CHF with increasing pressure as expected.
Fig. 53 – The CHF as a function of inlet pressure
300 320 340 360 380 400 420 440 460 480 5000
500
1000
1500
Inlet Subcooling [kJ/kg]
Loca
l Crit
ical
Hea
t Flu
x [k
W/m
2 ]
9.0 <= Pin < 11.0 MPa11.0 <= Pin < 13.1 MPa
13.1 <= Pin < 15.0 MPa
15.0 <= Pin < 16.5 MPa
540 <= G < 600 kg/m2s700 <= G < 750 kg/m2s850 <= G < 910 kg/m2s
300 320 340 360 380 400 420 440 460 480 5000
500
1000
1500
Inlet Subcooling [kJ/kg]
Aver
age
Criti
cal H
eat F
lux
[kW
/m2 ]
9.0 <= Pin < 11.0 MPa11.0 <= Pin < 13.1 MPa
13.1 <= Pin < 15.0 MPa
15.0 <= Pin < 16.5 MPa
540 <= G < 600 kg/m2s700 <= G < 750 kg/m2s850 <= G < 910 kg/m2s
8 9 10 11 12 13 14 15 16 17 180
500
1000
1500
Inlet Pressure [MPa]
Loca
l Crit
ical
Hea
t Flu
x [k
W/m
2 ]
300 <= hsub < 360 kJ/kg
400 <= hsub < 430 kJ/kg
440 <= hsub < 480 kJ/kg
540 <= G < 600 kg/m2s700 <= G < 750 kg/m2s850 <= G < 910 kg/m2s
8 9 10 11 12 13 14 15 16 17 180
500
1000
1500
Inlet Pressure [MPa]
Aver
age
Criti
cal H
eat F
lux
[kW
/m2 ]
300 <= hsub < 360 kJ/kg
400 <= hsub < 430 kJ/kg
440 <= hsub < 480 kJ/kg
540 <= G < 600 kg/m2s700 <= G < 750 kg/m2s850 <= G < 910 kg/m2s
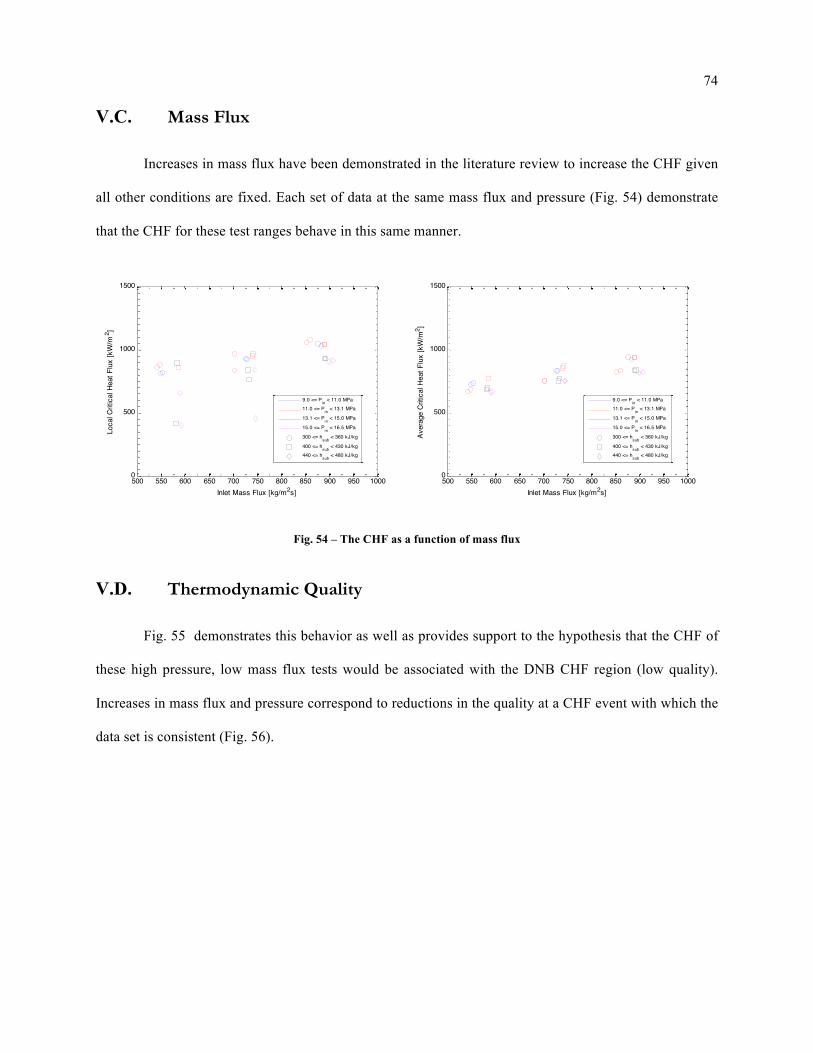
74
V.C. Mass Flux
Increases in mass flux have been demonstrated in the literature review to increase the CHF given
all other conditions are fixed. Each set of data at the same mass flux and pressure (Fig. 54) demonstrate
that the CHF for these test ranges behave in this same manner.
Fig. 54 – The CHF as a function of mass flux
V.D. Thermodynamic Quality
Fig. 55 demonstrates this behavior as well as provides support to the hypothesis that the CHF of
these high pressure, low mass flux tests would be associated with the DNB CHF region (low quality).
Increases in mass flux and pressure correspond to reductions in the quality at a CHF event with which the
data set is consistent (Fig. 56).
500 550 600 650 700 750 800 850 900 950 10000
500
1000
1500
Inlet Mass Flux [kg/m2s]
Loca
l Crit
ical
Hea
t Flu
x [k
W/m
2 ]
9.0 <= Pin < 11.0 MPa11.0 <= Pin < 13.1 MPa
13.1 <= Pin < 15.0 MPa
15.0 <= Pin < 16.5 MPa
300 <= hsub < 360 kJ/kg
400 <= hsub < 430 kJ/kg440 <= hsub < 480 kJ/kg
500 550 600 650 700 750 800 850 900 950 10000
500
1000
1500
Inlet Mass Flux [kg/m2s]
Aver
age
Criti
cal H
eat F
lux
[kW
/m2 ]
9.0 <= Pin < 11.0 MPa11.0 <= Pin < 13.1 MPa
13.1 <= Pin < 15.0 MPa
15.0 <= Pin < 16.5 MPa
300 <= hsub < 360 kJ/kg
400 <= hsub < 430 kJ/kg440 <= hsub < 480 kJ/kg
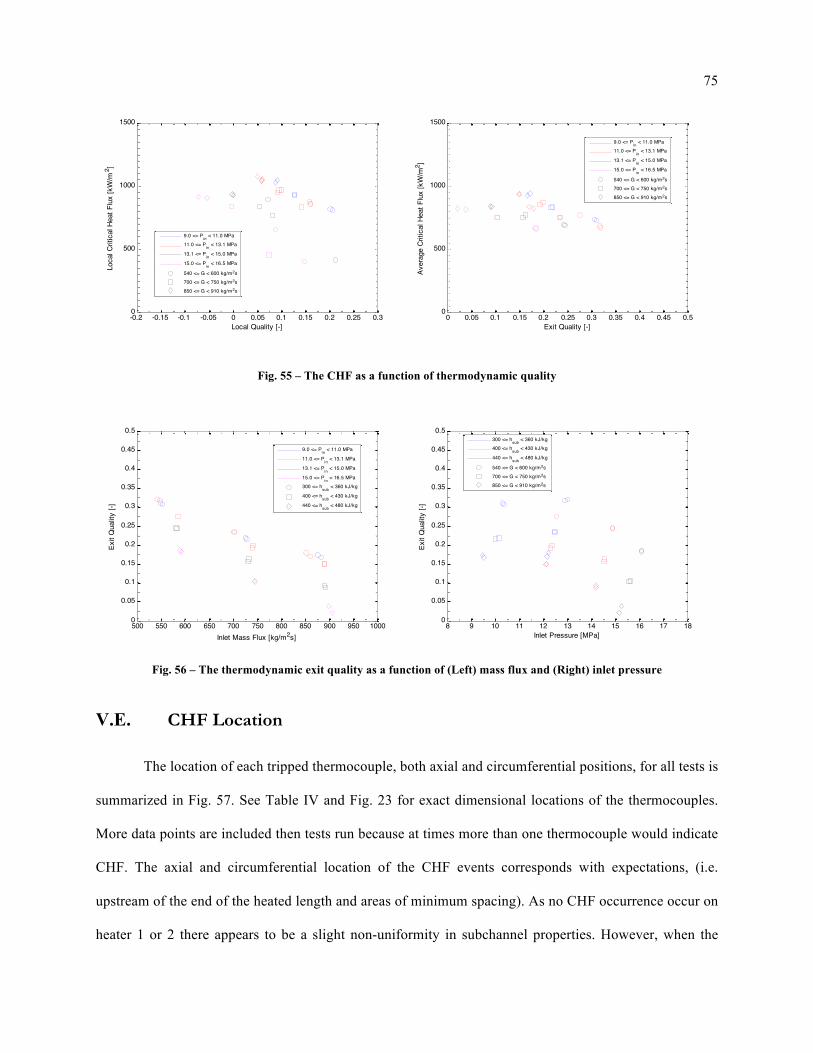
75
Fig. 55 – The CHF as a function of thermodynamic quality
Fig. 56 – The thermodynamic exit quality as a function of (Left) mass flux and (Right) inlet pressure
V.E. CHF Location
The location of each tripped thermocouple, both axial and circumferential positions, for all tests is
summarized in Fig. 57. See Table IV and Fig. 23 for exact dimensional locations of the thermocouples.
More data points are included then tests run because at times more than one thermocouple would indicate
CHF. The axial and circumferential location of the CHF events corresponds with expectations, (i.e.
upstream of the end of the heated length and areas of minimum spacing). As no CHF occurrence occur on
heater 1 or 2 there appears to be a slight non-uniformity in subchannel properties. However, when the
-0.2 -0.15 -0.1 -0.05 0 0.05 0.1 0.15 0.2 0.25 0.30
500
1000
1500
Local Quality [-]
Loca
l Crit
ical
Hea
t Flu
x [k
W/m
2 ]
9.0 <= Pin < 11.0 MPa11.0 <= Pin < 13.1 MPa
13.1 <= Pin < 15.0 MPa
15.0 <= Pin < 16.5 MPa
540 <= G < 600 kg/m2s700 <= G < 750 kg/m2s850 <= G < 910 kg/m2s
0 0.05 0.1 0.15 0.2 0.25 0.3 0.35 0.4 0.45 0.50
500
1000
1500
Exit Quality [-]
Aver
age
Criti
cal H
eat F
lux
[kW
/m2 ]
9.0 <= Pin < 11.0 MPa11.0 <= Pin < 13.1 MPa
13.1 <= Pin < 15.0 MPa
15.0 <= Pin < 16.5 MPa
540 <= G < 600 kg/m2s700 <= G < 750 kg/m2s850 <= G < 910 kg/m2s
500 550 600 650 700 750 800 850 900 950 10000
0.05
0.1
0.15
0.2
0.25
0.3
0.35
0.4
0.45
0.5
Inlet Mass Flux [kg/m2s]
Exit
Qua
lity
[-]
9.0 <= Pin < 11.0 MPa
11.0 <= Pin < 13.1 MPa
13.1 <= Pin < 15.0 MPa
15.0 <= Pin < 16.5 MPa300 <= hsub < 360 kJ/kg
400 <= hsub < 430 kJ/kg
440 <= hsub < 480 kJ/kg
8 9 10 11 12 13 14 15 16 17 180
0.05
0.1
0.15
0.2
0.25
0.3
0.35
0.4
0.45
0.5
Inlet Pressure [MPa]
Exit
Qua
lity
[-]
300 <= hsub < 360 kJ/kg400 <= hsub < 430 kJ/kg
440 <= hsub < 480 kJ/kg
540 <= G < 600 kg/m2s700 <= G < 750 kg/m2s850 <= G < 910 kg/m2s
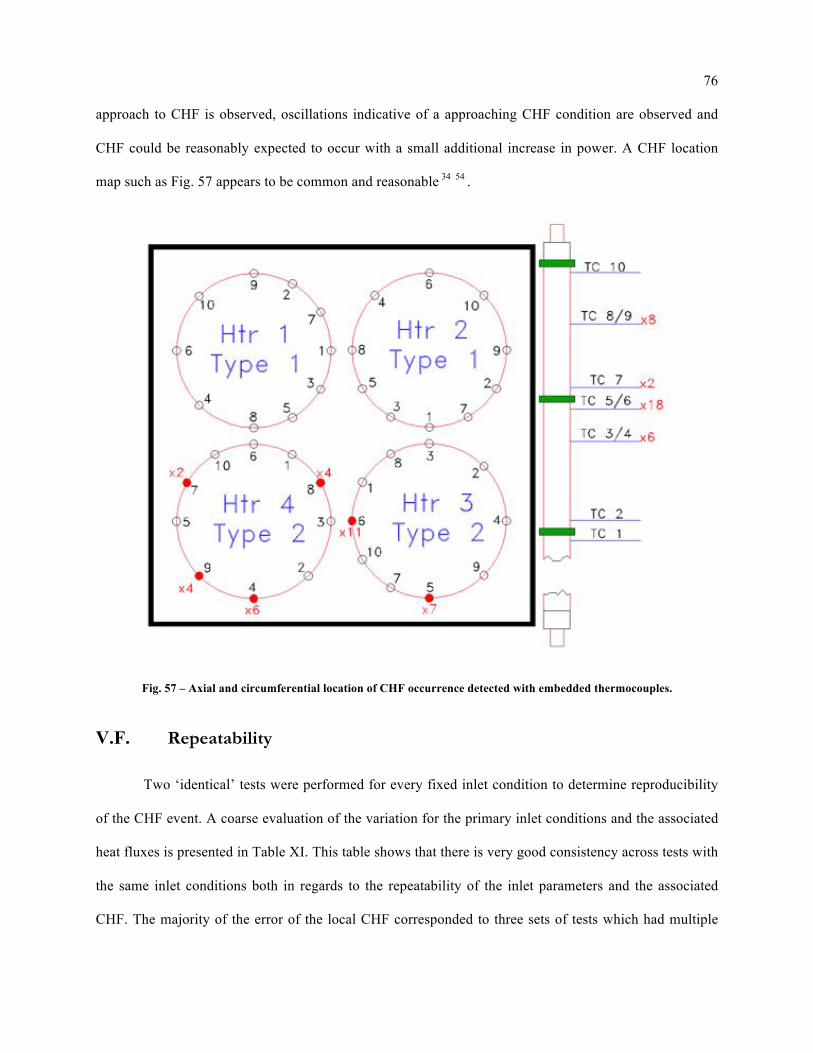
76
approach to CHF is observed, oscillations indicative of a approaching CHF condition are observed and
CHF could be reasonably expected to occur with a small additional increase in power. A CHF location
map such as Fig. 57 appears to be common and reasonable 34 54 .
Fig. 57 – Axial and circumferential location of CHF occurrence detected with embedded thermocouples.
V.F. Repeatability
Two ‘identical’ tests were performed for every fixed inlet condition to determine reproducibility
of the CHF event. A coarse evaluation of the variation for the primary inlet conditions and the associated
heat fluxes is presented in Table XI. This table shows that there is very good consistency across tests with
the same inlet conditions both in regards to the repeatability of the inlet parameters and the associated
CHF. The majority of the error of the local CHF corresponded to three sets of tests which had multiple
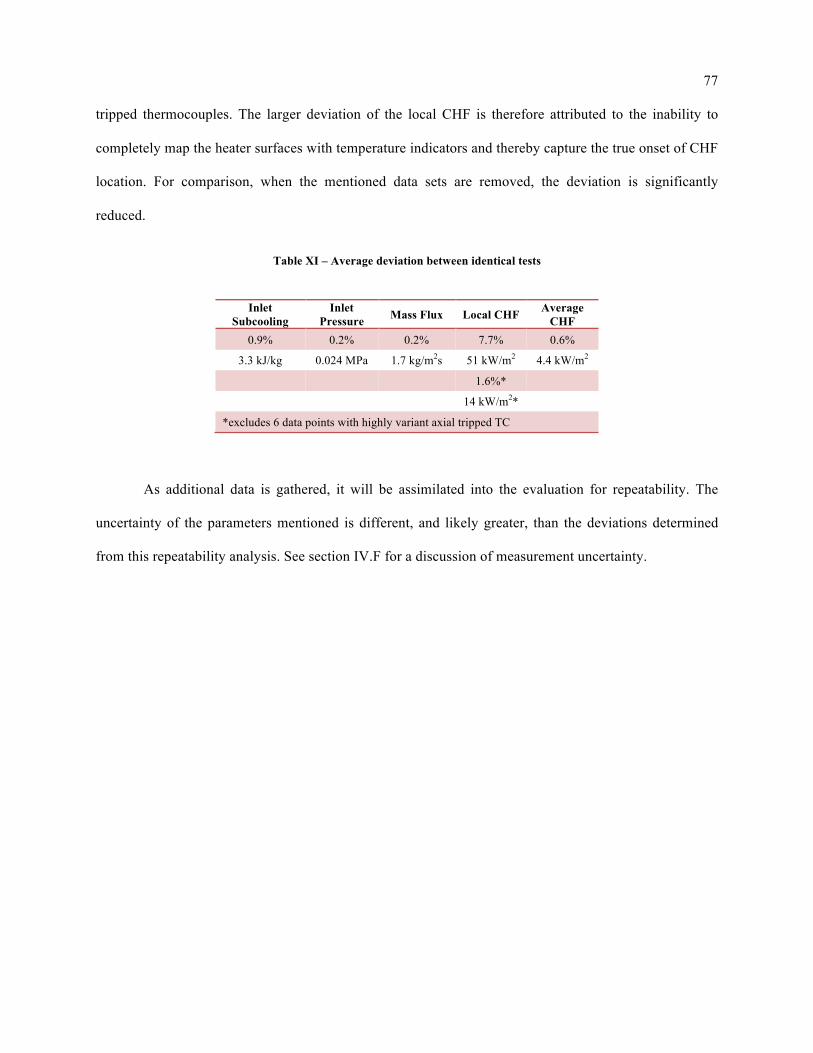
77
tripped thermocouples. The larger deviation of the local CHF is therefore attributed to the inability to
completely map the heater surfaces with temperature indicators and thereby capture the true onset of CHF
location. For comparison, when the mentioned data sets are removed, the deviation is significantly
reduced.
Table XI – Average deviation between identical tests
Inlet Subcooling
Inlet Pressure Mass Flux Local CHF Average
CHF 0.9% 0.2% 0.2% 7.7% 0.6%
3.3 kJ/kg 0.024 MPa 1.7 kg/m2s 51 kW/m2 4.4 kW/m2
1.6%*
14 kW/m2*
*excludes 6 data points with highly variant axial tripped TC
As additional data is gathered, it will be assimilated into the evaluation for repeatability. The
uncertainty of the parameters mentioned is different, and likely greater, than the deviations determined
from this repeatability analysis. See section IV.F for a discussion of measurement uncertainty.
78
VI. Summary & Future Work
In summary, a high pressure, low mass flux critical heat flux test facility has been designed,
constructed, and has been used for the acquisition of a preliminary round of data. Initial evaluation
indicates that general trends documented in the literature for fixed inlet conditions appear to be satisfied
and that the data is repeatable.
The future work required of this project is four fold. First, additional data points will be obtained
to increase the range of tests performed including repeatability tests. Second, gathered data will be
compared with the various prediction methods indicated in the literature review along with a detailed
uncertainty analysis of the data. Third, a subchannel code (e.g. COBRA) and/or a system modeling tool
(e.g. TRACE) will be used to model the system for additional insight. Fourth, a possible preliminary
investigation into visualization methods of the test section may be undertaken.
Once completed, this report will be updated with suggestions, findings, data base, etc. and be
presented again to the Examination Committee members indicated on the title page in partial fulfillment
of the requirements degree of Doctorate of Philosophy in Nuclear Engineering and Engineering Physics.

79
Bibliography
[1] T. B. Drew and A. C. Mueller, "Boiling," in American Institute of Chemical Engineers, Toronto, 1937, pp. 449-473.
[2] S. Nukiyama, "The Maximum and Minimum Values of the Heat Q Transmitted from Metal to Boiling Water under Atmospheric Pressure," International Journal of Heat and Mass Transfer, vol. 9, pp. 1419-1433, 1966.
[3] International Atomic Energy Agency (IAEA), "Thermohydraulic Relationships for Advanced Water Cooled Reactors," TecDoc 1203, 2001.
[4] G. P. Celata and A. Mariana, "CHF and Post-CHF (Post-Dryout) Heat Transfer," in Handbook of Phase Change: Boiling and Condensation.: Taylor & Francis, 1999, ch. 17, pp. 443-493.
[5] J. G. Collier and J. R. Thome, Convective Boiling and Condensation, 3rd ed.: Clarendon Press, 1994.
[6] S. M. Ghiaasiaan, Two-Phase Flow, Boiling and Condensation In Conventional and Miniature Systems.: Cambridge University Press, 2007.
[7] G. F. Hewitt, "Burnout," in Handbook of Multiphase Systems.: Hemisphere Publishing Corporation, 1982, ch. 6.4, pp. 6.66-6.141.
[8] G. F. Hewitt and N. S. Hall-Taylor, "Burnout," in Annular Two-Phase Flow.: Pergamon Press, 1970, ch. 11, pp. 219-252.
[9] L. S. Tong and Y. S. Tang, Boiling Heat Transfer and Two-Phase Flow, 2nd ed.: Taylor & Francis, 1997.
[10] L. S. Tong and J. Weisman, Thermal Analysis of Pressurized Water Reactors, 3rd ed.: American Nuclear Society, 1996.
[11] Y. Ahang, and J. R. Howell A. Faghri,.: Thermal Fluids Central, 2009, ch. 8.2.
[12] S. G. Kandlikar, "Critical Heat Flux in Subcooled Flow Boiling - An Assessment of Current Understanding and Future Directions for Research," Multiphase Science and Technology, vol. 13, no. 3, pp. 207-232, 2001.
[13] The U.S. Department of Energy's Office of Nuclear Energy. (2014, September) Small Modular Nuclear Reactors. [Online]. http://www.energy.gov/ne/nuclear-reactor-technologies/small-modular-nuclear-reactors
[14] J. N. Reyes Jr. and P. Lorenzini, "NuScale Power: A modular, scalable approach to commercial
80
nuclear power," Nuclear News, pp. 97-104, June 2010.
[15] U. S. Nuclear Regulatory Comission, "Briefing on Small Modular Reactors," in Transcript of Proceedings, 2011.
[16] International Atomic Energy Agency, "Status of Small and Medium Sized Reactor Designs," IAEA, Supplement 2012.
[17] Z. Liu and J. Fan, "Technology Readiness Assessment of Small Modular Reactor (SMR) Designs," Progress in Nuclear Energy, vol. 70, pp. 20-28, 2014.
[18] United States Nuclear Regulatory Commission. (2014, September) [Online]. http://www.nrc.gov/reactors/advanced/nuscale.html
[19] M. S. McGough, "Presentation to Energy NorthWest Member Forum XVI," NuScale Power, Kennewick, Washington, Presentation 2013.
[20] K. Welter, "NuScale Technology Overview to the U. S. Nuclear Regulatory Commission," NuScale Power, Rockville, MD, Presentation 2010.
[21] M. De Angelis, M. S. Greenwood, and J. Yang, "Critical Heat Flux under Natural and Forced Convection," in American Nuclear Society Annual Meeting, Chicago, Illinois, 2012.
[22] K. Mishima and M. Ishii, "Experimental Study on Natural Convection Boiling Burnout in an Annulus," in 7th International Heat Transfer Conference, Munich, 1982, pp. 309-314.
[23] D. C. Groeneveld, S. C. Cheng, and T. Doan, "1986 AECL-UO Critical Heat Flux Lookup Table," Heat Transfer Engineering, vol. 7, no. 1-2, pp. 46-62, 1986.
[24] D. C. Groeneveld et al., "The 1995 Look-Up Table for Critical Heat Flux in Tubes," Nuclear Engineering and Design, vol. 163, pp. 1-23, 1996.
[25] D. C. Groeneveld et al., "The 2006 CHF Look-Up Table," Nuclear Engineering and Design, vol. 237, pp. 1909-1922, 2007.
[26] A. N. Baker, "Study of Existing Data and Correlations on Rod Bundle Critical Heat Flux," University of Wisconsin, Madison, Master's Thesis 1972.
[27] E. D. Hughes, LP Ka-Lam, A. N. Baker, and M. W. Carbon, "A Compilation of Rod Array Critical Heat Flux Data Sources and Information," Nuclear Engineering and Design, vol. 30, pp. 20-35, 1974.
[28] C. F. Fighetti and D. G. Reddy, "Paramteric Study of CHF Data Volume 1: Compilation of Rod Bundle Chf Data Available at the Columbia University Heat Transfer Research Facility,"

81
EPRI/Columbia University, NP-2609 Volume 1 Research Project 813, 1982.
[29] D. G. Reddy and C. F. Fighetti, "Parametric Study of CHF Data Volume 2: A Generalized Subchannel CHF Correlation for PWR and BWR Fuel Assemblies," EPRI/ Columbia University, NP-2609 Volume 2 Research Project 813, 1982.
[30] C. F. Fighetti and D. G. Reddy, "Parametric Study of CHF Data Volume 3, Part 1: Critical Heat Flux Data," EPRI/Columbia University, NP-2609 Volume 3 Part 1 Research Project 813, 1982.
[31] C. F. Fighetti and D. G. Reddy, "Parametric Study of CHF Data Volume 3 Part 2: Critical Heat Flux Data," EPRI/Columbia University, NP-2609 Volume 3 Part 2 Research Project 813, 1982.
[32] R. J. Weatherhead, "Nucleate Boiling Characteristics and the Critical Heat Flux Occurrence in Subcooled Axial-Flow Water Systems," Argonne National Laboratory, Argonee, Illinois, AEC Research and Development Report ANL-6675, 1963.
[33] S. Moon, W. Baek, and S. H. Change, "Parametric Trends Analysis of the Critical Heat Flux based on Artificial Neural Networds," Nuclear Engineering and Design, vol. 163, pp. 29-49, 1996.
[34] S. Moon, S. Chun, S. Cho, and W. Baek, "An Experimental Study on the Critical Heat Flux for Low Flow of Water in a Non-Uniformly Heated Vertical Rod Bundle Over a Wide Range of Pressure Conditions," Nuclear Engineering and Design, vol. 235, pp. 2295-2309, 2005.
[35] Y. W. Wu, G. H. Su, S. Z. Qiu, and B. X. Hu, "Experimental Study on Critical Heat Flux in Bilaterally Heated Narrow Annuli," International Journal of Multiphase Flow, vol. 35, pp. 977-986, 2009.
[36] A. W. Bennet, G. F. Hewitt, H. A. Kearsey, R. K. F. Keeys, and D. J. Pulling, "Studies of Burnout in Boiling Heat Transfer," Transactions of the Institution of Chemical Engineers, vol. 45, no. 21, pp. T319-T333, 1967.
[37] S. C. Yao, L. E. Hochreiter, and W. J. Leech, "Heat-Transfer Augmentation in Rod Bundles Near Grid Spacers," Transactions of ASME, vol. 104, pp. 76-81, February 1982.
[38] D. C. Groeneveld and W. W. Yousef, "Spacing Devices for Nuclear Fuel Bundles: A Survey of their Effect on CHF, Post-CHF Heat Transfer and Pressure Drop," in ANS/ASME Topical Meeting on Reactor Thermal-Hydraulics, Saratoga, New York, 1980.
[39] General Electric, "General Electric BWR Thermal Analysis Basis (GETAB): Data, Correlation and Design Application," NEDO-10958-A 1977.
[40] L. S. Tong, "Boundary-Layer Analysis of the Flow Boiling Crisis," International Journal of Heat and Mass Transfer, vol. 11, pp. 1208-1211, 1968.

82
[41] J. Weisman and B. S. Pei, "Prediction of Critical HEat Flux in Flow Boiling at Low Qualities," International Journal of Heat and Mass Transfer, vol. 26, no. 10, pp. 1463-1477, 1983.
[42] C. H. Lee and I. Mudawwar, "A Mechanistic Critical Heat Flux Model for Subcooled Flow Boiling Based on Local Bulk Flow Conditions," International Journal of Multiphase Flow, vol. 14, no. 6, pp. 711-728, 1988.
[43] W. S. Lin, C. H. Lee, and B. S. Pei, "An Improved Theoretical Critical Heat Flux Model for Low-Quality Flow," Nuclear Technology, vol. 88, no. 3, pp. 294-306, 1989.
[44] G. Yadigaroglu, "CMFD and the Critical-Heat-Flux Grand Challenge in Nuclear Thermal-Hydraulics - a letter to the Editor of this special issue," International Journal of Multiphase Flow, p. in press, 2014.
[45] M.V. De Angelis, "The UW-Madison High Pressure Test Facility Design Report," University of Wisconsin, Madison, 2012.
[46] Stern Laboratories Inc., "Technical Specification for 9.5 mm OD Fuel Simulators with a Cosine Axial Power Profile for the University of Wisconsin," Ontario, Canada, SLTS-76, 2012.
[47] S.K. Moon, S.Y. Chun, S.D. Hong, W.P. Baek S.W. Akhtar, "Modeling Capability of R134a for a Critical Heat Flux of Water in a Vertical 5x5 Rod Bundle Geometry," International Journal of Heat and Mass Transfer, vol. 49, pp. 1299-1309, 2006.
[48] U. Muller X. Cheng, "Critical Heat Flux and Turbulent Mixing in Hexagonal Tight Rod Bundles," International Journal of Multiphase Flow, vol. 24, pp. 1245-1263, 1998.
[49] S.Y. Chun, S.K. Moon, W.P. Baek, Y. Kim S. Cho, "Flooding Limited CHF in a Vertical 3x3 Rod Bundle with Non-Uniform Axial Heat Flux," Nuclear Engineering and Design, vol. 235, pp. 77-90, 2005.
[50] S.K. Moon, S. Chun, J.K. Park, D.H. Hwang, W.P. Baek, S.K. Park, C.Y. Lee K.Y. Choi, "Critical Heat Flux Tests for an Appliation of the Three-Pin Fuel Test Loop in HANARO," Heat Transfer Engineering, vol. 29, pp. 685-694, 2008.
[51] S.H. Chang B.S. Shin, "CHF Experimeint and CFD Analysis in a 2x3 Rod Bundle with Mixing Vane," Nuclear Engineering and Design, vol. 29, pp. 899-912, 2009.
[52] MFC-3Ma-2007, "Orifice Plates," ASME, pp. 19-27.
[53] Michael Avery, "Project Report of Critical Heat Flux at Conditions Representative of TRIGA-Type Reactors," University of Wisconsin, Madison, Master's Thesis 2012.
[54] J. Yang, M. Avery, M. De Angelis, and M. S. Greenwood, "4 Rod Bundle Test Appendix,"

83
University of Wisconsin, Madison, 2013.

84
Appendix A Official Documents
Original Project Proposal

85
Stern Labs Non-Uniform Heater Elements
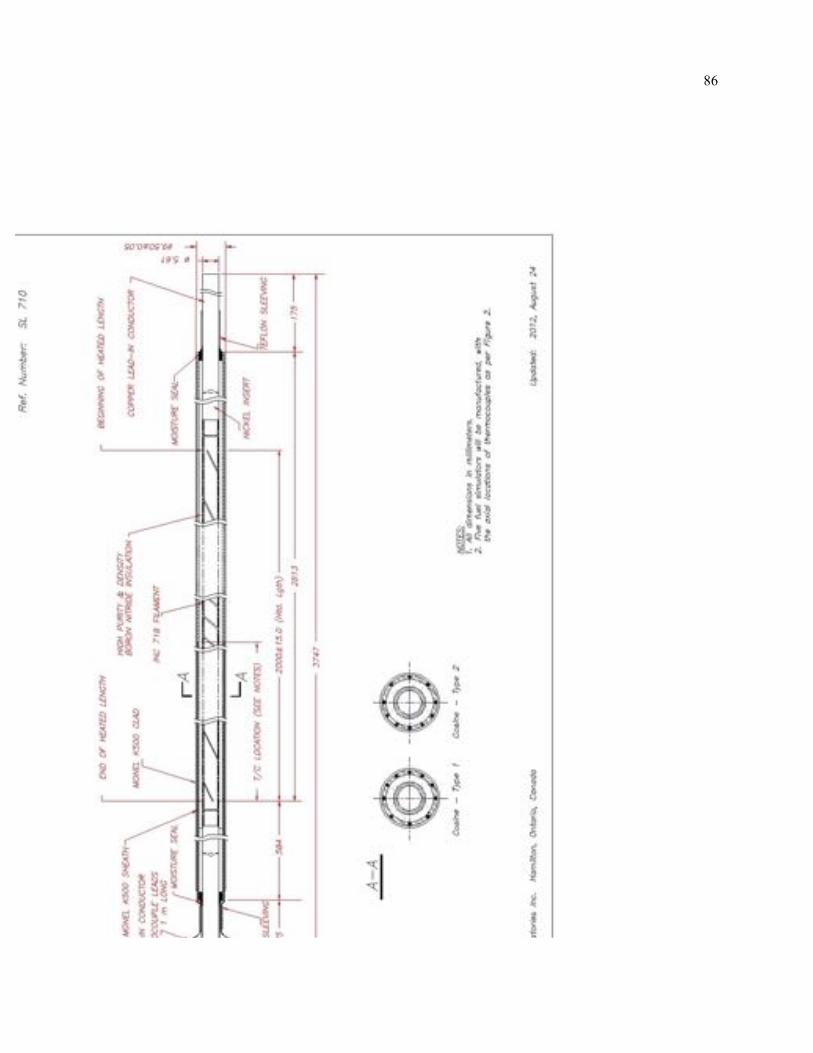
86

87
High Pressure Pump Information

88
Appendix B Facility Operation Procedures
Start-Up/Shutdown Procedure
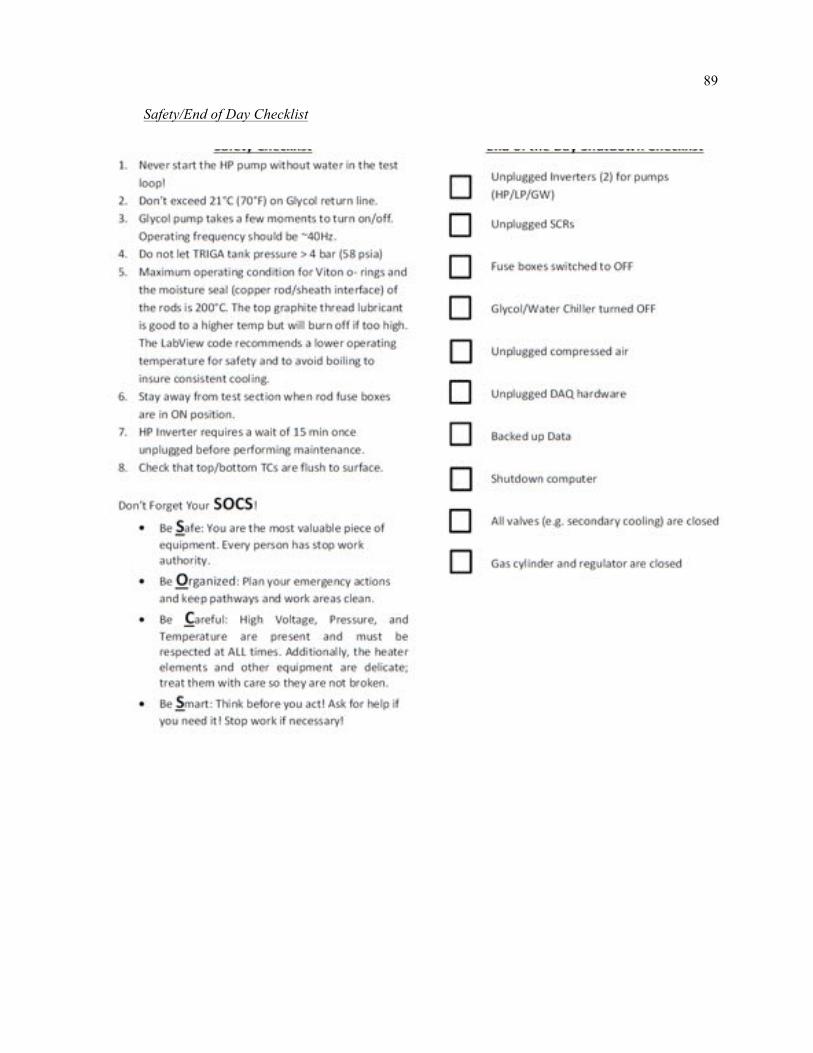
89
Safety/End of Day Checklist
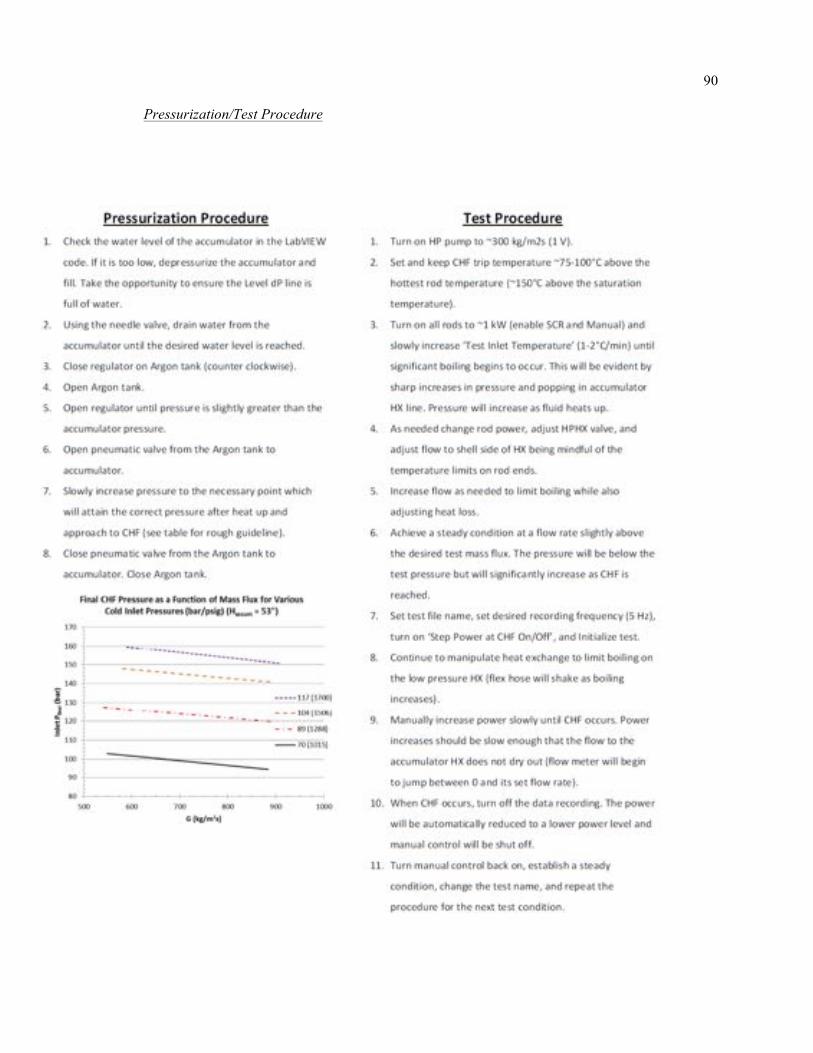
90
Pressurization/Test Procedure

NEUP 11-3080
Critical Heat Flux Phenomena at High Pressure & Low Mass Fluxes:
NEUP Final Report Part II - Modeling
PART I: Experiments Michael Corradini (UW PI) and M.Scott Greenwood
Department of Engineering Physics, UW-Madison [email protected]
PART II: Modeling
Qiao Wu (OSU Co-PI) and Jeff Luitjens Department of Nuclear Engineering, Oregon State University
October 15, 2014

Development of a Mechanistic
Critical Heat Flux Correlation
ABSTRACT
In industry the understanding of the limits of the boiling heat transfer mode is crucial to modeling
the thermal hydraulic processes that occur and to ensure the safe operation of industrial plants;
especially in nuclear power plants which are characterized by relatively high heat fluxes. At high
heat fluxes a critical point is reached where the heat removal mechanism(s) is not sufficient
enough to remove energy from the surface. This heat flux is referred to the critical heat flux
(CHF). When the CHF point is reached the surface temperature rises due to the inability to
remove the energy from the surface. This results in temperatures often greater than the melting
temperature of the surface. Understanding of the heat transfer processes and the transitions
involved is needed to appropriately model the mechanisms of the heat transfer modes to predict
the onset of CHF to prevent such scenarios.
Currently the mechanisms of boiling heat transfer are not well understood and rely heavily on
empirical correlations and lookup tables. This results in correlations that are often very specific
to the scope of the developmental application often resulting from the lack of modeling of
mechanistic behaviors. Modeling of the mechanistic process can result in a broader applicability
of a developed model. Focus here will be given to the development of a mechanist based low-
flow critical heat flux correlation based on mass, momentum, and energy conservation
equations.
The ability to develop a mechanistic based model allows for more confidence in the conceptual
design phase of facilities that utilize high heat flux conditions. It also allows for the development
for a more mature correlation. This has a significant effect on operating costs of high heat flux
operating facilities in terms of margin management. A better understanding of one’s limits with
higher confidence allows for reduction in the unnecessary margin that is used to account for any
uncertainties in the utilized correlation. This reduction in margin allows for facilities to operate at
a higher capacity increasing capital.
TABLE OF CONTENTS ABSTRACT ................................................................................................................................... 2
List of Figures ............................................................................................................................... 5
List of Tables ................................................................................................................................ 5
1. INTRODUCTION ................................................................................................................. 6
1.1. Motivation ....................................................................................................................... 6
2. UNIVERSITY OF WISCONSIN TEST FACILITY OVERVIEW ............................................ 6
2.1. Low Pressure Test Facility ............................................................................................. 6
2.2. High Pressure Test Facility ............................................................................................ 8
3. Comparison of Existing Correlations to Data ...................................................................... 9
4. MODEL DEVELOPMENT AND METHODOLOGY ........................................................... 12
4.1. Heat Transfer Modes .................................................................................................... 12
4.2. Bubble Forces Perpendicular to a Vertical Heated Surface ......................................... 13
4.2.1. Surface Tension ( Fσ ) ........................................................................................ 14
4.2.2. Inertial Force ( inertF ) .......................................................................................... 14
4.2.3. Virtual Mass Force ( vmF ) ................................................................................... 15
4.2.4. Bubble Shear Lift Force ( sLF ) ............................................................................ 16
4.3. Net Force Balance ........................................................................................................ 18
4.4. Closure Relations ......................................................................................................... 19
4.4.1. Surface Cavity Size ........................................................................................... 20
4.4.2. Bubble Contact Angle ........................................................................................ 21
4.4.3. Bubble Contact Radius and Bubble Radius ...................................................... 21
4.4.4. Wall Superheat .................................................................................................. 21
4.4.5. Nucleation Site Density ..................................................................................... 21
4.4.6. Convective Heat Flux Correlation ...................................................................... 23
4.5. Model Implementation Algorithm .................................................................................. 23
5. Results .............................................................................................................................. 25

5.1. Nodalization .................................................................................................................. 25
5.2. Calibration .................................................................................................................... 25
5.3. Convergence Criteria ................................................................................................... 26
5.4. Critical Rod Power ........................................................................................................ 27
5.5. Critical Heat Flux Value ................................................................................................ 28
5.6. Critical Heat Flux Location ........................................................................................... 30
6. Conclusions ....................................................................................................................... 32
7. REFERENCES .................................................................................................................. 33
LIST OF FIGURES
Figure 2-1 Cross-sectional view of the University of Wisconsin high pressure test facility. .......... 8
Figure 2-2 Power profile and thermocouple placement of Wisconsin university high pressure test
facility. ........................................................................................................................................... 8
Figure 3-1 CHF Correlation comparisons to CHF data. .............................................................. 11
Figure 3-2 Subset of CHF Correlation comparisons to CHF data. ............................................. 11
Figure 4-1 Bubble perpendicular force balance on a vertically aligned heated surface. ............ 13
Figure 4-2 Activated minimum cavity size versus wall superheat ............................................... 20
Figure 4-3 Nucleation site density correlation comparison to experimental data from Basu [11] 22
Figure 4-4 Correlation algorithm for determining critical heat flux. ............................................. 24
Figure 5-1 Nodalization of critical heat flux model. ..................................................................... 25
Figure 5-2 Relation between system pressure and minimum active cavity radius. .................... 26
Figure 5-3 Convergence process for determine critical heat flux. .............................................. 27
Figure 5-4 Model pin critical power comparison to experimental data. ....................................... 28
Figure 5-5 Model critical heat flux value comparison to experimental data. ............................... 29
Figure 5-6 Model critical heat flux comparison to experimental data. ......................................... 30
LIST OF TABLES
Table 2-1 Low pressure experimental test conditions for Avery [1]. ............................................. 7
Table 2-2 Low pressure experimental test results for Avery [1]. ................................................... 7
Table 2-3 High pressure experimental test conditions for Avery. ................................................. 9
Table 2-4 High pressure experimental test results for Avery. ....................................................... 9
Table 3-1 Subset of critical heat flux correlation in literature. ..................................................... 10
Table 5-1 Model performance on predicting the critical heat flux. .............................................. 27
Table 5-2 Model performance on predicting the critical heat flux. .............................................. 29
Table 5-3 Model performance on predicting the critical heat flux location. ................................. 30
1. INTRODUCTION
1.1. Motivation
Many methods exist in literature aiming to predict the onset of the critical heat flux. Many
of which are developed for specific geometric and fluid conditions with upwards of 40%
error. This limits the potential broad applicability of a developed model. It is believed that
the development of a mechanistic based critical heat correlation will be more suited to
allow for the development a more broadly applicable correlation by means of modeling
the surface behavior through conventional mass, force, and energy balances.
Development of a physics based relation is believed to remove the heavy dependence
on geometry and fluid conditions as long as these characteristics are captured by the
physical model itself.
The ability to develop a widely applicable model allows for more confidence in
conceptual design phase of facilities that utilize high heat flux conditions. It also allows
for the development for a mature correlation in which the error is greatly reduced (as
much as half of the conventional reported error). This has a significant effect on the
operating costs of high heat flux operating facilities in terms of margin management. A
better understanding of one’s limits with a higher confidence allows for a reduction in the
unnecessary margin that is used to account for any uncertainties in the utilized
correlation. This reduction in margin allows for facilities to operate at a higher capacity
increasing capital.
2. UNIVERSITY OF WISCONSIN TEST FACILITY OVERVIEW
2.1. Low Pressure Test Facility
The experimental data of Avery [1] is used as the first data set for CHF investigation. A
low-pressure forced flow test facility was constructed with full scale fuel pins simulating
typical conditions of the General Atomics TRIGA reactor. The tested conditions for the
CHF are presented in Table 2-1.
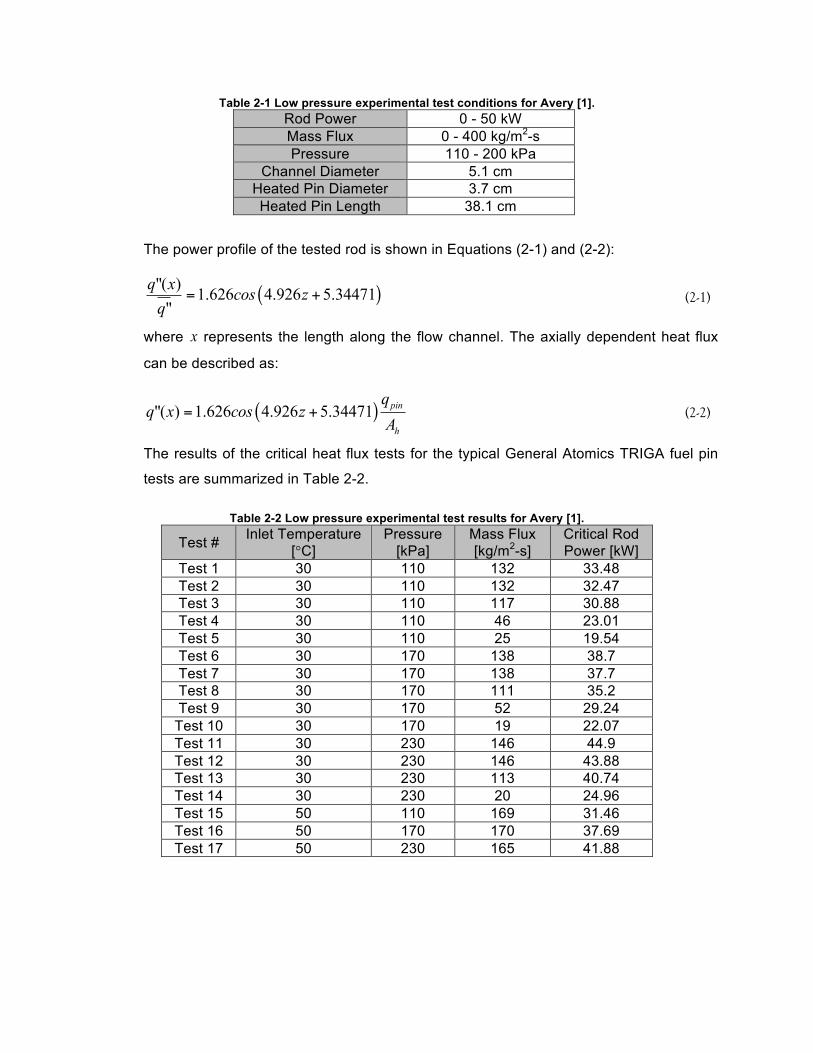
Table 2-1 Low pressure experimental test conditions for Avery [1]. Rod Power 0 - 50 kW Mass Flux 0 - 400 kg/m2-s Pressure 110 - 200 kPa
Channel Diameter 5.1 cm Heated Pin Diameter 3.7 cm Heated Pin Length 38.1 cm
The power profile of the tested rod is shown in Equations (2-1) and (2-2):
( )( ) 1.626 4.926 5.3447""
1q x cos zq
= + (2-1)
where x represents the length along the flow channel. The axially dependent heat flux
can be described as:
( )( ) 1.626 4.926 5.344" 71 pin
h
qq x cos z
A= + (2-2)
The results of the critical heat flux tests for the typical General Atomics TRIGA fuel pin
tests are summarized in Table 2-2.
Table 2-2 Low pressure experimental test results for Avery [1].
Test # Inlet Temperature [°C]
Pressure [kPa]
Mass Flux [kg/m2-s]
Critical Rod Power [kW]
Test 1 30 110 132 33.48 Test 2 30 110 132 32.47 Test 3 30 110 117 30.88 Test 4 30 110 46 23.01 Test 5 30 110 25 19.54 Test 6 30 170 138 38.7 Test 7 30 170 138 37.7 Test 8 30 170 111 35.2 Test 9 30 170 52 29.24
Test 10 30 170 19 22.07 Test 11 30 230 146 44.9 Test 12 30 230 146 43.88 Test 13 30 230 113 40.74 Test 14 30 230 20 24.96 Test 15 50 110 169 31.46 Test 16 50 170 170 37.69 Test 17 50 230 165 41.88
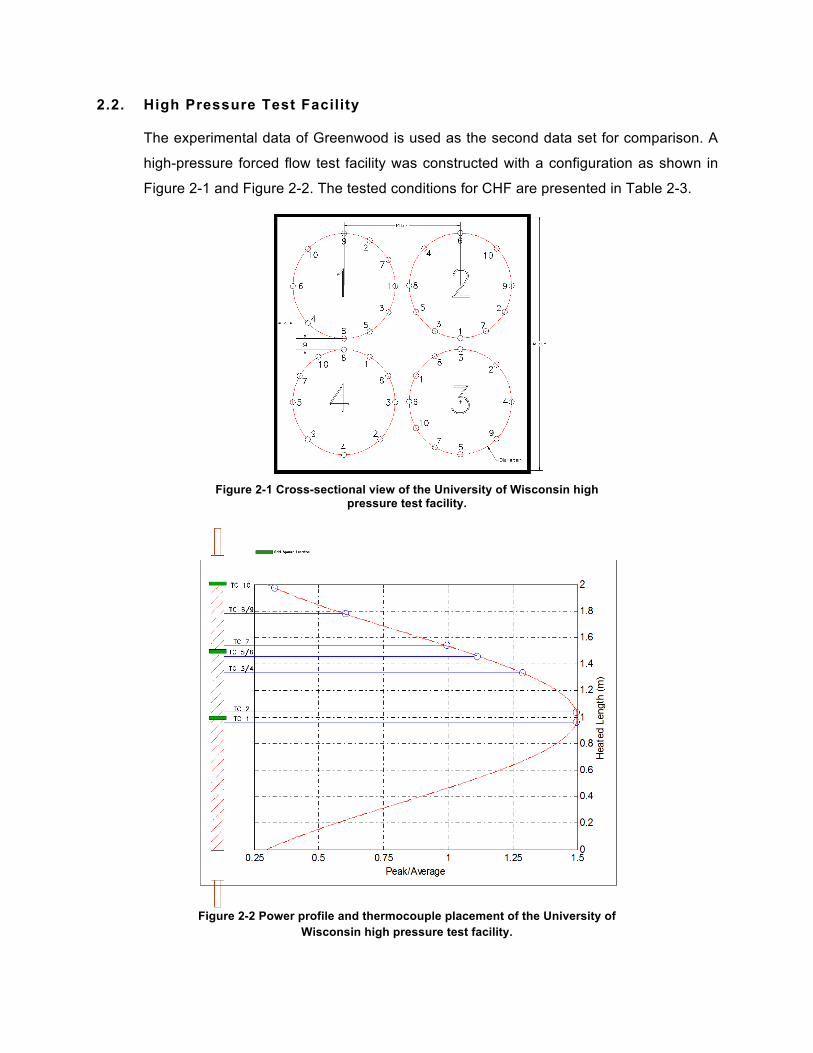
2.2. High Pressure Test Facility
The experimental data of Greenwood is used as the second data set for comparison. A
high-pressure forced flow test facility was constructed with a configuration as shown in
Figure 2-1 and Figure 2-2. The tested conditions for CHF are presented in Table 2-3.
Figure 2-1 Cross-sectional view of the University of Wisconsin high
pressure test facility.
Figure 2-2 Power profile and thermocouple placement of the University of
Wisconsin high pressure test facility.
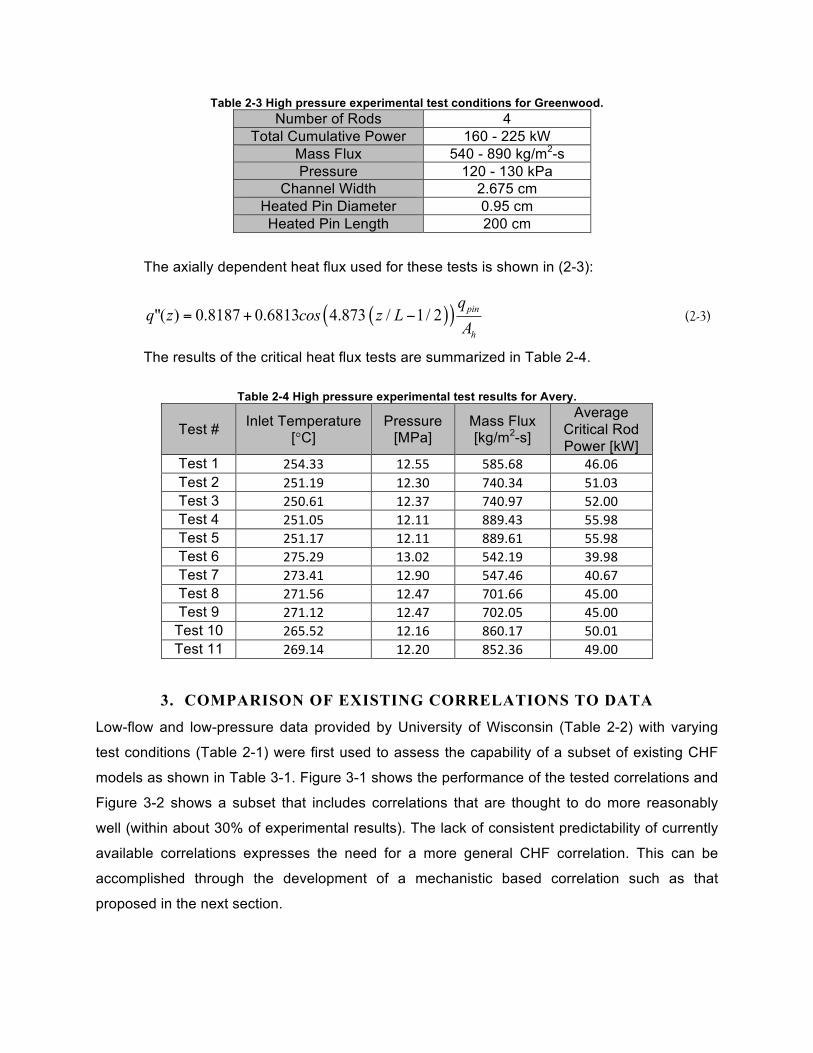
Table 2-3 High pressure experimental test conditions for Greenwood. Number of Rods 4
Total Cumulative Power 160 - 225 kW Mass Flux 540 - 890 kg/m2-s Pressure 120 - 130 kPa
Channel Width 2.675 cm Heated Pin Diameter 0.95 cm Heated Pin Length 200 cm
The axially dependent heat flux used for these tests is shown in (2-3):
( )( )( ) 0.8187 0.6813 4.873 / 1/ 2" pin
h
qq z cos z L
A= + − (2-3)
The results of the critical heat flux tests are summarized in Table 2-4.
Table 2-4 High pressure experimental test results for Avery.
Test # Inlet Temperature [°C]
Pressure [MPa]
Mass Flux [kg/m2-s]
Average Critical Rod Power [kW]
Test 1 254.33 12.55 585.68 46.06 Test 2 251.19 12.30 740.34 51.03 Test 3 250.61 12.37 740.97 52.00 Test 4 251.05 12.11 889.43 55.98 Test 5 251.17 12.11 889.61 55.98 Test 6 275.29 13.02 542.19 39.98 Test 7 273.41 12.90 547.46 40.67 Test 8 271.56 12.47 701.66 45.00 Test 9 271.12 12.47 702.05 45.00
Test 10 265.52 12.16 860.17 50.01 Test 11 269.14 12.20 852.36 49.00
3. COMPARISON OF EXISTING CORRELATIONS TO DATA
Low-flow and low-pressure data provided by University of Wisconsin (Table 2-2) with varying
test conditions (Table 2-1) were first used to assess the capability of a subset of existing CHF
models as shown in Table 3-1. Figure 3-1 shows the performance of the tested correlations and
Figure 3-2 shows a subset that includes correlations that are thought to do more reasonably
well (within about 30% of experimental results). The lack of consistent predictability of currently
available correlations expresses the need for a more general CHF correlation. This can be
accomplished through the development of a mechanistic based correlation such as that
proposed in the next section.
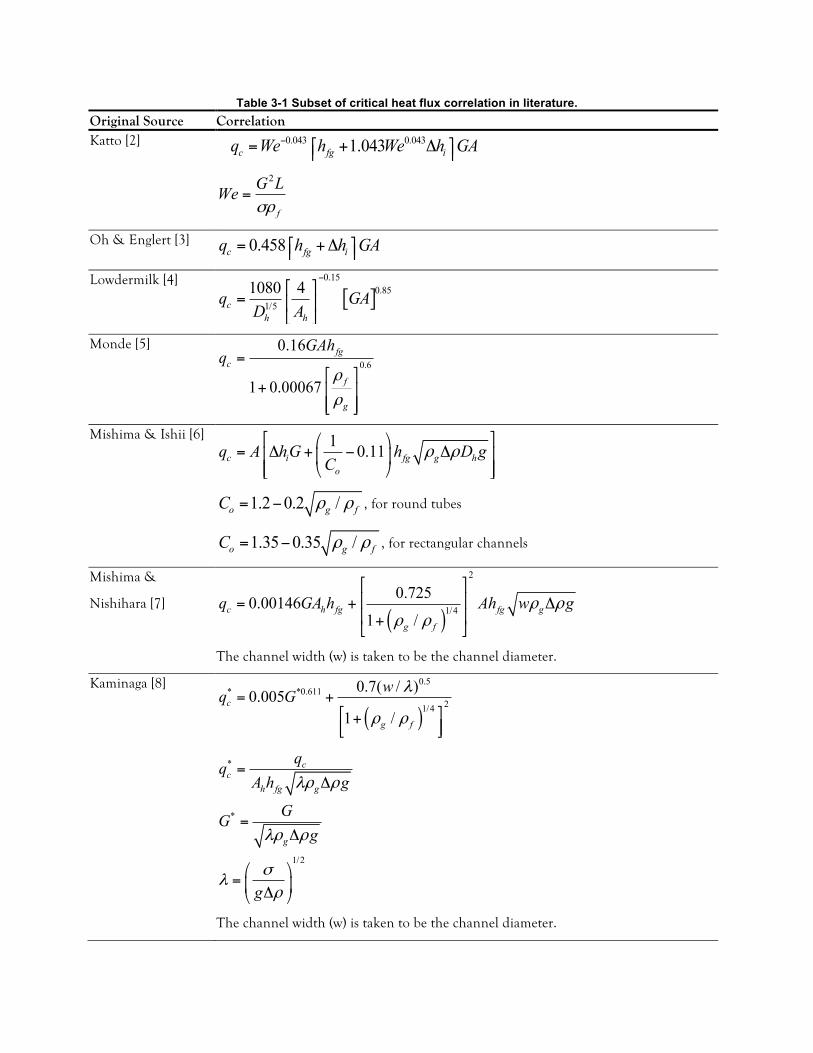
Table 3-1 Subset of critical heat flux correlation in literature. Original Source Correlation Katto [2] 0.043 0.0431.043c fg iq We h We h GA− ⎡ ⎤= + Δ⎣ ⎦
2
f
G LWeσρ
=
Oh & Englert [3] 0.458c fg iq h h GA⎡ ⎤= +Δ⎣ ⎦
Lowdermilk [4]
[ ]0.15
0.851/5
1080 4c
h h
GAD A
q−
⎡ ⎤⎢ ⎥⎣ ⎦
=
Monde [5] 0.6
0.16
1 0.00067 f
g
fgc
GAhq
ρ
ρ
=⎡ ⎤
+ ⎢ ⎥⎢ ⎥⎣ ⎦
Mishima & Ishii [6] 1 0.11c i fg g ho
q A hG h D gC
ρ ρ⎡ ⎤⎛ ⎞
= Δ + − Δ⎢ ⎥⎜ ⎟⎢ ⎥⎝ ⎠⎣ ⎦
1.2 0.2 /o g fC ρ ρ= − , for round tubes
1.35 0.35 /o g fC ρ ρ= − , for rectangular channels
Mishima &
Nishihara [7] ( )
2
1/40.7250.00146
1 /c h fg fg g
g f
gq GA h Ah wρ ρρ ρ
⎡ ⎤⎢ ⎥=⎢ ⎥⎣ ⎦
Δ++
The channel width (w) is taken to be the channel diameter.
Kaminaga [8]
( )
0.* *0.611
2
5
1/4
0.7( /0.0051 /
)
g
c
f
wq G λ
ρ ρ= +
⎡ ⎤+⎢ ⎥⎣ ⎦
1/
*
2
*
h fg
c
g
g
c gq
A h
g
q
Gg
G
λρ ρ
λρ ρ
σλ
ρ
Δ
Δ
⎛ ⎞= ⎜ ⎟Δ⎝ ⎠
=
=
The channel width (w) is taken to be the channel diameter.
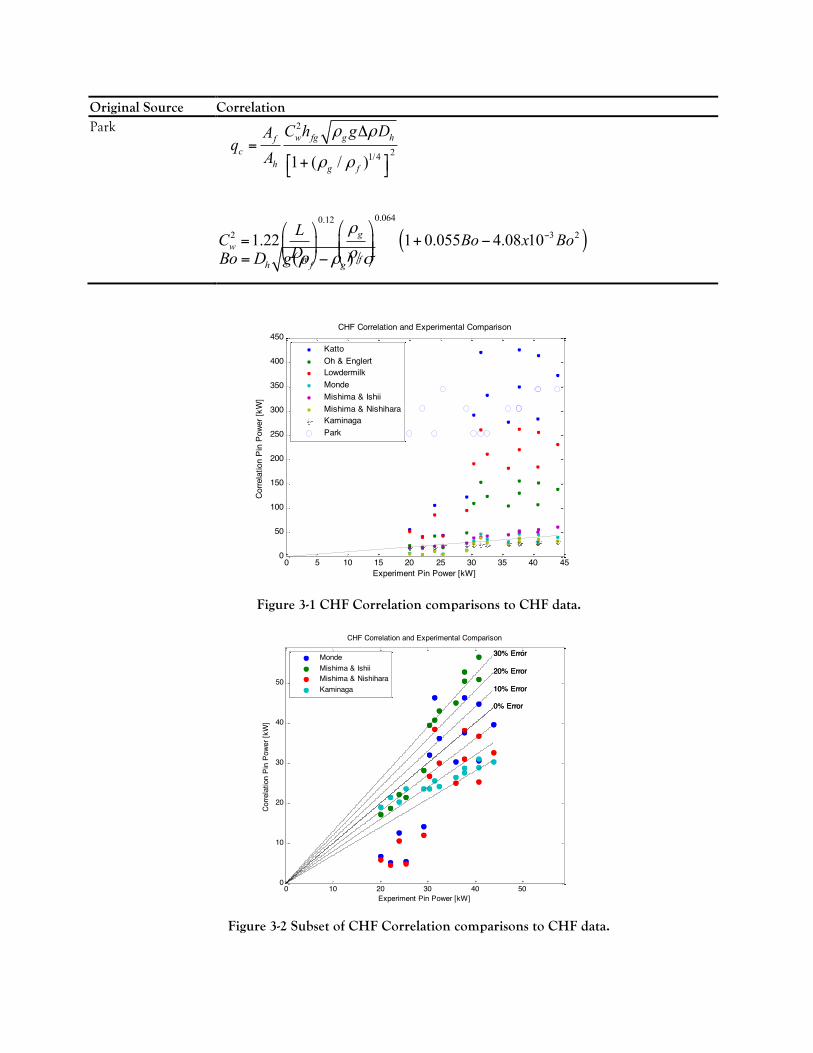
Original Source Correlation Park 2
1 2/41 ( / )fg g
ch
f
wf
h g
DC h gAq
Aρ ρ
ρ ρ=
⎡ ⎤+⎣ ⎦
Δ
( )0.06
3 2
40.122 1.22 1 0.055 4.08 10gw
h f
LC Bo x BoD
ρ
ρ−
⎛ ⎞⎛ ⎞= + −⎜ ⎟⎜ ⎟ ⎜ ⎟⎝ ⎠ ⎝ ⎠( ) /h f gBo D g ρ ρ σ= −
Figure 3-1 CHF Correlation comparisons to CHF data.
Figure 3-2 Subset of CHF Correlation comparisons to CHF data.
0 5 10 15 20 25 30 35 40 450
50
100
150
200
250
300
350
400
450
Experiment Pin Power [kW]
Corre
latio
n Pi
n Po
wer [
kW]
CHF Correlation and Experimental Comparison
KattoOh & EnglertLowdermilkMondeMishima & IshiiMishima & NishiharaKaminagaPark
0 10 20 30 40 500
10
20
30
40
50
Experiment Pin Power [kW]
Corre
latio
n Pi
n Po
wer [
kW]
CHF Correlation and Experimental Comparison
0% Error
10% Error
20% Error
30% Error
0% Error
10% Error
20% Error
30% ErrorMondeMishima & IshiiMishima & NishiharaKaminaga
4. MODEL DEVELOPMENT AND METHODOLOGY
Derived here will be the framework for determining a limiting surface heat flux for flow boiling.
This includes determining the separate heat transfer components that make up the total heat
flux. Focus is given to the phenomena that occur very near the surface (bubble dimensions).
This approach is investigated by relating the forces acting on a bubble growing on a heated
surface within a flow field. The limiting heat removal (critical heat flux) case is hypothesized to
occur at the highest attainable boiling frequency at a nucleation site. The highest attainable
boiling frequency implies that at the same time a bubble departs from a nucleation site the next
bubble immediately begins to grow. This model does not depend on the coalescence of
departed bubbles away from the surface.
For heat transfer to occur from the local superheated fluid to the bubble (evaporation) the
bubble internal temperature must be lower than the local fluid superheat temperature. When the
bubble internal vapor temperature equals the local superheat temperature the evaporative heat
transfer ceases. It is thus assumed that this represents the maximum potential for boiling heat
transfer and the bubble(s) are assumed to be at its maximum potential internal vapor
temperature set equal to the wall temperature.
4.1. Heat Transfer Modes
The total surface heat flux can be partitioned into the following components:
" convective heat fluxq φ −
" evaporative (interface) heat fluxIq −
" transient conduction heat fluxtransq −
" sliding heat fluxslideq −
(4-1)
The total heat flux is then expressed as:
" " " " "Ito trta ans slidelq q q q qφ= + + + (4-2)
It is assumed that the heat flux at the surface is high enough (due to the CHF condition)
such that the bubble generation rate is continuous at a given nucleation site. Also, due to
the high heat flux the bubble departure from a cavity and bubble lift-off from the surface
are assumed coincident (i.e. the bubble does not slide on the heated surface). With
these assumptions liquid is not allowed to occupy the region of the previous departed
bubble nor is there a displacement of liquid along the surface where boiling does not

occur. Thus the transient conduction heat flux mechanism at the nucleation site and heat
removal from sliding of a bubble along the surface is not present and Equation (4-5) can
be simplified to:
" " "total Iq q qφ= + (4-3)
Relations describing the evaporative interfacial energy transfer and the single phase
heat transfer are developed in the following sections.
4.2. Bubble Forces Perpendicular to a Vertical Heated Surface
For a vertically aligned flow channel the assumed forces acting perpendicular to a
heated surface are:
• surface tension force
• inertial (evaporative) force
• virtual mass inertial force
• bubble shear lift force
These forces are outlined in Figure 4-1. The forces in action on this volume are
described in the following sub-sections. For this analysis only the forces perpendicular to
the surface are assumed to participate in the departure of the bubble. The parallel forces
are assumed to be equal and opposite.
Fi
Fσ
g
x
y
Fσ
Hb
rb
rc
Fvm
vb,i
Gθ
FsLa
virtual mass
Figure 4-1 Bubble perpendicular force balance on a vertically aligned
heated surface.
4.2.1. Surface Tension ( Fσ )
The surface tension force describes the force along the bubble interface contact line
with the surface. This forces works to keep the bubble interface attached to the
surface. This force is expressed as:
, 2 ( )surface tensionradius of vapor and solid contact arealiquid-vapor-solid interface contact angle
yF asin
a
σ πσ θ
σ
θ
=
=
=
=
(4-4)
4.2.2. Inertial Force ( inertF )
The inertial force derives from the bubble growth rate due to the interfacial mass
transfer across the bubble interface. This evaporation is proportional to the heat flux
and the bubble size (interfacial area). Due to symmetry and neglecting advancing
versus receding contacting angles of the bubble, the inertial forces in the direction
parallel to the heated surface negate each other. In the direction perpendicular to the
surface there is a net inertial force projected above and away from the interface of the
bubble.
,( )
inert yd mv m vF v mdt t t
∂ ∂= = +
∂ ∂ (4-5)
The bubble surface velocity perpendicular to the plate is determined by an energy
balance of the growing bubble. The bubble here is assumed to have a spherical
shape as shown in Figure 4-1. An energy balance of the bubble yields:
bv fg I b
dVh q Adt
ρ ʹ′ʹ′= (4-6)
The terms Iqʹ′ʹ′ and bA represent the heat transfer rate at the bubble interface and the
total bubble interface surface area. The volume of a spherical shaped bubble is:
( )2 236b b bV H a Hπ
= + (4-7)
where a is the vapor-solid contact area radius and bH is the bubble height from the
surface to the bubble cap, both of which vary with time as the bubble grows. The total
surface area of a spherical shaped bubble is:
( )2 22b b b bA r H a Hπ π= = + (4-8)
Inserting these geometric relations into the bubble interface velocity (Equation (4-6))
perpendicular to the heated surface results in the following expression:
( ) ( )2 2 2 2
2b
v fg b i bdHh a H q a Hdt
πρ πʹ′ʹ′+ = + (4-9)
,2b i
b iv fg
dH qvdt hρ
ʹ′ʹ′= = (4-10)
It is noted that the interface velocity is independent with time with the assumption that
the interfacial heat flux is also constant with time (quasi steady state).
Using the defined boundary in Figure 4-1 the mass evaporation rate at the interface is
found similarly using the energy balance equation:
,bfg I bdmh q Adt
ʹ′ʹ′= (4-11)
( )2 2.
.i bbb
fg
q a Hdmmdt h
πʹ′ʹ′ += = (4-12)
Inserting Equation (4-10) and Equation (4-12) into Equation (4-5) and noting that
since the rate of change of the bubble height is zero the inertial force for is then:
( )2 2 2
, ,bb i
inert y b ifg v
a Hdm qF vdt h
π
ρʹ′ʹ′
+⎛ ⎞= = ⎜ ⎟⎜ ⎟
⎝ ⎠ (4-13)
4.2.3. Virtual Mass Force ( vmF )
The virtual mass inertial force derives from the bubble growth rate due to the
evaporation rate but effects the immediate surrounding 'thin layer' of liquid around the
bubble interface which acts and moves with the bubble. Here virtual mass acts an
extension to the bubble. The equations developed here will be derived where the
virtual mass constant ( vmC ) can be substituted depending on the relation desired.
The induced mass inertial force is written similarly to the bubble inertial mass except
that the liquid density is used and the virtual mass volume is related to the bubble
volume by:
vm vm bV C V= (4-14)
The mass exchange across the virtual mass interface is evaluated as:
, ,,
( )vm b i b ivmvm b i vm
d m v vmF v mdt t t
∂∂= = +
∂ ∂ (4-15)
Sincem Vρ= , vm vm bV C V= than lvm vm b
v
m C mρρ
= , the virtual mass force can be written
as:
, ,,
( ) ( )vm b i b b il lvm vm vm inert y
v v
d m v d m vF C C F
dt dtρ ρρ ρ
= = = (4-16)
( )2 2 2bl i
vm vmv fg v
a HqF Ch
πρρ ρ
ʹ′ʹ′+⎛ ⎞
= ⎜ ⎟⎜ ⎟⎝ ⎠
(4-17)
4.2.4. Bubble Shear Lift Force ( sLF )
The bubble shear lift force results from the entrainment phenomena on a bubble from
the bulk fluid movement parallel to the surface. The result of adding this force is to aid
in bubble removal from the surface and will thus result in a decrease in the maximum
heat flux required to remove a bubble from the surface. With the increase of this force
the evaporative potential will decrease but there will be a counter increase in the
convective heat flux.
The lift force as derived by Klausner and Mei [9] is expressed as:
2 21 ( )2sL L l l bF C u y rρ πʹ′= (4-18)
where yʹ′ is the bubble center of mass distance from the wall approximated here as
/ 2by Hʹ′ ≈ . The lift coefficient is expressed by [9] as:
1 12 22 43.877 0.014003L s b sC G Re G−⎡ ⎤= +⎣ ⎦ (4-19)

with
( )l
sl
du yGdy u y
= (4-20)
( )b lb
l
r u yReν
ʹ′= (4-21)
Using the standard turbulent velocity profile near the wall:
* /l l
w l
u uuu τ ρ
+ = = (4-22)
* /w l
l l
yyuyτ ρ
ν ν+ = = (4-23)
The bubbles are assumed to be of a small size thus the distance from the center of
the bubble to wall is assumed to be small with a 5y+ ≤ then:
.y u+ += (4-24)
The wall shear stress is calculated as:
212w f l lC Uτ ρ= (4-25)
where lU is the volumetric average velocity. Then the wall shear stress is defined as:
4fCλ
= (4-26)
3 50.25
0.237 5 6
64 , Re 2320
0.3164 , 4 10 Re 10
0.0032 0.221Re , 10 2 10
Re
xRe
Re x
λ
−
⎧ <⎪⎪⎪
= < <⎨⎪
+ < <⎪⎪⎩
(4-27)
The differential term of Equation (4-20) is evaluated with Equation (4-22) and
Equation (4-23):
2*
.l
l
du u dudx dxν
+
+= (4-28)
Based on the assumption from Equation (4-24) and inserting the definition of the non-
dimensional velocity (Equation (4-22)):
2*
.l w
l l
du udx
τν µ
= = (4-29)
This can be integrated to yield the expected result:
( ) .wl
l
u y yτµ
= (4-30)
where ( 0) 0lu y = = as a result of the no-slip condition at the wall. This again assumes
a linear velocity profile very near the wall ( 5y+ ≤ ). For the case of analyzing the
critical conditions for bubble lift off, inserting Equation (4-29) and Equation (4-30) into
the expression for sG (Equation (4-20)) it is found that sG simplifies to 1.
1.( )
l ws
wl l
l
du y yGdx u y y
ττµµ
= = = (4-31)
It is noted that this equation is only valid for distances very near to the wall for 5y+ ≤
(i.e. very small bubble sizes). With the derived relations above, the shear lift force
induced on a growing bubble by a flow parallel to the surface can be determined.
4.3. Net Force Balance
Combining the results of all the individual forces derived results in a net force balance.
The balance equation for the forces studied here is expressed as:
, ,y inert y vm sLF F F Fσ = + + (4-32)
( ) ( )2 22 2 2 22 2/2
2 ( )
1 |2
b bi l ivm L l l H b
fg v v fg v
asin
a H a Hq qC C u rh h
πσ θ
π πρρ π
ρ ρ ρʹ′ʹ′ ʹ′ʹ′
=
+ +⎛ ⎞ ⎛ ⎞+ +⎜ ⎟ ⎜ ⎟⎜ ⎟ ⎜ ⎟
⎝ ⎠ ⎝ ⎠
(4-33)
Solving for the interfacial heat flux ( iqʹ′ʹ′ ), the evaporative component of the heat flux from
a single bubble represented in Equation (4-3) can be expressed as:
( )
1/2
2 2/2
2 2
2
12 ( ) |2
1
L l l H b
ib l
vmv fg v
asin C u rq
a HC
h
πσ θ ρ π
π ρρ ρ
⎛ ⎞⎜ ⎟−⎜ ⎟ʹ′ʹ′= ⎜ ⎟+ ⎛ ⎞⎜ ⎟+⎜ ⎟⎜ ⎟⎝ ⎠⎝ ⎠
(4-34)
The fractional boiling area is determined from the nucleation site area density ( Na ), the
average bubble size ( bA ), and the total heated area ( hA ).
bboil h b
h
Af NaA NaAA
= = (4-35)
The total contribution to the convective heat flux is then:
1conv boilf f= − (4-36)
The Nusselt number for the convective heat transfer coefficient is determined from
standard single phase convective relations such that:
conv c
f
h LNuk
= (4-37)
and
( )1 conv w bulkq h T Tφʹ′ʹ′ = − (4-38)
The total heat transfer is then expressed as:
( )( )
1/2
2 2/2
2 2
2
12 ( ) |2(1 )
1
L l l H b
total conv w bulk boil boilb l
vmv fg v
asin C u rq h T T f f
a HC
h
πσ θ ρ π
π ρρ ρ
⎛ ⎞⎜ ⎟−⎜ ⎟ʹ′ʹ′ = − − + ⎜ ⎟+ ⎛ ⎞⎜ ⎟+⎜ ⎟⎜ ⎟⎝ ⎠⎝ ⎠
(4-39)
This equation will give the maximum potential heat transfer for flow boiling and will be
compared to experimental work in the following section.
4.4. Closure Relations
A set of closure relations are necessary in-order to obtain a final solution. The remaining
parameters to be defined are:
• nucleation site cavity size
• bubble-surface contact angle
• bubble-surface contact radius
• bubble radius
• wall superheat
• nucleation site density
• convective heat flux
The choice and justification for each parameter and relation is described in the following
subsections.
4.4.1. Surface Cavity Size
Hino and Ueda [10] reported that for R113 on a stainless steel surface the maximum
cavity size ranged from 0.22 microns to 0.34 microns. An average cavity size of 0.35
microns is used in this study for all conditions assuming similar surface conditions. It
is noted however that a distribution of cavity sizes is expected with the total
availability of cavities increasing with increasing wall superheat. The can be seen by
investigation of Figure 4-2 with the use of the Clausius-Clapeyron relation:
2 satw
c
TTrν
σλρ
=Δ (4-40)
Figure 4-2 Activated minimum cavity size versus wall superheat
The net integrated number of nucleation sites increases with increasing wall
superheat conditions.
0.00
0.10
0.20
0.30
0.40
0.50
0.60
0.70
0 5 10 15 20 25 30 35
Cavity Radius [m
icron
]
Wall Superheat [C]
4.4.2. Bubble Contact Angle
A contact angle of 45.0o is assumed.
4.4.3. Bubble Contact Radius and Bubble Radius
The bubble radius ( br ) is taken to be an average radius calculated by the average
cavity size (Section 4.4.1) where the bubble radius is calculated from the cavity size
and contact angle by Equation (4-41).
sin( )barθ
= (4-41)
The bubble radius is used in combination with the contact angle to determine the
bubble height as:
( )1 ( )b bH r cos θ+= (4-42)
4.4.4. Wall Superheat
The wall superheat for Equation (4-45) is approximated by a static force balance on a
bubble in contact with a surface:
2
c
Prσ
Δ = (4-43)
The cavity size here is taken to be smallest active cavity size and differs from the
average active cavity size. The smallest active cavity size is the calibration factor for
experimental and model results and is dependent on the surface conditions. This
method is employed since detailed surface temperature is not known from
experimental results. Based on the internal vapor pressure the wall superheat is
approximated as the saturation temperature at the bubble internal pressure:
( )w satT T Pν≈ (4-44)
4.4.5. Nucleation Site Density
The nucleation site density as a function of wall superheat was fit by Basu [11] based
on experimental data. Most data was correlated to within 40% as shown by Figure
4-3.
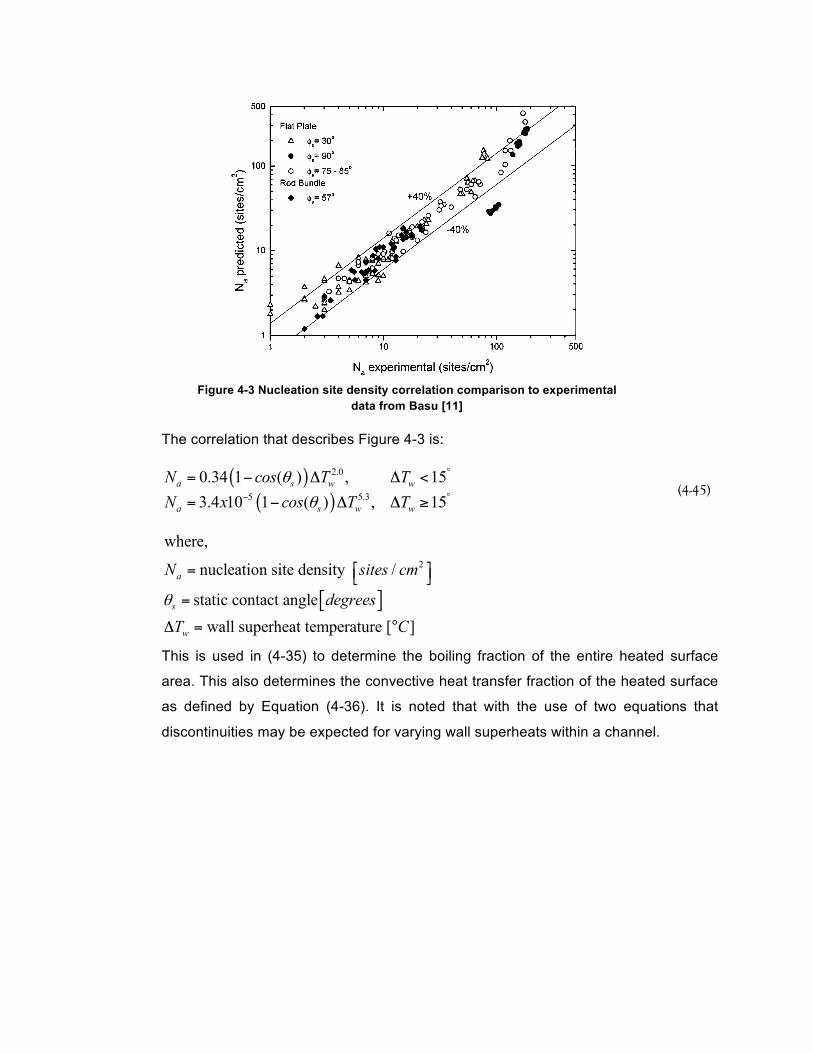
Figure 4-3 Nucleation site density correlation comparison to experimental
data from Basu [11]
The correlation that describes Figure 4-3 is:
( )( )
2.0
5 5.3
0.34 1 ( ) , 153.4 10 1 ( ) , 15
a s w w
a s w w
N cos T TN x cos T T
θ
θ
°
− °
= − Δ Δ <
= − Δ Δ ≥ (4-45)
[ ]
2
where,
nucleation site density /
static contact anglewall superheat temperature [ ]
a
s
w
N sites cm
degreesT C
θ
⎡ ⎤= ⎣ ⎦
=
Δ = °
This is used in (4-35) to determine the boiling fraction of the entire heated surface
area. This also determines the convective heat transfer fraction of the heated surface
as defined by Equation (4-36). It is noted that with the use of two equations that
discontinuities may be expected for varying wall superheats within a channel.
4.4.6. Convective Heat Flux Correlation
The convective heat correlation used is the simple Dittus-Boelter relation:
0.80.023where,
0.4 for heating or 0.3 for cooling
n
p
Nu Re Pr
cPr
kn
µ
=
=
=
(4-46)
This is used in Equation (4-37) to determine the convective heat transfer coefficient.
4.5. Model Implementation Algorithm
An overview of the algorithm proposed for determining the critical heat flux is given in
Figure 4-4. The theoretically derived critical heat flux is solved axially in a flow channel.
This is then compared to experimental data to validate the newly developed mechanistic
model that is centered on a momentum balance of a bubble at a nucleation site.
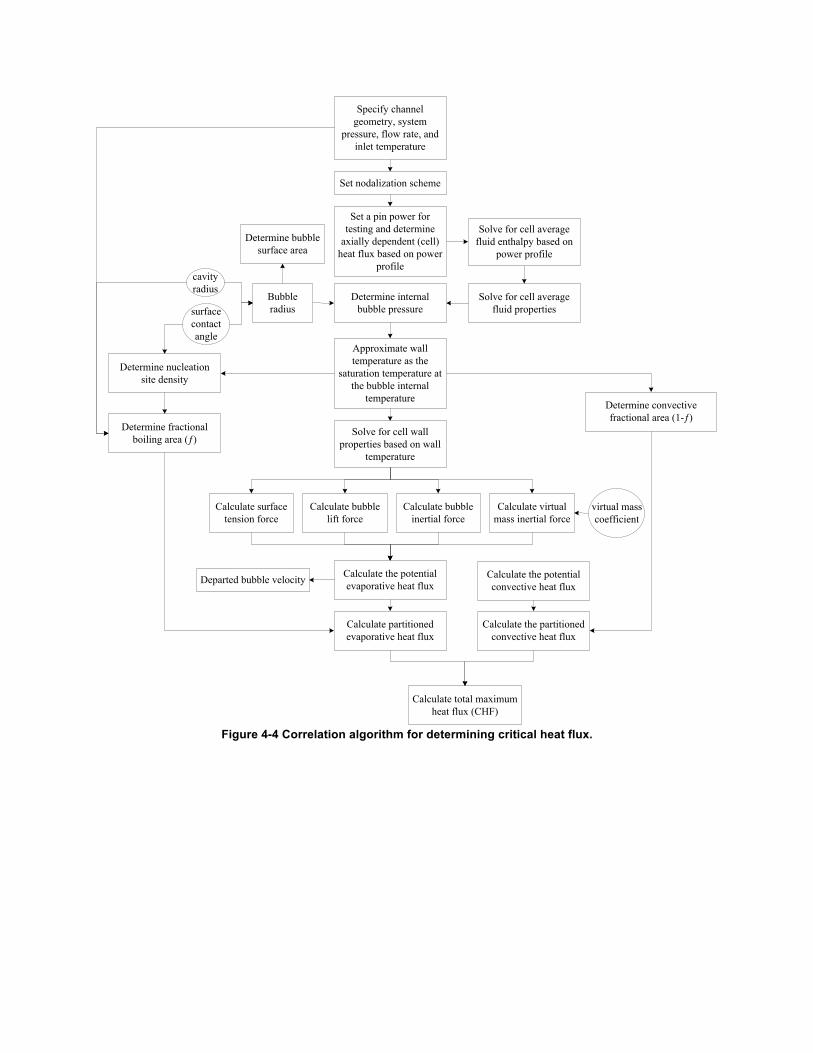
Figure 4-4 Correlation algorithm for determining critical heat flux.
surface contact angle
virtual mass coefficient
cavity radius
Specify channel geometry, system
pressure, flow rate, and inlet temperature
Set a pin power for testing and determine
axially dependent (cell) heat flux based on power
profile
Determine internal bubble pressure
Solve for cell average fluid properties
Solve for cell average fluid enthalpy based on
power profile
Set nodalization scheme
Bubble radius
Determine bubble surface area
Approximate wall temperature as the
saturation temperature at the bubble internal
temperature
Solve for cell wall properties based on wall
temperature
Calculate surface tension force
Calculate bubble lift force
Calculate bubble inertial force
Calculate virtual mass inertial force
Calculate the potential evaporative heat fluxDeparted bubble velocity
Determine nucleation site density
Determine fractional boiling area (ƒ)
Calculate partitioned evaporative heat flux
Calculate the potential convective heat flux
Calculate the partitioned convective heat flux
Determine convective fractional area (1-ƒ)
Calculate total maximum heat flux (CHF)
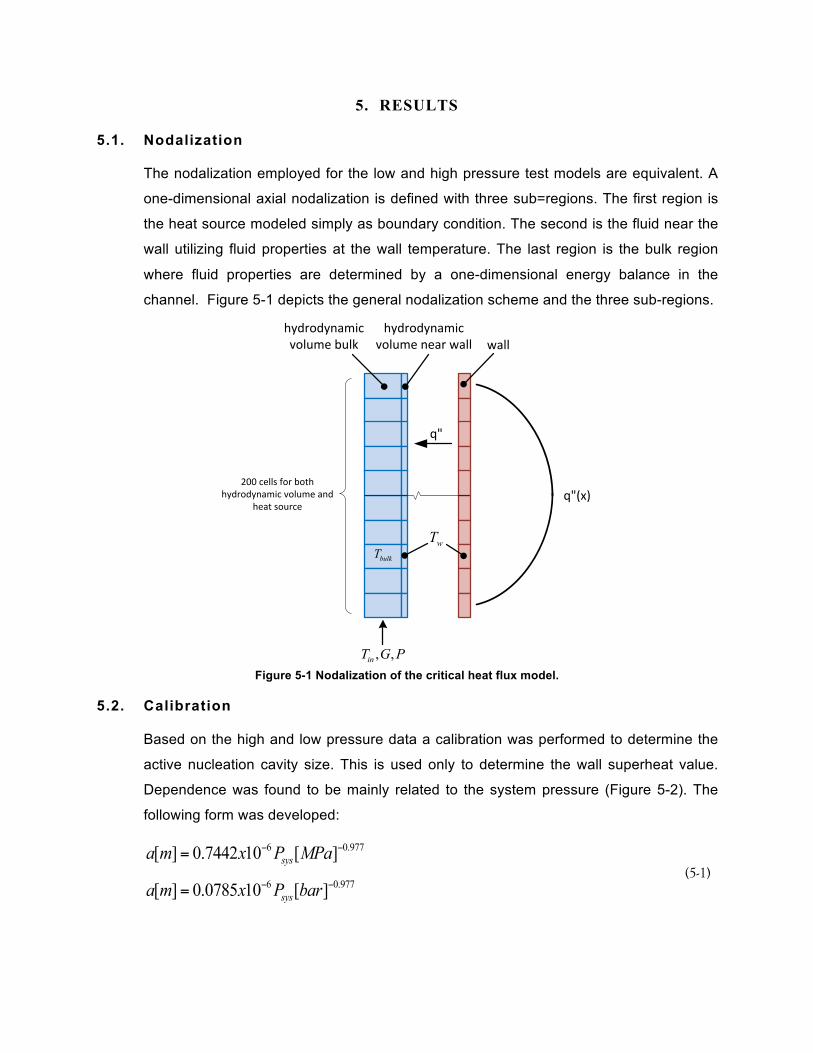
5. RESULTS
5.1. Nodalization
The nodalization employed for the low and high pressure test models are equivalent. A
one-dimensional axial nodalization is defined with three sub=regions. The first region is
the heat source modeled simply as boundary condition. The second is the fluid near the
wall utilizing fluid properties at the wall temperature. The last region is the bulk region
where fluid properties are determined by a one-dimensional energy balance in the
channel. Figure 5-1 depicts the general nodalization scheme and the three sub-regions.
Figure 5-1 Nodalization of the critical heat flux model.
5.2. Calibration
Based on the high and low pressure data a calibration was performed to determine the
active nucleation cavity size. This is used only to determine the wall superheat value.
Dependence was found to be mainly related to the system pressure (Figure 5-2). The
following form was developed:
6 0.9770.7442 1[ ] [ ]0 sysa x Pm MPa− −=
6 0.9770.0785 1[ ] [ ]0 sysa x Pm bar− −= (5-1)
200 cells for both hydrodynamic volume and
heat sourceq"(x)
wTbulkT
hydrodynamic volume bulk
hydrodynamic volume near wall wall
, ,inT G P
q"
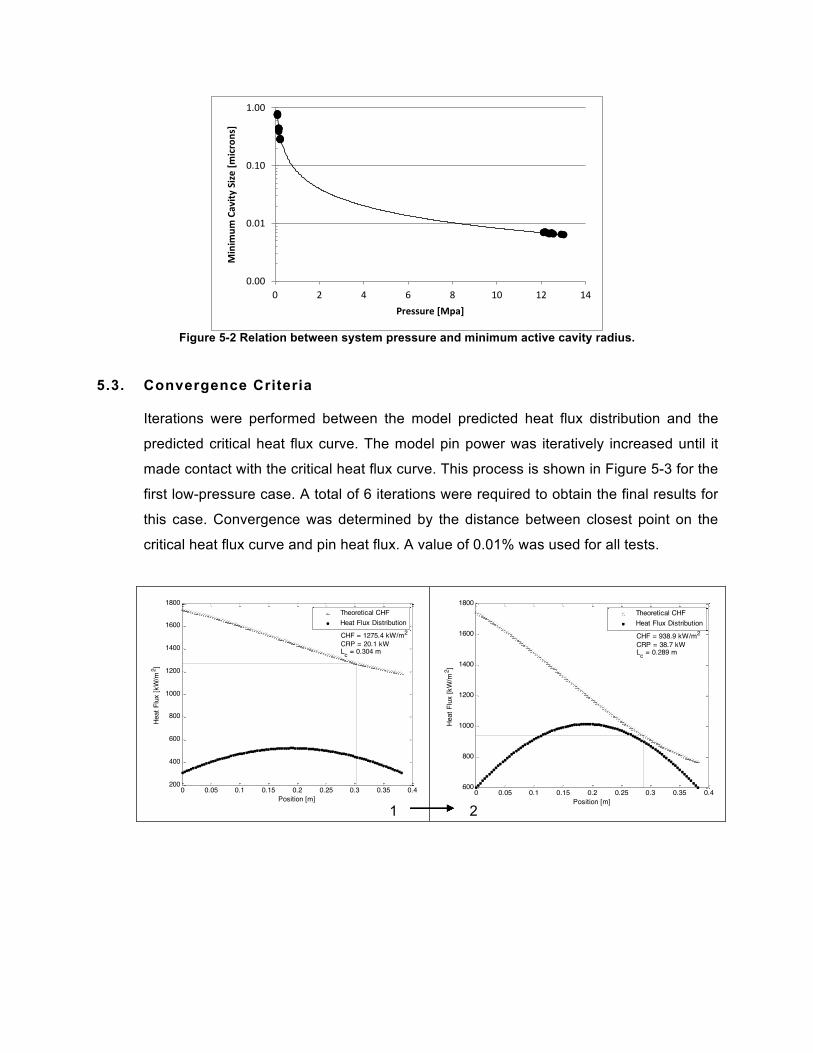
Figure 5-2 Relation between system pressure and minimum active cavity radius.
5.3. Convergence Criteria
Iterations were performed between the model predicted heat flux distribution and the
predicted critical heat flux curve. The model pin power was iteratively increased until it
made contact with the critical heat flux curve. This process is shown in Figure 5-3 for the
first low-pressure case. A total of 6 iterations were required to obtain the final results for
this case. Convergence was determined by the distance between closest point on the
critical heat flux curve and pin heat flux. A value of 0.01% was used for all tests.
0.00
0.01
0.10
1.00
0 2 4 6 8 10 12 14
Minim
um Cavity
Size [m
icrons]
Pressure [Mpa]
0 0.05 0.1 0.15 0.2 0.25 0.3 0.35 0.4200
400
600
800
1000
1200
1400
1600
1800
Position [m]
Heat
Flu
x [k
W/m
2 ]
CHF = 1275.4 kW/m2
CRP = 20.1 kWLc = 0.304 m
Theoretical CHFHeat Flux Distribution
0 0.05 0.1 0.15 0.2 0.25 0.3 0.35 0.4600
800
1000
1200
1400
1600
1800
Position [m]
Heat
Flu
x [k
W/m
2 ]
CHF = 938.9 kW/m2
CRP = 38.7 kWLc = 0.289 m
Theoretical CHFHeat Flux Distribution
1 2
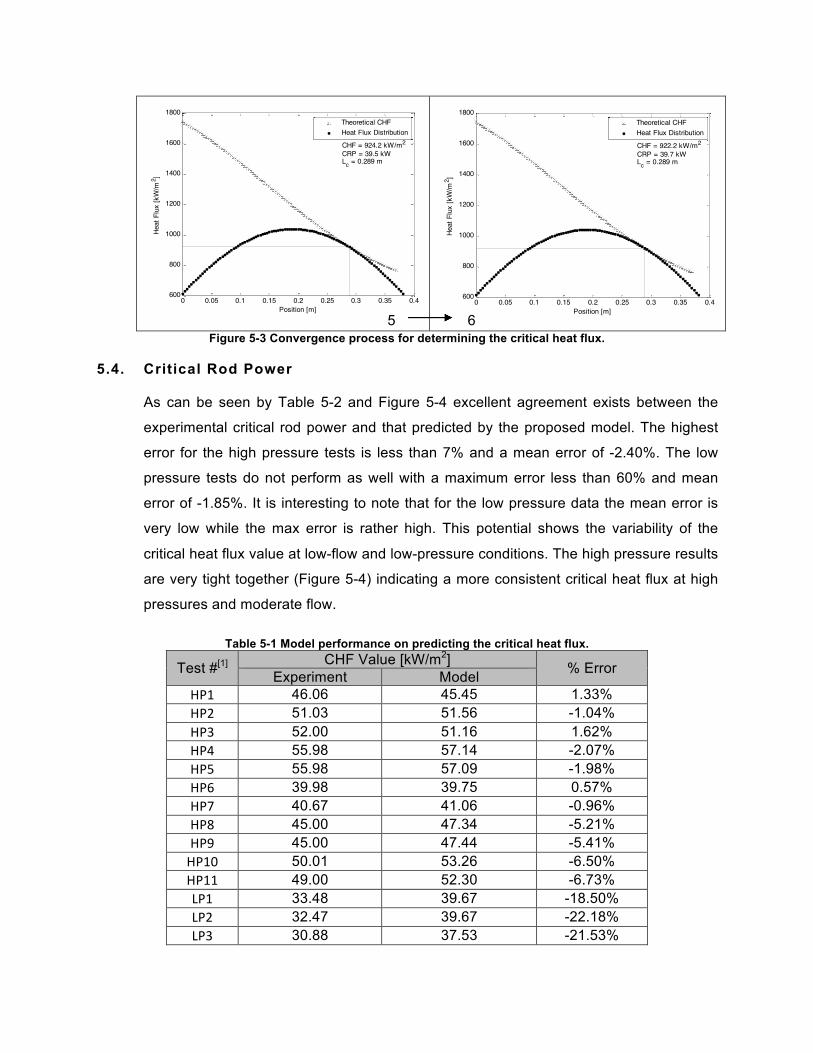
Figure 5-3 Convergence process for determining the critical heat flux.
5.4. Critical Rod Power
As can be seen by Table 5-2 and Figure 5-4 excellent agreement exists between the
experimental critical rod power and that predicted by the proposed model. The highest
error for the high pressure tests is less than 7% and a mean error of -2.40%. The low
pressure tests do not perform as well with a maximum error less than 60% and mean
error of -1.85%. It is interesting to note that for the low pressure data the mean error is
very low while the max error is rather high. This potential shows the variability of the
critical heat flux value at low-flow and low-pressure conditions. The high pressure results
are very tight together (Figure 5-4) indicating a more consistent critical heat flux at high
pressures and moderate flow.
Table 5-1 Model performance on predicting the critical heat flux.
Test #[1] CHF Value [kW/m2] % Error Experiment Model HP1 46.06 45.45 1.33% HP2 51.03 51.56 -1.04% HP3 52.00 51.16 1.62% HP4 55.98 57.14 -2.07% HP5 55.98 57.09 -1.98% HP6 39.98 39.75 0.57% HP7 40.67 41.06 -0.96% HP8 45.00 47.34 -5.21% HP9 45.00 47.44 -5.41% HP10 50.01 53.26 -6.50% HP11 49.00 52.30 -6.73% LP1 33.48 39.67 -18.50% LP2 32.47 39.67 -22.18% LP3 30.88 37.53 -21.53%
0 0.05 0.1 0.15 0.2 0.25 0.3 0.35 0.4600
800
1000
1200
1400
1600
1800
Position [m]
Heat
Flu
x [k
W/m
2 ]
CHF = 924.2 kW/m2
CRP = 39.5 kWLc = 0.289 m
Theoretical CHFHeat Flux Distribution
0 0.05 0.1 0.15 0.2 0.25 0.3 0.35 0.4600
800
1000
1200
1400
1600
1800
Position [m]
Heat
Flu
x [k
W/m
2 ]
CHF = 922.2 kW/m2
CRP = 39.7 kWLc = 0.289 m
Theoretical CHFHeat Flux Distribution
5 6
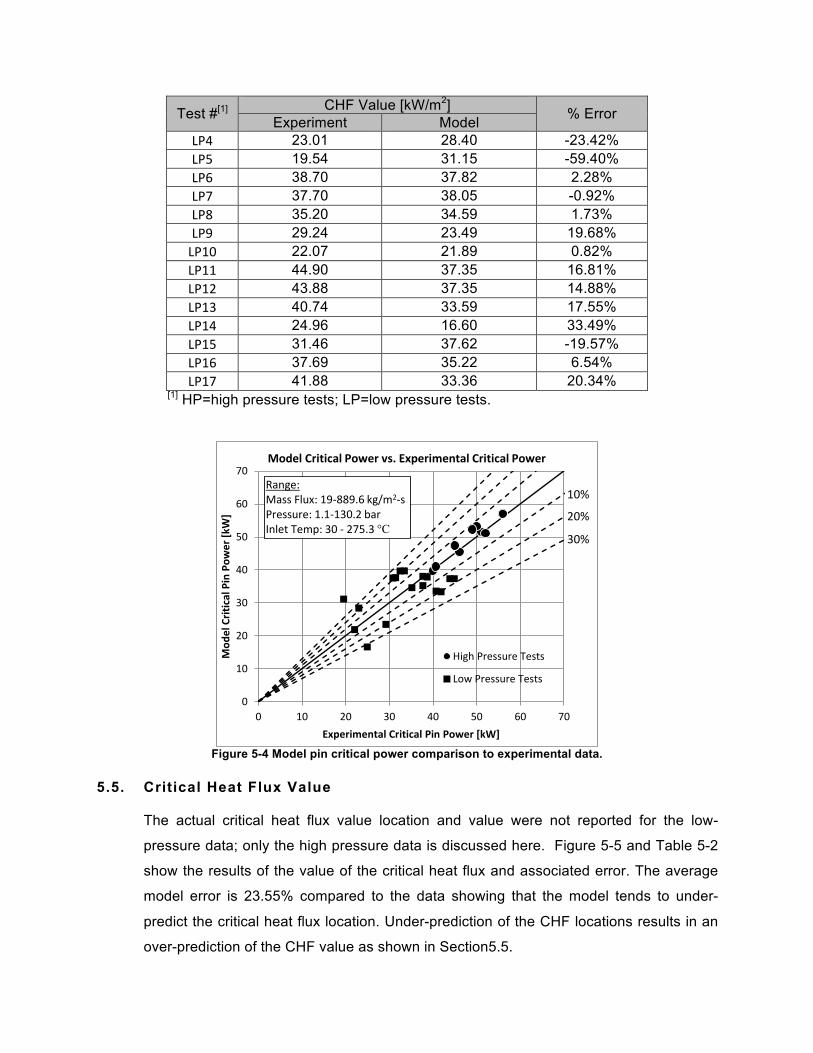
Test #[1] CHF Value [kW/m2] % Error Experiment Model LP4 23.01 28.40 -23.42% LP5 19.54 31.15 -59.40% LP6 38.70 37.82 2.28% LP7 37.70 38.05 -0.92% LP8 35.20 34.59 1.73% LP9 29.24 23.49 19.68% LP10 22.07 21.89 0.82% LP11 44.90 37.35 16.81% LP12 43.88 37.35 14.88% LP13 40.74 33.59 17.55% LP14 24.96 16.60 33.49% LP15 31.46 37.62 -19.57% LP16 37.69 35.22 6.54% LP17 41.88 33.36 20.34%
[1] HP=high pressure tests; LP=low pressure tests.
Figure 5-4 Model pin critical power comparison to experimental data.
5.5. Critical Heat Flux Value
The actual critical heat flux value location and value were not reported for the low-
pressure data; only the high pressure data is discussed here. Figure 5-5 and Table 5-2
show the results of the value of the critical heat flux and associated error. The average
model error is 23.55% compared to the data showing that the model tends to under-
predict the critical heat flux location. Under-prediction of the CHF locations results in an
over-prediction of the CHF value as shown in Section5.5.
0
10
20
30
40
50
60
70
0 10 20 30 40 50 60 70
Mod
el Critical Pin Pow
er [k
W]
Experimental Critical Pin Power [kW]
Model Critical Power vs. Experimental Critical Power
High Pressure Tests
Low Pressure Tests
20%
10%Range:Mass Flux: 19-‐889.6 kg/m2-‐sPressure: 1.1-‐130.2 barInlet Temp: 30 -‐ 275.3 °C
30%
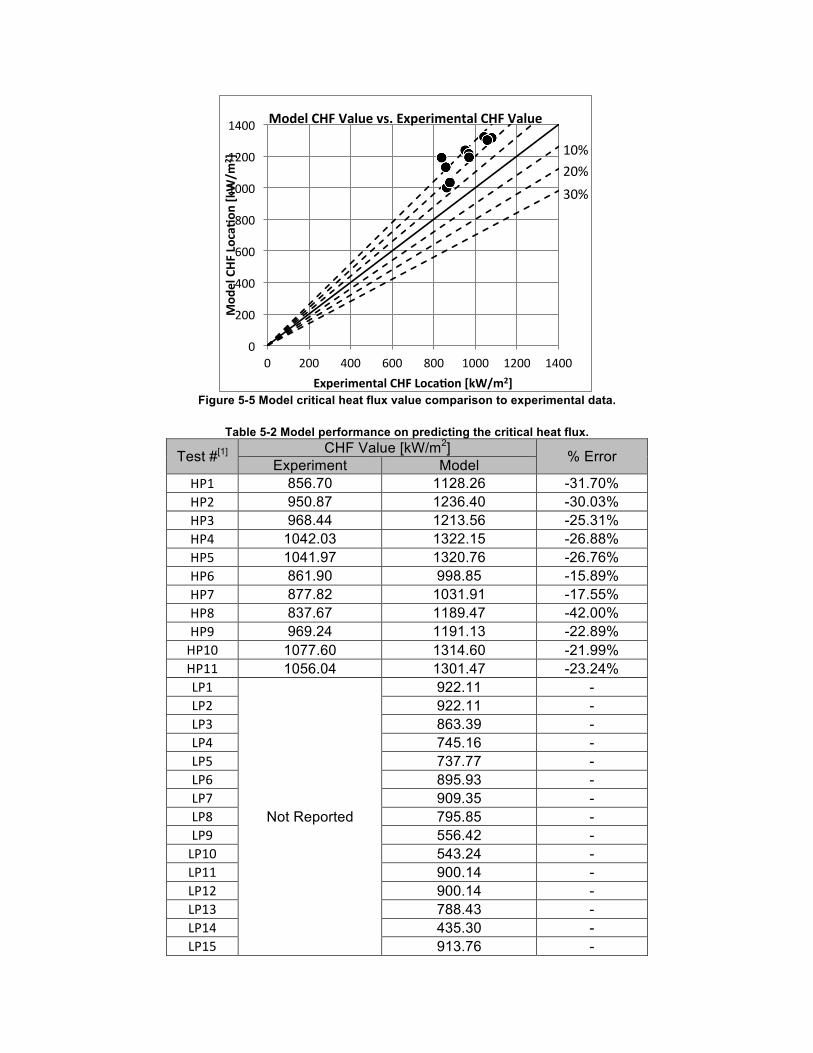
Figure 5-5 Model critical heat flux value comparison to experimental data.
Table 5-2 Model performance on predicting the critical heat flux.
Test #[1] CHF Value [kW/m2] % Error Experiment Model HP1 856.70 1128.26 -31.70% HP2 950.87 1236.40 -30.03% HP3 968.44 1213.56 -25.31% HP4 1042.03 1322.15 -26.88% HP5 1041.97 1320.76 -26.76% HP6 861.90 998.85 -15.89% HP7 877.82 1031.91 -17.55% HP8 837.67 1189.47 -42.00% HP9 969.24 1191.13 -22.89% HP10 1077.60 1314.60 -21.99% HP11 1056.04 1301.47 -23.24% LP1
Not Reported
922.11 - LP2 922.11 - LP3 863.39 - LP4 745.16 - LP5 737.77 - LP6 895.93 - LP7 909.35 - LP8 795.85 - LP9 556.42 - LP10 543.24 - LP11 900.14 - LP12 900.14 - LP13 788.43 - LP14 435.30 - LP15 913.76 -
0
200
400
600
800
1000
1200
1400
0 200 400 600 800 1000 1200 1400
Mod
el CHF
Loca-
on [k
W/m
2 ]
Experimental CHF Loca-on [kW/m2]
Model CHF Value vs. Experimental CHF Value
20% 10%
30%
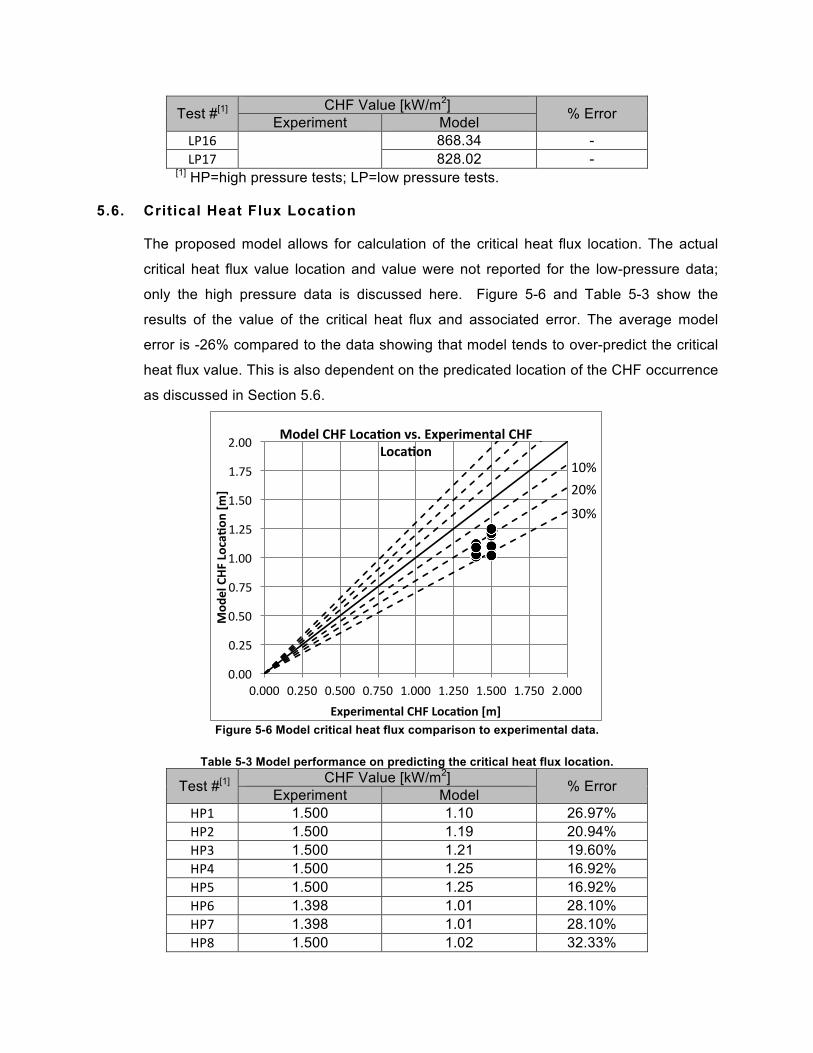
Test #[1] CHF Value [kW/m2] % Error Experiment Model LP16 868.34 - LP17 828.02 -
[1] HP=high pressure tests; LP=low pressure tests.
5.6. Critical Heat Flux Location
The proposed model allows for calculation of the critical heat flux location. The actual
critical heat flux value location and value were not reported for the low-pressure data;
only the high pressure data is discussed here. Figure 5-6 and Table 5-3 show the
results of the value of the critical heat flux and associated error. The average model
error is -26% compared to the data showing that model tends to over-predict the critical
heat flux value. This is also dependent on the predicated location of the CHF occurrence
as discussed in Section 5.6.
Figure 5-6 Model critical heat flux comparison to experimental data.
Table 5-3 Model performance on predicting the critical heat flux location.
Test #[1] CHF Value [kW/m2] % Error Experiment Model HP1 1.500 1.10 26.97% HP2 1.500 1.19 20.94% HP3 1.500 1.21 19.60% HP4 1.500 1.25 16.92% HP5 1.500 1.25 16.92% HP6 1.398 1.01 28.10% HP7 1.398 1.01 28.10% HP8 1.500 1.02 32.33%
0.00
0.25
0.50
0.75
1.00
1.25
1.50
1.75
2.00
0.000 0.250 0.500 0.750 1.000 1.250 1.500 1.750 2.000
Mod
el CHF
Loca-
on [m
]
Experimental CHF Loca-on [m]
Model CHF Loca-on vs. Experimental CHF Loca-on
20% 10%
30%
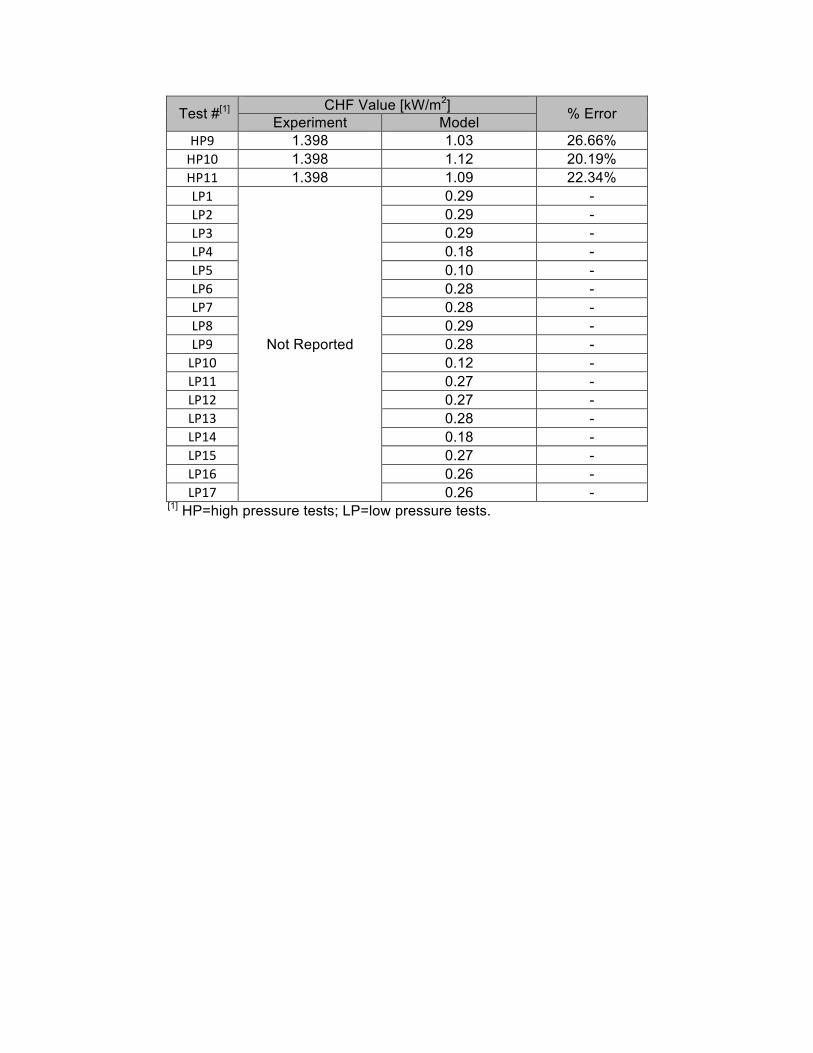
Test #[1] CHF Value [kW/m2] % Error Experiment Model HP9 1.398 1.03 26.66% HP10 1.398 1.12 20.19% HP11 1.398 1.09 22.34% LP1
Not Reported
0.29 - LP2 0.29 - LP3 0.29 - LP4 0.18 - LP5 0.10 - LP6 0.28 - LP7 0.28 - LP8 0.29 - LP9 0.28 - LP10 0.12 - LP11 0.27 - LP12 0.27 - LP13 0.28 - LP14 0.18 - LP15 0.27 - LP16 0.26 - LP17 0.26 -
[1] HP=high pressure tests; LP=low pressure tests.

6. CONCLUSIONS
A mechanistic base critical heat flux model has been developed and assessed against low- and
high-pressure data under various flow conditions. The current dataset evaluated lacked
information in the intermediate pressure region (1 MPa < P < 10 MPa); however a single
calibration curve was developed to determine the wall superheat for both extremes of data
presented in this summary. The model developed allows for determination of the critical heat
value, the critical heat flux location, and the critical pin power for a given set of power profiles
and test conditions.

7. REFERENCES 1. Avery, M., et al., Critical Heat Flux in TRIGA-Fueled Reactors Cooled by Natural
Convection. Nuclear Science and Engineering, 2012. 172(3): p. 249-258. 2. Katto, Y., Generalized Correlations for Critical Heat Flux of Natural Convection Boiling in
Confined Channels. Transations of The Japan Society of Mechanical Engineers (in Japanese), 1978. 44(387): p. 3908-3911.
3. Oh, C.H. and S.B. Englert, CRITICAL HEAT-FLUX FOR LOW FLOW BOILING IN VERTICAL UNIFORMLY HEATED THIN RECTANGULAR CHANNELS. International Journal of Heat and Mass Transfer, 1993. 36(2): p. 325-335.
4. Lowdermilk, W.H., C.D. Lanzo, and B.L. Siegel, Investigation of boiling burnout and flow instability of water flowing in tubes, N.A.C.f. Aeronautics, Editor. 1958, Lewis Flight Propulsion Laboratory: Cleveland, OH.
5. Monde, M., H. Kusuda, and H. Uehara, Critical Heat-Flux during Natural Convective Boiling in Vertical Rectangular Channels Submerged in Saturated Liquid. Journal of Heat Transfer-Transactions of the Asme, 1982. 104(2): p. 300-303.
6. Kaichiro, M. and M. Ishii, Flow regime transition criteria for upward two-phase flow in vertical tubes. International Journal of Heat and Mass Transfer, 1984. 27(5): p. 723-737.
7. Mishima, K. and H. Nishihara, The effect of flow direction and magnitude on CHF for low pressure water in thin rectangular channels. Nuclear Engineering and Design, 1985. 86(2): p. 165-181.
8. Kaminaga, M., et al., Experimental study of critical heat flux in a narrow vertical rectangular channel. Nippon Kikai Gakkai Ronbunshu, B Hen, 1989. 55(517): p. 2809-2813.
9. Klausner, J.F., et al., Vapor Bubble Departure in Forced-Convection Boiling. International Journal of Heat and Mass Transfer, 1993. 36(3): p. 651-662.
10. Hino, R. and T. Ueda, Studies on Heat Transfer and Flow Characteristics in Subcooled Flow Boiling-Part I. Boiling Characteristics. International Journal of Multiphase Flow, 1985. 11(3): p. 269-281.
11. Basu, N., G.R. Warrier, and V.K. Dhir, Onset of Nucleate Boiling and Active Nucleation Site Density During Subcooled Flow Boiling. Journal of Heat Transfer, 2002. 124(4): p. 717-728.