Embed Size (px)
Citation preview

Critical Challenges in Materials Supply to
Advanced Semiconductor Manufacturing Fabs
Dr. Anish Tolia, Head of Global Marketing, Linde Electronics May 22, 2015

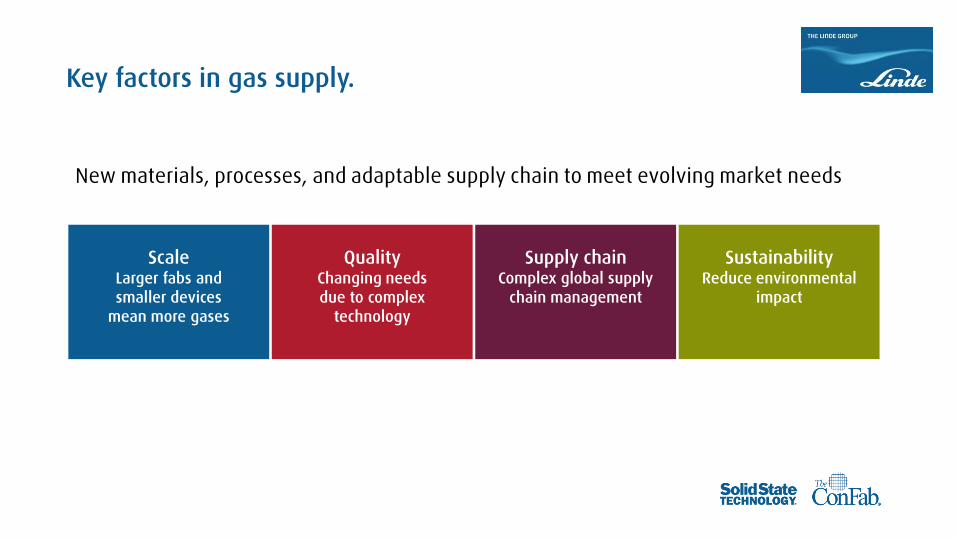
Key factors in gas supply.
New materials, processes, and adaptable supply chain to meet evolving market needs
Scale Larger fabs and
smaller devices
mean more gases
Quality Changing needs
due to complex
technology
Supply chain Complex global supply
chain management
Sustainability Reduce environmental
impact

Quality Changing needs
due to complex
technology
Supply chain Complex global supply
chain management
Sustainability Reduce environmental
impact
Scale Larger fabs and smaller
devices
mean more gases
Scale Larger fabs and
smaller devices
mean more gases
Key factors in gas supply.
New materials, processes, and adaptable supply chain to meet evolving market needs
Quality Changing needs
due to complex
technology

Scale. Drivers for increased consumption.
Rapid deployment of very large fabs
– Typical logic foundry now 80,000
WSPM
– Typical memory fab now exceeding
120,000 WSPM
– Fabs concentrated in clusters
(science parks)

Deposition Litho / patterning Doping / thermal Etch / clean
Scale. Several hundred process steps and hundreds of gases
and chemicals.

Deposition Litho / patterning Doping / thermal Etch / clean
Scale. Several hundred process steps and hundreds of gases
and chemicals.

Scale. Drivers for increased consumption.
Multi-patterning
– Move from single-patterning to multi-patterning
because of small devices
– Small feature size requiring better optical
resolution and move to EUV lithography
– Increased transistor processing (epitaxy, etch,
ALD) driving new and increased materials
0
10
20
30
40
50
65
nm
45
nm
32
nm
20
/1
6
/1
4n
m
10
nm
-
EU
V
10
nm
-
DP
T
Single non immersion Single immersion
LELE EUV
SADP SAQP
Number of layers by node
Graph source: Credit Suisse

Scale. Drivers for increased consumption.
Move to more complex 3D devices
– 3D FinFET
– Increased epitaxy steps
– Increased ALD
– 3D NAND
– Complex etch
– Increased deposition

0
20
40
60
80
100
120
140
2001 2005 2009 2012 2015 20170
10,000
20,000
30,000
40,000
50,000
2001 2005 2009 2012 2015 20170
20,000
40,000
60,000
80,000
2001 2005 2009 2012 2015 2017
Scale. Increased use of nitrogen.
– Increasing fab capacity drives more consumption
– Advanced technology nodes use more N2 due to more tools driven by multi-patterning
– Need for on-site generators with increased capacity as gas need increases
Typical fab size (WSPM) N2 consumption(Nm3/h) Process node (nm)

Economical transport for short to
medium distances
Compressed gaseous hydrogen
(CGH2)
Scale. Increased use of hydrogen.
Economical transport for medium to
long distances
(only in U.S. and Europe)
Liquid hydrogen (LH2)
Production through steam reforming
or electrolysis
No hydrogen transport costs
On-site production

Quality Changing needs
due to complex
technology
Supply chain Complex global supply
chain management
Sustainability Reduce environmental
impact
Key factors in gas supply.
New materials, processes, and adaptable supply chain to meet evolving market needs
Scale Larger fabs and
smaller devices
mean more gases
Quality Changing needs
due to complex
technology

Quality. Drivers.
– Complexity of processes and reduced yield
with each added process
– Risk from higher investments and
operational costs
– Engineers not knowing how a specific
impurity might impact performance: the
challenge of the unknown
Technology node in nanometers
Relative yield Process steps
Semi manufacturing yields and steps
Graph source: Entegris
0
500
1000
1500
2000
2500
90 65 45 32 28 20 14 10

Typical cost = $120
Fab CAPEX now >$7B
40K to 80K wafer starts per
month
Advanced logic:
# process steps > 600
Cycle time 6 to 10 weeks
Processing cost =
~$1,000 - $5,000
Cost per processed wafer
= $1,000 - $5,000
“Value” up to $20K - $40K
(based on ASP of the chips)
Average selling price
~$1 to > $2000
Starting wafer Fabrication Finished wafer IC chip
Quality. Increasingly important for chip manufacturers
at leading technology nodes.
– A modern high-volume semiconductor fab hugely amplifies value and cannot afford any process excursions
– Stringent focus on controlling variation in all inputs to the chip fabrication process

Quality. Need for holistic system.
Challenges in meeting demands
– Increase in complexity of monitoring and ensuring process
stability across the entire supply chain
– An increasing demand for people such as materials
scientists, chemists, and process engineers
Quality
Strategy
Product
Management
Quality
Analytical and
R&D
Engineering
and Operations
Account
Management Sourcing

Quality. Need for holistic system.
Challenges in meeting demands
– Increase in complexity of monitoring and ensuring process
stability across the entire supply chain
– An increasing demand for people such as materials
scientists, chemists, and process engineers
Supplier
Management
Process Control
and Metrology
Change Control and
Ship-to-Control

Quality. Need for holistic system.
Measurement systems
Gas distribution systems
Measurement systems analysis (MSA), Statistical process/Quality control (SPC/SQC)
Rece
ivin
g
Pre
p
Pu
rificatio
n
Fill
Traditional quality focus
QA
/Q
C/
Lab
Deliv
ery
Final product quality

Quality. Reduce variability, tighten control limits.
IC technology step changes drive electronic materials purity and analytical requirements
15 to 20 years ago
High-purity EMs High-purity EMs
Tight consistency
High-purity EMs
Tighter consistency
Use of overall process
control system
High-purity EMs
Tighter consistency
Wide use of overall
process control system
Fingerprinting
Within the last 10 years Recent / Present Near future

Quality. Reduce variability, tighten control limits.
A need for process stability across the entire supply chain
– Rigorous measurement, enabled with fingerprinting and metrology
– Gas purity and consistency/reliability
– Business continuity planning
– Process/statistical quality control

Quality Changing needs
due to complex
technology
Supply chain Complex global supply
chain management
Sustainability Reduce environmental
impact
Supply chain Complex global
supply chain
management
Key factors in gas supply.
New materials, processes, and adaptable supply chain to meet evolving market needs
Scale Larger fabs and
smaller devices
mean more gases

Supply chain. Global supply chain comes with challenges.
– Capacity planning
– Usage volumes for specialty gases
– Visibility into ramp demand of materials for new
technologies
– Limited raw materials suppliers
– Security of supply and move to local and regional suppliers
– Natural disasters and shortages
– Transportation labor strikes
– Change in government regulations Japan earthquake and tsunami devastation – Source: LA Times

Information Quality/
EHS
Finance
Supply chain. Interlinked, comprehensive, customer-focused.
Origin supply
source
Origin
transport
from shipper
Destination
transport
to consignee
Domestic
transport
to customer
Loading at port
of origin Unloading at port
of discharge
Warehousing
Customer Demand
forecast
Export
customs
formalities
Import
customs
formalities
Air, ship, rail

Supply chain. China and the 2008 Olympics.
– Chinese government block of hazardous materials into multiple ports
during the 2008 Olympics
– Materials had to be trucked in and added two months extra delivery time
– Required a lot of advanced planning

Supply chain. Business Continuity Planning.
– Conduct Business Continuity Planning (BCP) with alert
nodes in proactive processes
– Identify potential supply gaps by plotting product-source
mapping
– Create raw materials, manufacturing, transportation, and
labor shortage contingency plans
– Develop supply gap mitigation and implementation plans
Supply chain. Business Continuity Planning.
– Assess where and how to invest to diversify supply chain on
multiple continents
– Do procurement forecasting and planning with customers and
suppliers to meet demands
– Acquire two sources for raw materials and have customers
qualify both sources
– Establish footprint closer to customer with on-site and local
supply plants
– Coach suppliers on Statistical Quality Control (SQC), Statistical
Process Control (SPC), and customer requirements to show
things they do can help customers avert disaster at multiple
points in the supply chain

Quality Changing needs
due to complex
technology
Supply chain Complex global supply
chain management
Sustainability Reduce environmental
impact
Sustainability Reduce
environmental
impact
Key factors in gas supply.
New materials, processes, and adaptable supply chain to meet evolving market needs
Scale Larger fabs and
smaller devices
mean more gases

Sustainability. Big fabs, big use of resources.
10 cubic meters used per wafer at
14 nm node x 80,000 wafers per
month x 12 months =
9,600,000 cubic
meters of water used per
year (enough for 39,506 people
in U.S.)
Water 1220 kilowatt per hour used per
wafer at 14 nm node x 80,000
wafers per month x 12 months =
1,152,000,000 kilowatt –
hours or
1,152,000 megawatt –
hours electricity used per
year (enough for 94,846 people)
in U.S.)
Electricity
61 cubic meters used per wafer at
14 nm node x 80,000 wafers per
month x 12 months =
58,560,000 cubic
meters of natural gas used
per year (enough for 26,899
people in U.S.)
Natural gas
8 greenhouse gases used, which if
unabated, are the equivalent of
4.2 tons of CO2 per wafer. After
90% abatement at 14 nm node x
80,000 wafers per month x 12
months =
400,000 tons CO2
equivalents used per year
Greenhouse gases

Sustainability. Big fabs, big carbon footprint.
Annual carbon footprint including
electricity, natural gas, and
chemicals of just one 80,000
wafers per month capacity fab =
1,300,000
tons CO2

Sustainability. Drivers.
– Increasing environmental focus and
concerns
– Heightened environmental regulations
– Use of large volumes of rare and high
value gases
– Pressure to reduce operating costs
SPECTRA® nitrogen plant (world’s best energy efficiency)

Sustainability. Material recovery solutions.
Helium
recovered on-site and returned to customer
Argon
recovered on-site and returned to customer
Xenon
recovered and processed off-site
Sulfur hexafluoride
recovered on-site and returned to customer
Sulfuric acid
recovered on-site and sold to industrial users
On-site, closed-loop recovery
– Materials recovered on site, purified, and are
available for re-use in the manufacturing process
On-site, open-loop recovery
– Materials recovered on site and are available for
use in other applications
Off-site recovery
– High-cost materials recovered, shipped off site,
and purified at an external facility for re-use

Sustainability. Fluorine.
Fluorine technology to reduce emissions by tens
of million tons of CO2 equivalent per year
Global warming potential of greenhouse gases (100 year GWP kg CO2 eq)
F2 NF3 SF6
0 17,200 22,800

Sustainability. Fluorine.
Fluorine technology to reduce emissions by tens
of million tons of CO2 equivalent per year
Case example: Major memory fab
– Using on-site fluorine plants as a safer and more cost-effective
alternative to cylinder fluorine for cleaning Chemical Vapor
Deposition (CVD) chambers in its manufacturing process
– Using fluorine to replace other fluorinated cleaning gases such
as nitrogen trifluoride (NF3) following tests that demonstrated
reductions in cleaning time of up to 40% and a 35% decrease
in the mass of gas used
Implications for manufacturers.
Proactively plan up front
Partner with suppliers who
– Commit to your needs
– Value and implement process control and measurement
– Provide security and diversity of supply
Do longer term planning to include
– Building of on-site gas production and recovery
– CAPEX investments