Embed Size (px)
Citation preview

Critical Assessment of Microarray Data Analysis ConferenceDuke University8-9 June 2006
Characterization of Chronic Fatigue Syndrome
Using Affective Disorder andImmune System Pathways
Earl F. Glynn1 Chris Seidel2 Arcady R. Mushegian1,3
Hua Li1 Frank Emmert-Streib1 Jie Chen4
1Stowers Institute for Medical Research, Bioinformatics, Kansas City, MO2Stowers Institute for Medical Research, Microarray Group
3University of Kansas Medical Center, Kansas City, KS4University of Missouri – Kansas City, Dept. of Mathematics and Statistics
http://research.stowers-institute.org/efg/2006/CAMDA

• Chronic Fatigue Syndrome Overview
• Data Sources
• SNP Analysis and Results
• Microarray Analysis and Results
• Conclusions
Characterization of Chronic Fatigue SyndromeUsing Affective Disorder and Immune System Pathways
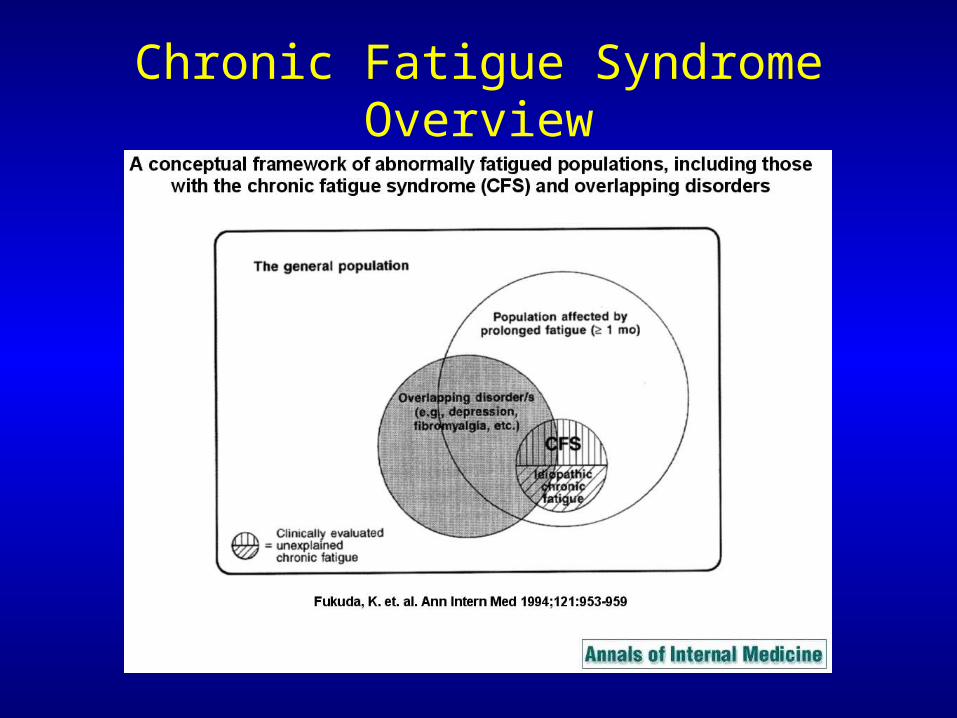
Chronic Fatigue Syndrome Overview

Wichita Chronic Fatigue Syndrome Study
Data Sources
How to integrate clinical, blood, microarray and SNP data in analysis?
Clinical Survey Data
Blood Data
Gene Expression Data
Proteomics Data (ignore)
SNP Data (Single Nucleotide Polymorphism)
X
...... TG
AC

Clinical Survey Data
Cluster Frequency Description
Worst 30 Most severely ill:“lowest SF-36; highest MFI ...”
Middle 67 Intermediate CFS
Least 67 Least severely ill: “scores essentiallyreflected population norms.”
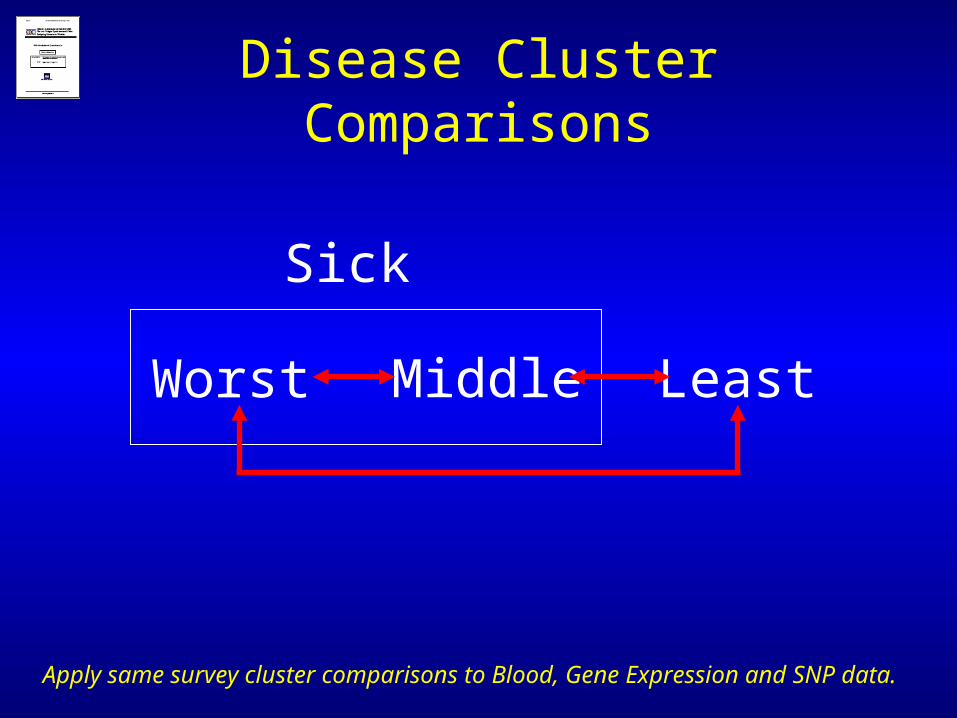
Disease Cluster Comparisons
Worst Middle Least
Sick
Apply same survey cluster comparisons to Blood, Gene Expression and SNP data.

SNP Data...... T
G
AC

SNP/Gene Expression
Group Description
CAMDASNP
GenesHattoriGenes
CAMDAMicroarray
Genes
1 Neurotransmission systems 6 129 119
2 Neuroendocrine system 4 20 20
3 Neurotrophic/growth factors, and intracellular signaling in 1 & 2
- 45 42
4 Circadian rhythm - 30 26
5 Major affective disorders - 33 30
Microarray Probes Matched to Genes Using biomaRt Bioconductor package
...... TG
AC
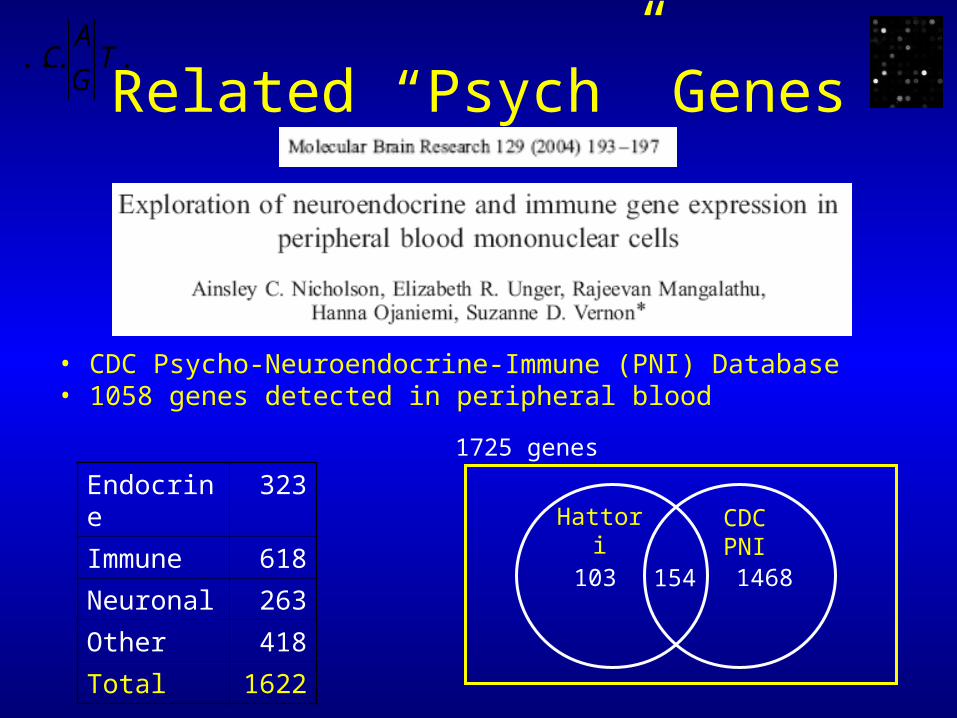
Related “Psych” Genes
• CDC Psycho-Neuroendocrine-Immune (PNI) Database• 1058 genes detected in peripheral blood
103 1468154
CDCPNI
1725 genes
Hattori
...... TG
AC
Endocrine 323
Immune 618
Neuronal 263
Other 418
Total 1622

Research Question
• Assume: Cluster classifications by Reeves, et al, based on clinical data are “correct” disease state assignments.
Hattori’s Affective Disorder “psych” genes and/or genes in CDC’s Psycho-Neuroendocrine-Immune Systems may be involved in chronic fatigue.
• Question: Can affective disorder/immune system genes in objective microarray gene expression and SNP data characterize chronic fatigue patients as well as or better than subjective clinical assessment surveys?
Can microarray and SNP data indicate CFS?
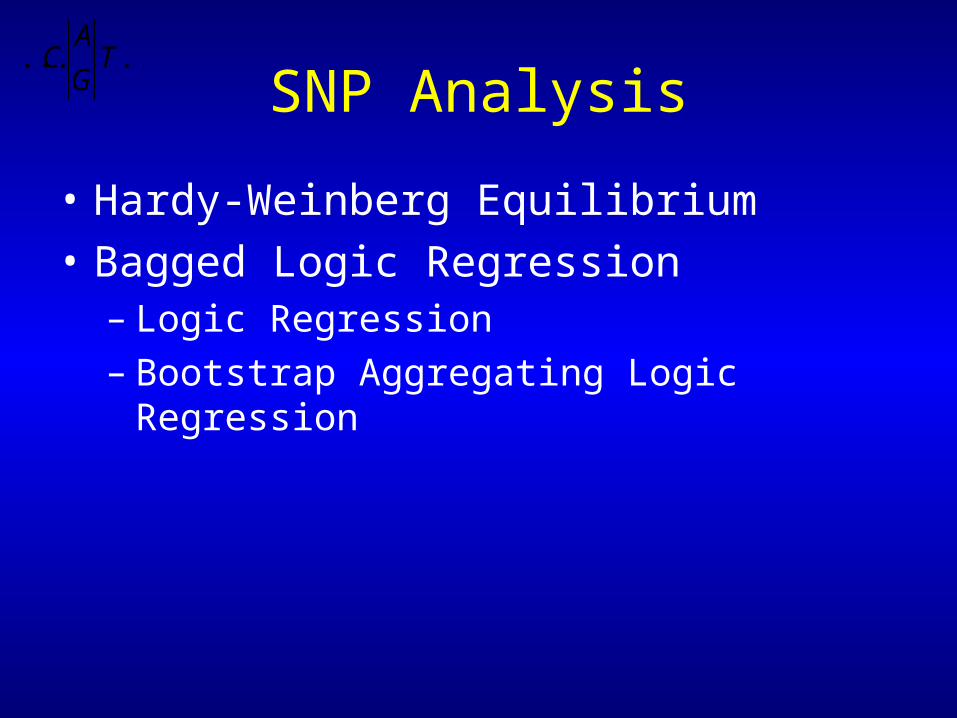
SNP Analysis
• Hardy-Weinberg Equilibrium
• Bagged Logic Regression– Logic Regression– Bootstrap Aggregating Logic Regression
...... TG
AC

SNP Analysis
Hardy-Weinberg Equilibrium
• Let p = frequency of one of two alleles
q = frequency of other allele
p + q = 1
Hardy-Weinberg Equilibrium expects genotype frequencies:
p2 + 2pq + q2 = 1
Bioconductor package, genetics, computes Hardy-Weinberg Equilibrium stats: HWE.chisq or HWE.exact
...... TG
AC

SNP Analysis
Hardy-Weinberg Equilibrium
• X Chromosome SNPs fail (MAOA and MAOB)
• Other genes are consistent for the “Least” CFS category, except for SLC6A4 SNPs, which weakly fail.
• Certain CRHR1 and NR3C1 SNPs fail for “All” and “Sick” categories but not the “Least” category.
...... TG
AC
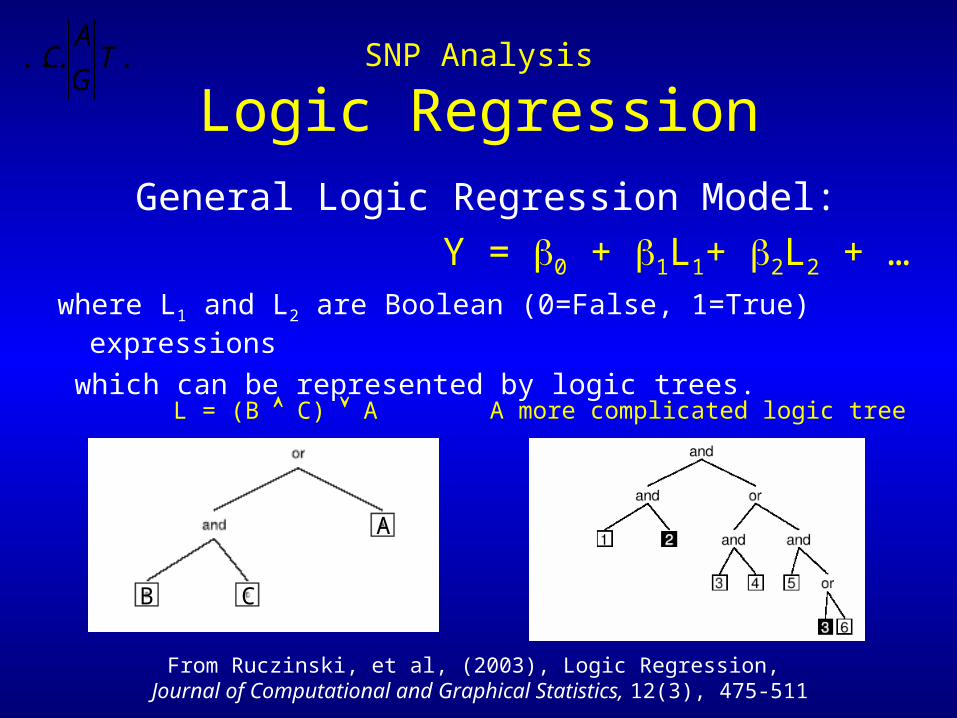
SNP Analysis
Logic Regression
General Logic Regression Model:
Y = 0 + 1L1+ 2L2 + …where L1 and L2 are Boolean (0=False, 1=True) expressions
which can be represented by logic trees.L = (B C) A A more complicated logic tree
A
B C
From Ruczinski, et al, (2003), Logic Regression, Journal of Computational and Graphical Statistics, 12(3), 475-511
...... TG
AC
SNP Analysis
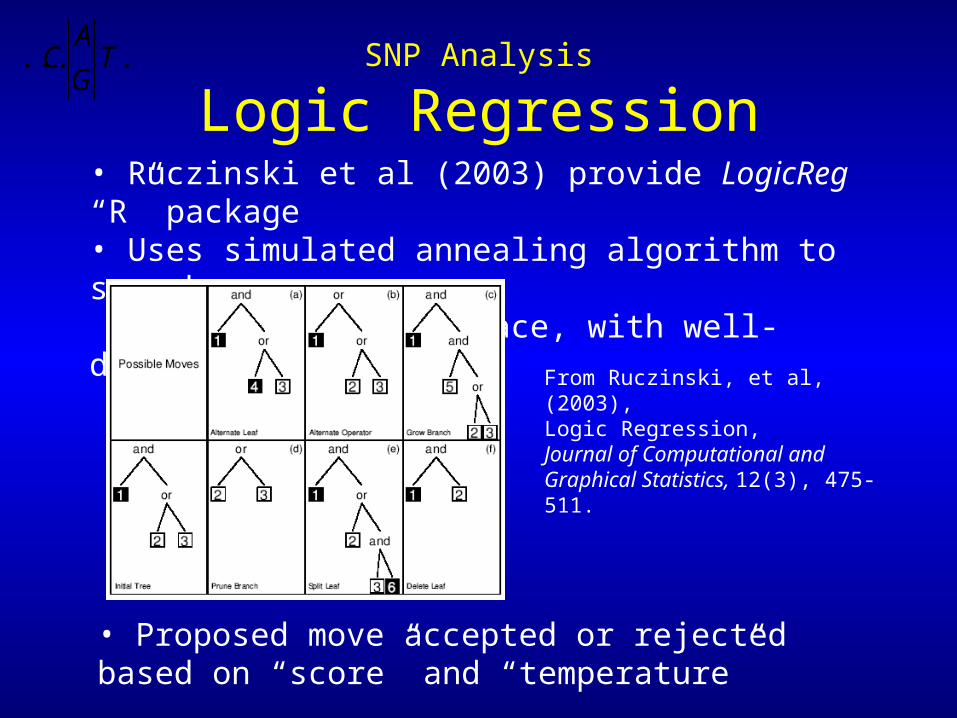
Logic Regression• Ruczinski et al (2003) provide LogicReg “R” package• Uses simulated annealing algorithm to search high-dimensional space, with well-defined move set:
• Proposed move accepted or rejected based on “score” and “temperature”
From Ruczinski, et al, (2003), Logic Regression,Journal of Computational and Graphical Statistics, 12(3), 475-511.
...... TG
AC

SNP Analysis
Logic RegressionRecode SNP information as Boolean data:
SNP
Dominant Model
Recessive Model
GenotypeSNP_1 SNP_2
1 AA 0 0 Homozygous Reference“Allele 1”
2 AT 1 0 Heterozygous“Both”
3 TT 1 1 Homozygous Variant
“Allele 2”
NOT SNP_1 is written as !SNP_1 in logicFS Bioconductor package
...... TG
AC
SNP Analysis
Logic Regression...... T
G
AC
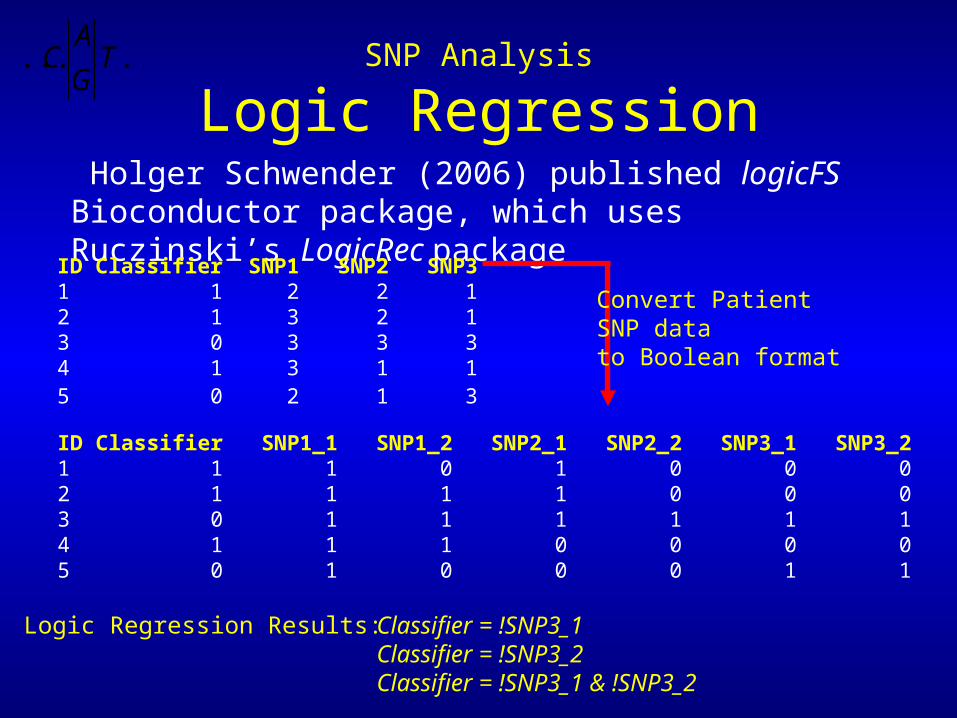
Holger Schwender (2006) published logicFS Bioconductor package, which uses Ruczinski’s LogicRec package
ID Classifier SNP1 SNP2 SNP31 1 2 2 12 1 3 2 13 0 3 3 34 1 3 1 15 0 2 1 3
ID Classifier SNP1_1 SNP1_2 SNP2_1 SNP2_2 SNP3_1 SNP3_21 1 1 0 1 0 0 02 1 1 1 1 0 0 03 0 1 1 1 1 1 14 1 1 1 0 0 0 05 0 1 0 0 0 1 1
Classifier = !SNP3_1 Classifier = !SNP3_2 Classifier = !SNP3_1 & !SNP3_2
Convert Patient SNP datato Boolean format
Logic Regression Results:

SNP Analysis
Bagged Logic Regression...... T
G
AC
Schwender’s logicFS package introduced a bootstrap aggregating, or “bagging,” version of logic regression.
ID Classifier SNPs12345
ID Classifier SNPs42141
ID Classifier SNPs35
N=5 N=5“Bag”Original Data “Set”
“Out-of-Bag”
BootstrapSample
~N/3
Out-of-Bag (OOB) Error Rate Estimated from Regression Equation and OOB Set
LogicRegressionEquation
REPEAT
Exclude patients with missing values

SNP Analysis
Bagged Logic Regression...... T
G
AC
Schwender’s logicFS package uses the Quine-McCluskey algorithm to reduce logic regression equations to a minimum disjunctive (OR) normal form.
Regression Equations: YBag1 = L1 L2 L3 YBag2 = L3
YBag3 = L1 L3 . . .where each L is a conjunction (AND) of one or more variables,e.g., L1 = X1 X3, L2 = X1 X2 X3, L3 = X2
Aggregate results by disjunctive term. Compute proportion and “importance” score.
Disjunct Count
L3 3
L1 2
L2 1
Summary

SNP Results
Bagged Logic Regression...... T
G
AC
Out-of-Bag Error Rate Summary [%]
Classifier %Comparison Run 1 Run 2
Worst vs Least 29.7 29.7 W: 35.9
Middle vs Least 55.7 50.0 L: 53.4
Worst vs Middle 40.0 37.1 M: 32.8
Sick vs Least 43.2 42.3 L: 36.9
“Random” 54.0 54.9 50.0
Run 1: 25,000 iterations for simulated annealing, 500 “bags”Run 2: 50,000 iterations for simulated annealing, 750 “bags”Exploratory technique for now. “Best” parameters not clear.

SNP Results
Bagged Logic Regression...... T
G
AC
“Importance” of Worst vs Least Disjuncts
1 TPH2.hCV8376042_1 & !TH.hCV243542_2 & !COMT.hCV11804650_2 & !CRHR2.hCV15960586_2 & !NR3C1.hCV11159943_22 TPH2.hCV15836061_1 & !TH.hCV243542_2 & CRHR1.hCV2544836_1 & !CRHR2.hCV15960586_2 & !NR3C1.hCV11159943_23 COMT.hCV2538747_1 & CRHR1.hCV2544836_1 & !CRHR2.hCV15960586_2 & !NR3C1.hCV11159943_24 COMT.hCV2538747_1 & CRHR1.hCV2544836_1 & !CRHR2.hCV15960586_2 & !NR3C1.hCV8950998_25 !COMT.hCV11804650_2 & CRHR1.hCV2544836_1 & !CRHR2.hCV15960586_2 & !NR3C1.hCV11159943_2
12345

SNP Results
Bagged Logic Regression...... T
G
AC
Top Two Disjuncts from Run 2: Worst vs Least
1 TPH2.hCV8376042_1 & !TH.hCV243542_2 & !COMT.hCV11804650_2 & !CRHR2.hCV15960586_2 & !NR3C1.hCV11159943_2
2 TPH2.hCV15836061_1 & !TH.hCV243542_2 & CRHR1.hCV2544836_1 & !CRHR2.hCV15960586_2 & !NR3C1.hCV11159943_2
Goertzel, et al, Pharmacogenomics (2006), Importance of genes based on SNPs:NR3C1, TPH2, COMT, CRHR2, CRHR1, NRC1, TH, POMC, 5HTT
Single Disjunct matches73% of Worst/Least patients
Single Disjunct matches75% of Worst/Least patients
0 (64%): 39/41 (95%)1 (36%): 9/23 (39%)correct: 48/64 (75%)
Microarray Analysis
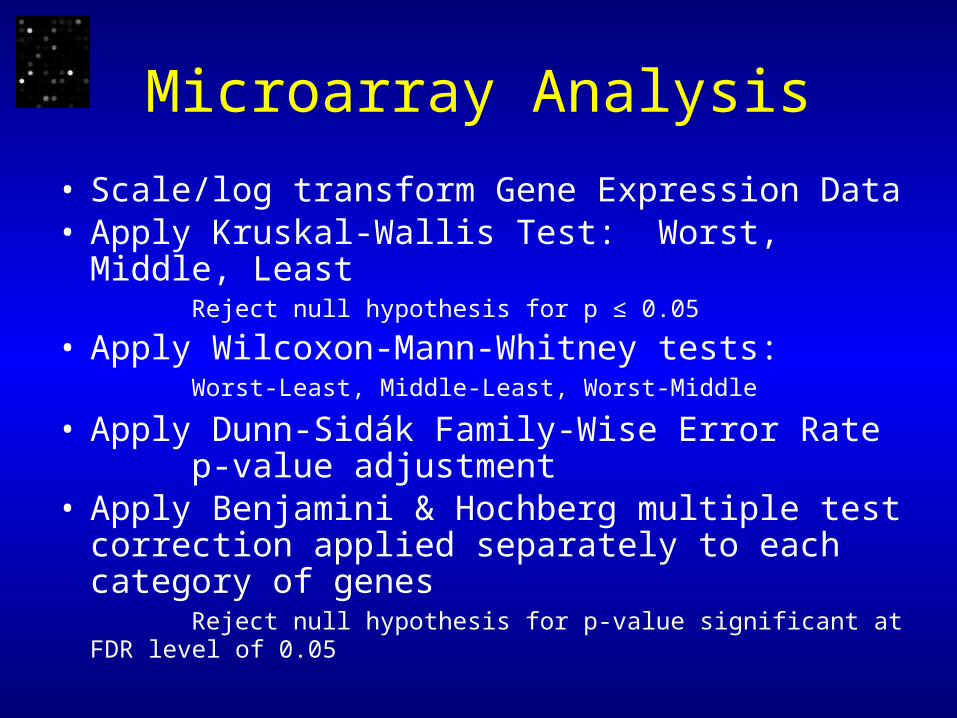
• Scale/log transform Gene Expression Data• Apply Kruskal-Wallis Test: Worst, Middle, Least
Reject null hypothesis for p ≤ 0.05
• Apply Wilcoxon-Mann-Whitney tests: Worst-Least, Middle-Least, Worst-Middle
• Apply Dunn-Sidák Family-Wise Error Rate p-value adjustment
• Apply Benjamini & Hochberg multiple test correction applied separately to each category of genes Reject null hypothesis for p-value significant at FDR level of 0.05

Microarray Analysis
Like in Affymetrix analysis, the array median was scaled to 150. Floor set at 0.
Raw Data: 172 arrays x 19,700 probes Median of Each Array Scaled to 150
Scaling by Array
172 patients: 26 Worst, 53 Middle, 44 Least,49 Excluded

Microarray Analysis
Heteroskedacity: Non-parametric statistics should be used
Mean vs Standard Deviation Skewness vs Standard Deviation
Statistics by Probe

Microarray Analysis
But which pairs of comparisons have significant differences?
If p-value ≤ 0.05 reject null hypothesis that all are in the same group and accept alternate hypothesis there is a difference in at least one comparison.
Kruskal-Wallis Nonparametric ANOVA: Selects Probes With Differences Among Three Groups
381 Hattori probes → 13 pass Kruskal-Wallis1914 CDC PNI probes → 55 pass Kruskal-Wallis
26 Worst 53 Middle 44 Least
Kruskal-Wallis Rank Sum Test(R routine kruskal.test)
p-value

Microarray Analysis
Which probes pass all these statistical tests?
Wilcoxon-Mann-Whitney Nonparametric Test of Two Samples (R routine wilcox.test)
Worst MiddleLeast WorstMiddle Least
Wilcoxon Wilcoxon Wilcoxon
p1 p2 p3
Dunn-Sidák Family-Wise Error Rate Adjustmenti = 1 – (1 – pi)m
1 2 3
Apply to E
ach Probe P
assing Kruskal-W
allis
Apply Benjamini & Hochberg Multiple Test Correction by Dataset Category
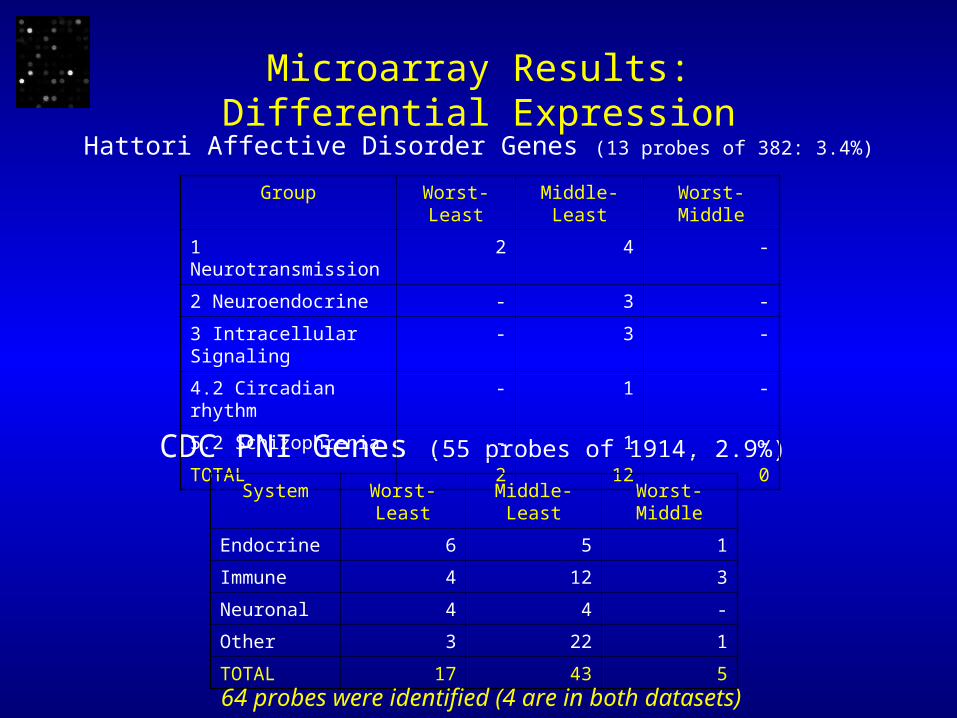
Microarray Results:Differential Expression
Hattori Affective Disorder Genes (13 probes of 382: 3.4%)
CDC PNI Genes (55 probes of 1914, 2.9%)
Group Worst-Least Middle-Least Worst-Middle
1 Neurotransmission 2 4 -
2 Neuroendocrine - 3 -
3 Intracellular Signaling - 3 -
4.2 Circadian rhythm - 1 -
5.2 Schizophrenia - 1 -
TOTAL 2 12 0
System Worst-Least Middle-Least Worst-Middle
Endocrine 6 5 1
Immune 4 12 3
Neuronal 4 4 -
Other 3 22 1
TOTAL 17 43 5
64 probes were identified (4 are in both datasets)
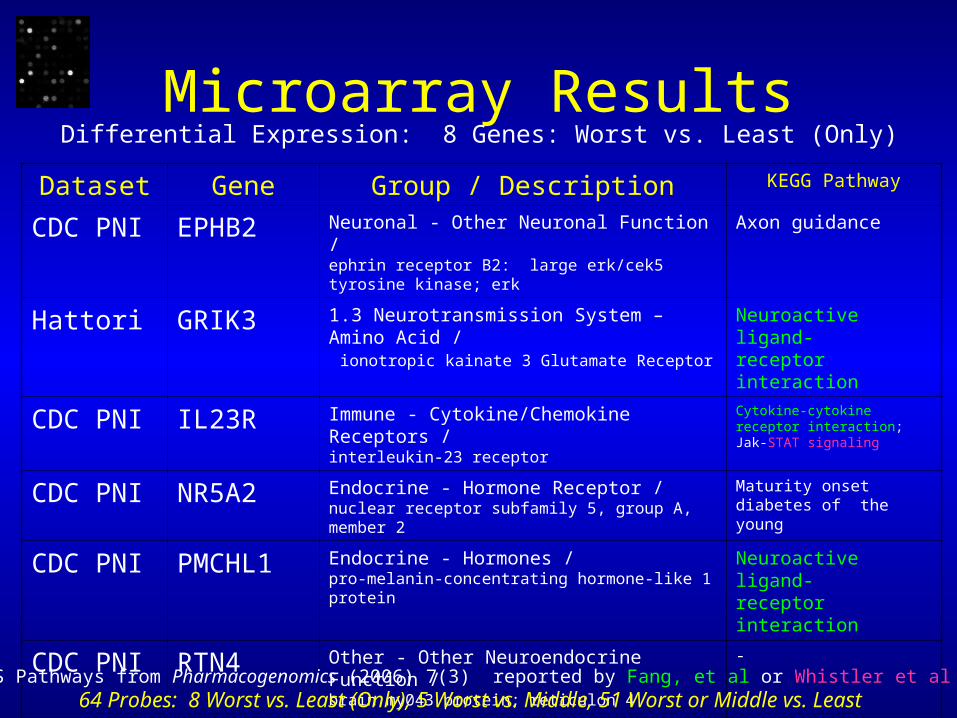
Microarray ResultsDifferential Expression: 8 Genes: Worst vs. Least (Only)
Dataset Gene Group / Description KEGG Pathway
CDC PNI EPHB2 Neuronal - Other Neuronal Function /ephrin receptor B2: large erk/cek5 tyrosine kinase; erk
Axon guidance
Hattori GRIK3 1.3 Neurotransmission System – Amino Acid / ionotropic kainate 3 Glutamate Receptor
Neuroactive ligand-receptor interaction
CDC PNI IL23R Immune - Cytokine/Chemokine Receptors /interleukin-23 receptor
Cytokine-cytokine receptor interaction; Jak-STAT signaling
CDC PNI NR5A2 Endocrine - Hormone Receptor /nuclear receptor subfamily 5, group A, member 2
Maturity onset diabetes of the young
CDC PNI PMCHL1 Endocrine - Hormones /pro-melanin-concentrating hormone-like 1 protein
Neuroactive ligand-receptor interaction
CDC PNI RTN4 Other - Other Neuroendocrine Function / brain my043 protein; reticulon 4
-
CDC PNI SEMA3C Neuronal - Other Neuronal Function /sema domain, immunoglobulin domain (Ig), short basic domain, secreted, (semaphorin) 3C
Axon guidance
CDC PNI TPO Endocrine - Hormone Metabolism /thyroid peroxidase isoform 2/3
Cytokine-cytokine receptor interaction; Jak-STAT signaling, Tyrosine metabolism + 6 others
64 Probes: 8 Worst vs. Least (Only), 5 Worst vs. Middle, 51 Worst or Middle vs. LeastCFS Pathways from Pharmacogenomics (2006) 7(3) reported by Fang, et al or Whistler et al
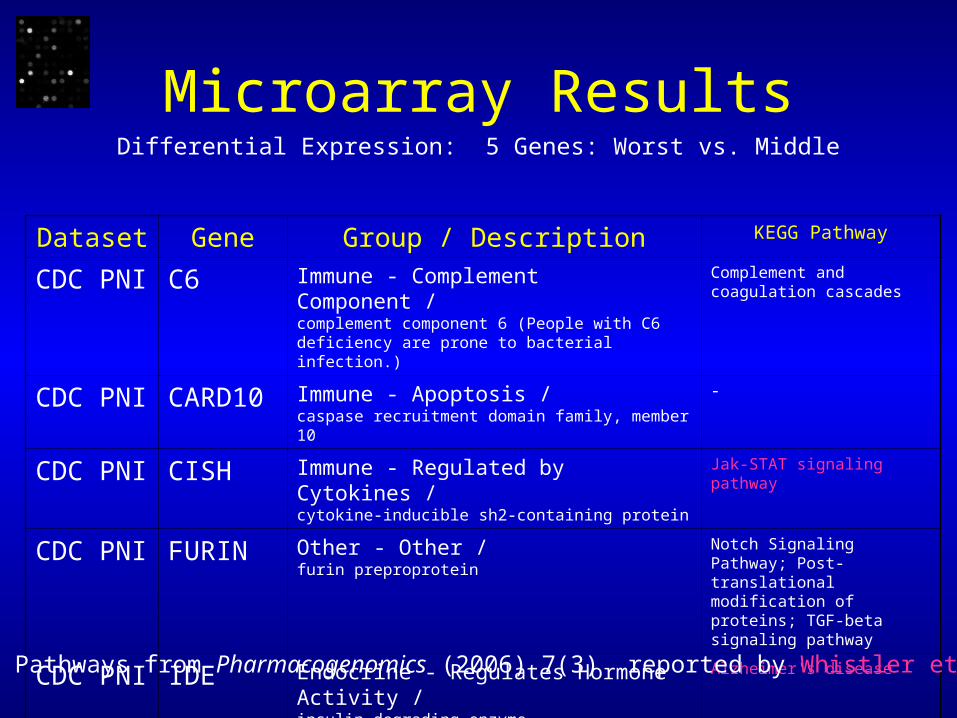
Microarray ResultsDifferential Expression: 5 Genes: Worst vs. Middle
Dataset Gene Group / Description KEGG Pathway
CDC PNI C6 Immune - Complement Component /complement component 6 (People with C6 deficiency are prone to bacterial infection.)
Complement and coagulation cascades
CDC PNI CARD10 Immune - Apoptosis /caspase recruitment domain family, member 10
-
CDC PNI CISH Immune - Regulated by Cytokines /cytokine-inducible sh2-containing protein
Jak-STAT signaling pathway
CDC PNI FURIN Other - Other /furin preproprotein
Notch Signaling Pathway; Post-translational modification of proteins; TGF-beta signaling pathway
CDC PNI IDE Endocrine - Regulates Hormone Activity /insulin-degrading enzyme
Alzheimer's disease
CFS Pathways from Pharmacogenomics (2006) 7(3) reported by Whistler et al

Microarray ResultsDifferential Expression: 50 Genes: Worst-or-Middle vs. Least
See details in online supplement
http://research.stowers-institute.org/efg/2006/CAMDA
ANXA13
ATF3
BTK
BTN3A1
CARD10
CCL25
CDC37
CHGA
CHRM1
CRP
DUSP10
DUSP16
DUSP22
EFNA4
EPS15
FOS
FYN
GNAS
HSD11B1HSPD1
IGFBP5
IL18BP
IL6ST
INSIG1
MAP2K6
MAPK8IP3
MDM2
MR1
MS4A3
NCOA1
NCOA2
NFKBIL2
NPFF
NRG1
NTRK2
OPRM1
PDYN / PTPNS1
PIP5K2A
PPARD
PSMB8
SERPINA6
SLC1A1
SLC6A7
STAT2
TBXAS1
TCF4
TLR10
TNFSF13
TRPM2
ZNF14
In CFS Pathways from Pharmacogenomics (2006) 7(3) reported by Fang, et al
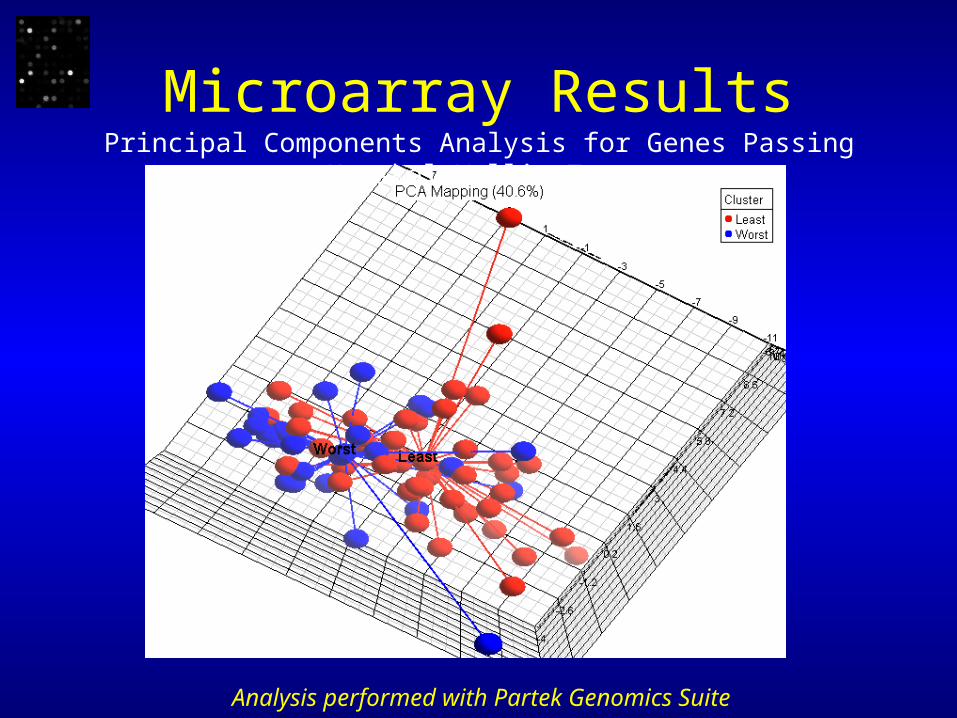
Microarray ResultsPrincipal Components Analysis for Genes Passing Kruskal-Wallis Test
Analysis performed with Partek Genomics Suite
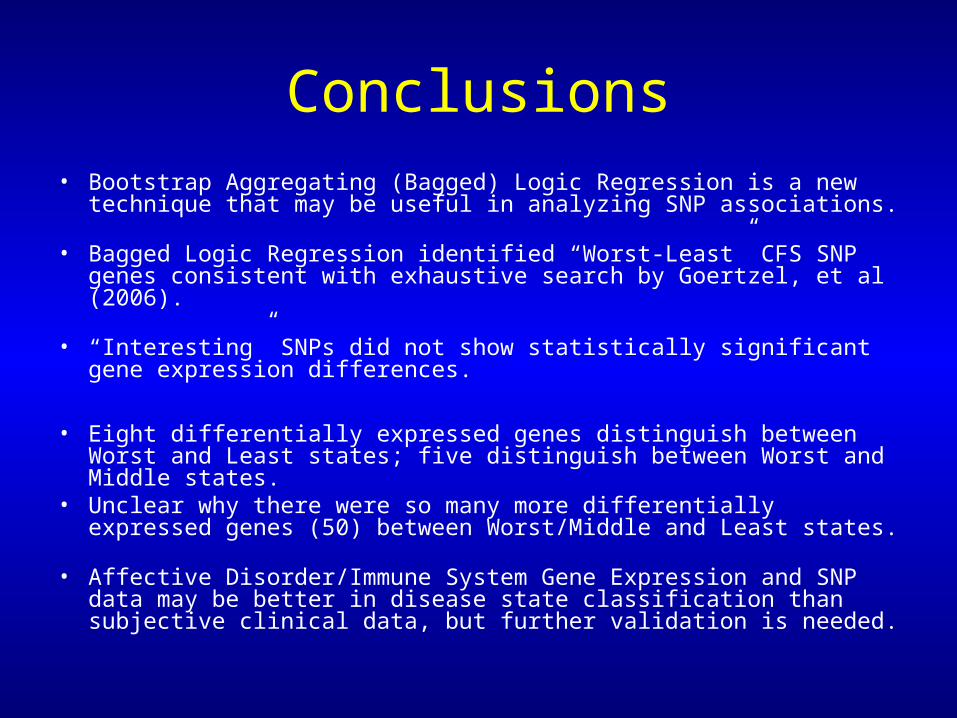
Conclusions• Bootstrap Aggregating (Bagged) Logic Regression is a new
technique that may be useful in analyzing SNP associations. • Bagged Logic Regression identified “Worst-Least” CFS SNP genes
consistent with exhaustive search by Goertzel, et al (2006).
• “Interesting” SNPs did not show statistically significant gene expression differences.
• Eight differentially expressed genes distinguish between Worst and Least states; five distinguish between Worst and Middle states.
• Unclear why there were so many more differentially expressed genes (50) between Worst/Middle and Least states.
• Affective Disorder/Immune System Gene Expression and SNP data may be better in disease state classification than subjective clinical data, but further validation is needed.

Acknowledgements
Stowers Institute for Medical Research
Suzanne D. VernonCenters for Disease Control and Prevention
Psycho-Neuroendocrine-Immune (PNI) Database
Holger SchwenderUniversity of Dortmund
Help Using logicFS Bioconductor Package