Embed Size (px)
Citation preview

2021 Oregon Annual Ambient Criteria Pollutant Air Monitoring Network Plan
Air Quality 7202 N W Evergreen Pkwy #150, Hillsboro, OR 97124 Phone: 503-693-5708
800-452-4011 Fax: 503-693-4999 Contact: Anthony Barnack www.oregon.gov/DEQ
DEQ is a leader in restoring, maintaining and enhancing the quality of Oregon’s air, land and water.

Documents can be provided upon request in an alternate format for individuals with disabilities or in a
language other than English for people with limited English skills. To request a document in another
format or language, call DEQ in Portland at 503-229-5696, or toll-free in Oregon at 1-800-452-4011,
ext. 5696; or email [email protected]
i
Table of Contents
Executive Summary ..................................................................................... 1
1. Introduction ........................................................................................... 2
2. Monitoring background .......................................................................... 2
2.1 National Monitoring Strategy ....................................................................................... 2 2.1.1 State and Local Support ............................................................................................ 2 2.1.2 AQ Maintenance and Non-attainment support ........................................................... 2 2.2 Non-attainment and Maintenance Areas ..................................................................... 3
2.2.1 Formerly non-attainment areas awaiting maintenance plans: .................................... 3
2.2.2 Maintenance Areas in Oregon: .................................................................................. 3
3. Overview of Network Operations ........................................................... 4
3.1 Air Monitoring Network Design .................................................................................... 4
3.2 Oregon Criteria Pollutant Monitoring Network .............................................................. 6 3.2.1 Ozone Network ......................................................................................................... 8
3.2.2 Nitrogen Dioxide Network ........................................................................................ 10 Figure 4. NO2 Monitoring Network .................................................................................. 10 3.2.3 Carbon Monoxide Network ...................................................................................... 11
Figure 5. CO Monitoring Network .................................................................................... 11 3.2.4 PM2.5 Network ........................................................................................................ 12
Figure 6. PM2.5 Monitoring Network ............................................................................... 12 3.2.5 PM10 Network ......................................................................................................... 13
Figure 7. PM10 Monitoring Network ................................................................................ 13 3.2.6 PM10-2.5 Network ................................................................................................... 13
Figure 8. PM10-PM2.5 Monitoring Network .................................................................... 14 3.2.7 Criteria Pollutant Lead Network ............................................................................... 14 3.2.8 Sulfur Dioxide (SO2) Network ................................................................................. 14
3.3 PM2.5 Air Quality Index Network ............................................................................... 15 Figure 9. PM2.5 AQI Network ......................................................................................... 15
Table 3. AQI site list ........................................................................................................ 16 3.4 Meteorology Network ................................................................................................. 18
Figure 10. Meteorology Network ..................................................................................... 18 Table 4. Meteorology Network ........................................................................................ 19
4. Planned Changes to Network .............................................................. 20
4.1 Criteria Pollutant Changes ......................................................................................... 20
Appendix A. Minimum Monitoring Requirements ...................................... 21
Table A. 1. Minimum Monitoring Requirements for NCORE Site. .................................. 21 Table A. 2. Ozone Minimum Monitoring Requirements .................................................. 22 Table A. 3. Carbon Monoxide Minimum Monitoring Requirements: ............................... 23
Table A. 4. NO2, NO, NOx Minimum Monitoring Requirements: .................................... 24 Table A. 5. SO2 Minimum Monitoring Requirements: .................................................... 25
ii
Table A. 6. Lead Minimum Monitoring Requirements:.................................................... 26 Table A. 7. PM10 Minimum Monitoring Requirements: .................................................. 27
Table A. 8. PM2.5 (FRM) Minimum Monitoring Requirements: ...................................... 28 PM2.5 for AQI (Non-FRM) site information ..................................................................... 29 Table A. 9. PM2.5 for AQI (Non-FRM) site information .................................................. 29
Appendix B. Collocation Requirements ..................................................... 29
Table B 1. Collocation Requirements for PM2.5 ............................................................. 29 Table B 2. Collocation Requirements for PM10 ............................................................. 29 Table B 3. Collocation Requirements for PM10 lead ...................................................... 29
Appendix C. Detailed Site Information ....................................................... 30
Table C 1. Portland, SE Lafayette Site Information ........................................................ 30
Table C 2. Portland, Humboldt School Site Information .................................................. 35 Table C 3. Portland Near Roadway Site Information ...................................................... 36 Table C 4. Hillsboro, Hare Field Site Information ........................................................... 38
Table C 5. Portland, Sauvie Island Site Information ....................................................... 39 Table C 6. Portland - Carus – Spangler Rd. Site Information ......................................... 40
Table C 7. Salem – State Hospital Information .............................................................. 41 Table C 8. Salem/Turner - Cascade Jr. High Site Information ....................................... 42 Table C 9. Eugene – Amazon Park Site Information ........ Error! Bookmark not defined. Table C 10. Eugene – Saginaw Site Information ............................................................. 45 Table C 11. Eugene – Hwy 99 Site Information ............................................................. 46
Table C 12. Cottage Grove, City Shops Site Information ............................................... 47 Table C 13. Oakridge, Willamette Center Site Information ............................................. 48
Table C 14. Grants Pass, Parkside School Site Information ........................................... 49 Table C 15. Medford, Welch and Jackson Information .................................................... 50
Table C 16. Medford - Talent Site Information ................................................................ 51 Table C 17. Klamath Falls, Petersen School Site Information ......................................... 52 Table C 18. Lakeview, Center and M Sts Site Information ............................................. 53
Table C 19. Burns, Washington Street Site Information ................................................. 54 Table C 20. Prineville, Davidson Park Site Information .................................................. 55
Table C 21. La Grande, Hall and North Site Information ................................................ 56 Table C 22. Hermiston Municipal Airport Site Information .............................................. 57
Appendix D. Site Evaluation Checklist ....................................................... 58
Appendix E. Waivers ................................................................................. 67
Table D 1. McMinnville, Cascade Steel TSP lead Waiver ............................................... 67 Table D 2. CO emission estimates from the Rogue Valley. ............................................ 67 Table D 3. Linear regression equations used to estimate PM10 using PM2.5. ............... 68 Table D 4. 2013 PM10 estimates for Klamath Falls and Grants Pass. ........................... 68
Appendix F. Interstate Memos of Understanding ....................................... 84
Appendix G. Review of Violating monitor changes..................................... 87
iii
Table of Tables Table 1. Relationship Between Site Type and Scale of Representativeness ........................... 5 Table 2. 2020 ODEQ and LRAPA Criteria Pollutant Ambient Air Monitoring Network ............. 7 Table 3. AQI site list ............................................................................................................... 16 Table 4. Meteorology Network ............................................................................................... 19
Table A. 1. Minimum Monitoring Requirements for NCORE Site. ......................................... 21 Table A. 2. Ozone Minimum Monitoring Requirements ........................................................ 22 Table A. 3. Carbon Monoxide Minimum Monitoring Requirements: ...................................... 23 Table A. 4. NO2, NO, NOx Minimum Monitoring Requirements: .......................................... 24
Table A. 5. SO2 Minimum Monitoring Requirements: ........................................................... 25 Table A. 6. Lead Minimum Monitoring Requirements: .......................................................... 26
Table A. 7. PM10 Minimum Monitoring Requirements: ......................................................... 27 Table A. 8. PM2.5 (FRM) Minimum Monitoring Requirements:............................................. 28 Table A. 9. PM2.5 for AQI (Non-FRM) site information ......................................................... 29 Table B 1. Collocation Requirements for PM2.5 .................................................................... 29
Table B 2. Collocation Requirements for PM10 .................................................................... 29 Table B 3. Collocation Requirements for PM10 lead ............................................................ 29 Table C 1. Portland, SE Lafayette Site Information .............................................................. 30 Table C 2. Portland, Humboldt School Site Information ......................................................... 35 Table C 3. Portland Near Roadway Site Information ............................................................ 36
Table C 4. Hillsboro, Hare Field Site Information .................................................................. 38 Table C 5. Portland, Sauvie Island Site Information ............................................................. 39
Table C 6. Portland - Carus – Spangler Rd. Site Information ............................................... 40
Table C 7. Salem – State Hospital Information ..................................................................... 41
Table C 8. Salem/Turner - Cascade Jr. High Site Information .............................................. 42 Table C 9. Eugene – Amazon Park Site Information .............. Error! Bookmark not defined. Table C 10. Eugene – Saginaw Site Information ................................................................... 45 Table C 11. Eugene – Hwy 99 Site Information .................................................................... 46 Table C 12. Cottage Grove, City Shops Site Information ...................................................... 47
Table C 13. Oakridge, Willamette Center Site Information ................................................... 48 Table C 14. Grants Pass, Parkside School Site Information .................................................. 49 Table C 15. Medford, Welch and Jackson Information .......................................................... 50 Table C 16. Medford - Talent Site Information ....................................................................... 51
Table C 17. Klamath Falls, Petersen School Site Information ............................................... 52 Table C 18. Lakeview, Center and M Sts Site Information ................................................... 53
Table C 19. Burns, Washington Street Site Information ....................................................... 54 Table C 20. Prineville, Davidson Park Site Information ........................................................ 55 Table C 21. La Grande, Hall and North Site Information ...................................................... 56 Table C 22. Hermiston Municipal Airport Site Information .................................................... 57 Table D 1. McMinnville, Cascade Steel TSP lead Waiver ..................................................... 67 Table D 2. CO emission estimates from the Rogue Valley. .................................................. 67 Table D 3. Linear regression equations used to estimate PM10 using PM2.5. ...................... 68 Table D 4. 2013 PM10 estimates for Klamath Falls and Grants Pass. ................................. 68

iv
Table of Figures Figure 1. ODEQ and LRAPA Ambient Air Monitoring Network ................................................. 6 Figure 2. Ozone Monitoring Network ........................................................................................ 8
Figure 3. Portland- Metro Ozone Monitoring Sites. .................................................................. 9 Figure 4. NO2 Monitoring Network ........................................................................................ 10 Figure 5. CO Monitoring Network .......................................................................................... 11 Figure 6. PM2.5 Monitoring Network ..................................................................................... 12 Figure 7. PM10 Monitoring Network ...................................................................................... 13
Figure 8. PM10-PM2.5 Monitoring Network ........................................................................... 14 Figure 9. PM2.5 AQI Network ................................................................................................ 15 Figure 10. Meteorology Network ............................................................................................ 18
Glossary of Air Quality Terms
AQI Air Quality Index – standardized EPA method of reporting air quality
CO Carbon monoxide – An odorless, colorless gaseous pollutant
DV Design Value – the pollutant concentration used to compare to the NAAQS
FEM Federal Equivalence Method (Method approved for comparison to NAAQS)
FRM Federal Reference Method (Method approved for comparison to NAAQS)
HAPs Hazardous Air Pollutant as defined in Title III of the Clean Air Act
IMPROVE EPA’s PM2.5 speciation visibility network
NAAQS National Ambient Air Quality Standards – federal air quality standards
NATTS National Air Toxics Trends network
NO Nitrogen oxide
NO2 Nitrogen dioxide NOx Nitrogen oxides – redish brown gaseous pollutant - mainly NO and NO2 NOy NOx + HNO3 + organic nitrates + inorganic nitrates = NOx + NOz
O3 Ozone – a gaseous pollutant and a component of smog at ground level
PM2.5 Particulate Matter 2.5 micrometers in diameter and smaller
PM10 Particulate Matter 10 micrometers in diameter and smaller
PM10-2.5 The particle size between 10 and 2.5.
SIP State Implementation Plan
SO2 Sulfur dioxide TSP Total Suspended Particulates VOC Volatile Organic Compounds
WAQR Wildfire Air Quality Rating - wildfire smoke health internet page
Air Pollutant Concentration Units:
ppm Parts per million ppb Parts per billion μg/m
3 Microgram per cubic meter
ng/m3
Nanograms per cubic meter
1
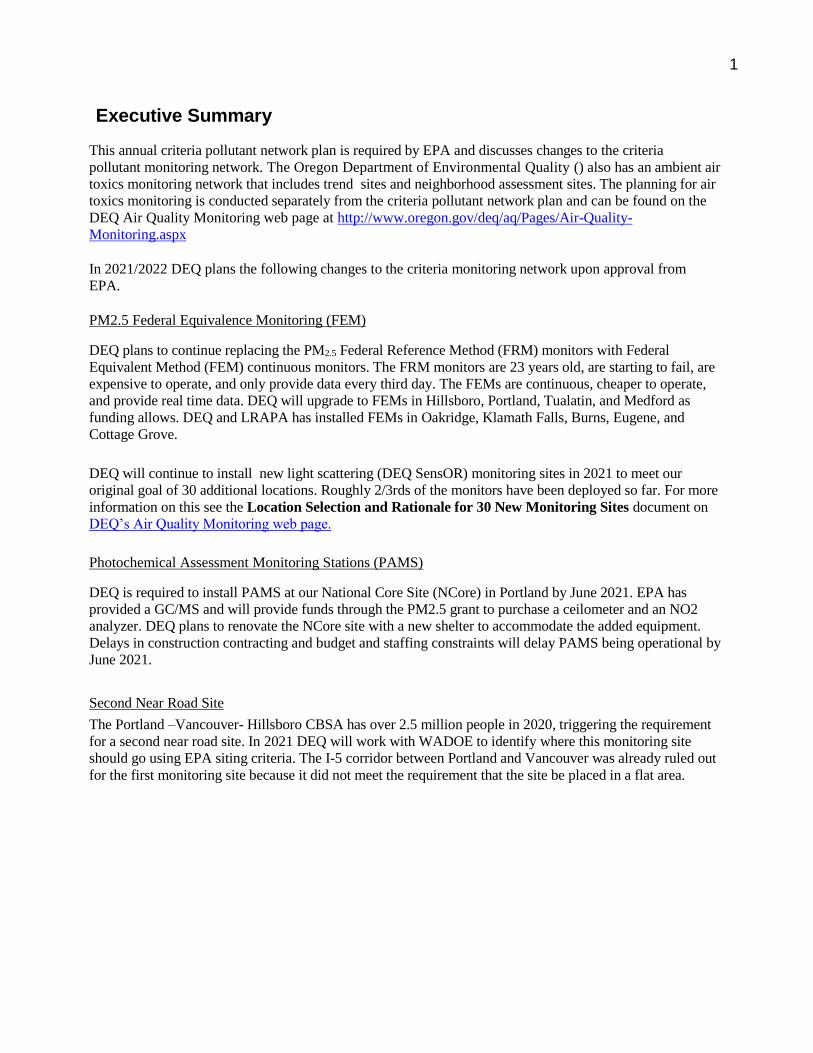
Executive Summary
This annual criteria pollutant network plan is required by EPA and discusses changes to the criteria
pollutant monitoring network. The Oregon Department of Environmental Quality () also has an ambient air
toxics monitoring network that includes trend sites and neighborhood assessment sites. The planning for air
toxics monitoring is conducted separately from the criteria pollutant network plan and can be found on the
DEQ Air Quality Monitoring web page at http://www.oregon.gov/deq/aq/Pages/Air-Quality-
Monitoring.aspx
In 2021/2022 DEQ plans the following changes to the criteria monitoring network upon approval from
EPA.
PM2.5 Federal Equivalence Monitoring (FEM)
DEQ plans to continue replacing the PM2.5 Federal Reference Method (FRM) monitors with Federal
Equivalent Method (FEM) continuous monitors. The FRM monitors are 23 years old, are starting to fail, are
expensive to operate, and only provide data every third day. The FEMs are continuous, cheaper to operate,
and provide real time data. DEQ will upgrade to FEMs in Hillsboro, Portland, Tualatin, and Medford as
funding allows. DEQ and LRAPA has installed FEMs in Oakridge, Klamath Falls, Burns, Eugene, and
Cottage Grove.
DEQ will continue to install new light scattering (DEQ SensOR) monitoring sites in 2021 to meet our
original goal of 30 additional locations. Roughly 2/3rds of the monitors have been deployed so far. For more
information on this see the Location Selection and Rationale for 30 New Monitoring Sites document on
DEQ’s Air Quality Monitoring web page.
Photochemical Assessment Monitoring Stations (PAMS)
DEQ is required to install PAMS at our National Core Site (NCore) in Portland by June 2021. EPA has
provided a GC/MS and will provide funds through the PM2.5 grant to purchase a ceilometer and an NO2
analyzer. DEQ plans to renovate the NCore site with a new shelter to accommodate the added equipment.
Delays in construction contracting and budget and staffing constraints will delay PAMS being operational by
June 2021.
Second Near Road Site
The Portland –Vancouver- Hillsboro CBSA has over 2.5 million people in 2020, triggering the requirement
for a second near road site. In 2021 DEQ will work with WADOE to identify where this monitoring site
should go using EPA siting criteria. The I-5 corridor between Portland and Vancouver was already ruled out
for the first monitoring site because it did not meet the requirement that the site be placed in a flat area.

2
1. Introduction The Oregon Department of Environmental Quality’s (ODEQ) ambient air quality monitoring network is
designed in response to the Environmental Protection Agency’s (EPA) National Monitoring Strategy, state
and local needs, the requirements of air quality maintenance plans and the State Implementation Plans
(SIPs) for non-attainment areas, and Code of Federal Regulations (CFR) requirements.
40 CFR 58.10 requires the state and local air quality surveillance agencies to write an annual ambient air quality monitoring network plan. EPA requires the plan to be put out for public comment and submitted to EPA by July 1st. This report is used to determine if the network meets the monitoring objectives defined in Part 58, Appendix D and to propose modifications to the network in the following year. A more detailed air quality data summary is available annually at http://www.deq.state.or.us/aq/forms/annrpt.htm
2. Monitoring background
2.1 National Monitoring Strategy
The National Monitoring Strategy directs state and local agencies to operate more continuous monitors and to collect real time air quality data. The real time information is available through EPA’s AIRNow and ODEQ’s Air Quality Index (AQI) web pages. In particular, EPA encouraged states to use continuous
PM2.5 monitors instead of the filter base samplers which do not provide real time information. The
National Monitoring Strategy also created National Core (NCORE) sites which contain a wide array of pollutant monitoring. ODEQ’s NCORE site has monitors for Carbon monoxide (CO), Nitrogen oxides
(NOx), Sulfur dioxide (SO2), ozone (O3), particulate matter 2.5 and 10 micrometers in diameter and
smaller (PM2.5 and PM10), PM coarse (PM10-PM2.5=PMc), PM2.5 Speciation, visibility, and
meteorology. The NCORE site is at SE Lafayette Street, Portland.
2.1.1 State and Local Support Our monitors support state and local needs by providing data for the Air Quality Index, local wood stove
management programs, Clean Air Quality Advisories, the Department of Agriculture’s field burning
program, and the US Forest Service and BLM’s forest health program. ODEQ also operates a visibility
network in the Cascades to support Regional Haze requirements protecting pristine Class 1 areas.
2.1.2 AQ Maintenance and Non-attainment support
ODEQ monitoring supports the SIPs and maintenance plans developed for many cities. ODEQ also has
monitors in attainment areas with fast growing populations to support pollution prevention measures.
3
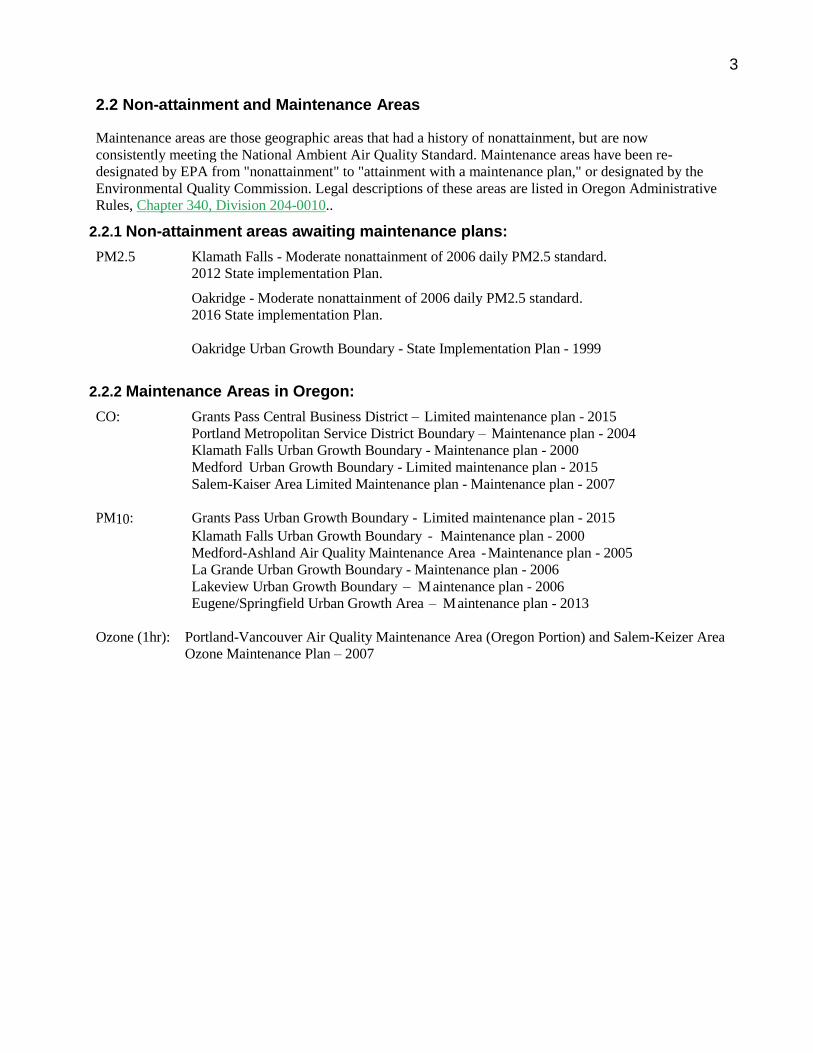
2.2 Non-attainment and Maintenance Areas
Maintenance areas are those geographic areas that had a history of nonattainment, but are now
consistently meeting the National Ambient Air Quality Standard. Maintenance areas have been re-
designated by EPA from "nonattainment" to "attainment with a maintenance plan," or designated by the
Environmental Quality Commission. Legal descriptions of these areas are listed in Oregon Administrative
Rules, Chapter 340, Division 204-0010..
2.2.1 Non-attainment areas awaiting maintenance plans:
PM2.5 Klamath Falls - Moderate nonattainment of 2006 daily PM2.5 standard.
2012 State implementation Plan.
Oakridge - Moderate nonattainment of 2006 daily PM2.5 standard.
2016 State implementation Plan.
Oakridge Urban Growth Boundary - State Implementation Plan - 1999
2.2.2 Maintenance Areas in Oregon:
CO: Grants Pass Central Business District – Limited maintenance plan - 2015
Portland Metropolitan Service District Boundary – Maintenance plan - 2004
Klamath Falls Urban Growth Boundary - Maintenance plan - 2000
Medford Urban Growth Boundary - Limited maintenance plan - 2015
Salem-Kaiser Area Limited Maintenance plan - Maintenance plan - 2007
PM10: Grants Pass Urban Growth Boundary - Limited maintenance plan - 2015
Klamath Falls Urban Growth Boundary - Maintenance plan - 2000
Medford-Ashland Air Quality Maintenance Area -Maintenance plan - 2005
La Grande Urban Growth Boundary - Maintenance plan - 2006
Lakeview Urban Growth Boundary – Maintenance plan - 2006
Eugene/Springfield Urban Growth Area – Maintenance plan - 2013
Ozone (1hr): Portland-Vancouver Air Quality Maintenance Area (Oregon Portion) and Salem-Keizer Area
Ozone Maintenance Plan – 2007

4
3. Overview of Network Operations
3.1 Air Monitoring Network Design
Site Type and Spatial Scale
Federal regulations, specifically 40 CFR Part 58 Appendix D, require that a State and Local Air Monitoring
(SLAMS) network be designed to meet a minimum of three basic monitoring objectives: Provide air pollution
data to the public in a timely manner, support compliance with the National Ambient Air Quality Standards
(NAAQS), and support air pollution research. A variety of site types are needed to support these basic
objectives, including the six general types identified in Appendix D.
1. Sites located to determine the highest concentrations expected to occur in the area covered by the network.
2. Sites located to measure typical concentrations in areas of high population density.
3. Sites located to determine the impact of significant sources or source categories on air quality.
4. Sites located to determine general background concentration levels.
5. Sites located to determine the extent of regional pollutant transport among populated areas; and in support
of secondary standards.
6. Sites located to measure air pollution impacts on visibility, vegetation damage, or other welfare-based
impacts.
The physical siting of an air monitoring station must conform to 40 CFR Part 58 and its location must achieve
a spatial scale of representativeness that is consistent with the monitoring objective and site type. The spatial
scale results from the physical location of the site with respect to the pollutant sources and categories. It
estimates the size of the area surrounding the monitoring site that experiences uniform pollutant concentrations.
The categories of spatial scale are:
1. Microscale-Defines the concentrations in air volumes associated with area dimensions ranging from
several meters up to about 100 meters.
2. Middle scale-Defines the concentration typical of areas up to several city blocks in size with dimensions
ranging from about 100 meters to 0.5 kilometer.
3. Neighborhood scale—Defines concentrations within some extended area of the city that has relatively
uniform land use with dimensions in the 0.5 to 4.0 kilometers range. The neighborhood and urban scales listed
below have the potential to overlap in applications that concern secondarily formed or homogeneously
distributed air pollutants.
4. Urban scale-Defines concentrations within an area of city-like dimensions, on the order of 4 to 50
kilometers. Within a city, the geographic placement of sources may result in there being no single site that can
be said to represent air quality on an urban scale.
5. Regional scale-Defines usually a rural area of reasonably homogeneous geography without large sources,
and extends from tens to hundreds of kilometers.
6. National and global scales-These measurement scales represent concentrations characterizing the nation
and the globe as a whole.

5
Table 1. Relationship Between Site Type and Scale of Representativeness
Site Type Appropriate Spatial Scale
Highest Concentration Micro, Middle, Neighborhood (sometimes urban)
Population Exposure Middle, Neighborhood, Urban
Source Oriented Micro, Middle, Neighborhood
General/Background Neighborhood, Urban, Regional
Welfare-related Impacts Urban, Regional
6
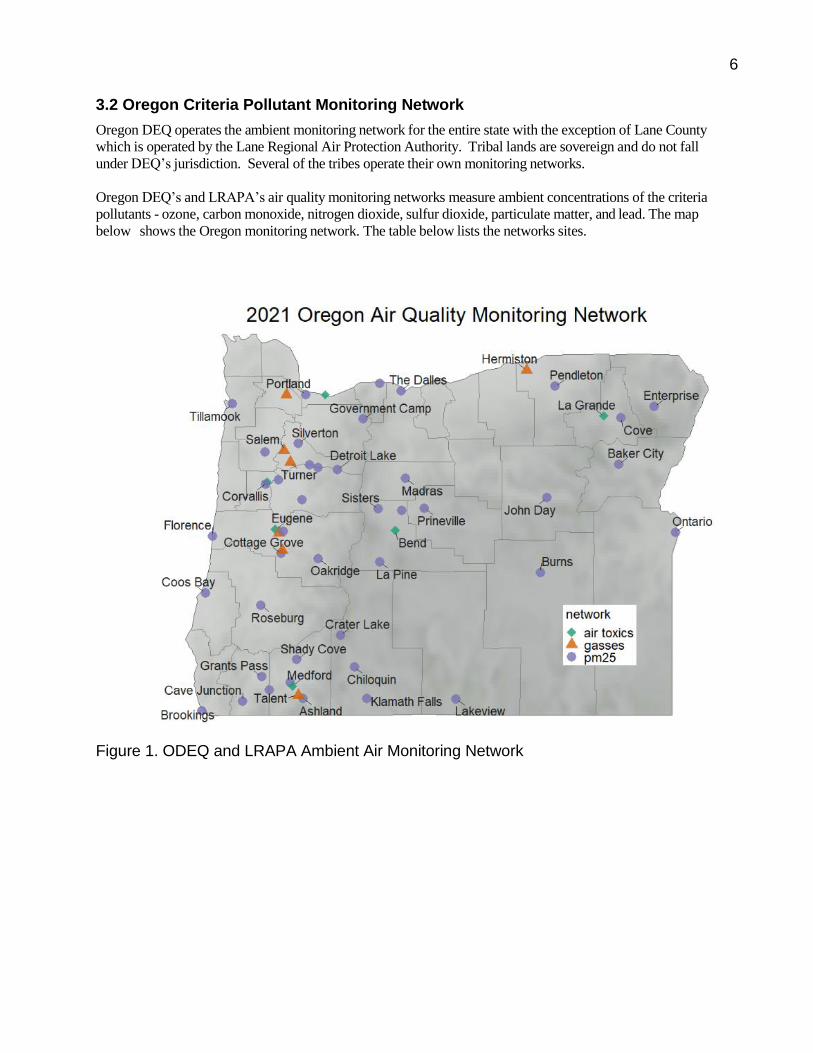
3.2 Oregon Criteria Pollutant Monitoring Network
Oregon DEQ operates the ambient monitoring network for the entire state with the exception of Lane County
which is operated by the Lane Regional Air Protection Authority. Tribal lands are sovereign and do not fall
under DEQ’s jurisdiction. Several of the tribes operate their own monitoring networks.
Oregon DEQ’s and LRAPA’s air quality monitoring networks measure ambient concentrations of the criteria
pollutants - ozone, carbon monoxide, nitrogen dioxide, sulfur dioxide, particulate matter, and lead. The map
below shows the Oregon monitoring network. The table below lists the networks sites.
Figure 1. ODEQ and LRAPA Ambient Air Monitoring Network

7
Table 2. 2020 ODEQ and LRAPA Criteria Pollutant Ambient Air Monitoring Network
City
Ad
dress
Site C
od
e
EPA#
SO
2
CO
NO
2
Ozo
ne
PM
2.5
PM
2.5
Sp
ec
PM
10
Burns Washington Street BWS 410250003 x x
Cottage Grove City Shops CGC 410399004 x
Eugene
Pacific Hwy 99N E99 410390059 x x
Amazon Park EAP 410390060 x x x
(Saginaw) Delight Valley School Rd SAG 410391007 x
Grants Pass Parkside School GPP 410330114 x
Hermiston Municipal Airport HMA 410591003 x
Klamath Falls Peterson School KFP 410350004 x x
La Grande Hall and North Streets LHN 410610123 x
Lakeview Center & M Streets LCM 410370001 x x
Medford Rapp Rd Talent TAL 410290201 x
Welch & Jackson MWJ 410292129 x x
Oakridge School St. OAK 410392013 x x
Portland 57th &SE Lafayette SEL 410510080 x x x x x x x
Humboldt School PHS 410512010 x
Tualatin Tualatin – I-5 TBC 410670005 x x x x
Carus Spangler Rd. SPR 410050004 x
Hillsboro NE Grant St. HHF 410670004 x
Sauvie Island NW SI SIS 410090004 x
Prineville SE Court St. PDP 410130100 x
Salem Salem State Hosp. SSH 410470041 x
(Turner) Cascade Jr. High, CJH 410470004 x
Key: Gasses: SO2 = Sulfur dioxide, CO = Carbon Monoxide, NO2 = Nitrogen dioxide, ozone
Particulates: PM10 = Particulate Matter 10 microns in diameter or smaller PM2.5 = Particulate Matter 2.5 microns in diameter or smaller Spec = PM2.5 chemical speciation,
Lead = no criteria pollutant lead monitors
Meteorology monitors:
WS/WD = Wind speed and direction, Temp = Outdoor temperature at 2 meters, DT = Delta (difference) in Temperature at 2 and 10 meters, BP = Barometric Pressure, RH = Relative Humidity, SR = solar radiation
Other: HAPS = Hazardous air pollutants or air toxics, includes lead. Not shown here.

8
3.2.1 Ozone Network
Oregon DEQ and LRAPA have 10 monitoring sites for ozone. Four in the Portland-Metro area
(Southwest Clean Air Agency also has an additional one in Vancouver), two in Salem, Two in Eugene-
Springfield, one in the Medford-Ashland area, and one in Hermiston. Maps of the network are shown
below.
Annual
Summer
I-5 at
Tualatin
Sauvie
Island
Portland
Hermiston
Canby
Salem
Eugene &
Springfield
Medford
Figure 2. Ozone Monitoring Network
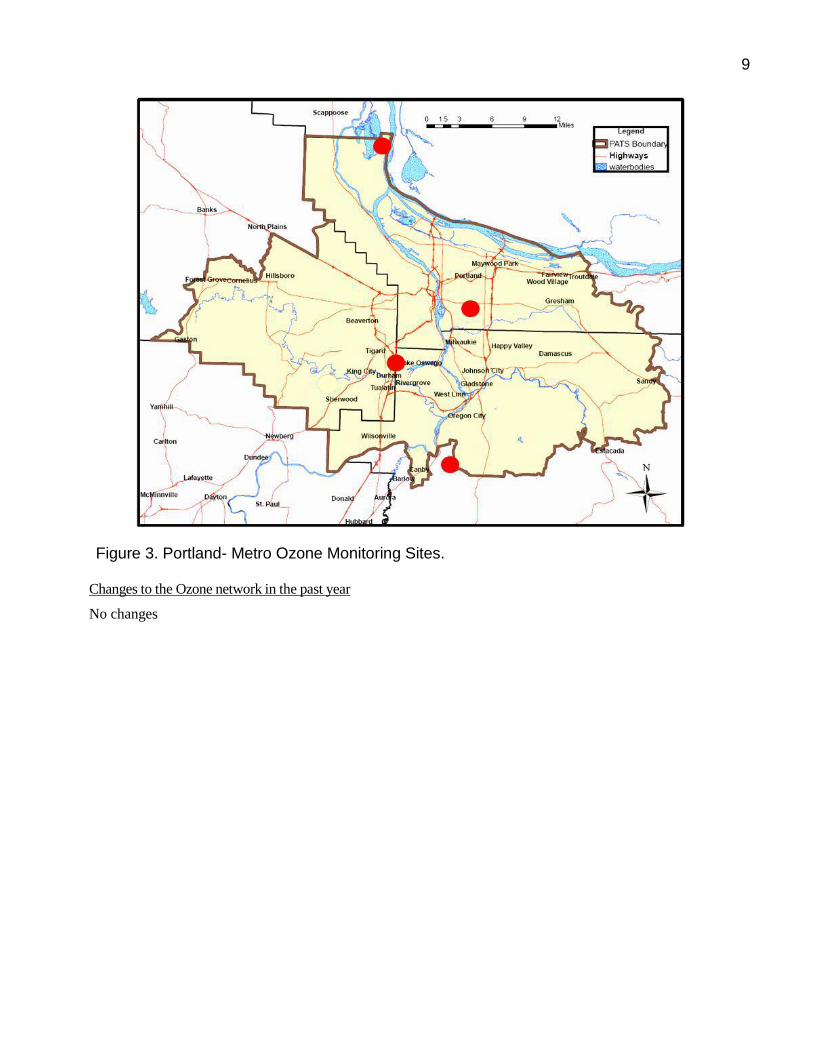
9
Figure 3. Portland- Metro Ozone Monitoring Sites. Changes to the Ozone network in the past year
No changes

10
3.2.2 Nitrogen Dioxide Network
Oregon DEQ has two monitoring sites for NO2 both in the Portland-Metro area. One is a community scale
site located in SE Portland. The other is the near roadway site which measures vehicle contributions to NO2.
LRAPA has no monitoring sites.
Figure 4. NO2 Monitoring Network
S = Source monitor (measuring I-5)
C = Community monitor (Measuring in neighborhood)
Changes to the NO2 network in the past year
No changes
C
S
11
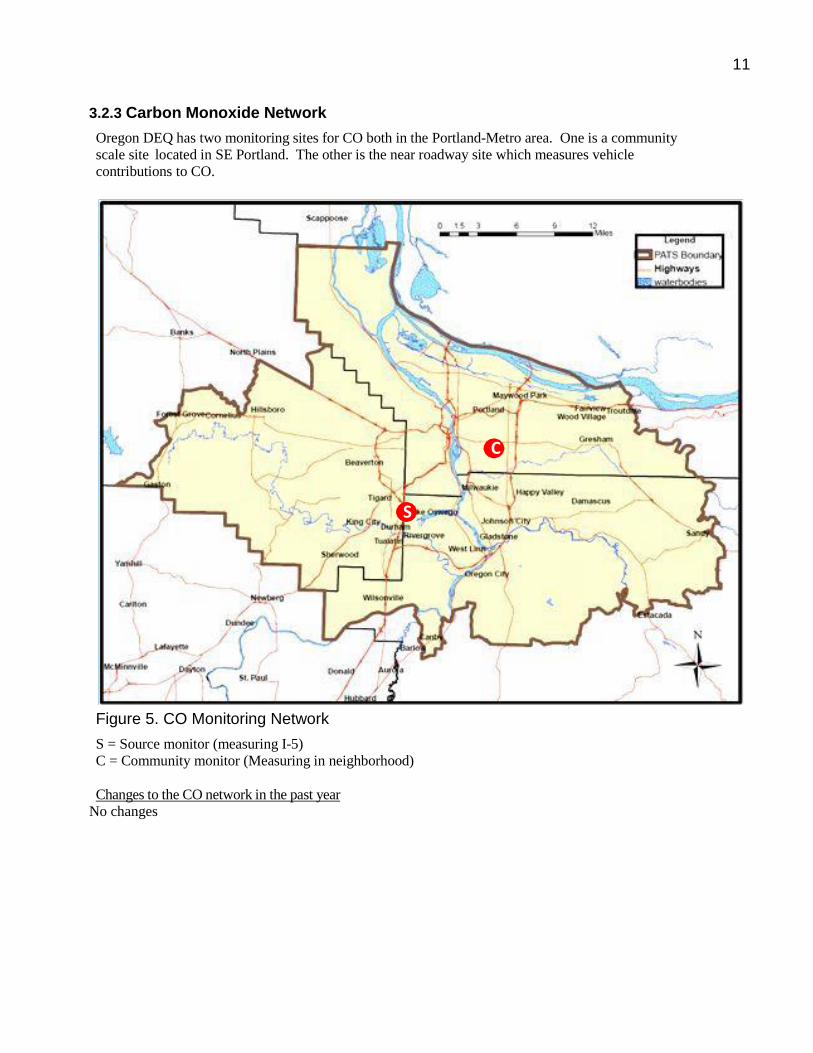
3.2.3 Carbon Monoxide Network
Oregon DEQ has two monitoring sites for CO both in the Portland-Metro area. One is a community
scale site located in SE Portland. The other is the near roadway site which measures vehicle
contributions to CO.
Figure 5. CO Monitoring Network
S = Source monitor (measuring I-5)
C = Community monitor (Measuring in neighborhood)
Changes to the CO network in the past year
No changes
C
S
12
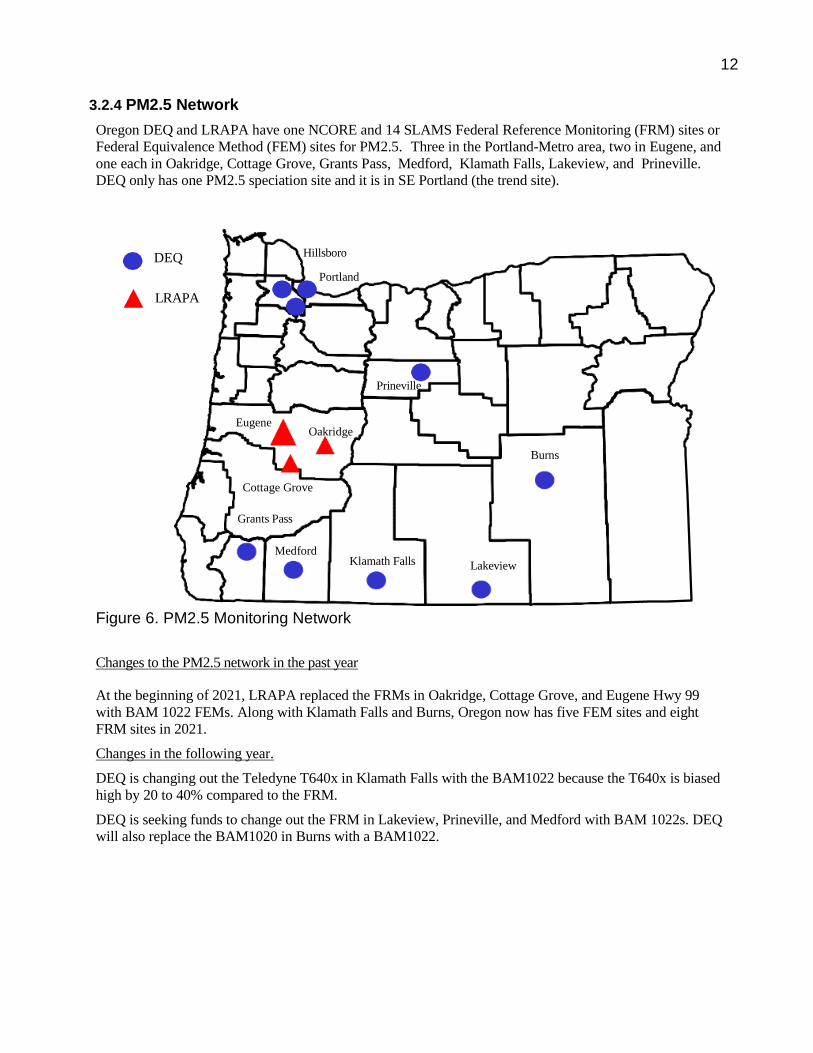
3.2.4 PM2.5 Network
Oregon DEQ and LRAPA have one NCORE and 14 SLAMS Federal Reference Monitoring (FRM) sites or
Federal Equivalence Method (FEM) sites for PM2.5. Three in the Portland-Metro area, two in Eugene, and
one each in Oakridge, Cottage Grove, Grants Pass, Medford, Klamath Falls, Lakeview, and Prineville.
DEQ only has one PM2.5 speciation site and it is in SE Portland (the trend site).
DEQ
LRAPA
Hillsboro
Portland
Prineville
Eugene
Oakridge
Burns
Cottage Grove
Grants Pass
Medford Klamath Falls Lakeview
Figure 6. PM2.5 Monitoring Network
Changes to the PM2.5 network in the past year
At the beginning of 2021, LRAPA replaced the FRMs in Oakridge, Cottage Grove, and Eugene Hwy 99
with BAM 1022 FEMs. Along with Klamath Falls and Burns, Oregon now has five FEM sites and eight
FRM sites in 2021.
Changes in the following year.
DEQ is changing out the Teledyne T640x in Klamath Falls with the BAM1022 because the T640x is biased
high by 20 to 40% compared to the FRM.
DEQ is seeking funds to change out the FRM in Lakeview, Prineville, and Medford with BAM 1022s. DEQ
will also replace the BAM1020 in Burns with a BAM1022.
13
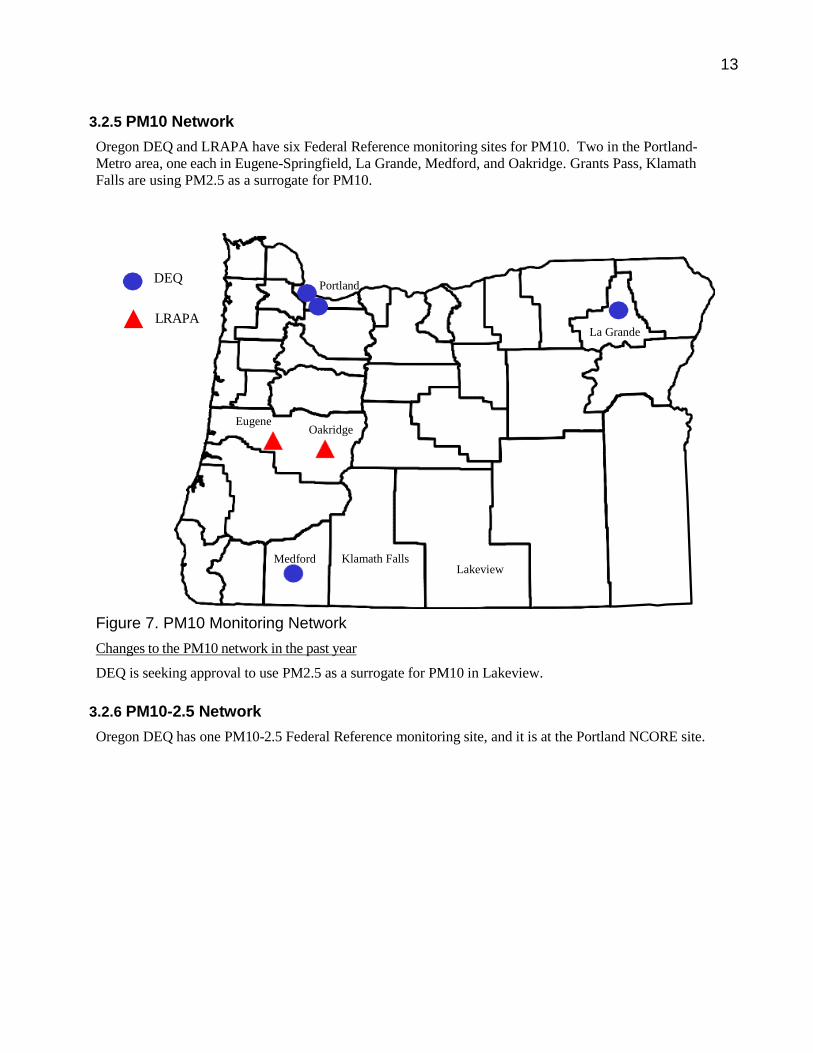
3.2.5 PM10 Network
Oregon DEQ and LRAPA have six Federal Reference monitoring sites for PM10. Two in the Portland-
Metro area, one each in Eugene-Springfield, La Grande, Medford, and Oakridge. Grants Pass, Klamath
Falls are using PM2.5 as a surrogate for PM10.
DEQ
LRAPA
Portland
Eugene Oakridge
Medford
Figure 7. PM10 Monitoring Network
Changes to the PM10 network in the past year
DEQ is seeking approval to use PM2.5 as a surrogate for PM10 in Lakeview.
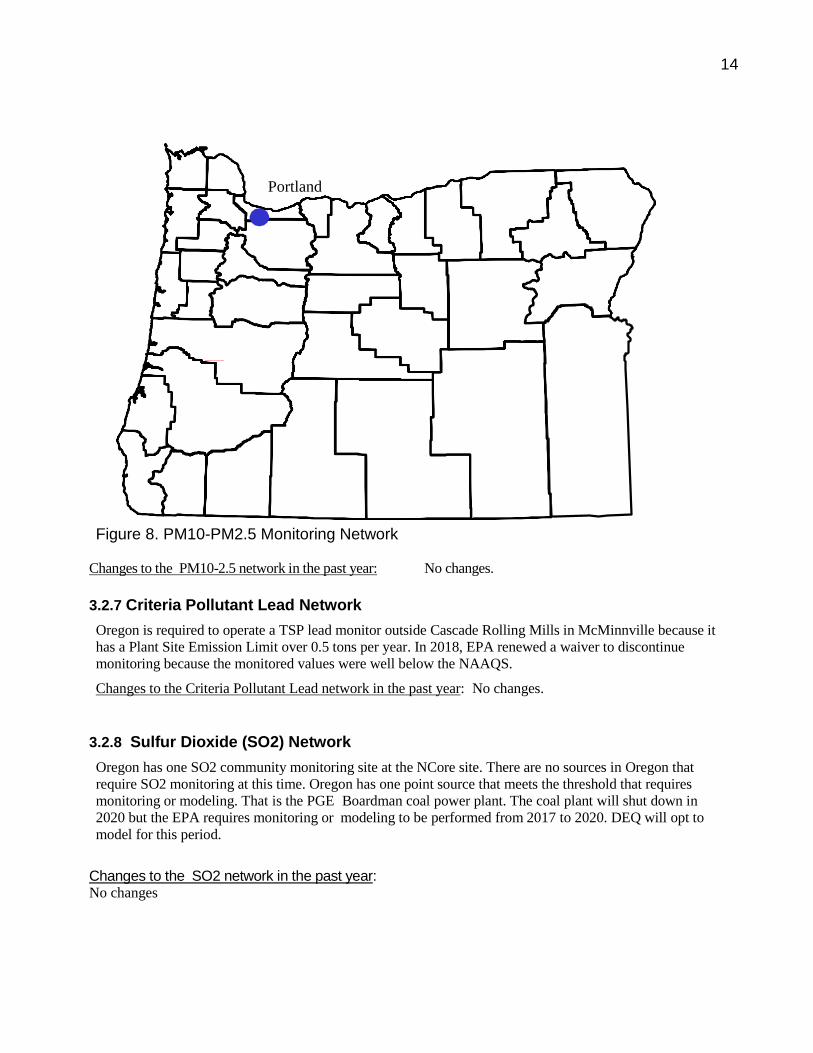
3.2.6 PM10-2.5 Network
Oregon DEQ has one PM10-2.5 Federal Reference monitoring site, and it is at the Portland NCORE site.
Klamath Falls Lakeview
La Grande
14
Figure 8. PM10-PM2.5 Monitoring Network
Changes to the PM10-2.5 network in the past year: No changes.
3.2.7 Criteria Pollutant Lead Network
Oregon is required to operate a TSP lead monitor outside Cascade Rolling Mills in McMinnville because it
has a Plant Site Emission Limit over 0.5 tons per year. In 2018, EPA renewed a waiver to discontinue
monitoring because the monitored values were well below the NAAQS.
Changes to the Criteria Pollutant Lead network in the past year: No changes.
3.2.8 Sulfur Dioxide (SO2) Network
Oregon has one SO2 community monitoring site at the NCore site. There are no sources in Oregon that
require SO2 monitoring at this time. Oregon has one point source that meets the threshold that requires
monitoring or modeling. That is the PGE Boardman coal power plant. The coal plant will shut down in
2020 but the EPA requires monitoring or modeling to be performed from 2017 to 2020. DEQ will opt to
model for this period.
Changes to the SO2 network in the past year: No changes
Portland
15
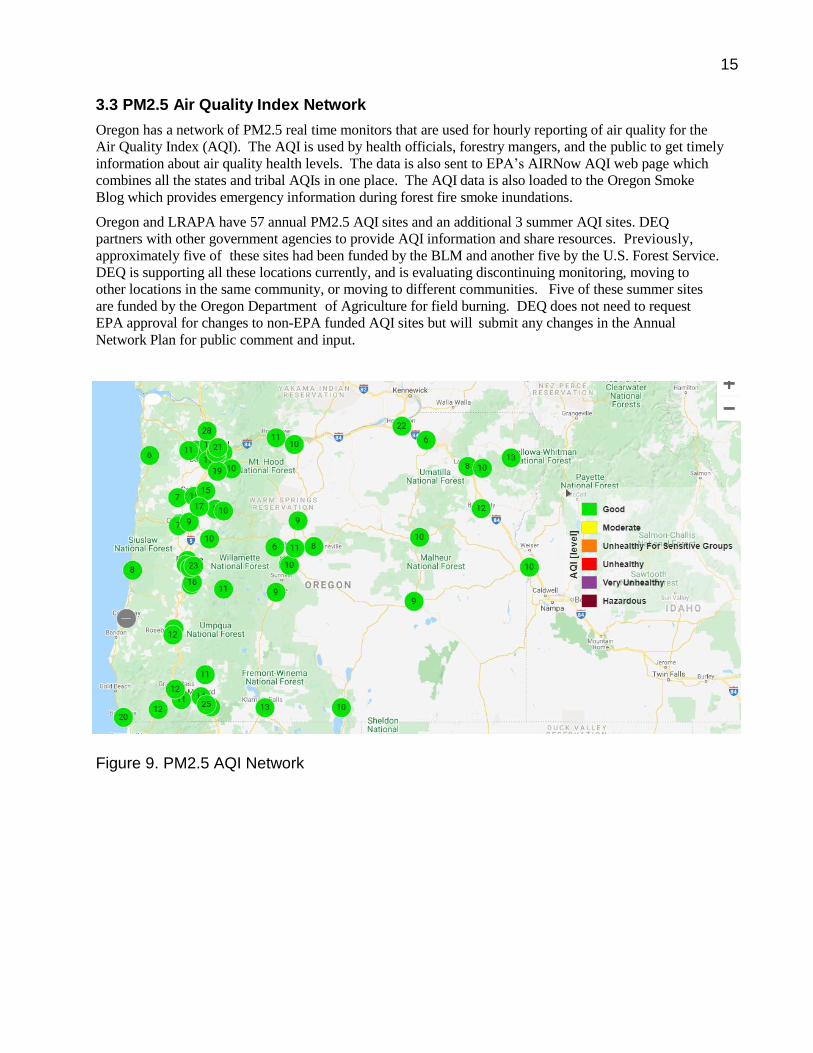
3.3 PM2.5 Air Quality Index Network
Oregon has a network of PM2.5 real time monitors that are used for hourly reporting of air quality for the
Air Quality Index (AQI). The AQI is used by health officials, forestry mangers, and the public to get timely
information about air quality health levels. The data is also sent to EPA’s AIRNow AQI web page which
combines all the states and tribal AQIs in one place. The AQI data is also loaded to the Oregon Smoke
Blog which provides emergency information during forest fire smoke inundations.
Oregon and LRAPA have 57 annual PM2.5 AQI sites and an additional 3 summer AQI sites. DEQ
partners with other government agencies to provide AQI information and share resources. Previously,
approximately five of these sites had been funded by the BLM and another five by the U.S. Forest Service.
DEQ is supporting all these locations currently, and is evaluating discontinuing monitoring, moving to
other locations in the same community, or moving to different communities. Five of these summer sites
are funded by the Oregon Department of Agriculture for field burning. DEQ does not need to request
EPA approval for changes to non-EPA funded AQI sites but will submit any changes in the Annual
Network Plan for public comment and input.
Figure 9. PM2.5 AQI Network
16
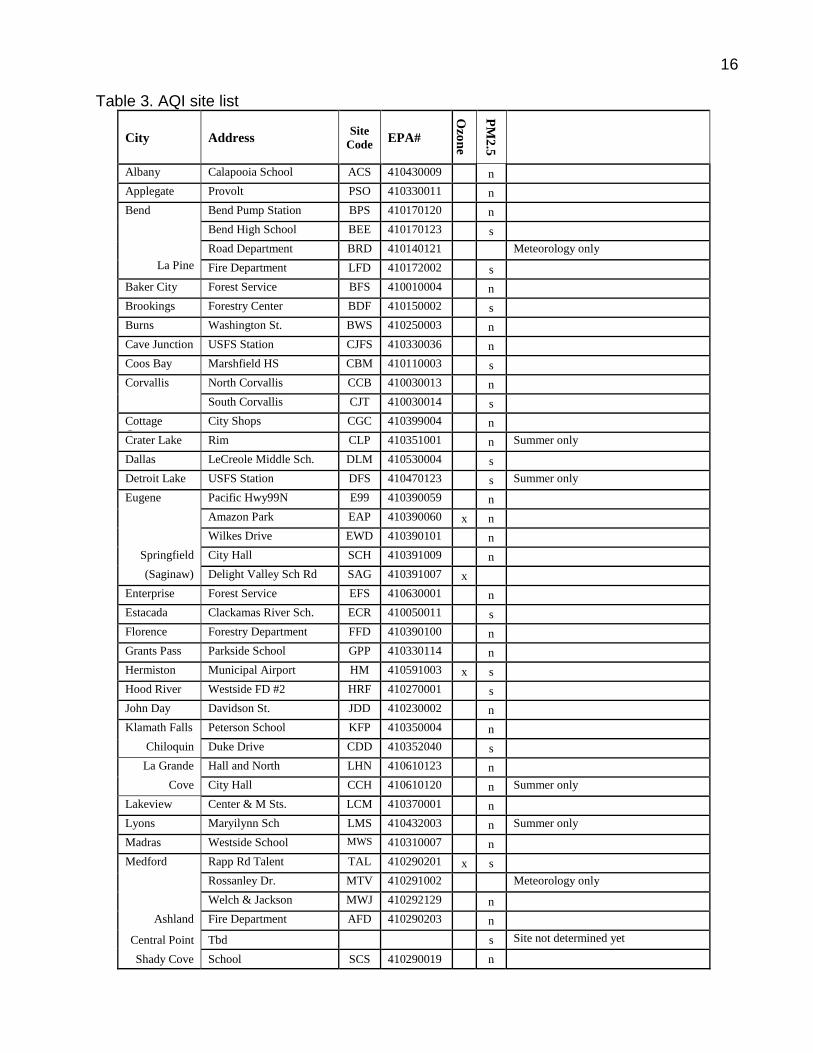
Table 3. AQI site list
City Address Site
Code EPA#
Ozo
ne
PM
2.5
Albany Calapooia School ACS 410430009 n
Applegate Provolt PSO 410330011 n
Bend
La Pine
Bend Pump Station BPS 410170120 n
Bend High School BEE 410170123 s
Road Department BRD 410140121 Meteorology only
Fire Department LFD 410172002 s
Baker City Forest Service BFS 410010004 n
Brookings Forestry Center BDF 410150002 s
Burns Washington St. BWS 410250003 n
Cave Junction USFS Station CJFS 410330036 n
Coos Bay Marshfield HS CBM 410110003 s
Corvallis North Corvallis CCB 410030013 n
South Corvallis CJT 410030014 s
Cottage
Grove
City Shops CGC 410399004 n
Crater Lake Rim CLP 410351001 n Summer only
Dallas LeCreole Middle Sch. DLM 410530004 s
Detroit Lake USFS Station DFS 410470123
s Summer only
Eugene Pacific Hwy99N E99 410390059 n
Amazon Park EAP 410390060 x n
Wilkes Drive EWD 410390101 n
Springfield City Hall SCH 410391009 n
(Saginaw) Delight Valley Sch Rd SAG 410391007 x
Enterprise Forest Service EFS 410630001 n
Estacada Clackamas River Sch. ECR 410050011 s
Florence Forestry Department FFD 410390100 n
Grants Pass Parkside School GPP 410330114 n
Hermiston Municipal Airport HM
A
410591003 x s
Hood River Westside FD #2 HRF 410270001 s
John Day Davidson St. JDD 410230002 n
Klamath Falls Peterson School KFP 410350004 n
Chiloquin Duke Drive CDD 410352040 s
La Grande Hall and North LHN 410610123 n
Cove City Hall CCH 410610120 n Summer only
Lakeview Center & M Sts. LCM 410370001 n
Lyons Maryilynn Sch LMS 410432003
n Summer only
Madras Westside School MWS 410310007 n
Medford Rapp Rd Talent TAL 410290201 x s
Rossanley Dr. MTV 410291002 Meteorology only
Welch & Jackson MWJ 410292129 n
Ashland Fire Department AFD 410290203 n
Central Point Tbd s Site not determined yet
Shady Cove School SCS 410290019 n
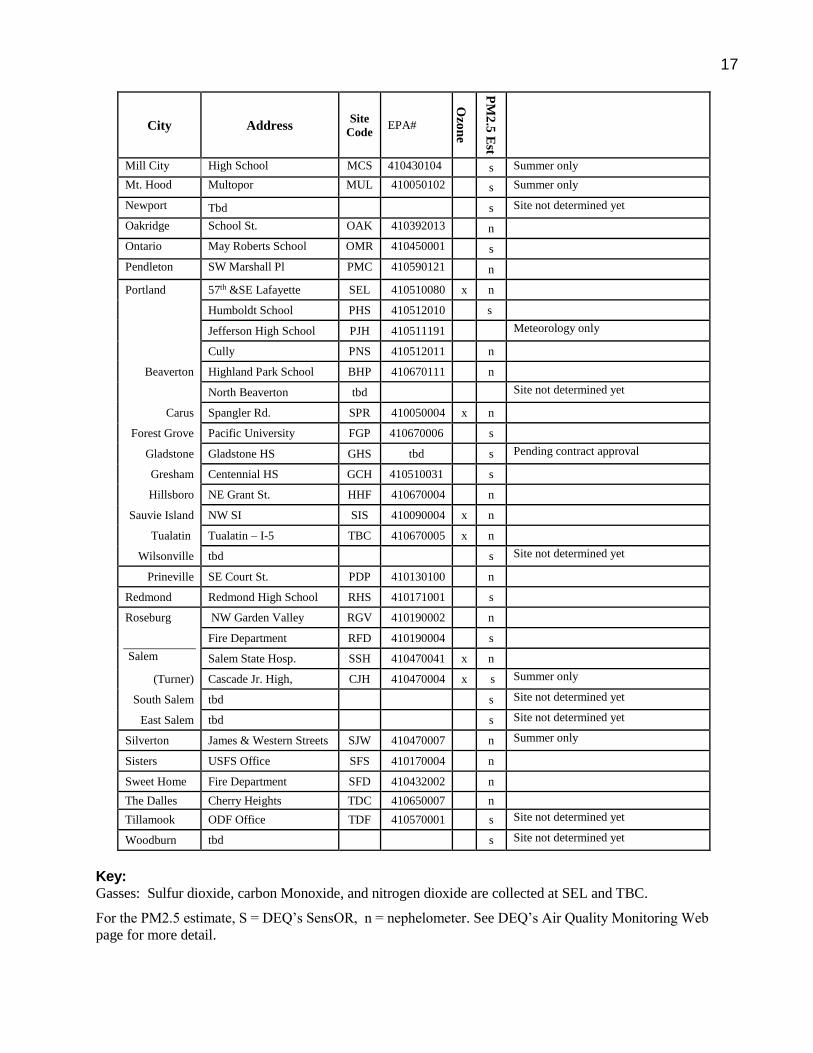
17
City Address Site
Code EPA#
Ozo
ne
PM
2.5
Est
Mill City High School MCS 410430104 s Summer only
Mt. Hood Multopor MUL 410050102 s Summer only
Newport Tbd s Site not determined yet
Oakridge School St. OAK 410392013 n
Ontario May Roberts School OMR 410450001 s
Pendleton SW Marshall Pl PMC 410590121 n
Portland 57th &SE Lafayette SEL 410510080 x n
Humboldt School PHS 410512010 s
Jefferson High School PJH 410511191 Meteorology only
Cully PNS 410512011 n
Beaverton Highland Park School BHP 410670111 n
North Beaverton tbd Site not determined yet
Carus Spangler Rd. SPR 410050004 x n
Forest Grove Pacific University FGP 410670006 s
Gladstone Gladstone HS GHS tbd s Pending contract approval
Gresham Centennial HS GCH 410510031 s
Hillsboro NE Grant St. HHF 410670004 n
Sauvie Island NW SI SIS 410090004 x n
Tualatin Tualatin – I-5 TBC 410670005 x n
Wilsonville tbd s Site not determined yet
Prineville SE Court St. PDP 410130100 n
Redmond Redmond High School RHS 410171001 s
Roseburg NW Garden Valley RGV 410190002 n
Salem
Fire Department RFD 410190004 s
Salem State Hosp. SSH 410470041 x n
(Turner) Cascade Jr. High, CJH 410470004 x s Summer only
South Salem tbd s Site not determined yet
East Salem tbd s Site not determined yet
Silverton James & Western Streets SJW 410470007 n Summer only
Sisters USFS Office SFS 410170004 n
Sweet Home Fire Department SFD 410432002 n
The Dalles Cherry Heights TDC 410650007 n
Tillamook ODF Office TDF 410570001 s Site not determined yet
Woodburn tbd s Site not determined yet
Key: Gasses: Sulfur dioxide, carbon Monoxide, and nitrogen dioxide are collected at SEL and TBC.
For the PM2.5 estimate, S = DEQ’s SensOR, n = nephelometer. See DEQ’s Air Quality Monitoring Web
page for more detail.
18
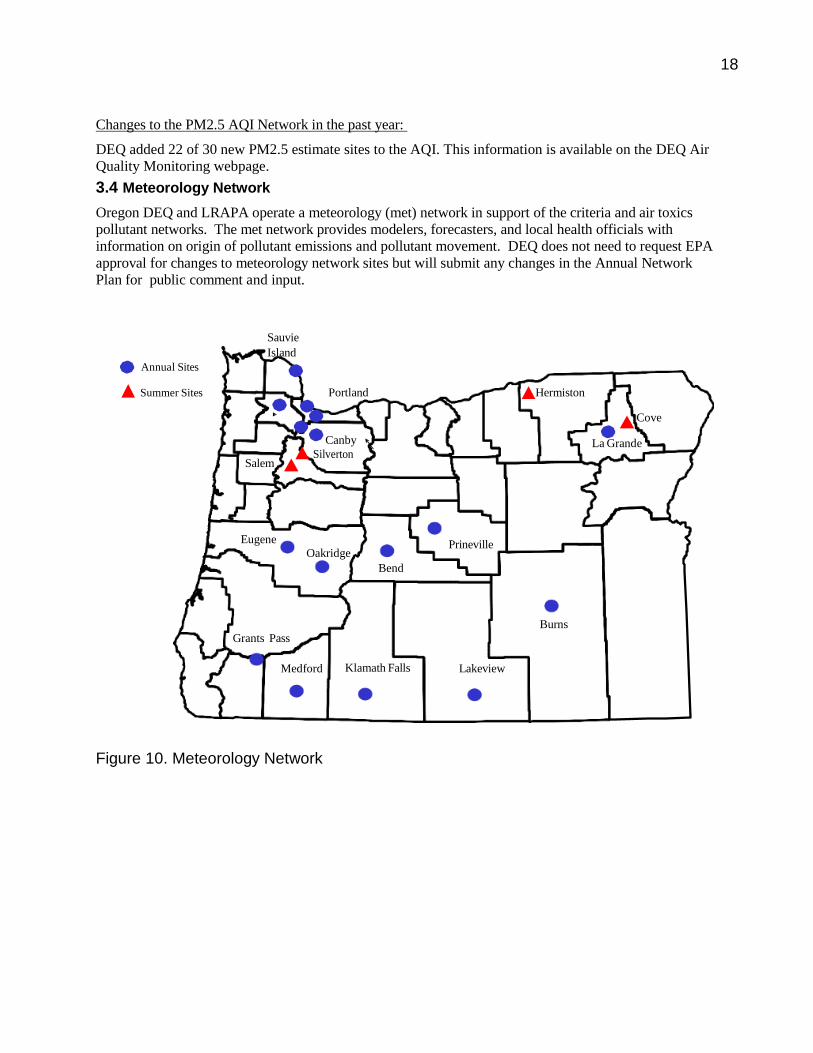
Changes to the PM2.5 AQI Network in the past year:
DEQ added 22 of 30 new PM2.5 estimate sites to the AQI. This information is available on the DEQ Air
Quality Monitoring webpage.
3.4 Meteorology Network
Oregon DEQ and LRAPA operate a meteorology (met) network in support of the criteria and air toxics
pollutant networks. The met network provides modelers, forecasters, and local health officials with
information on origin of pollutant emissions and pollutant movement. DEQ does not need to request EPA
approval for changes to meteorology network sites but will submit any changes in the Annual Network
Plan for public comment and input.
Annual Sites
Summer Sites
Sauvie
Island
Salem
Portland
Canby
Silverton
Hermiston
Cove
La Grande
Eugene
Oakridge
Bend
Prineville
Burns
Grants Pass
Medford Klamath Falls Lakeview
Figure 10. Meteorology Network

19
Table 4. Meteorology Network
City
Ad
dress
Site C
od
e
EP
A#
Win
d
Tem
p
Delta
T
RH
BP
SR
Bend Road Department BRD 410140121 x x x x x
Burns Washington St. BWS 410250003 x x x
Eugene Hwy 99 E99 410390059 x
Wilkes Drive EWD 410390101 x x x
Springfield City Hall SCH 410391009 x
Florence Forestry Department FFD 410390100 x x x x
Grants Pass Parkside School GPP 410330114 x x x
Hermiston Municipal Airport HMA 410591003 x
Klamath Falls Peterson School KFP 410350004 x x x x x
La Grande Hall and North LHN 410610123 x x x x
Cove City Hall CCH 410610120 x
Lakeview Center & M Streets LCM 410370001 x x x
Medford Rossanley Drive MTV 410291002 x x x x x x
Oakridge School St. OAK 410392013 x x x
Portland 57th &SE Lafayette SEL 410510080 x x x x x
Jefferson High School PJH 410511191 x
Cully PNS 410512011 x
Carus Spangler Rd. SPR 410050004 x x x
Hillsboro NE Grant St. HHF 410670004 x
Sauvie Island NW SI SIS 410090004 x x
Tualatin Tualatin – I-5 TBC 410670005 x x x
Prineville SE Court St. PDP 410130100 x x x x x
Salem-Turner Cascade Jr. High, CJH 410470004 x
Silverton James & Western Streets SJW 410470007 x
Met: Wind = Wind speed and direction, Temp = Outdoor temperature at 2 meters, DT = Delta (difference) in Temperature at 2 and 10 meters, BP = Barometric Pressure, RH = Relative Humidity, SR = solar radiation
Changes to the Meteorological Network in the past year: No changes
20
20
4. Planned Changes to Network
All major modifications to the ambient air quality monitoring network required by EPA are submitted to the regional administrator for review and
approval in the network assessment. Changes that do not require EPA approval are also mentioned for informational purposes.
4.1 Criteria Pollutant Changes PM2.5
The Klamath Falls monitoring station is equipped with the Teledyne T640x continuous FEM method for continuous monitoring. It will be changed
to a Met One BAM 1022 in the hope of improving the accuracy compared to the FRM. As funds become available, other sites like Burns, Lakeview,
Prineville, and Medford will be changed to BAM 1022s. Hillsboro, Tualatin, and Portland may be changed to T640x FEMs if their bias meets the
EPA FEM/FRM bias and correlation requirements used to designate FEMS. LRAPA has changed Oakridge, Cottage Grove, and Eugene Hwy 99 to
BAM 1022 FEMs. LRAPA will change over Eugene Amazon Park to FEM in January 2022.
PM10
DEQ is seeking approval from EPA to use PM2.5 as a surrogate for PM10 in Lakeview to meet the PM10 maintenance plan monitoring
requirements.
Photochemical Assessment Monitoring Stations (PAMS)
Based on 40 CFR part 58, Appendix D, State air monitoring agencies are required to begin making PAMS measurements at their NCore location(s)
with a USEPA extension to the start date of June 1, 2021. EPA requires the addition of NOy, near real time VOC, aldehyde, and mixing heights
monitoring. DEQ is planning to begin making PAMS measurements at the NCore site (Portland SE Lafayette, 51-051-0080) in late summer 2021
following the installation of a new shelter.
NO2
The Portland – Vancouver – Hillsboro CBSA is estimated to have a 2020 population over 2.5 million people, triggering the requirement for a second
near road site. In 2021, DEQ will work with Washington DOE to determine where that monitoring site should be. Funding for site installment and
operation will need to be determined.
21
21
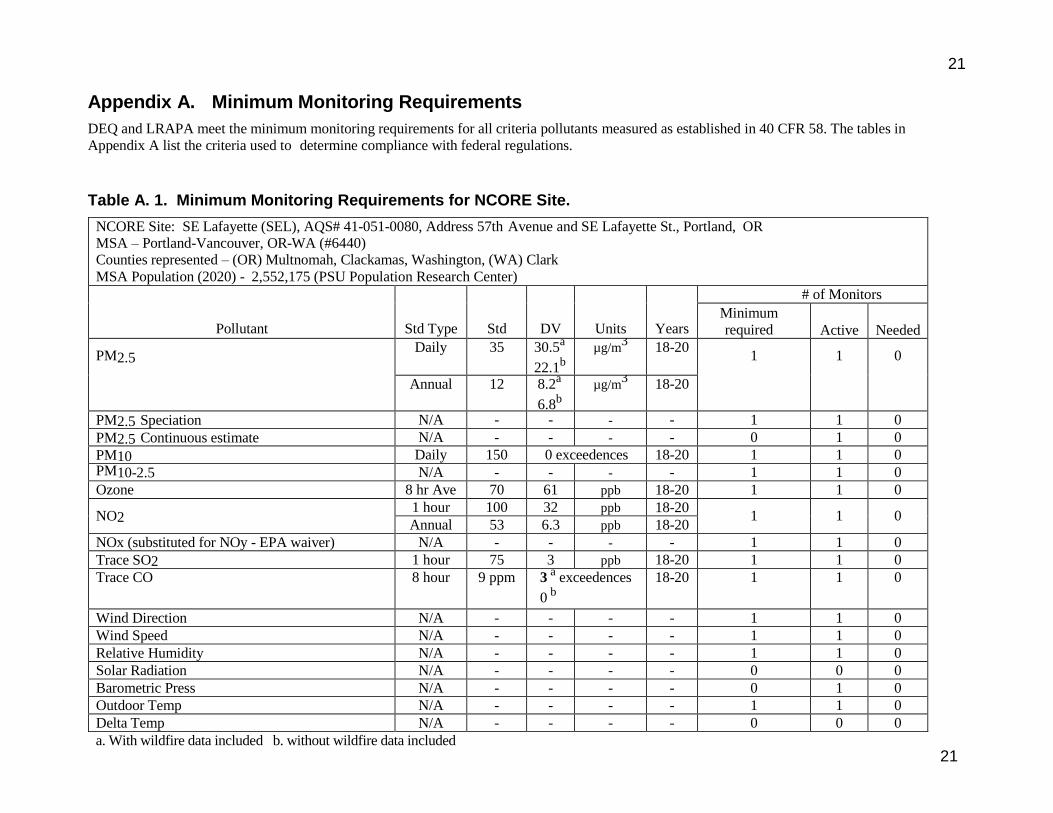
Appendix A. Minimum Monitoring Requirements
DEQ and LRAPA meet the minimum monitoring requirements for all criteria pollutants measured as established in 40 CFR 58. The tables in
Appendix A list the criteria used to determine compliance with federal regulations.
Table A. 1. Minimum Monitoring Requirements for NCORE Site.
NCORE Site: SE Lafayette (SEL), AQS# 41-051-0080, Address 57th Avenue and SE Lafayette St., Portland, OR
MSA – Portland-Vancouver, OR-WA (#6440) Counties represented – (OR) Multnomah, Clackamas, Washington, (WA) Clark
MSA Population (2020) - 2,552,175 (PSU Population Research Center)
Pollutant
Std Type
Std
DV
Units
Years
# of Monitors
Minimum
required Active Needed
PM2.5 Daily 35 30.5
a
22.1b
µg/m3
18-20 1 1 0
Annual 12 8.2a
6.8b
µg/m3
18-20
PM2.5 Speciation N/A - - - - 1 1 0
PM2.5 Continuous estimate N/A - - - - 0 1 0
PM10 Daily 150 0 exceedences
exceedences
18-20 1 1 0 PM10-2.5 N/A - - - - 1 1 0
Ozone 8 hr Ave 70 61 ppb 18-20 1 1 0
NO2 1 hour 100 32 ppb 18-20
1 1 0 Annual 53 6.3 ppb 18-20
NOx (substituted for NOy - EPA waiver) N/A - - - - 1 1 0
Trace SO2 1 hour 75 3 ppb 18-20 1 1 0
Trace CO 8 hour 9 ppm 3 a
exceedences
0 b
18-20 1 1 0
Wind Direction N/A - - - - 1 1 0
Wind Speed N/A - - - - 1 1 0
Relative Humidity N/A - - - - 1 1 0
Solar Radiation N/A - - - - 0 0 0
Barometric Press N/A - - - - 0 1 0
Outdoor Temp N/A - - - - 1 1 0
Delta Temp N/A - - - - 0 0 0
a. With wildfire data included b. without wildfire data included
22
22
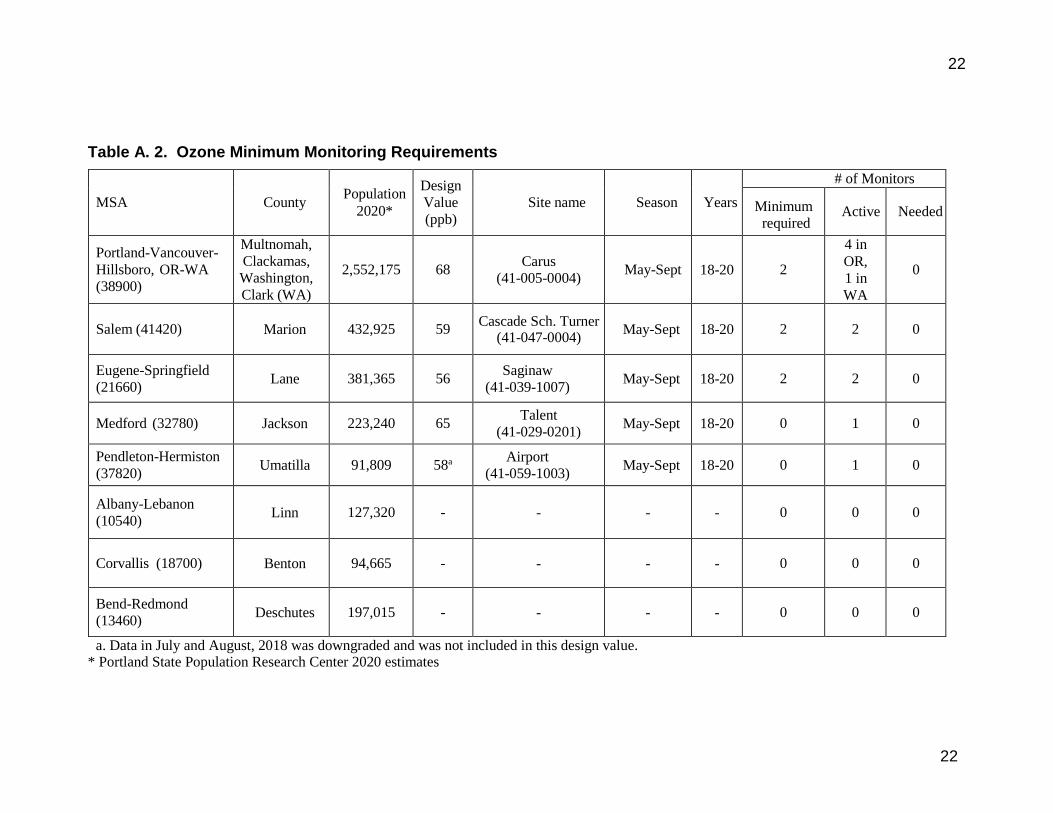
Table A. 2. Ozone Minimum Monitoring Requirements
MSA County Population
2020*
Design
Value
(ppb)
Site name Season Years
# of Monitors
Minimum
required Active Needed
Portland-Vancouver-
Hillsboro, OR-WA
(38900)
Multnomah,
Clackamas,
Washington,
Clark (WA)
2,552,175 68
Carus
(41-005-0004) May-Sept 18-20 2
4 in
OR,
1 in
WA
0
Salem (41420) Marion 432,925 59 Cascade Sch. Turner
(41-047-0004) May-Sept 18-20 2 2 0
Eugene-Springfield
(21660) Lane 381,365 56
Saginaw
(41-039-1007) May-Sept 18-20 2 2 0
Medford (32780) Jackson 223,240 65 Talent
(41-029-0201) May-Sept 18-20 0 1 0
Pendleton-Hermiston
(37820) Umatilla 91,809 58a
Airport
(41-059-1003) May-Sept 18-20 0 1 0
Albany-Lebanon
(10540) Linn 127,320 - - - - 0 0 0
Corvallis (18700) Benton 94,665 - - - - 0 0 0
Bend-Redmond
(13460) Deschutes 197,015 - - - - 0 0 0
a. Data in July and August, 2018 was downgraded and was not included in this design value. * Portland State Population Research Center 2020 estimates
23
23
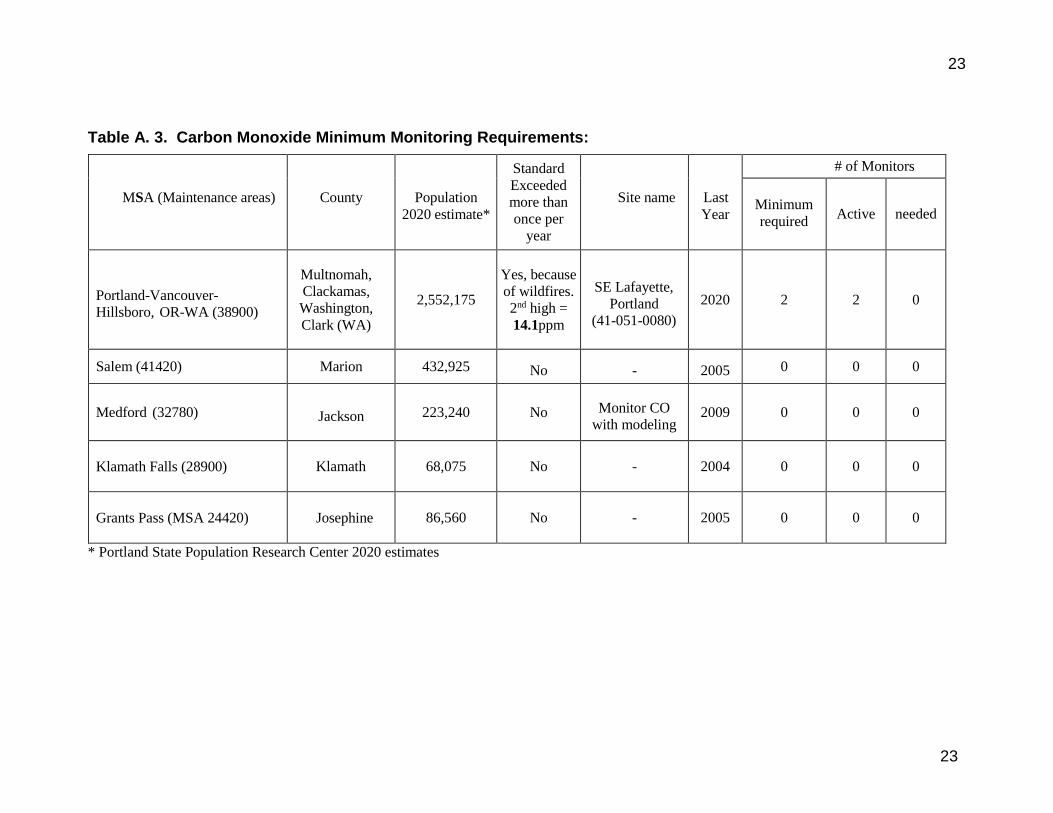
Table A. 3. Carbon Monoxide Minimum Monitoring Requirements:
MSA (Maintenance areas)
County
Population
2020 estimate*
Standard
Exceeded
more than
once per
year
Site name
Last
Year
# of Monitors
Minimum
required
Active
needed
Portland-Vancouver-
Hillsboro, OR-WA (38900)
Multnomah,
Clackamas,
Washington,
Clark (WA)
2,552,175
Yes, because
of wildfires.
2nd high =
14.1ppm
SE Lafayette,
Portland
(41-051-0080)
2020 2 2 0
Salem (41420) Marion 432,925 No - 2005 0 0 0
Medford (32780) Jackson 223,240 No Monitor CO
with modeling 2009 0 0 0
Klamath Falls (28900) Klamath 68,075 No - 2004 0 0 0
Grants Pass (MSA 24420) Josephine 86,560 No - 2005 0 0 0
* Portland State Population Research Center 2020 estimates
24
24
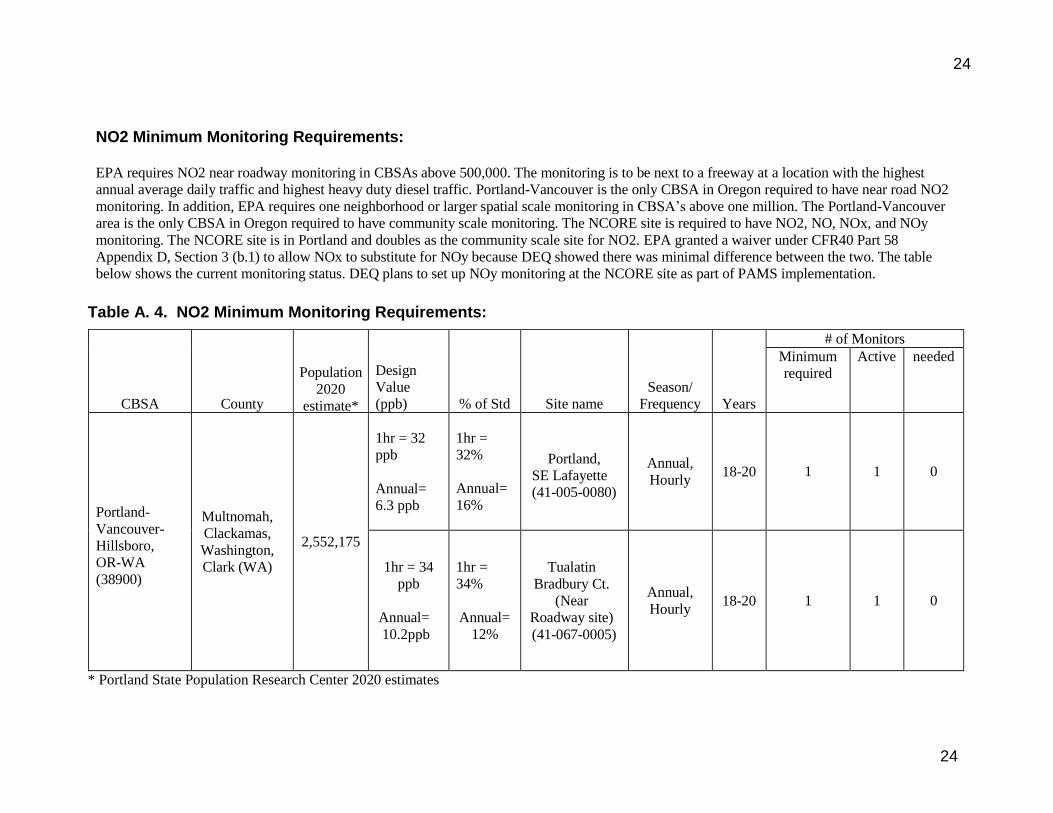
NO2 Minimum Monitoring Requirements:
EPA requires NO2 near roadway monitoring in CBSAs above 500,000. The monitoring is to be next to a freeway at a location with the highest
annual average daily traffic and highest heavy duty diesel traffic. Portland-Vancouver is the only CBSA in Oregon required to have near road NO2
monitoring. In addition, EPA requires one neighborhood or larger spatial scale monitoring in CBSA’s above one million. The Portland-Vancouver
area is the only CBSA in Oregon required to have community scale monitoring. The NCORE site is required to have NO2, NO, NOx, and NOy
monitoring. The NCORE site is in Portland and doubles as the community scale site for NO2. EPA granted a waiver under CFR40 Part 58
Appendix D, Section 3 (b.1) to allow NOx to substitute for NOy because DEQ showed there was minimal difference between the two. The table
below shows the current monitoring status. DEQ plans to set up NOy monitoring at the NCORE site as part of PAMS implementation.
Table A. 4. NO2 Minimum Monitoring Requirements:
CBSA
County
Population
2020
estimate*
Design
Value
(ppb)
% of Std
Site name
Season/
Frequency
Years
# of Monitors
Minimum
required
Active needed
Portland-
Vancouver-
Hillsboro,
OR-WA
(38900)
Multnomah,
Clackamas,
Washington,
Clark (WA)
2,552,175
1hr = 32
ppb
Annual=
6.3 ppb
1hr =
32%
Annual=
16%
Portland,
SE Lafayette
(41-005-0080)
Annual,
Hourly 18-20 1 1 0
1hr = 34
ppb
Annual=
10.2ppb
1hr =
34%
Annual=
12%
Tualatin
Bradbury Ct.
(Near
Roadway site)
(41-067-0005)
Annual,
Hourly 18-20 1 1 0
* Portland State Population Research Center 2020 estimates

25
25
SO2 Minimum Monitoring Requirements:
EPA devised the Population Weighted Emissions Index to determine where SO2 monitoring is needed. This combines population and SO2
emission estimates. Oregon only had one MSA with a PWEI which required monitoring, Portland - Vancouver. The location measures
population exposure in the CBSA which meets the minimum spatial siting requirement. The NCORE site also requires trace SO2 monitoring.
The NCORE site is also the PWEI site and operates with a trace SO2 monitor meeting both criteria. The table below shows the current
monitoring status.
Table A. 5. SO2 Minimum Monitoring Requirements:
CBSA
County
Population
2020
estimate*
Design
Value
(ppb)
% of
Std
Site name
Season/
Frequency
Years
# of Monitors
Minimum
required
Active needed
Portland-
Vancouver-
Hillsboro,
OR-WA
(38900)
Multnomah,
Clackamas,
Washington,
Clark (WA)
2,552,175 3 4
Portland,
SE Lafayette
(41-005-
0080)
Annual,
Hourly 18-20 1 1 0
* Portland State Population Research Center 2020 estimates
26
26
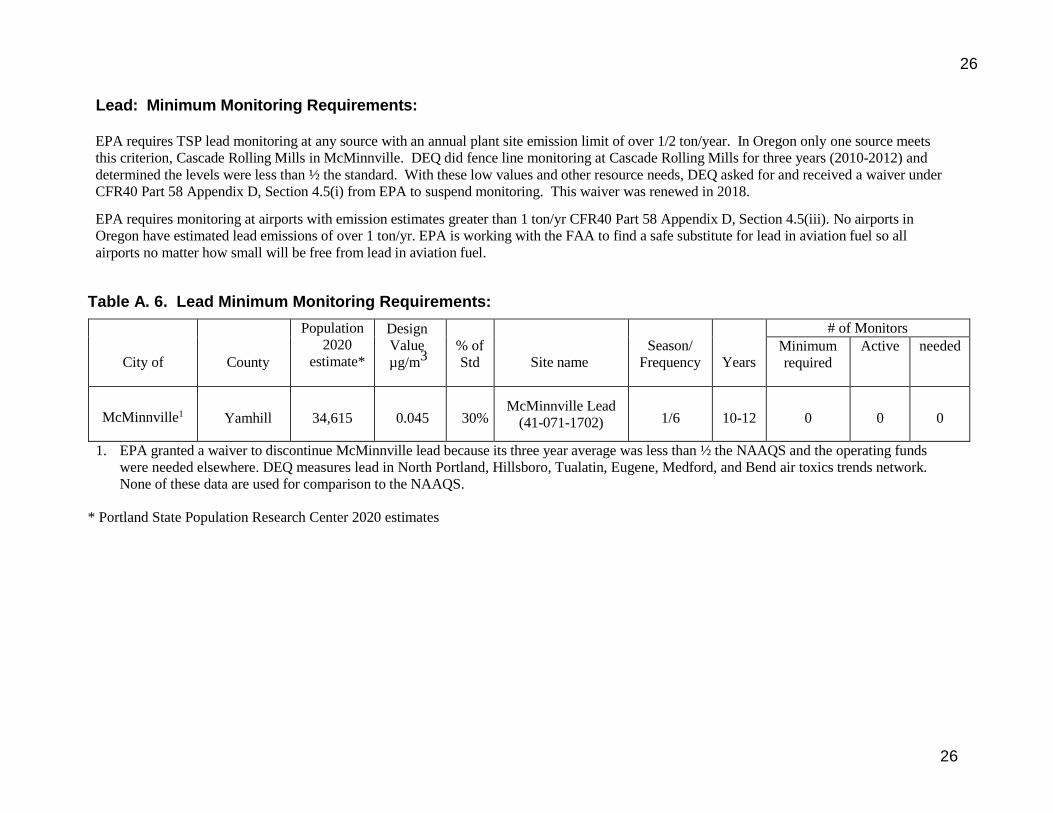
Lead: Minimum Monitoring Requirements:
EPA requires TSP lead monitoring at any source with an annual plant site emission limit of over 1/2 ton/year. In Oregon only one source meets
this criterion, Cascade Rolling Mills in McMinnville. DEQ did fence line monitoring at Cascade Rolling Mills for three years (2010-2012) and
determined the levels were less than ½ the standard. With these low values and other resource needs, DEQ asked for and received a waiver under
CFR40 Part 58 Appendix D, Section 4.5(i) from EPA to suspend monitoring. This waiver was renewed in 2018.
EPA requires monitoring at airports with emission estimates greater than 1 ton/yr CFR40 Part 58 Appendix D, Section 4.5(iii). No airports in
Oregon have estimated lead emissions of over 1 ton/yr. EPA is working with the FAA to find a safe substitute for lead in aviation fuel so all
airports no matter how small will be free from lead in aviation fuel.
Table A. 6. Lead Minimum Monitoring Requirements:
City of
County
Population
2020
estimate*
Design
Value
µg/m3
% of
Std
Site name
Season/
Frequency
Years
# of Monitors
Minimum
required
Active needed
McMinnville1 Yamhill 34,615 0.045 30% McMinnville Lead
(41-071-1702) 1/6 10-12 0 0 0
1. EPA granted a waiver to discontinue McMinnville lead because its three year average was less than ½ the NAAQS and the operating funds
were needed elsewhere. DEQ measures lead in North Portland, Hillsboro, Tualatin, Eugene, Medford, and Bend air toxics trends network.
None of these data are used for comparison to the NAAQS. * Portland State Population Research Center 2020 estimates

27
27
PM10 Minimum Monitoring Requirements: PM10 has dropped significantly since the 1980s when numerous Oregon communities were in non-attainment. These communities are now all
under maintenance plans and many have EPA waivers to discontinue PM10 and use PM2.5 as a surrogate. This was done because PM10 is mostly
comprised of PM2.5 and the PM10 levels are far below the standard. Continuous PM10 samplers will be placed at these sites in the future.
Table A. 7. PM10 Minimum Monitoring Requirements:
CBSA or MSA
County
Population
2020
estimate*
Exceed
ence/yr
Site name
Season/
Frequency
Year
s
# of Monitors
Minimum
required Active needed
Portland-
Vancouver-
Hillsboro, OR-
WA (38900)
Multnomah,
Clackamas,
Washington,
Clark (WA)
2,552,175 0
SE Lafayette
(41-005-0080)
Humboldt
(41-051-2010)
Annual. 1/3
at NCORE
& 1/6
other sites
18-20 2-4 2 0
Eugene-Springfield (21660)
Lane 381,365 2.7 a
Eugene Hwy 99
(41-039-0059)
Oakridge
(41-039-2013)
Eugene Amazon Park
(41-039-0060)
Annual
1/1
1/1
1/6
18-20 3 3 0
La Grande (29260) Union 26,840 0 Hall & North Sts.
(41-067-0123)
Annual,
1/6 18-20 1 1 0
Medford (32780) Jackson 223,240 0 Welch & Jackson
(41-029-2129)
Annual,
1/6 18-20 1 1 0
Grants Pass (24420) Josephine 86,560 2.0
ab
Parkside School
(41-033-0114) PM2.5 as surrogate
18-20 1 0 0
Klamath Falls (28900)
Klamath 68,075 7.0 ab
Klamath Falls
Petersen Sch.
(41-035-0004)
PM2.5 as
Surrogate 18-20 1 0 0
Lakeview
(Lake County -
00000)
Lake 8,075 No data
Lakeview
(41-037-0001) - 1 0 1
a. DV includes wildfire data. If they have regulatory significance in the future, DEQ will request exceptional event concurrence for Oakridge. b. PM2.5 is used as a surrogate for PM10. * Portland State Population Research Center 2020 estimates
28
28
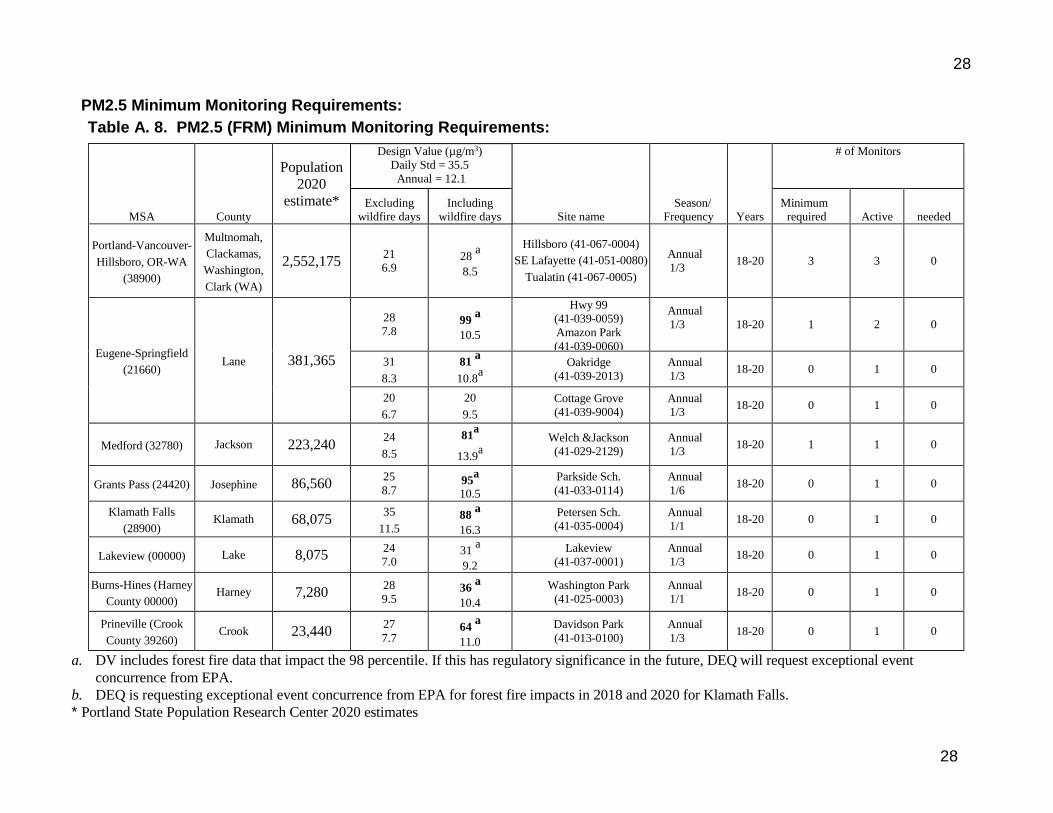
PM2.5 Minimum Monitoring Requirements:
Table A. 8. PM2.5 (FRM) Minimum Monitoring Requirements:
MSA County
Population
2020
estimate*
Design Value (µg/m3)
Daily Std = 35.5
Annual = 12.1
Site name
Season/
Frequency Years
# of Monitors
Excluding
wildfire days
Including
wildfire days
Minimum
required Active needed
Portland-Vancouver-
Hillsboro, OR-WA
(38900)
Multnomah,
Clackamas,
Washington,
Clark (WA)
2,552,175 21
6.9 28
a
8.5
Hillsboro (41-067-0004)
SE Lafayette (41-051-0080)
Tualatin (41-067-0005)
Annual
1/3 18-20 3 3 0
Eugene-Springfield
(21660) Lane 381,365
28
7.8 99
a
10.5
Hwy 99
(41-039-0059)
Amazon Park
(41-039-0060)
Annual
1/3
18-20 1 2 0
31
8.3
81 a
10.8a
Oakridge
(41-039-2013)
Annual
1/3 18-20 0 1 0
20
6.7
20
9.5
Cottage Grove
(41-039-9004)
Annual
1/3 18-20 0 1 0
Medford (32780) Jackson 223,240 24
8.5
81a
13.9a
Welch &Jackson
(41-029-2129)
Annual
1/3 18-20 1 1 0
Grants Pass (24420) Josephine 86,560 25
8.7 95
a
10.5
Parkside Sch.
(41-033-0114)
Annual
1/6 18-20 0 1 0
Klamath Falls
(28900) Klamath 68,075
35
11.5 88
a
16.3
Petersen Sch.
(41-035-0004)
Annual
1/1 18-20 0 1 0
Lakeview (00000) Lake 8,075 24
7.0 31
a
9.2
Lakeview
(41-037-0001)
Annual
1/3 18-20 0 1 0
Burns-Hines (Harney
County 00000) Harney 7,280
28
9.5 36
a
10.4
Washington Park
(41-025-0003)
Annual
1/1 18-20 0 1 0
Prineville (Crook
County 39260) Crook 23,440
27
7.7 64
a
11.0
Davidson Park
(41-013-0100)
Annual
1/3 18-20 0 1 0
a. DV includes forest fire data that impact the 98 percentile. If this has regulatory significance in the future, DEQ will request exceptional event
concurrence from EPA.
b. DEQ is requesting exceptional event concurrence from EPA for forest fire impacts in 2018 and 2020 for Klamath Falls.
* Portland State Population Research Center 2020 estimates
29
29
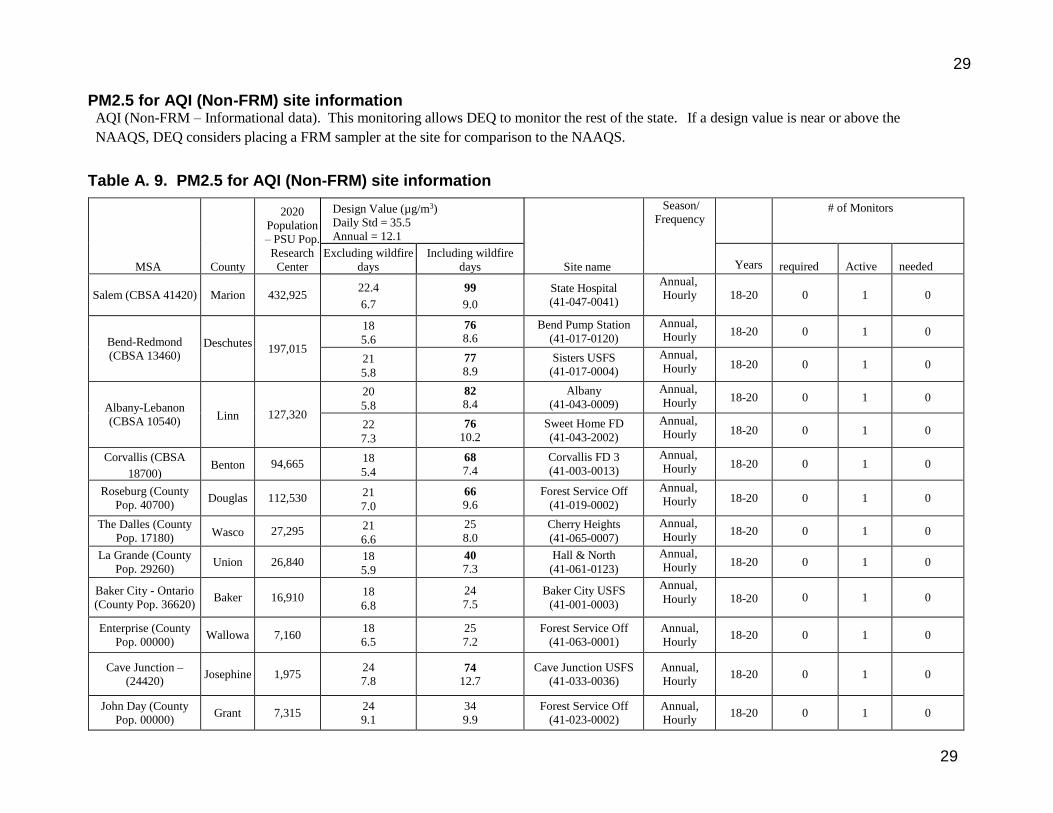
PM2.5 for AQI (Non-FRM) site information AQI (Non-FRM – Informational data). This monitoring allows DEQ to monitor the rest of the state. If a design value is near or above the
NAAQS, DEQ considers placing a FRM sampler at the site for comparison to the NAAQS.
Table A. 9. PM2.5 for AQI (Non-FRM) site information
MSA County
2020
Population
– PSU Pop.
Research
Center
Design Value (µg/m3)
Daily Std = 35.5
Annual = 12.1
Site name
Season/
Frequency
# of Monitors
Excluding wildfire
days
Including wildfire
days
Years required Active needed
Salem (CBSA 41420) Marion 432,925 22.4
6.7
99
9.0
State Hospital
(41-047-0041)
Annual,
Hourly 18-20 0 1 0
Bend-Redmond
(CBSA 13460) Deschutes
197,015
18
5.6
76
8.6
Bend Pump Station
(41-017-0120)
Annual,
Hourly 18-20 0 1 0
21
5.8
77
8.9
Sisters USFS
(41-017-0004)
Annual,
Hourly 18-20 0 1 0
Albany-Lebanon
(CBSA 10540) Linn 127,320
20
5.8
82
8.4
Albany
(41-043-0009)
Annual,
Hourly 18-20 0 1 0
22
7.3
76
10.2
Sweet Home FD
(41-043-2002)
Annual,
Hourly 18-20 0 1 0
Corvallis (CBSA
18700) Benton 94,665
18
5.4
68
7.4
Corvallis FD 3
(41-003-0013)
Annual,
Hourly 18-20 0 1 0
Roseburg (County
Pop. 40700) Douglas 112,530
21
7.0
66
9.6
Forest Service Off
(41-019-0002)
Annual,
Hourly 18-20 0 1 0
The Dalles (County
Pop. 17180) Wasco 27,295
21
6.6
25
8.0
Cherry Heights
(41-065-0007)
Annual,
Hourly 18-20 0 1 0
La Grande (County
Pop. 29260) Union 26,840
18
5.9
40
7.3
Hall & North
(41-061-0123)
Annual,
Hourly 18-20 0 1 0
Baker City - Ontario
(County Pop. 36620) Baker 16,910
18
6.8
24
7.5
Baker City USFS
(41-001-0003)
Annual,
Hourly 18-20 0 1 0
Enterprise (County
Pop. 00000) Wallowa 7,160
18
6.5
25
7.2
Forest Service Off
(41-063-0001)
Annual,
Hourly 18-20 0 1 0
Cave Junction –
(24420) Josephine 1,975
24
7.8 74
12.7
Cave Junction USFS
(41-033-0036)
Annual,
Hourly 18-20 0 1 0
John Day (County
Pop. 00000) Grant 7,315
24
9.1
34
9.9
Forest Service Off
(41-023-0002)
Annual,
Hourly 18-20 0 1 0
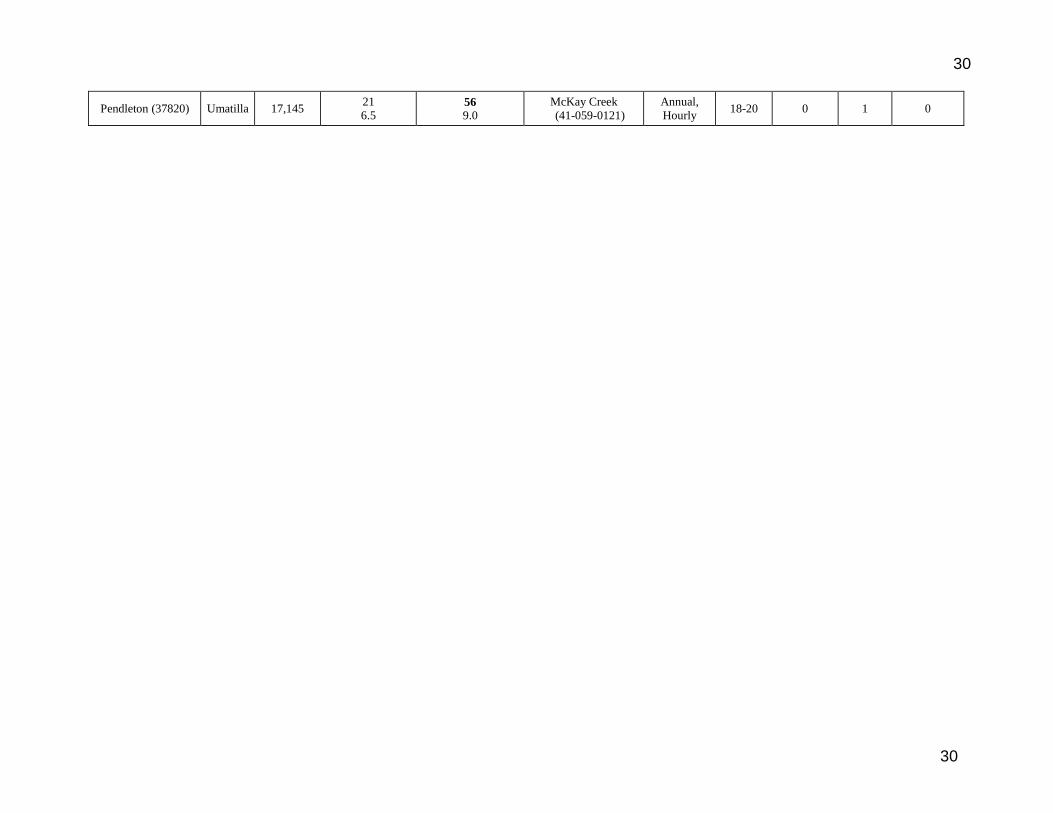
30
30
Pendleton (37820) Umatilla 17,145 21
6.5 56
9.0
McKay Creek
(41-059-0121)
Annual,
Hourly 18-20 0 1 0
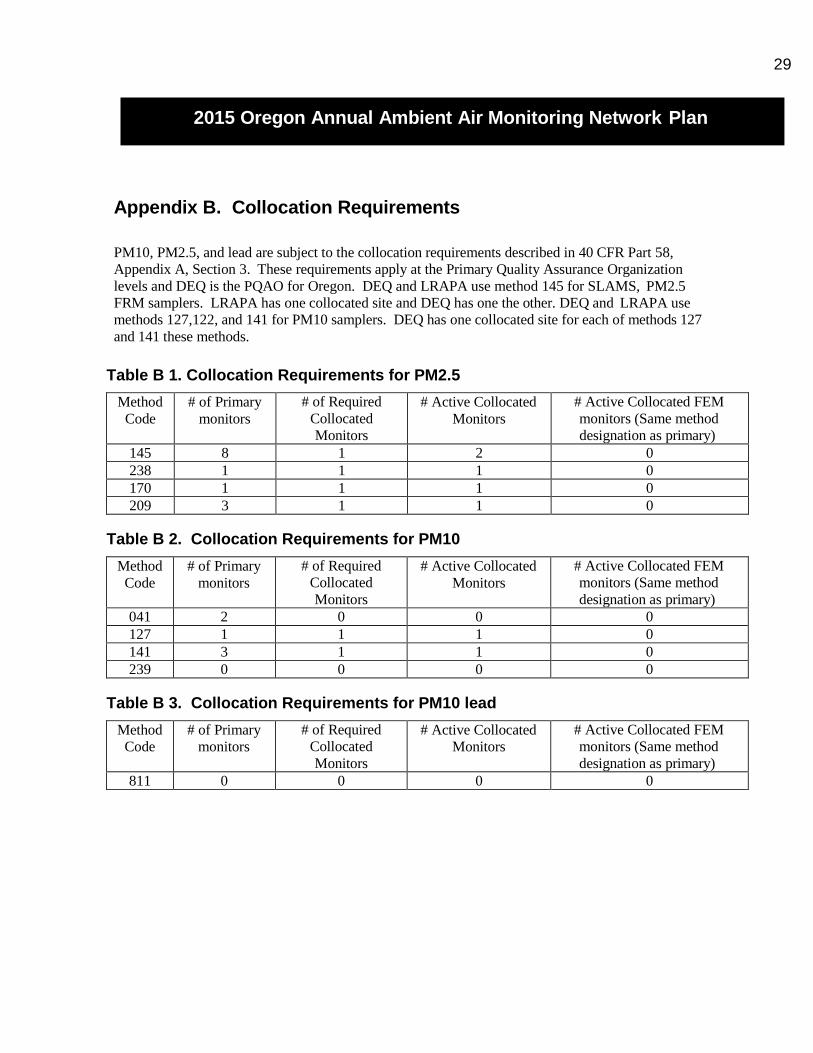
29
Appendix B. Collocation Requirements
PM10, PM2.5, and lead are subject to the collocation requirements described in 40 CFR Part 58,
Appendix A, Section 3. These requirements apply at the Primary Quality Assurance Organization
levels and DEQ is the PQAO for Oregon. DEQ and LRAPA use method 145 for SLAMS, PM2.5
FRM samplers. LRAPA has one collocated site and DEQ has one the other. DEQ and LRAPA use
methods 127,122, and 141 for PM10 samplers. DEQ has one collocated site for each of methods 127
and 141 these methods.
Table B 1. Collocation Requirements for PM2.5
Method
Code
# of Primary
monitors
# of Required
Collocated
Monitors
# Active Collocated
Monitors
# Active Collocated FEM
monitors (Same method
designation as primary)
145 8 1 2 0
238 1 1 1 0
170 1 1 1 0
209 3 1 1 0
Table B 2. Collocation Requirements for PM10
Method
Code
# of Primary
monitors
# of Required
Collocated
Monitors
# Active Collocated
Monitors
# Active Collocated FEM
monitors (Same method
designation as primary)
041 2 0 0 0
127 1 1 1 0
141 3 1 1 0
239 0 0 0 0
Table B 3. Collocation Requirements for PM10 lead
Method
Code
# of Primary
monitors
# of Required
Collocated
Monitors
# Active Collocated
Monitors
# Active Collocated FEM
monitors (Same method
designation as primary)
811 0 0 0 0
2015 Oregon Annual Ambient Air Monitoring Network Plan
30
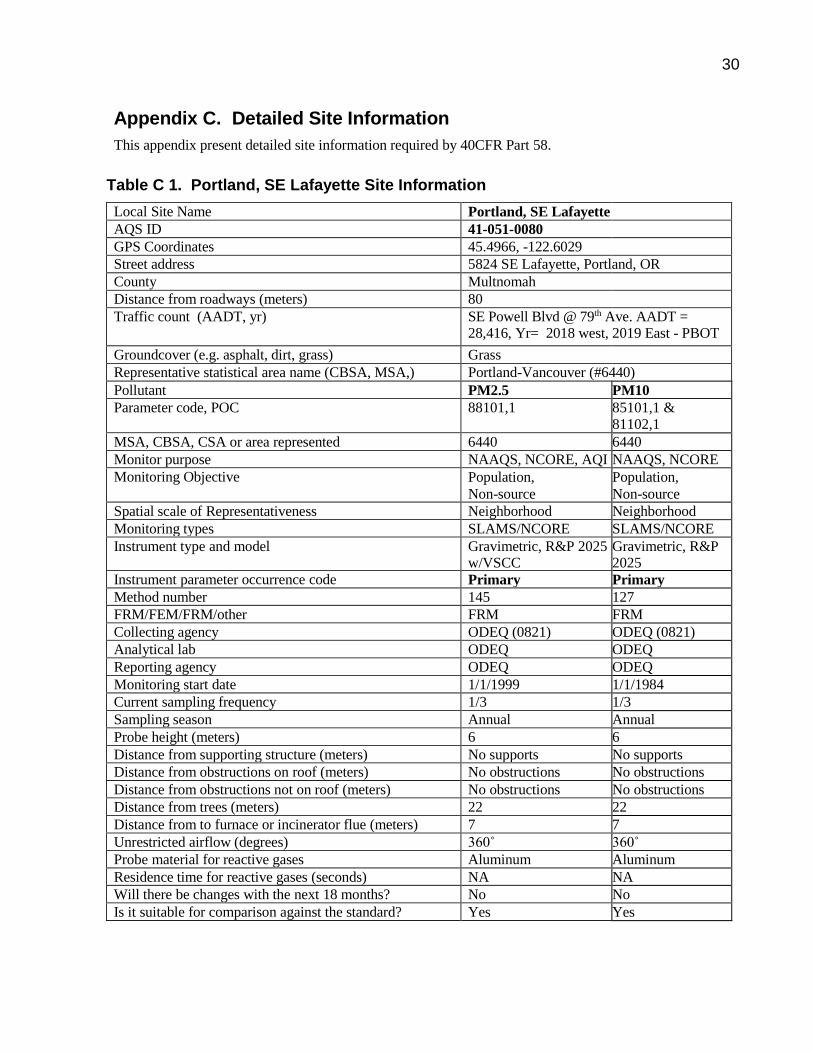
Appendix C. Detailed Site Information
This appendix present detailed site information required by 40CFR Part 58.
Table C 1. Portland, SE Lafayette Site Information
Local Site Name Portland, SE Lafayette
AQS ID 41-051-0080
GPS Coordinates 45.4966, -122.6029
Street address 5824 SE Lafayette, Portland, OR
County Multnomah
Distance from roadways (meters) 80
Traffic count (AADT, yr) SE Powell Blvd @ 79th Ave. AADT = 28,416, Yr= 2018 west, 2019 East - PBOT
Groundcover (e.g. asphalt, dirt, grass) Grass
Representative statistical area name (CBSA, MSA,) Portland-Vancouver (#6440)
Pollutant PM2.5 PM10
Parameter code, POC 88101,1 85101,1 & 81102,1
MSA, CBSA, CSA or area represented 6440 6440
Monitor purpose NAAQS, NCORE, AQI NAAQS, NCORE
Monitoring Objective Population,
Non-source
Population,
Non-source
Spatial scale of Representativeness Neighborhood Neighborhood
Monitoring types SLAMS/NCORE SLAMS/NCORE
Instrument type and model Gravimetric, R&P 2025 w/VSCC
Gravimetric, R&P 2025
Instrument parameter occurrence code Primary Primary
Method number 145 127
FRM/FEM/FRM/other FRM FRM
Collecting agency ODEQ (0821) ODEQ (0821)
Analytical lab ODEQ ODEQ
Reporting agency ODEQ ODEQ
Monitoring start date 1/1/1999 1/1/1984
Current sampling frequency 1/3 1/3
Sampling season Annual Annual
Probe height (meters) 6 6
Distance from supporting structure (meters) No supports No supports
Distance from obstructions on roof (meters) No obstructions No obstructions
Distance from obstructions not on roof (meters) No obstructions No obstructions
Distance from trees (meters) 22 22
Distance from to furnace or incinerator flue (meters) 7 7
Unrestricted airflow (degrees) 360˚ 360˚
Probe material for reactive gases Aluminum Aluminum
Residence time for reactive gases (seconds) NA NA
Will there be changes with the next 18 months? No No
Is it suitable for comparison against the standard? Yes Yes

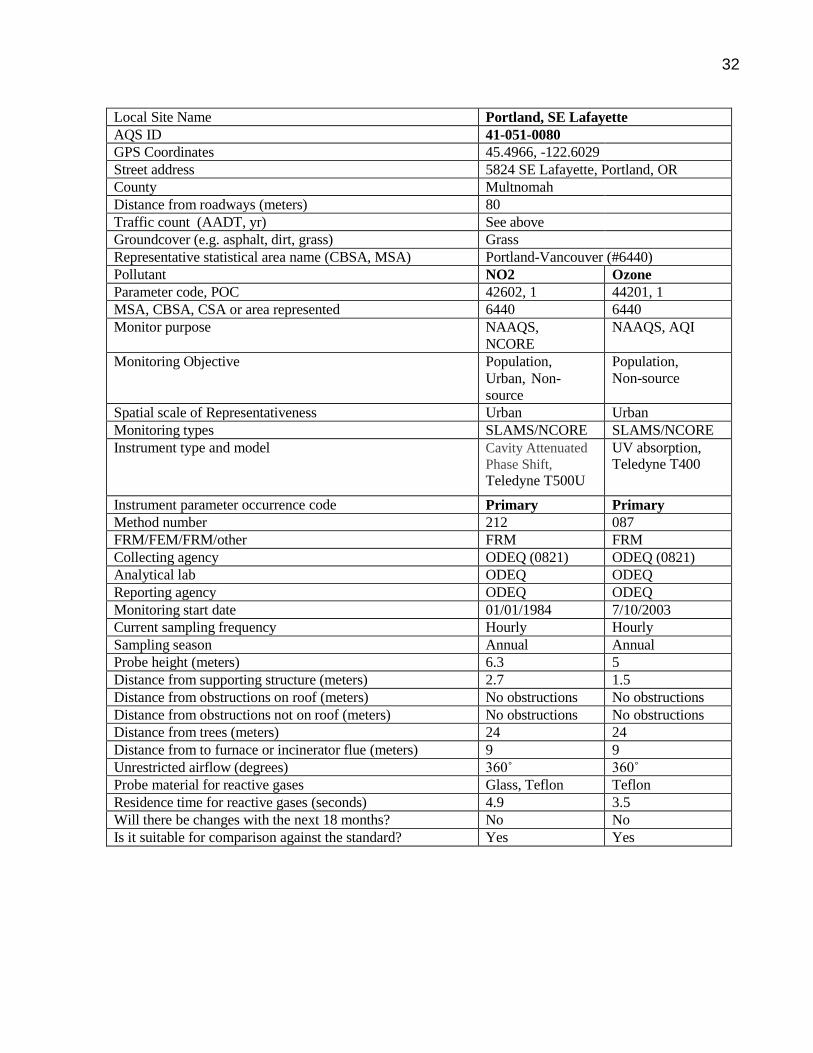
31
Local Site Name Portland, SE Lafayette
AQS ID 41-051-0080
GPS Coordinates 45.4966, -122.6029
Street address 5824 SE Lafayette, Portland, OR
County Multnomah
Distance from roadways (meters) 80
Traffic count (AADT, yr) See above
Groundcover (e.g. asphalt, dirt, grass) Grass
Representative statistical area name (CBSA, MSA) Portland-Vancouver (#6440)
Pollutant PM10 PM10-2.5
Parameter code, POC 85101,2 & 81102,2
86101,1
MSA, CBSA, CSA or area represented 6440 6440
Monitor purpose NAAQS NCORE
Monitoring Objective Urban Population,
Max
concentration,
Non-source
Urban, Population,
Non-source
Spatial scale of Representativeness Neighborhood Neighborhood
Monitoring types SLAMS/NCORE NCORE
Instrument type and model Gravimetric, R&P 2025
Gravimetric, R&P 2025s
Instrument parameter occurrence code Collocated Primary
Method number 127 176
FRM/FEM/FRM/other FRM FRM
Collecting agency ODEQ (0821) ODEQ (0821)
Analytical lab ODEQ ODEQ
Reporting agency ODEQ ODEQ
Monitoring start date 7/1/2013 1/1/2010
Current sampling frequency 1/3 1/3
Sampling season Annual Annual
Probe height (meters) 6 6
Distance from supporting structure (meters) No supports No supports
Distance from obstructions on roof (meters) No obstructions No obstructions
Distance from obstructions not on roof (meters) No obstructions No obstructions
Distance from trees (meters) 22 22
Distance from to furnace or incinerator flue (meters) 7 7
Unrestricted airflow (degrees) 360˚ 360˚
Probe material for reactive gases Aluminum Aluminum
Residence time for reactive gases (seconds) NA NA
Will there be changes with the next 18 months? No No
Is it suitable for comparison against the standard? Yes Yes
32
Local Site Name Portland, SE Lafayette
AQS ID 41-051-0080
GPS Coordinates 45.4966, -122.6029
Street address 5824 SE Lafayette, Portland, OR
County Multnomah
Distance from roadways (meters) 80
Traffic count (AADT, yr) See above
Groundcover (e.g. asphalt, dirt, grass) Grass
Representative statistical area name (CBSA, MSA) Portland-Vancouver (#6440)
Pollutant NO2 Ozone
Parameter code, POC 42602, 1 44201, 1
MSA, CBSA, CSA or area represented 6440 6440
Monitor purpose NAAQS,
NCORE
NAAQS, AQI
Monitoring Objective Population,
Urban, Non-
source
Population,
Non-source
Spatial scale of Representativeness Urban Urban
Monitoring types SLAMS/NCORE SLAMS/NCORE
Instrument type and model Cavity Attenuated
Phase Shift,
Teledyne T500U
UV absorption, Teledyne T400
Instrument parameter occurrence code Primary Primary
Method number 212 087
FRM/FEM/FRM/other FRM FRM
Collecting agency ODEQ (0821) ODEQ (0821)
Analytical lab ODEQ ODEQ
Reporting agency ODEQ ODEQ
Monitoring start date 01/01/1984 7/10/2003
Current sampling frequency Hourly Hourly
Sampling season Annual Annual
Probe height (meters) 6.3 5
Distance from supporting structure (meters) 2.7 1.5
Distance from obstructions on roof (meters) No obstructions No obstructions
Distance from obstructions not on roof (meters) No obstructions No obstructions
Distance from trees (meters) 24 24
Distance from to furnace or incinerator flue (meters) 9 9
Unrestricted airflow (degrees) 360˚ 360˚
Probe material for reactive gases Glass, Teflon Teflon
Residence time for reactive gases (seconds) 4.9 3.5
Will there be changes with the next 18 months? No No
Is it suitable for comparison against the standard? Yes Yes

33
Local Site Name Portland, SE Lafayette
AQS ID 41-051-0080
GPS Coordinates 45.4966, -122.6029
Street address 5824 SE Lafayette, Portland, OR
County Multnomah
Distance from roadways (meters) 80
Traffic count (AADT, yr) See above
Groundcover (e.g. asphalt, dirt, grass) Grass
Representative statistical area name (CBSA, MSA) Portland-Vancouver (#6440)
Pollutant CO SO2
Parameter code, POC 42101, 1 42401, 1
MSA, CBSA, CSA or area represented 6440 6440
Monitor purpose NAAQS, NCORE NAAQS, NCORE
Monitoring Objective Population, Non-
source
Population, Non-
source
Spatial scale of Representativeness Micro Urban
Monitoring types SLAMS/NCORE SLAMS/NCORE
Instrument type and model IR Absorption, Teledyne T300
UV absorption, Teledyne T100u
Instrument parameter occurrence code Primary Primary
Method number 093 100
FRM/FEM/FRM/other FRM FRM
Collecting agency ODEQ (0821) ODEQ (0821)
Analytical lab ODEQ ODEQ
Reporting agency ODEQ ODEQ
Monitoring start date 10/1/2005 2/1/2005
Current sampling frequency Hourly Hourly
Sampling season Annual Annual
Probe height (meters) 6.3 6.3
Distance from supporting structure (meters) 2.7 2.7
Distance from obstructions on roof (meters) No obstructions No obstructions
Distance from obstructions not on roof (meters) No obstructions No obstructions
Distance from trees (meters) 24 24
Distance from to furnace or incinerator flue (meters) 9 9
Unrestricted airflow (degrees) 360˚ 360˚
Probe material for reactive gases Glass, Teflon Glass, Teflon
Residence time for reactive gases (seconds) 3.6 3.6
Will there be changes with the next 18 months? No No
Is it suitable for comparison against the standard? Yes Yes
34
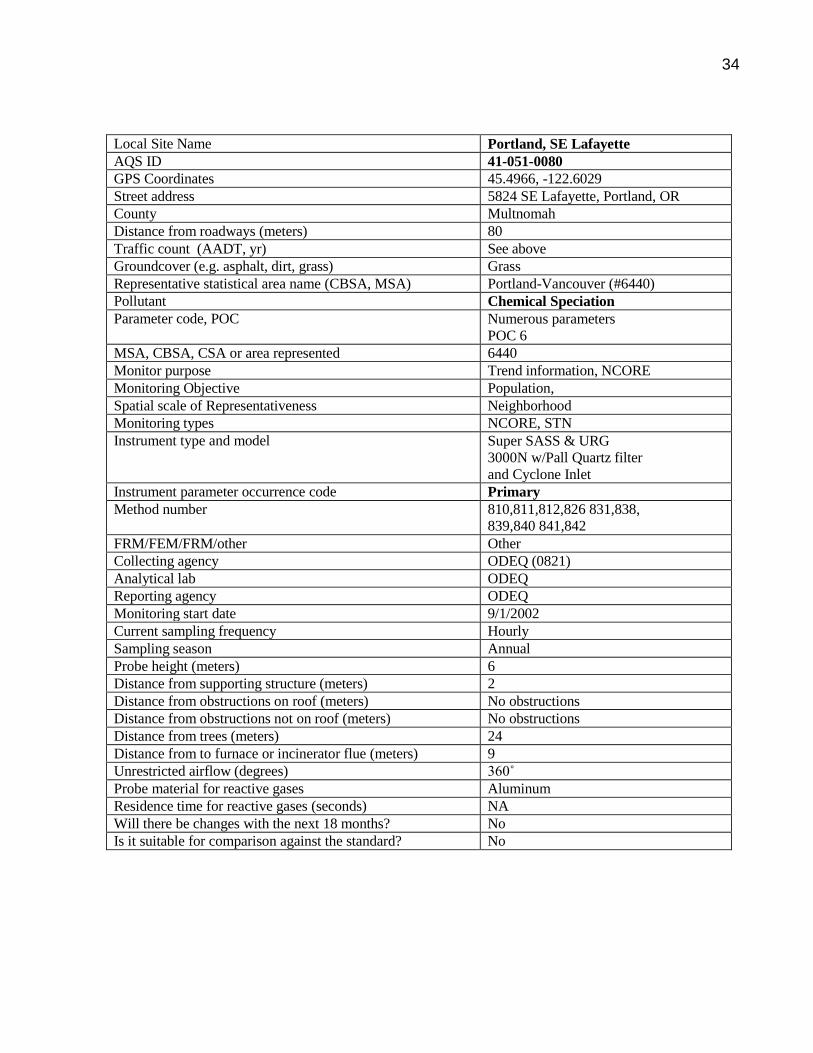
Local Site Name Portland, SE Lafayette
AQS ID 41-051-0080
GPS Coordinates 45.4966, -122.6029
Street address 5824 SE Lafayette, Portland, OR
County Multnomah
Distance from roadways (meters) 80
Traffic count (AADT, yr) See above
Groundcover (e.g. asphalt, dirt, grass) Grass
Representative statistical area name (CBSA, MSA) Portland-Vancouver (#6440)
Pollutant Chemical Speciation
Parameter code, POC Numerous parameters
POC 6
MSA, CBSA, CSA or area represented 6440
Monitor purpose Trend information, NCORE
Monitoring Objective Population,
Spatial scale of Representativeness Neighborhood
Monitoring types NCORE, STN
Instrument type and model Super SASS & URG
3000N w/Pall Quartz filter
and Cyclone Inlet
Instrument parameter occurrence code Primary
Method number 810,811,812,826 831,838, 839,840 841,842
FRM/FEM/FRM/other Other
Collecting agency ODEQ (0821)
Analytical lab ODEQ
Reporting agency ODEQ
Monitoring start date 9/1/2002
Current sampling frequency Hourly
Sampling season Annual
Probe height (meters) 6
Distance from supporting structure (meters) 2
Distance from obstructions on roof (meters) No obstructions
Distance from obstructions not on roof (meters) No obstructions
Distance from trees (meters) 24
Distance from to furnace or incinerator flue (meters) 9
Unrestricted airflow (degrees) 360˚
Probe material for reactive gases Aluminum
Residence time for reactive gases (seconds) NA
Will there be changes with the next 18 months? No
Is it suitable for comparison against the standard? No
35
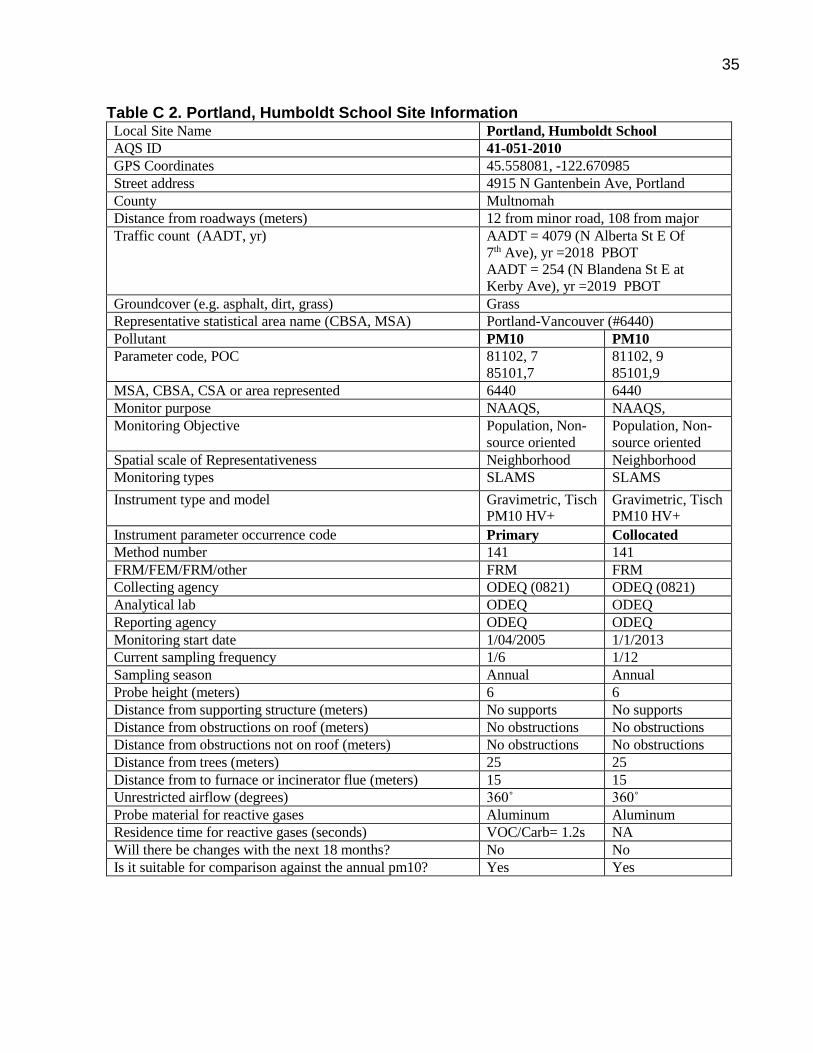
Table C 2. Portland, Humboldt School Site Information Local Site Name Portland, Humboldt School
AQS ID 41-051-2010
GPS Coordinates 45.558081, -122.670985
Street address 4915 N Gantenbein Ave, Portland
County Multnomah
Distance from roadways (meters) 12 from minor road, 108 from major
Traffic count (AADT, yr) AADT = 4079 (N Alberta St E Of
7th Ave), yr =2018 PBOT
AADT = 254 (N Blandena St E at
Kerby Ave), yr =2019 PBOT
Groundcover (e.g. asphalt, dirt, grass) Grass
Representative statistical area name (CBSA, MSA) Portland-Vancouver (#6440)
Pollutant PM10 PM10
Parameter code, POC 81102, 7
85101,7
81102, 9
85101,9
MSA, CBSA, CSA or area represented 6440 6440
Monitor purpose NAAQS, NAAQS,
Monitoring Objective Population, Non-
source oriented
Population, Non-
source oriented
Spatial scale of Representativeness Neighborhood Neighborhood
Monitoring types SLAMS SLAMS
Instrument type and model Gravimetric, Tisch PM10 HV+
Gravimetric, Tisch PM10 HV+
Instrument parameter occurrence code Primary Collocated
Method number 141 141
FRM/FEM/FRM/other FRM FRM
Collecting agency ODEQ (0821) ODEQ (0821)
Analytical lab ODEQ ODEQ
Reporting agency ODEQ ODEQ
Monitoring start date 1/04/2005 1/1/2013
Current sampling frequency 1/6 1/12
Sampling season Annual Annual
Probe height (meters) 6 6
Distance from supporting structure (meters) No supports No supports
Distance from obstructions on roof (meters) No obstructions No obstructions
Distance from obstructions not on roof (meters) No obstructions No obstructions
Distance from trees (meters) 25 25
Distance from to furnace or incinerator flue (meters) 15 15
Unrestricted airflow (degrees) 360˚ 360˚
Probe material for reactive gases Aluminum Aluminum
Residence time for reactive gases (seconds) VOC/Carb= 1.2s NA
Will there be changes with the next 18 months? No No
Is it suitable for comparison against the annual pm10? Yes Yes
36
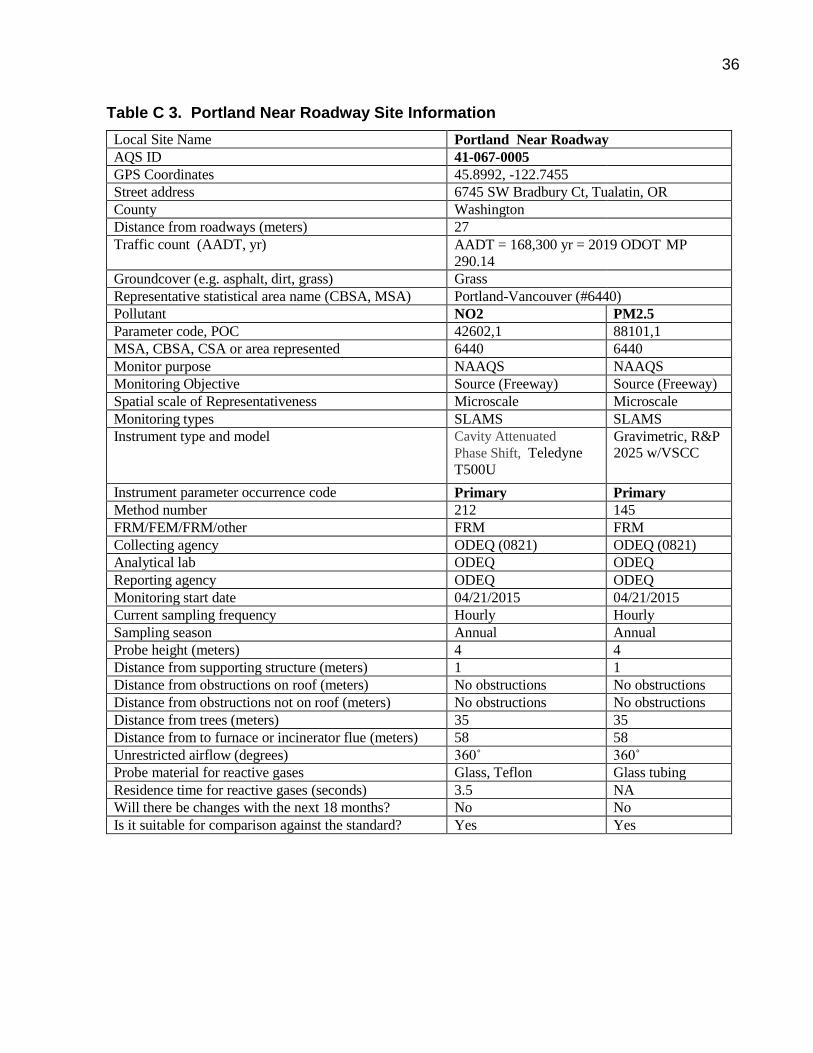
Table C 3. Portland Near Roadway Site Information
Local Site Name Portland Near Roadway
AQS ID 41-067-0005
GPS Coordinates 45.8992, -122.7455
Street address 6745 SW Bradbury Ct, Tualatin, OR
County Washington
Distance from roadways (meters) 27
Traffic count (AADT, yr) AADT = 168,300 yr = 2019 ODOT MP
290.14
Groundcover (e.g. asphalt, dirt, grass) Grass
Representative statistical area name (CBSA, MSA) Portland-Vancouver (#6440)
Pollutant NO2 PM2.5
Parameter code, POC 42602,1 88101,1
MSA, CBSA, CSA or area represented 6440 6440
Monitor purpose NAAQS NAAQS
Monitoring Objective Source (Freeway) Source (Freeway)
Spatial scale of Representativeness Microscale Microscale
Monitoring types SLAMS SLAMS
Instrument type and model Cavity Attenuated
Phase Shift, Teledyne
T500U
Gravimetric, R&P 2025 w/VSCC
Instrument parameter occurrence code Primary Primary
Method number 212 145
FRM/FEM/FRM/other FRM FRM
Collecting agency ODEQ (0821) ODEQ (0821)
Analytical lab ODEQ ODEQ
Reporting agency ODEQ ODEQ
Monitoring start date 04/21/2015 04/21/2015
Current sampling frequency Hourly Hourly
Sampling season Annual Annual
Probe height (meters) 4 4
Distance from supporting structure (meters) 1 1
Distance from obstructions on roof (meters) No obstructions No obstructions
Distance from obstructions not on roof (meters) No obstructions No obstructions
Distance from trees (meters) 35 35
Distance from to furnace or incinerator flue (meters) 58 58
Unrestricted airflow (degrees) 360˚ 360˚
Probe material for reactive gases Glass, Teflon Glass tubing
Residence time for reactive gases (seconds) 3.5 NA
Will there be changes with the next 18 months? No No
Is it suitable for comparison against the standard? Yes Yes
37
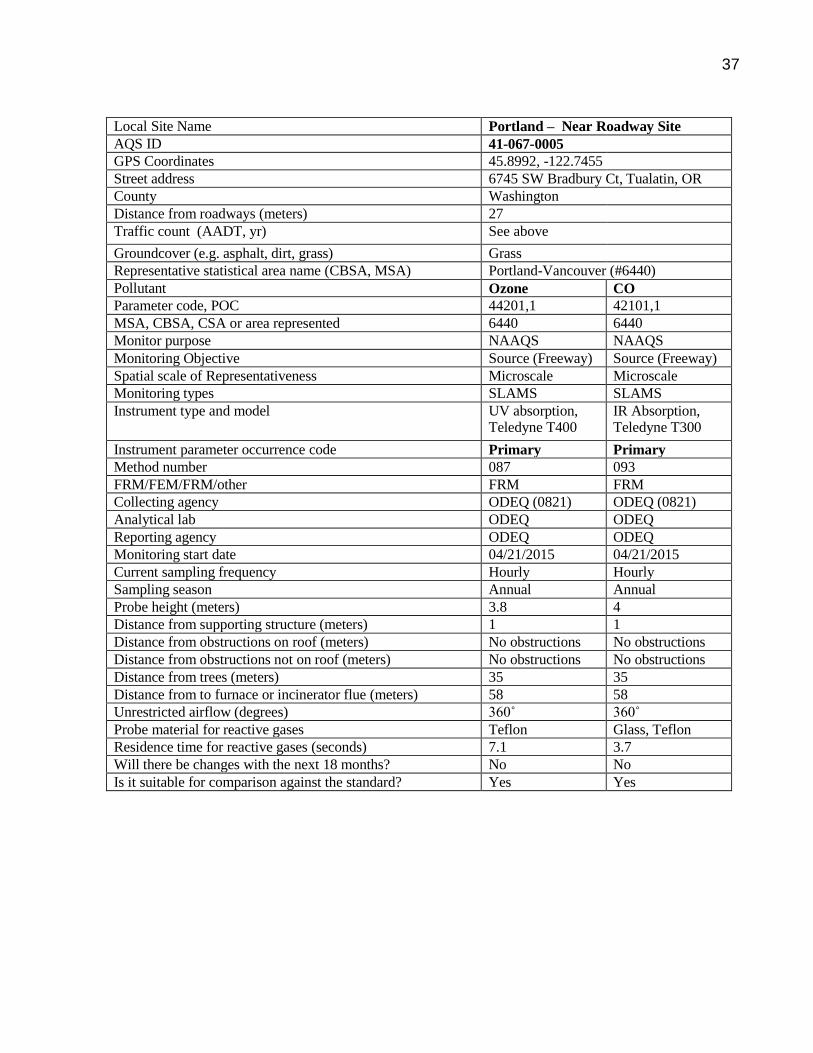
Local Site Name Portland – Near Roadway Site
AQS ID 41-067-0005
GPS Coordinates 45.8992, -122.7455
Street address 6745 SW Bradbury Ct, Tualatin, OR
County Washington
Distance from roadways (meters) 27
Traffic count (AADT, yr) See above
Groundcover (e.g. asphalt, dirt, grass) Grass
Representative statistical area name (CBSA, MSA) Portland-Vancouver (#6440)
Pollutant Ozone CO
Parameter code, POC 44201,1 42101,1
MSA, CBSA, CSA or area represented 6440 6440
Monitor purpose NAAQS NAAQS
Monitoring Objective Source (Freeway) Source (Freeway)
Spatial scale of Representativeness Microscale Microscale
Monitoring types SLAMS SLAMS
Instrument type and model UV absorption, Teledyne T400
IR Absorption, Teledyne T300
Instrument parameter occurrence code Primary Primary
Method number 087 093
FRM/FEM/FRM/other FRM FRM
Collecting agency ODEQ (0821) ODEQ (0821)
Analytical lab ODEQ ODEQ
Reporting agency ODEQ ODEQ
Monitoring start date 04/21/2015 04/21/2015
Current sampling frequency Hourly Hourly
Sampling season Annual Annual
Probe height (meters) 3.8 4
Distance from supporting structure (meters) 1 1
Distance from obstructions on roof (meters) No obstructions No obstructions
Distance from obstructions not on roof (meters) No obstructions No obstructions
Distance from trees (meters) 35 35
Distance from to furnace or incinerator flue (meters) 58 58
Unrestricted airflow (degrees) 360˚ 360˚
Probe material for reactive gases Teflon Glass, Teflon
Residence time for reactive gases (seconds) 7.1 3.7
Will there be changes with the next 18 months? No No
Is it suitable for comparison against the standard? Yes Yes
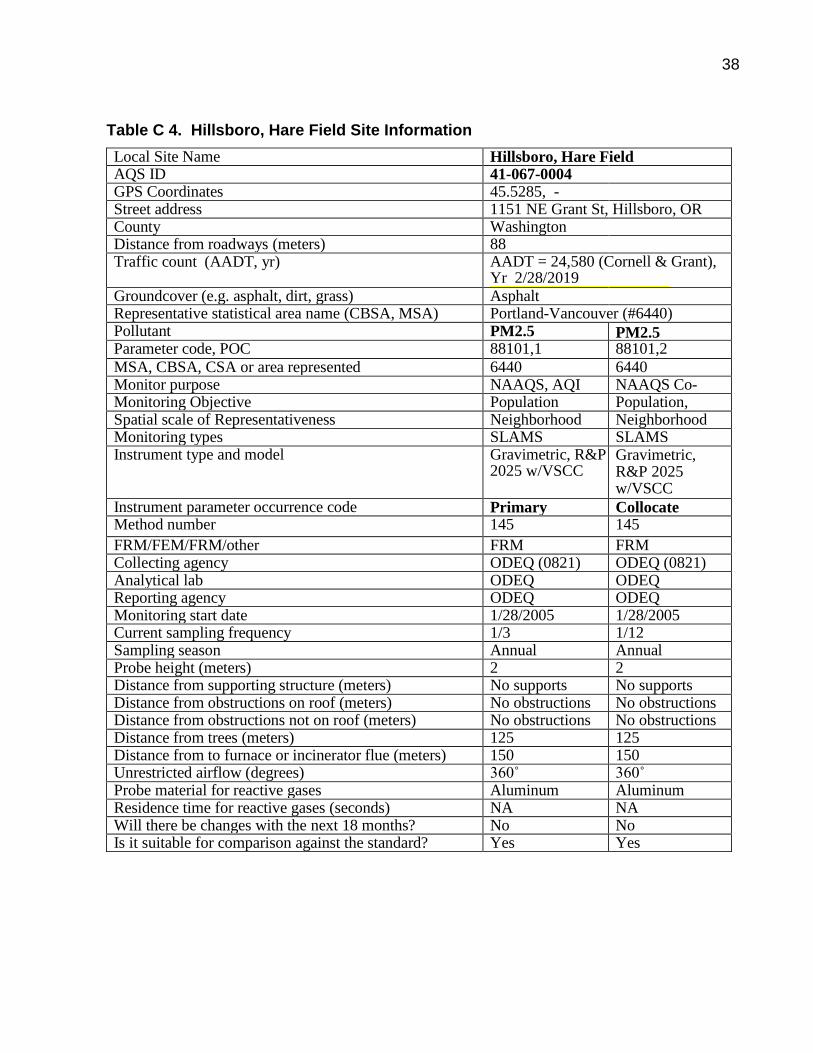
38
Table C 4. Hillsboro, Hare Field Site Information
Local Site Name Hillsboro, Hare Field AQS ID 41-067-0004 GPS Coordinates 45.5285, -
122.9724
Street address 1151 NE Grant St, Hillsboro, OR County Washington Distance from roadways (meters) 88 Traffic count (AADT, yr) AADT = 24,580 (Cornell & Grant),
Yr 2/28/2019 = 2015 (5/26/2013) WA Co. Groundcover (e.g. asphalt, dirt, grass) Asphalt
Representative statistical area name (CBSA, MSA) Portland-Vancouver (#6440) Pollutant PM2.5 PM2.5 Parameter code, POC 88101,1 88101,2
MSA, CBSA, CSA or area represented 6440 6440 Monitor purpose NAAQS, AQI NAAQS Co-
locate Monitoring Objective Population Population, Spatial scale of Representativeness Neighborhood Neighborhood Monitoring types SLAMS SLAMS Instrument type and model Gravimetric, R&P
2025 w/VSCC Gravimetric, R&P 2025 w/VSCC
Instrument parameter occurrence code Primary Collocate Method number 145 145
FRM/FEM/FRM/other FRM FRM Collecting agency ODEQ (0821) ODEQ (0821) Analytical lab ODEQ ODEQ Reporting agency ODEQ ODEQ Monitoring start date 1/28/2005 1/28/2005 Current sampling frequency 1/3 1/12 Sampling season Annual Annual Probe height (meters) 2 2 Distance from supporting structure (meters) No supports No supports Distance from obstructions on roof (meters) No obstructions No obstructions Distance from obstructions not on roof (meters) No obstructions No obstructions Distance from trees (meters) 125 125 Distance from to furnace or incinerator flue (meters) 150 150 Unrestricted airflow (degrees) 360˚ 360˚ Probe material for reactive gases Aluminum Aluminum Residence time for reactive gases (seconds) NA NA Will there be changes with the next 18 months? No No Is it suitable for comparison against the standard? Yes Yes
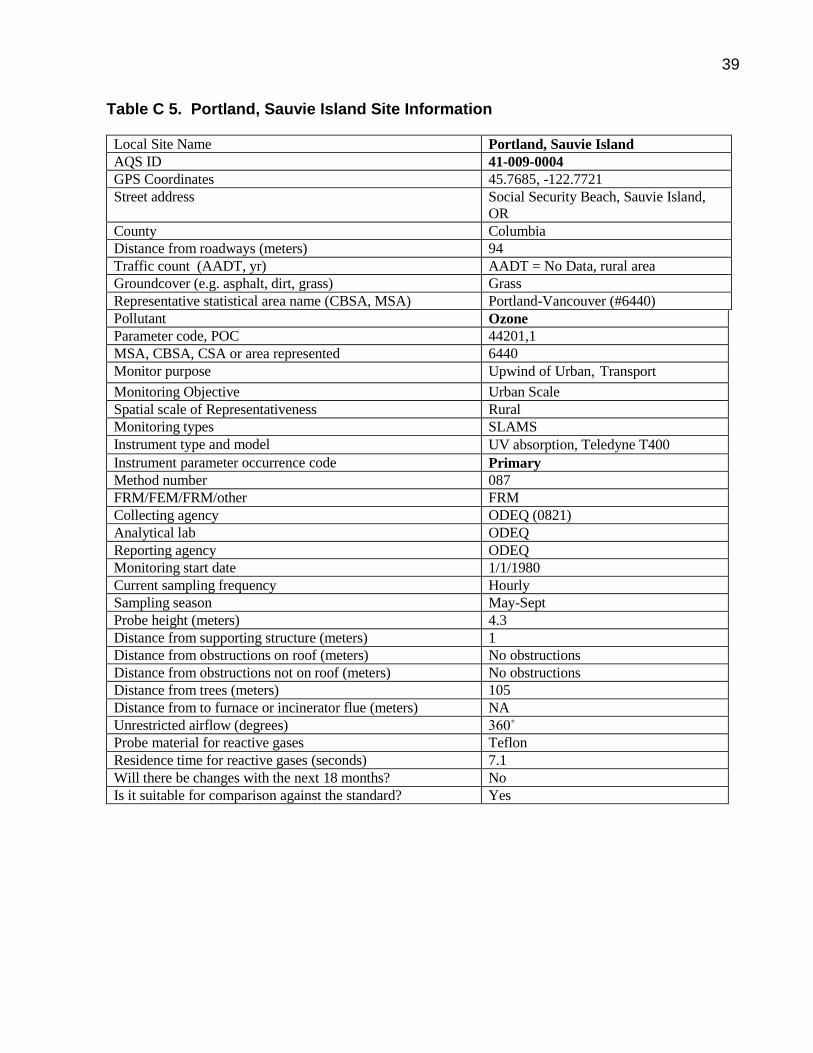
39
Table C 5. Portland, Sauvie Island Site Information
Local Site Name Portland, Sauvie Island
AQS ID 41-009-0004
GPS Coordinates 45.7685, -122.7721
Street address Social Security Beach, Sauvie Island,
OR
County Columbia Distance from roadways (meters) 94 Traffic count (AADT, yr) AADT = No Data, rural area
Groundcover (e.g. asphalt, dirt, grass) Grass Representative statistical area name (CBSA, MSA) Portland-Vancouver (#6440)
Pollutant Ozone
Parameter code, POC 44201,1
MSA, CBSA, CSA or area represented 6440
Monitor purpose Upwind of Urban, Transport
Monitoring Objective Urban Scale
Spatial scale of Representativeness Rural
Monitoring types SLAMS
Instrument type and model UV absorption, Teledyne T400
Instrument parameter occurrence code Primary
Method number 087
FRM/FEM/FRM/other FRM
Collecting agency ODEQ (0821)
Analytical lab ODEQ
Reporting agency ODEQ
Monitoring start date 1/1/1980
Current sampling frequency Hourly
Sampling season May-Sept
Probe height (meters) 4.3
Distance from supporting structure (meters) 1
Distance from obstructions on roof (meters) No obstructions
Distance from obstructions not on roof (meters) No obstructions
Distance from trees (meters) 105
Distance from to furnace or incinerator flue (meters) NA
Unrestricted airflow (degrees) 360˚
Probe material for reactive gases Teflon
Residence time for reactive gases (seconds) 7.1
Will there be changes with the next 18 months? No
Is it suitable for comparison against the standard? Yes

40
Table C 6. Portland - Carus – Spangler Rd. Site Information
Local Site Name Portland - Carus – Spangler Rd.
AQS ID 41-005-0004
GPS Coordinates 45.2593, -122.5882 Street address 13575 Spangler Rd., Carus, OR
County Clackamas Distance from roadways (meters) 12 Traffic count (AADT, yr) ADT = 880 yr = 2018
Clackamas Co. Spangler Rd. N 45 15.853 W 122 31.227 Groundcover (e.g. asphalt, dirt, grass) Grass
Representative statistical area name (CBSA, MSA) Portland-Vancouver (#6440)
Pollutant Ozone
Parameter code, POC 44201,1
MSA, CBSA, CSA or area represented 6440
Monitor purpose NAAQS
Monitoring Objective Downwind of Urban, Maximum
Concentration
Spatial scale of Representativeness Urban Scale
Monitoring types SLAMS
Instrument type and model UV absorption, Teledyne T400
Instrument parameter occurrence code Primary
Method number 087
FRM/FEM/FRM/other FRM
Collecting agency ODEQ (0821)
Analytical lab ODEQ
Reporting agency ODEQ
Monitoring start date 7/23/1976
Current sampling frequency Hourly
Sampling season May-Sept
Probe height (meters) 6.4
Distance from supporting structure (meters) 2.7
Distance from obstructions on roof (meters) No obstructions
Distance from obstructions not on roof (meters) No obstructions
Distance from trees (meters) 250
Distance from to furnace or incinerator flue (meters) NA
Unrestricted airflow (degrees) 360˚
Probe material for reactive gases Teflon
Residence time for reactive gases (seconds) 2.8
Will there be changes with the next 18 months? No
Is it suitable for comparison against the standard? Yes

41
Table C 7. Salem – State Hospital Information
Local Site Name Salem State Hospital
AQS ID 41-047-0041
GPS Coordinates 44.9431, -123.0059 Street address 867 Medical Center
County Marion Distance from roadways (meters) 30 meters Traffic count (AADT, yr) ADT = 6720 4/21/2015. City of Salem.
at D Street NE: East of Evergreen Ave.
Groundcover (e.g. asphalt, dirt, grass) Grass
Representative statistical area name (CBSA, MSA) Salem
Pollutant Ozone
Parameter code, POC 44201,1
MSA, CBSA, CSA or area represented 6440
Monitor purpose NAAQS
Monitoring Objective In urban core
patial scale of Representativeness Urban Scale
Monitoring types SLAMS
Instrument type and model UV absorption, Teledyne T400
Instrument parameter occurrence code Primary
Method number 087
FRM/FEM/FRM/other FRM
Collecting agency ODEQ (0821)
Analytical lab ODEQ
Reporting agency ODEQ
Monitoring start date 5/1/2018
Current sampling frequency Hourly
Sampling season May-Sept
Probe height (meters) 3
Distance from supporting structure (meters) 1
Distance from obstructions on roof (meters) No obstructions
Distance from obstructions not on roof (meters) No obstructions
Distance from trees (meters) 18
Distance from to furnace or incinerator flue (meters) NA
Unrestricted airflow (degrees) 360˚
Probe material for reactive gases Teflon
Residence time for reactive gases (seconds) 3.5
Will there be changes with the next 18 months? No
Is it suitable for comparison against the standard? Yes
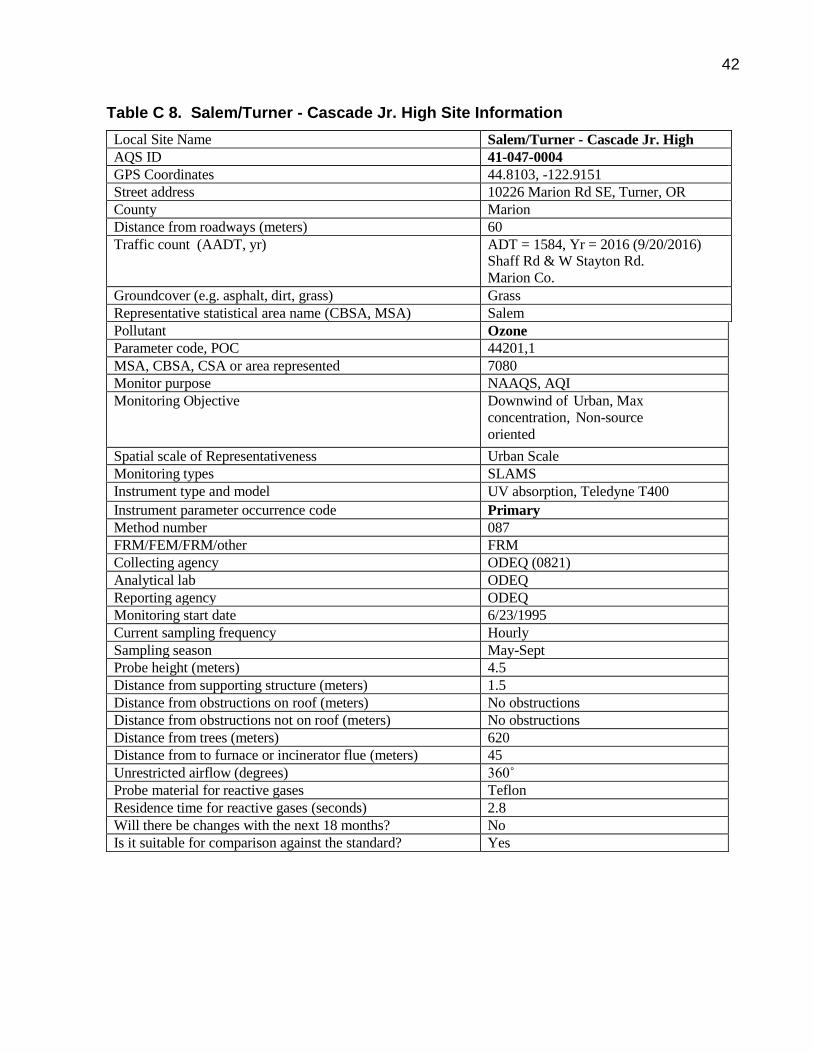
42
Table C 8. Salem/Turner - Cascade Jr. High Site Information
Local Site Name Salem/Turner - Cascade Jr. High
AQS ID 41-047-0004
GPS Coordinates 44.8103, -122.9151 Street address 10226 Marion Rd SE, Turner, OR
County Marion Distance from roadways (meters) 60 Traffic count (AADT, yr) ADT = 1584, Yr = 2016 (9/20/2016)
Shaff Rd & W Stayton Rd.
Marion Co.
Groundcover (e.g. asphalt, dirt, grass) Grass Representative statistical area name (CBSA, MSA) Salem Pollutant Ozone
Parameter code, POC 44201,1
MSA, CBSA, CSA or area represented 7080
Monitor purpose NAAQS, AQI
Monitoring Objective Downwind of Urban, Max
concentration, Non-source
oriented
Spatial scale of Representativeness Urban Scale
Monitoring types SLAMS
Instrument type and model UV absorption, Teledyne T400
Instrument parameter occurrence code Primary
Method number 087
FRM/FEM/FRM/other FRM
Collecting agency ODEQ (0821)
Analytical lab ODEQ
Reporting agency ODEQ
Monitoring start date 6/23/1995
Current sampling frequency Hourly
Sampling season May-Sept
Probe height (meters) 4.5
Distance from supporting structure (meters) 1.5
Distance from obstructions on roof (meters) No obstructions
Distance from obstructions not on roof (meters) No obstructions
Distance from trees (meters) 620
Distance from to furnace or incinerator flue (meters) 45
Unrestricted airflow (degrees) 360˚
Probe material for reactive gases Teflon
Residence time for reactive gases (seconds) 2.8
Will there be changes with the next 18 months? No
Is it suitable for comparison against the standard? Yes
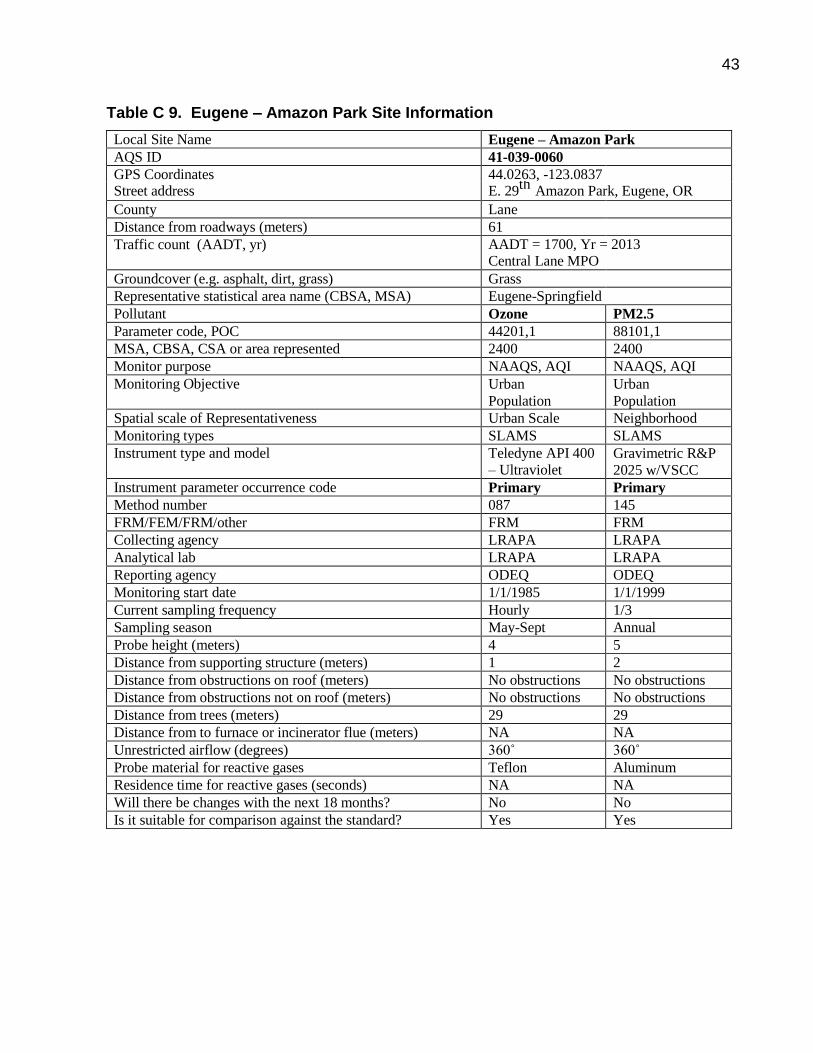
43
Table C 9. Eugene – Amazon Park Site Information
Local Site Name Eugene – Amazon Park
AQS ID 41-039-0060 GPS Coordinates 44.0263, -123.0837 Street address E. 29
th Amazon Park, Eugene, OR
County Lane Distance from roadways (meters) 61
Traffic count (AADT, yr) AADT = 1700, Yr = 2013 Central Lane MPO
Groundcover (e.g. asphalt, dirt, grass) Grass Representative statistical area name (CBSA, MSA) Eugene-Springfield
Pollutant Ozone PM2.5
Parameter code, POC 44201,1 88101,1
MSA, CBSA, CSA or area represented 2400 2400
Monitor purpose NAAQS, AQI NAAQS, AQI
Monitoring Objective Urban
Population
Urban
Population
Spatial scale of Representativeness Urban Scale Neighborhood
Monitoring types SLAMS SLAMS
Instrument type and model Teledyne API 400
– Ultraviolet Gravimetric R&P
2025 w/VSCC
Instrument parameter occurrence code Primary Primary
Method number 087 145
FRM/FEM/FRM/other FRM FRM
Collecting agency LRAPA LRAPA
Analytical lab LRAPA LRAPA
Reporting agency ODEQ ODEQ
Monitoring start date 1/1/1985 1/1/1999
Current sampling frequency Hourly 1/3
Sampling season May-Sept Annual
Probe height (meters) 4 5
Distance from supporting structure (meters) 1 2
Distance from obstructions on roof (meters) No obstructions No obstructions
Distance from obstructions not on roof (meters) No obstructions No obstructions
Distance from trees (meters) 29 29
Distance from to furnace or incinerator flue (meters) NA NA
Unrestricted airflow (degrees) 360˚ 360˚
Probe material for reactive gases Teflon Aluminum
Residence time for reactive gases (seconds) NA NA
Will there be changes with the next 18 months? No No
Is it suitable for comparison against the standard? Yes Yes
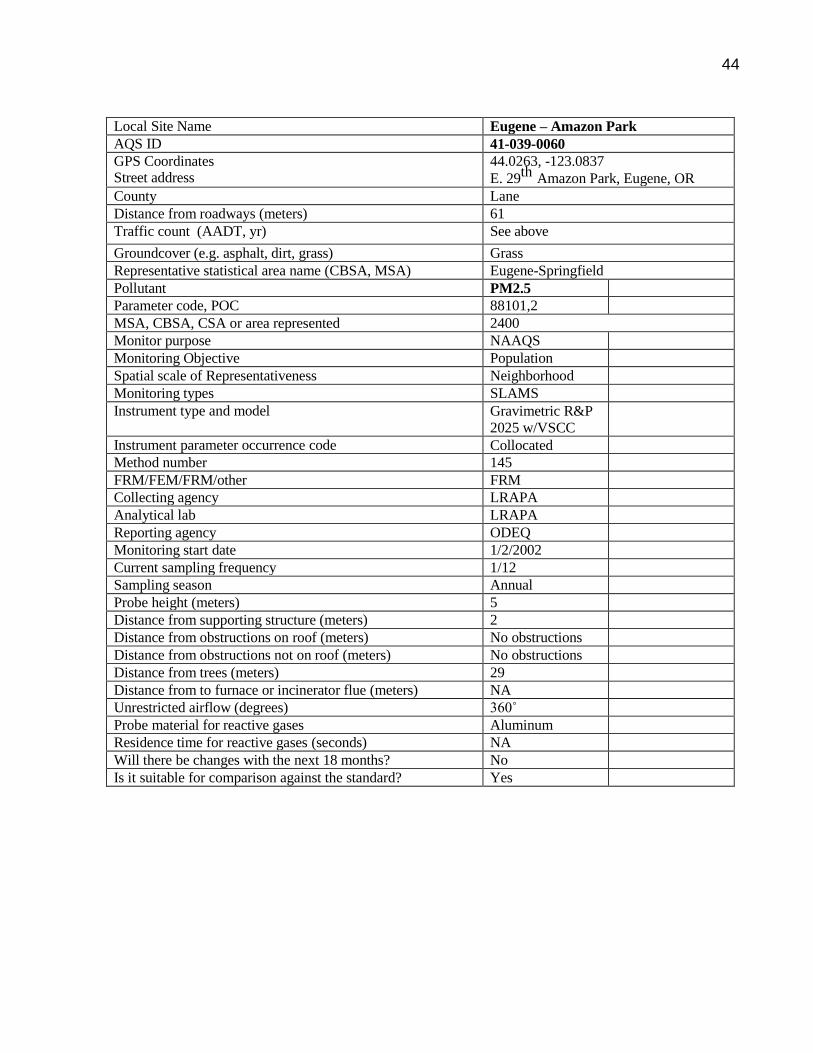
44
Local Site Name Eugene – Amazon Park
AQS ID 41-039-0060
GPS Coordinates 44.0263, -123.0837
E. 29th
Amazon Park, Eugene, OR Street address
County Lane
Distance from roadways (meters) 61
Traffic count (AADT, yr) See above
Groundcover (e.g. asphalt, dirt, grass) Grass
Representative statistical area name (CBSA, MSA) Eugene-Springfield
Pollutant PM2.5
Parameter code, POC 88101,2
MSA, CBSA, CSA or area represented 2400
Monitor purpose NAAQS
Monitoring Objective Population
Spatial scale of Representativeness Neighborhood
Monitoring types SLAMS
Instrument type and model Gravimetric R&P
2025 w/VSCC
Instrument parameter occurrence code Collocated
Method number 145
FRM/FEM/FRM/other FRM
Collecting agency LRAPA
Analytical lab LRAPA
Reporting agency ODEQ
Monitoring start date 1/2/2002
Current sampling frequency 1/12
Sampling season Annual
Probe height (meters) 5
Distance from supporting structure (meters) 2
Distance from obstructions on roof (meters) No obstructions
Distance from obstructions not on roof (meters) No obstructions
Distance from trees (meters) 29
Distance from to furnace or incinerator flue (meters) NA
Unrestricted airflow (degrees) 360˚
Probe material for reactive gases Aluminum
Residence time for reactive gases (seconds) NA
Will there be changes with the next 18 months? No
Is it suitable for comparison against the standard? Yes
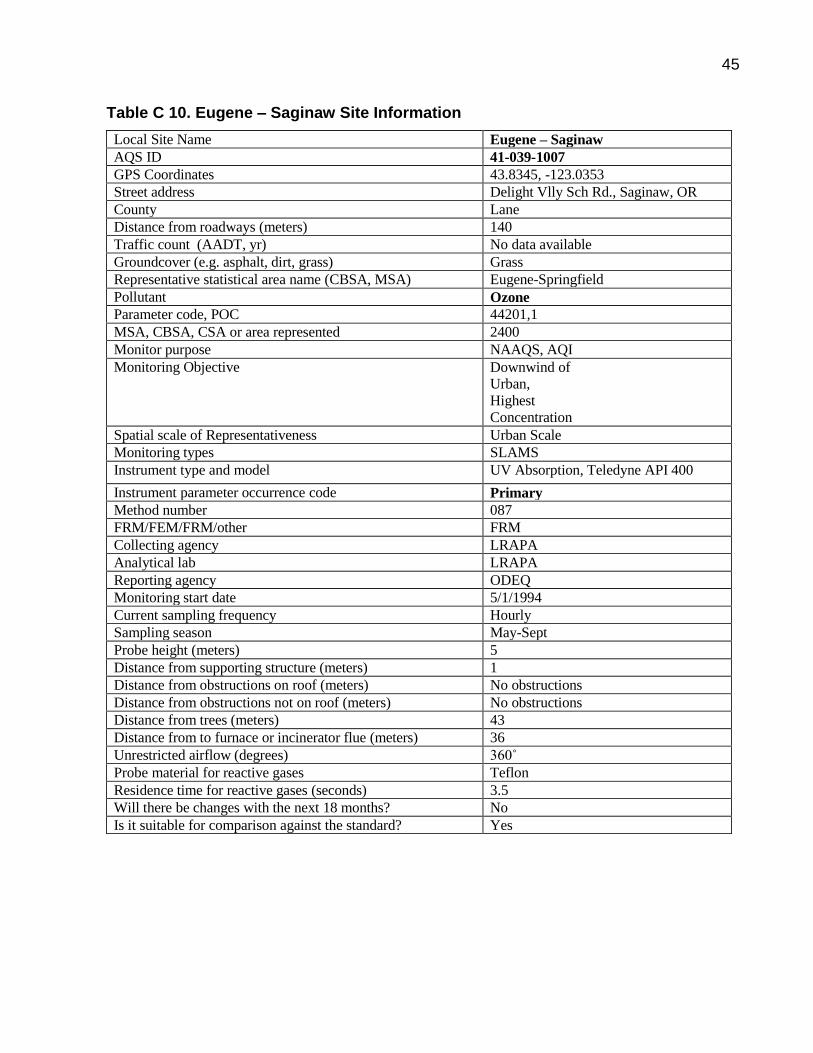
45
Table C 10. Eugene – Saginaw Site Information
Local Site Name Eugene – Saginaw
AQS ID 41-039-1007
GPS Coordinates 43.8345, -123.0353
Street address Delight Vlly Sch Rd., Saginaw, OR
County Lane
Distance from roadways (meters) 140
Traffic count (AADT, yr) No data available
Groundcover (e.g. asphalt, dirt, grass) Grass
Representative statistical area name (CBSA, MSA) Eugene-Springfield
Pollutant Ozone
Parameter code, POC 44201,1
MSA, CBSA, CSA or area represented 2400
Monitor purpose NAAQS, AQI
Monitoring Objective Downwind of Urban,
Highest
Concentration
Spatial scale of Representativeness Urban Scale
Monitoring types SLAMS
Instrument type and model UV Absorption, Teledyne API 400
Instrument parameter occurrence code Primary
Method number 087
FRM/FEM/FRM/other FRM
Collecting agency LRAPA
Analytical lab LRAPA
Reporting agency ODEQ
Monitoring start date 5/1/1994
Current sampling frequency Hourly
Sampling season May-Sept
Probe height (meters) 5
Distance from supporting structure (meters) 1
Distance from obstructions on roof (meters) No obstructions
Distance from obstructions not on roof (meters) No obstructions
Distance from trees (meters) 43
Distance from to furnace or incinerator flue (meters) 36
Unrestricted airflow (degrees) 360˚
Probe material for reactive gases Teflon
Residence time for reactive gases (seconds) 3.5
Will there be changes with the next 18 months? No
Is it suitable for comparison against the standard? Yes
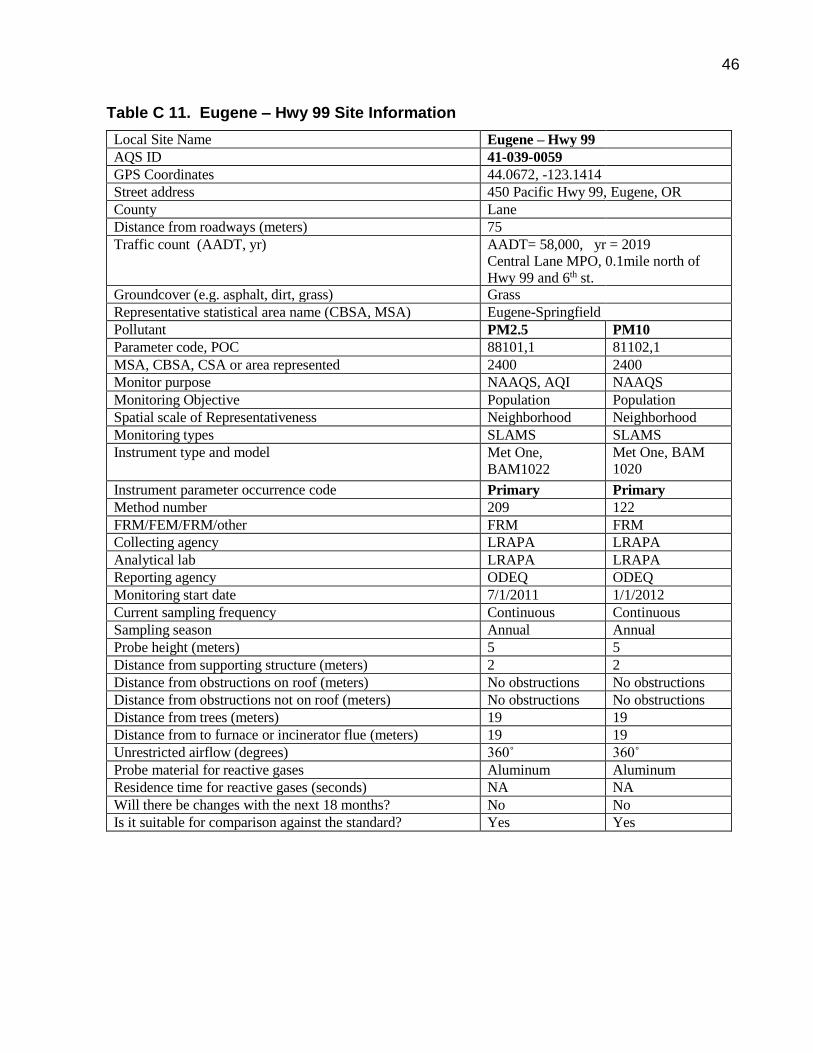
46
Table C 11. Eugene – Hwy 99 Site Information
Local Site Name Eugene – Hwy 99
AQS ID 41-039-0059
GPS Coordinates 44.0672, -123.1414 Street address 450 Pacific Hwy 99, Eugene, OR
County Lane Distance from roadways (meters) 75 Traffic count (AADT, yr) AADT= 58,000, yr = 2019
Central Lane MPO, 0.1mile north of
Hwy 99 and 6th st.
Groundcover (e.g. asphalt, dirt, grass) Grass
Representative statistical area name (CBSA, MSA) Eugene-Springfield Pollutant PM2.5 PM10
Parameter code, POC 88101,1 81102,1 MSA, CBSA, CSA or area represented 2400 2400
Monitor purpose NAAQS, AQI NAAQS
Monitoring Objective Population Population
Spatial scale of Representativeness Neighborhood Neighborhood
Monitoring types SLAMS SLAMS
Instrument type and model Met One,
BAM1022
Met One, BAM 1020
Instrument parameter occurrence code Primary Primary
Method number 209 122
FRM/FEM/FRM/other FRM FRM
Collecting agency LRAPA LRAPA
Analytical lab LRAPA LRAPA
Reporting agency ODEQ ODEQ
Monitoring start date 7/1/2011 1/1/2012
Current sampling frequency Continuous Continuous
Sampling season Annual Annual
Probe height (meters) 5 5
Distance from supporting structure (meters) 2 2
Distance from obstructions on roof (meters) No obstructions No obstructions
Distance from obstructions not on roof (meters) No obstructions No obstructions
Distance from trees (meters) 19 19
Distance from to furnace or incinerator flue (meters) 19 19
Unrestricted airflow (degrees) 360˚ 360˚
Probe material for reactive gases Aluminum Aluminum
Residence time for reactive gases (seconds) NA NA
Will there be changes with the next 18 months? No No
Is it suitable for comparison against the standard? Yes Yes

47
Table C 12. Cottage Grove, City Shops Site Information
Local Site Name Cottage Grove, City Shops
AQS ID 41-039-9004
GPS Coordinates 43.7995, -123.0535
Street address Cottage Grove, OR
County Lane
Distance from roadways (meters) 177
Traffic count (AADT, yr) No Data Available
Groundcover (e.g. asphalt, dirt, grass) Dirt
Representative statistical area name (CBSA, MSA) Other
Pollutant PM2.5
Parameter code, POC 88101,1
MSA, CBSA, CSA or area represented 0000
Monitor purpose NAAQS,AQI
Monitoring Objective Population
Spatial scale of Representativeness Neighborhood
Monitoring types SLAMS
Instrument type and model Met One, BAM1022
Instrument parameter occurrence code Primary
Method number 209
FRM/FEM/FRM/other FRM
Collecting agency LRAPA
Analytical lab LRAPA
Reporting agency ODEQ
Monitoring start date 1/1/2008
Current sampling frequency 1/3
Sampling season Annual
Probe height (meters) 5
Distance from supporting structure (meters) 2
Distance from obstructions on roof (meters) No obstructions
Distance from obstructions not on roof (meters) No obstructions
Distance from trees (meters) 36
Distance from to furnace or incinerator flue (meters) 60
Unrestricted airflow (degrees) 360˚
Probe material for reactive gases Aluminum
Residence time for reactive gases (seconds) NA
Will there be changes with the next 18 months? No
Is it suitable for comparison against the standard? Yes
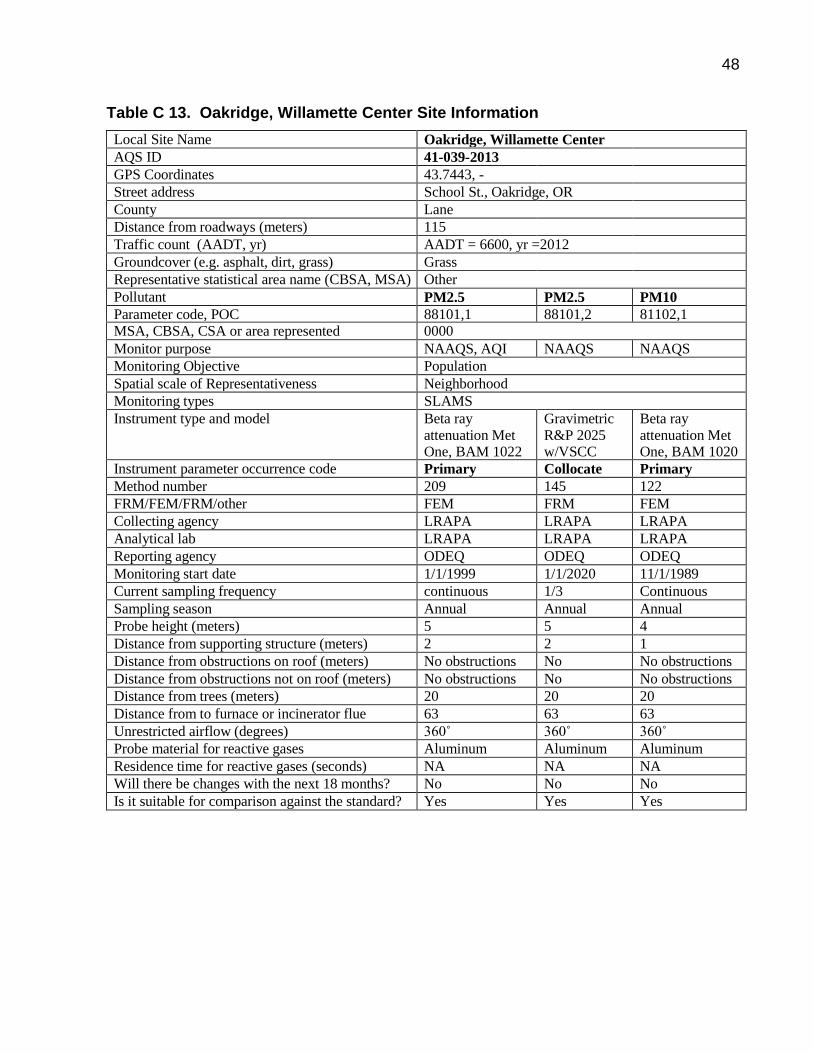
48
Table C 13. Oakridge, Willamette Center Site Information
Local Site Name Oakridge, Willamette Center
AQS ID 41-039-2013
GPS Coordinates 43.7443, -122.4805
Street address School St., Oakridge, OR
County Lane Distance from roadways (meters) 115 Traffic count (AADT, yr) AADT = 6600, yr =2012
Groundcover (e.g. asphalt, dirt, grass) Grass Representative statistical area name (CBSA, MSA) Other Pollutant PM2.5 PM2.5 PM10
Parameter code, POC 88101,1 88101,2 81102,1 MSA, CBSA, CSA or area represented 0000
0000 0000
Monitor purpose NAAQS, AQI NAAQS NAAQS
Monitoring Objective Population Population Population
Spatial scale of Representativeness Neighborhood Neighborhood Neighborhood
Monitoring types SLAMS SLAMS SLAMS
Instrument type and model Beta ray attenuation Met One, BAM 1022
Gravimetric R&P 2025 w/VSCC
Beta ray attenuation Met One, BAM 1020
Instrument parameter occurrence code Primary Collocate Primary
Method number 209 145 122
FRM/FEM/FRM/other FEM FRM FEM
Collecting agency LRAPA LRAPA LRAPA
Analytical lab LRAPA LRAPA LRAPA
Reporting agency ODEQ ODEQ ODEQ
Monitoring start date 1/1/1999 1/1/2020 11/1/1989
Current sampling frequency continuous 1/3 Continuous
Sampling season Annual Annual Annual
Probe height (meters) 5 5 4
Distance from supporting structure (meters) 2 2 1
Distance from obstructions on roof (meters) No obstructions No obstructions
No obstructions
Distance from obstructions not on roof (meters) No obstructions No obstructions
No obstructions
Distance from trees (meters) 20 20 20
Distance from to furnace or incinerator flue (meters)
63 63 63
Unrestricted airflow (degrees) 360˚ 360˚ 360˚
Probe material for reactive gases Aluminum Aluminum Aluminum
Residence time for reactive gases (seconds) NA NA NA
Will there be changes with the next 18 months? No No No
Is it suitable for comparison against the standard? Yes Yes Yes
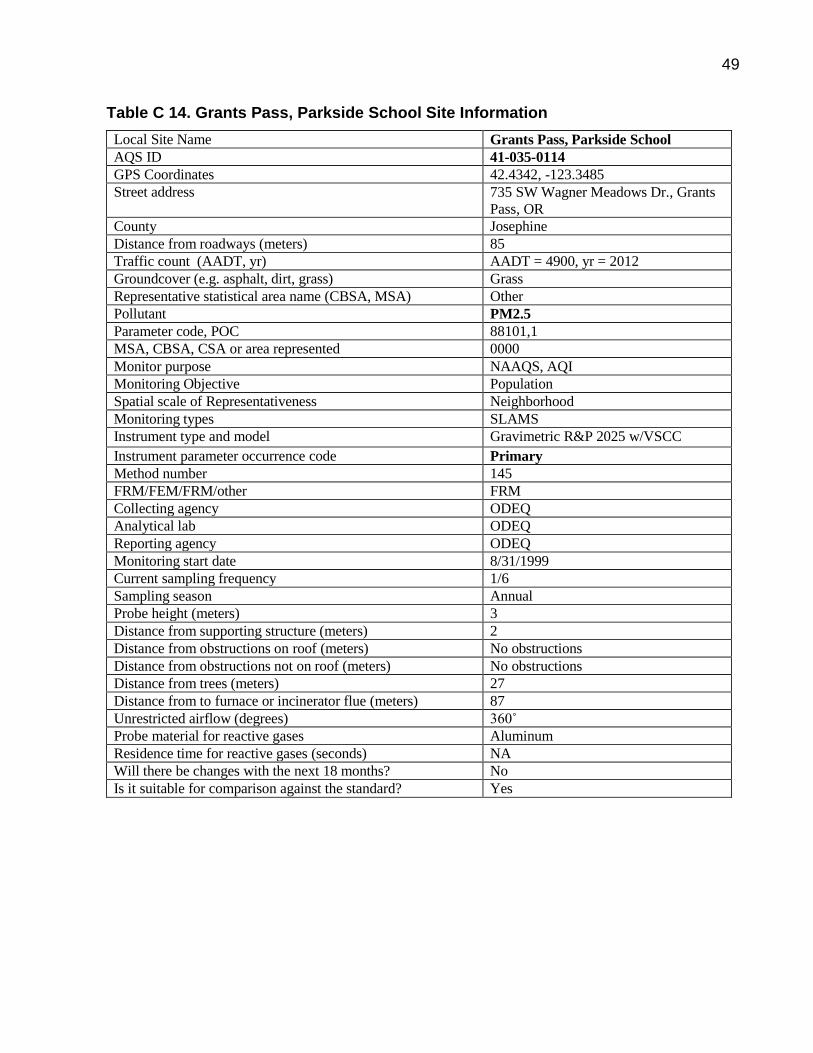
49
Table C 14. Grants Pass, Parkside School Site Information
Local Site Name Grants Pass, Parkside School
AQS ID 41-035-0114
GPS Coordinates 42.4342, -123.3485
Street address 735 SW Wagner Meadows Dr., Grants
Pass, OR
County Josephine
Distance from roadways (meters) 85
Traffic count (AADT, yr) AADT = 4900, yr = 2012
Groundcover (e.g. asphalt, dirt, grass) Grass
Representative statistical area name (CBSA, MSA) Other
Pollutant PM2.5
Parameter code, POC 88101,1
MSA, CBSA, CSA or area represented 0000
Monitor purpose NAAQS, AQI
Monitoring Objective Population
Spatial scale of Representativeness Neighborhood
Monitoring types SLAMS
Instrument type and model Gravimetric R&P 2025 w/VSCC Instrument parameter occurrence code Primary
Method number 145
FRM/FEM/FRM/other FRM
Collecting agency ODEQ
Analytical lab ODEQ
Reporting agency ODEQ
Monitoring start date 8/31/1999
Current sampling frequency 1/6
Sampling season Annual
Probe height (meters) 3
Distance from supporting structure (meters) 2
Distance from obstructions on roof (meters) No obstructions
Distance from obstructions not on roof (meters) No obstructions
Distance from trees (meters) 27
Distance from to furnace or incinerator flue (meters) 87
Unrestricted airflow (degrees) 360˚
Probe material for reactive gases Aluminum
Residence time for reactive gases (seconds) NA
Will there be changes with the next 18 months? No
Is it suitable for comparison against the standard? Yes

50
Table C 15. Medford, Welch and Jackson Information
Local Site Name Medford, Welch and Jackson
AQS ID 41-029-2129
GPS Coordinates 42.3315, -122.8803 Street address 711 Welch St
County Jackson Distance from roadways (meters) 43 meters Traffic count (AADT, yr) AADT 7900 (Jackson St. from Holy to
Central. 2018 https://medford.maps.arcgis.com/
Groundcover (e.g. asphalt, dirt, grass) Dirt
Representative statistical area name (CBSA, MSA) Other
Pollutant PM2.5 PM10
Parameter code, POC 88101,1 81102,7
MSA, CBSA, CSA or area represented 0000 0000
Monitor purpose NAAQS, AQI NAAQS
Monitoring Objective Population Population
Spatial scale of Representativeness Neighborhood Neighborhood
Monitoring types SLAMS SLAMS
Instrument type and model Gravimetric R&P 2025 w/VSCC
Gravimetric Tisch HV PM10+
Instrument parameter occurrence code Primary Primary
Method number 145 141
FRM/FEM/FRM/other FRM FRM
Collecting agency ODEQ ODEQ
Analytical lab ODEQ ODEQ
Reporting agency ODEQ ODEQ
Monitoring start date 4/1/2018 7/20/1989
Current sampling frequency 1/3 1/6
Sampling season Annual Annual
Probe height (meters) 3 2
Distance from supporting structure (meters) 2 2
Distance from obstructions on roof (meters) No obstructions No obstructions
Distance from obstructions not on roof (meters) No obstructions No obstructions
Distance from trees (meters) 34 34
Distance from to furnace or incinerator flue (meters) 32 32
Unrestricted airflow (degrees) 360˚ 360˚
Probe material for reactive gases Aluminum Aluminum
Residence time for reactive gases (seconds) NA NA
Will there be changes with the next 18 months? No No
Is it suitable for comparison against the standard? Yes Yes
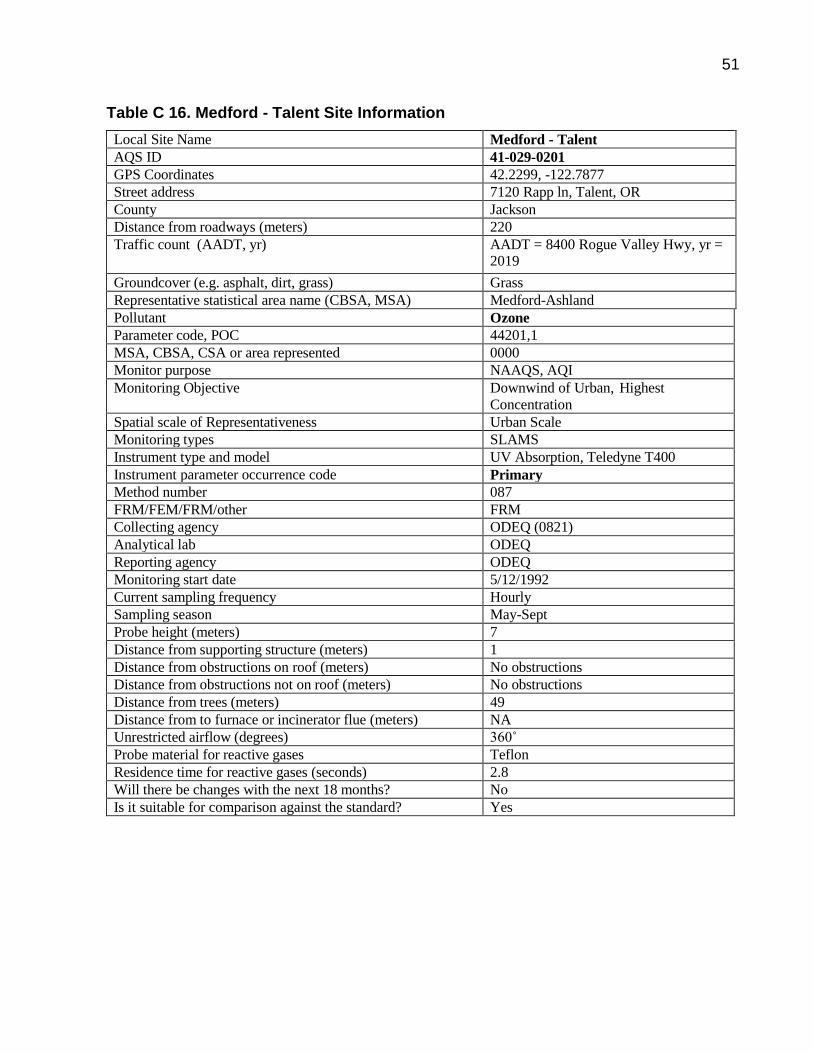
51
Table C 16. Medford - Talent Site Information
Local Site Name Medford - Talent
AQS ID 41-029-0201
GPS Coordinates 42.2299, -122.7877 Street address 7120 Rapp ln, Talent, OR
County Jackson Distance from roadways (meters) 220 Traffic count (AADT, yr) AADT = 8400 Rogue Valley Hwy, yr =
2019
Groundcover (e.g. asphalt, dirt, grass) Grass
Representative statistical area name (CBSA, MSA) Medford-Ashland
Pollutant Ozone
Parameter code, POC 44201,1
MSA, CBSA, CSA or area represented 0000
Monitor purpose NAAQS, AQI
Monitoring Objective Downwind of Urban, Highest
Concentration
Spatial scale of Representativeness Urban Scale
Monitoring types SLAMS
Instrument type and model UV Absorption, Teledyne T400
Instrument parameter occurrence code Primary
Method number 087
FRM/FEM/FRM/other FRM
Collecting agency ODEQ (0821)
Analytical lab ODEQ
Reporting agency ODEQ
Monitoring start date 5/12/1992
Current sampling frequency Hourly
Sampling season May-Sept
Probe height (meters) 7
Distance from supporting structure (meters) 1
Distance from obstructions on roof (meters) No obstructions
Distance from obstructions not on roof (meters) No obstructions
Distance from trees (meters) 49
Distance from to furnace or incinerator flue (meters) NA
Unrestricted airflow (degrees) 360˚
Probe material for reactive gases Teflon
Residence time for reactive gases (seconds) 2.8
Will there be changes with the next 18 months? No
Is it suitable for comparison against the standard? Yes
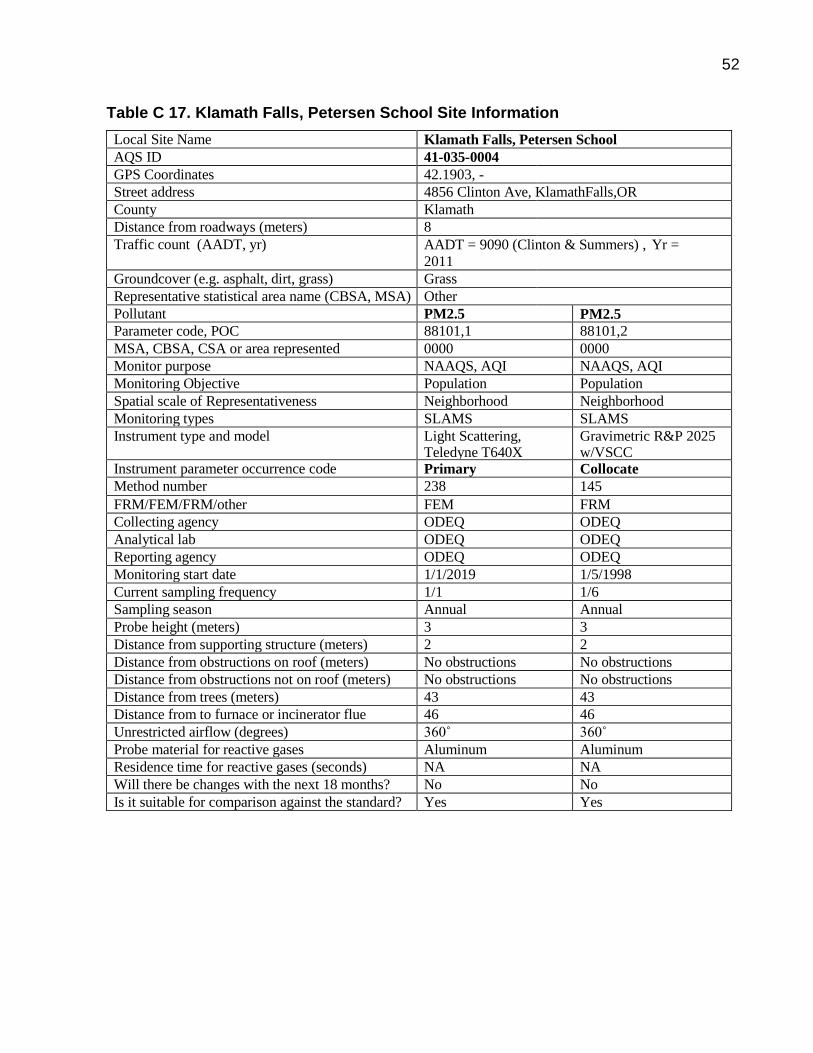
52
Table C 17. Klamath Falls, Petersen School Site Information
Local Site Name Klamath Falls, Petersen School
AQS ID 41-035-0004
GPS Coordinates 42.1903, -121.7314
Street address 4856 Clinton Ave, KlamathFalls,OR
County Klamath Distance from roadways (meters) 8 Traffic count (AADT, yr) AADT = 9090 (Clinton & Summers) , Yr =
2011
Groundcover (e.g. asphalt, dirt, grass) Grass Representative statistical area name (CBSA, MSA) Other Pollutant PM2.5 PM2.5
Parameter code, POC 88101,1 88101,2
MSA, CBSA, CSA or area represented 0000 0000
Monitor purpose NAAQS, AQI NAAQS, AQI
Monitoring Objective Population Population
Spatial scale of Representativeness Neighborhood Neighborhood
Monitoring types SLAMS SLAMS
Instrument type and model Light Scattering, Teledyne T640X
Gravimetric R&P 2025 w/VSCC
Instrument parameter occurrence code Primary Collocate
Method number 238 145
FRM/FEM/FRM/other FEM FRM
Collecting agency ODEQ ODEQ
Analytical lab ODEQ ODEQ
Reporting agency ODEQ ODEQ
Monitoring start date 1/1/2019 1/5/1998
Current sampling frequency 1/1 1/6
Sampling season Annual Annual
Probe height (meters) 3 3
Distance from supporting structure (meters) 2 2
Distance from obstructions on roof (meters) No obstructions No obstructions
Distance from obstructions not on roof (meters) No obstructions No obstructions
Distance from trees (meters) 43 43
Distance from to furnace or incinerator flue (meters)
46 46
Unrestricted airflow (degrees) 360˚ 360˚
Probe material for reactive gases Aluminum Aluminum
Residence time for reactive gases (seconds) NA NA
Will there be changes with the next 18 months? No No
Is it suitable for comparison against the standard? Yes Yes
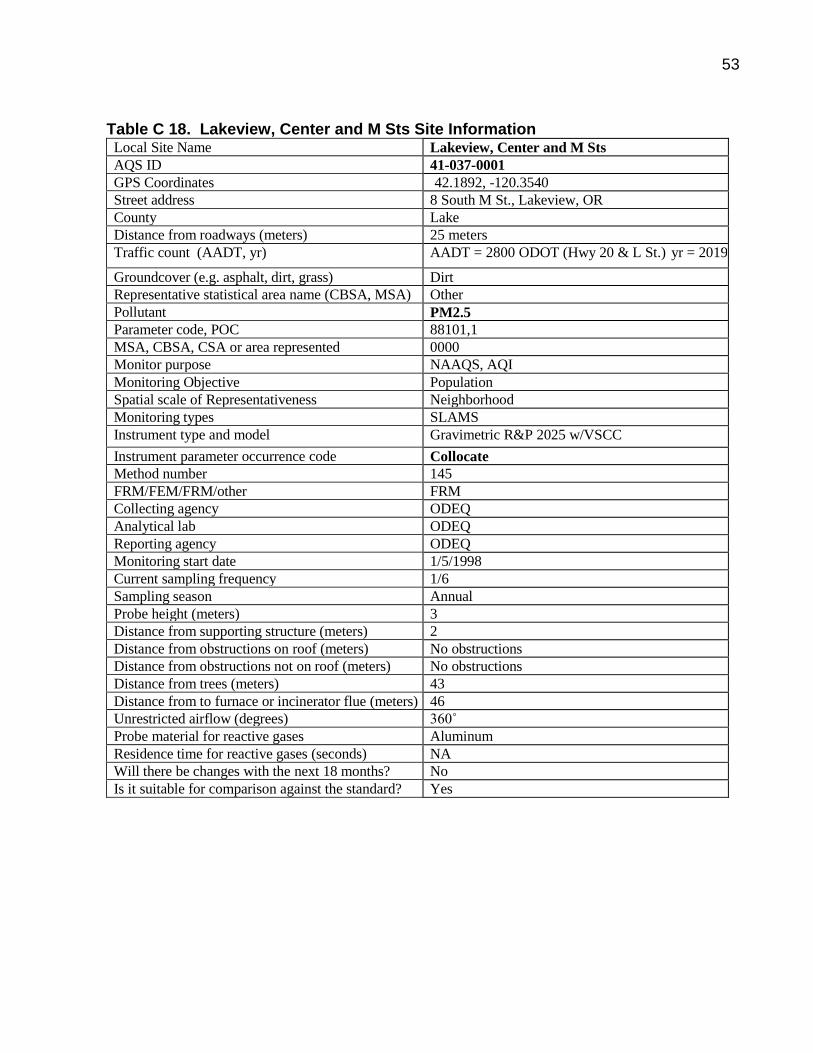
53
Table C 18. Lakeview, Center and M Sts Site Information Local Site Name Lakeview, Center and M Sts
AQS ID 41-037-0001
GPS Coordinates 42.1892, -120.3540
Street address 8 South M St., Lakeview, OR
County Lake
Distance from roadways (meters) 25 meters
Traffic count (AADT, yr) AADT = 2800 ODOT (Hwy 20 & L St.) yr = 2019
Groundcover (e.g. asphalt, dirt, grass) Dirt
Representative statistical area name (CBSA, MSA) Other
Pollutant PM2.5
Parameter code, POC 88101,1
MSA, CBSA, CSA or area represented 0000
Monitor purpose NAAQS, AQI
Monitoring Objective Population
Spatial scale of Representativeness Neighborhood
Monitoring types SLAMS
Instrument type and model Gravimetric R&P 2025 w/VSCC
Instrument parameter occurrence code Collocate
Method number 145
FRM/FEM/FRM/other FRM
Collecting agency ODEQ
Analytical lab ODEQ
Reporting agency ODEQ
Monitoring start date 1/5/1998
Current sampling frequency 1/6
Sampling season Annual
Probe height (meters) 3
Distance from supporting structure (meters) 2
Distance from obstructions on roof (meters) No obstructions
Distance from obstructions not on roof (meters) No obstructions
Distance from trees (meters) 43
Distance from to furnace or incinerator flue (meters) 46
Unrestricted airflow (degrees) 360˚
Probe material for reactive gases Aluminum
Residence time for reactive gases (seconds) NA
Will there be changes with the next 18 months? No
Is it suitable for comparison against the standard? Yes
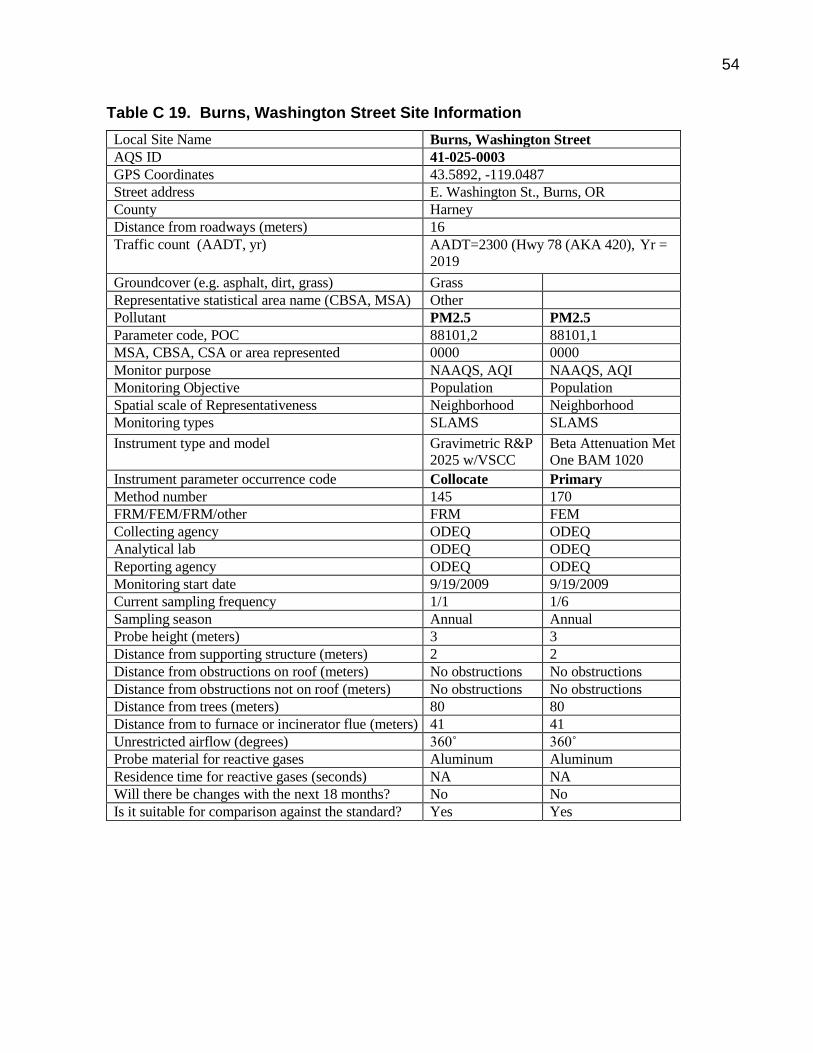
54
Table C 19. Burns, Washington Street Site Information
Local Site Name Burns, Washington Street
AQS ID 41-025-0003
GPS Coordinates 43.5892, -119.0487
Street address E. Washington St., Burns, OR
County Harney
Distance from roadways (meters) 16
Traffic count (AADT, yr) AADT=2300 (Hwy 78 (AKA 420), Yr =
2019
Groundcover (e.g. asphalt, dirt, grass) Grass
Representative statistical area name (CBSA, MSA) Other
Pollutant PM2.5 PM2.5
Parameter code, POC 88101,2 88101,1
MSA, CBSA, CSA or area represented 0000 0000
Monitor purpose NAAQS, AQI NAAQS, AQI
Monitoring Objective Population Population
Spatial scale of Representativeness Neighborhood Neighborhood
Monitoring types SLAMS SLAMS
Instrument type and model Gravimetric R&P 2025 w/VSCC
Beta Attenuation Met One BAM 1020
Instrument parameter occurrence code Collocate Primary
Method number 145 170
FRM/FEM/FRM/other FRM FEM
Collecting agency ODEQ ODEQ
Analytical lab ODEQ ODEQ
Reporting agency ODEQ ODEQ
Monitoring start date 9/19/2009 9/19/2009
Current sampling frequency 1/1 1/6
Sampling season Annual Annual
Probe height (meters) 3 3
Distance from supporting structure (meters) 2 2
Distance from obstructions on roof (meters) No obstructions No obstructions
Distance from obstructions not on roof (meters) No obstructions No obstructions
Distance from trees (meters) 80 80
Distance from to furnace or incinerator flue (meters) 41 41
Unrestricted airflow (degrees) 360˚ 360˚
Probe material for reactive gases Aluminum Aluminum
Residence time for reactive gases (seconds) NA NA
Will there be changes with the next 18 months? No No
Is it suitable for comparison against the standard? Yes Yes

55
Table C 20. Prineville, Davidson Park Site Information
Local Site Name Prineville, Davidson Park
AQS ID 41-013-0100
GPS Coordinates 44.2998, -120.8448 Street address 251 SE Court St, Prineville, OR
County Crook Distance from roadways (meters) 10
Traffic count (AADT, yr) 11300 (Hwy 26 & Fairview St), 2019
Groundcover (e.g. asphalt, dirt, grass) Grass Representative statistical area name (CBSA, MSA) Other Pollutant PM2.5
Parameter code, POC 88101,1
MSA, CBSA, CSA or area represented 0000
Monitor purpose NAAQS, AQI
Monitoring Objective Population
Spatial scale of Representativeness Neighborhood
Monitoring types SLAMS
Instrument type and model Gravimetric R&P 2025 w/VSCC
Instrument parameter occurrence code Primary
Method number 145
FRM/FEM/FRM/other FRM
Collecting agency ODEQ
Analytical lab ODEQ
Reporting agency ODEQ
Monitoring start date 1/1/2009
Current sampling frequency 1/3
Sampling season Annual
Probe height (meters) 3
Distance from supporting structure (meters) 2
Distance from obstructions on roof (meters) No obstructions
Distance from obstructions not on roof (meters) No obstructions
Distance from trees (meters) 37
Distance from to furnace or incinerator flue (meters) 39
Unrestricted airflow (degrees) 360˚
Probe material for reactive gases Aluminum
Residence time for reactive gases (seconds) NA
Will there be changes with the next 18 months? No
Is it suitable for comparison against the standard? Yes

56
Table C 21. La Grande, Hall and North Site Information
Local Site Name La Grande, Hall and North Street
AQS ID 41-061-0119
GPS Coordinates 45.32363, -118.07806
Street address 1305 N Willow St, La Grande, OR
County Union
Distance from roadways (meters) 18
Traffic count (AADT, yr) No data
Groundcover (e.g. asphalt, dirt, grass) Grass
Representative statistical area name (CBSA, MSA) Other
Pollutant PM10
Parameter code, POC 81102,7
MSA, CBSA, CSA or area represented 0000
Monitor purpose NAAQS, AQI
Monitoring Objective Population
Spatial scale of Representativeness Neighborhood
Monitoring types SLAMS
Instrument type and model Gravimetric, Tisch PM10 HV+
Instrument parameter occurrence code Primary
Method number 141
FRM/FEM/FRM/other FRM
Collecting agency ODEQ
Analytical lab ODEQ
Reporting agency ODEQ
Monitoring start date 9/1/2017
Current sampling frequency 1/6
Sampling season Annual
Probe height (meters) 3
Distance from supporting structure (meters) 2
Distance from obstructions on roof (meters) No obstructions
Distance from obstructions not on roof (meters) No obstructions
Distance from trees (meters) 26
Distance from to furnace or incinerator flue (meters) 39
Unrestricted airflow (degrees) 360˚
Probe material for reactive gases Aluminum
Residence time for reactive gases (seconds) NA
Will there be changes with the next 18 months? No
Is it suitable for comparison against the standard? Yes

57
Table C 22. Hermiston Municipal Airport Site Information
Local Site Name Hermiston Municipal Airport
AQS ID 41-059-1003 GPS Coordinates 45.8290, -119.2630 Street address 1498 Airport Way, Hermiston, OR
County Umatilla Distance from roadways (meters) 888,
Traffic count (AADT, yr) AADT = 8200 (MP 8.7, US395 or Hwy
54), Yr = 2019
Groundcover (e.g. asphalt, dirt, grass) Grass Representative statistical area name (CBSA, MSA) Hermiston (CBSA 25840)
Pollutant Ozone
Parameter code, POC 44201,1
MSA, CBSA, CSA or area represented 0000
Monitor purpose NAAQS, AQI
Monitoring Objective Population
Spatial scale of Representativeness Urban
Monitoring types SLAMS
Instrument type and model UV Absorption, Teledyne T400
Instrument parameter occurrence code Primary
Method number 087
FRM/FEM/FRM/other FRM
Collecting agency ODEQ
Analytical lab ODEQ
Reporting agency ODEQ
Monitoring start date 2/27/2007
Current sampling frequency Hourly
Sampling season May-Sept
Probe height (meters) 4
Distance from supporting structure (meters) 1
Distance from obstructions on roof (meters) No obstructions
Distance from obstructions not on roof (meters) No obstructions
Distance from trees (meters) 134
Distance from to furnace or incinerator flue (meters) 72
Unrestricted airflow (degrees) 360˚
Probe material for reactive gases Teflon
Residence time for reactive gases (seconds) 2.8
Will there be changes with the next 18 months? No
Is it suitable for comparison against the standard? Yes
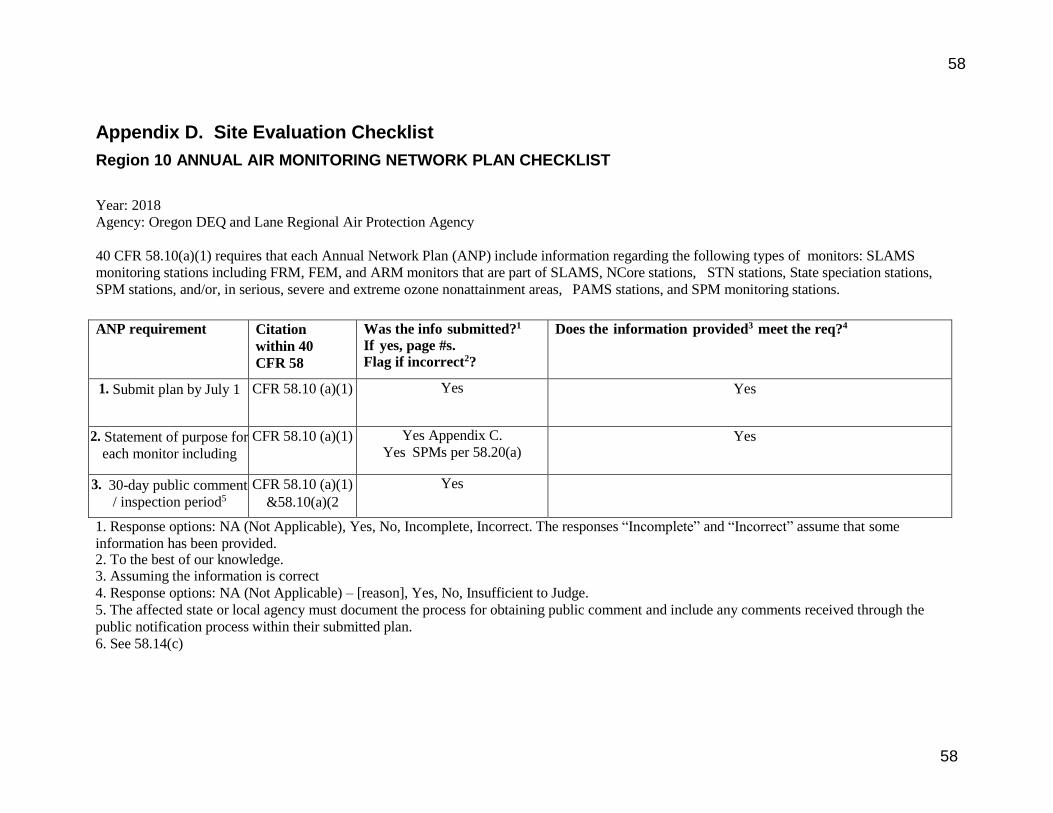
58
58
Appendix D. Site Evaluation Checklist
Region 10 ANNUAL AIR MONITORING NETWORK PLAN CHECKLIST
Year: 2018
Agency: Oregon DEQ and Lane Regional Air Protection Agency
40 CFR 58.10(a)(1) requires that each Annual Network Plan (ANP) include information regarding the following types of monitors: SLAMS
monitoring stations including FRM, FEM, and ARM monitors that are part of SLAMS, NCore stations, STN stations, State speciation stations,
SPM stations, and/or, in serious, severe and extreme ozone nonattainment areas, PAMS stations, and SPM monitoring stations.
ANP requirement Citation
within 40
CFR 58
Was the info submitted?1
If yes, page #s.
Flag if incorrect2?
Does the information provided3 meet the req?4
1. Submit plan by July 1 CFR 58.10 (a)(1) Yes Yes
2. Statement of purpose for
each monitor including
CFR 58.10 (a)(1) Yes Appendix C.
Yes SPMs per 58.20(a) Yes
3. 30-day public comment
/ inspection period5
CFR 58.10 (a)(1)
&58.10(a)(2
Yes
1. Response options: NA (Not Applicable), Yes, No, Incomplete, Incorrect. The responses “Incomplete” and “Incorrect” assume that some
information has been provided. 2. To the best of our knowledge. 3. Assuming the information is correct
4. Response options: NA (Not Applicable) – [reason], Yes, No, Insufficient to Judge.
5. The affected state or local agency must document the process for obtaining public comment and include any comments received through the
public notification process within their submitted plan.
6. See 58.14(c)
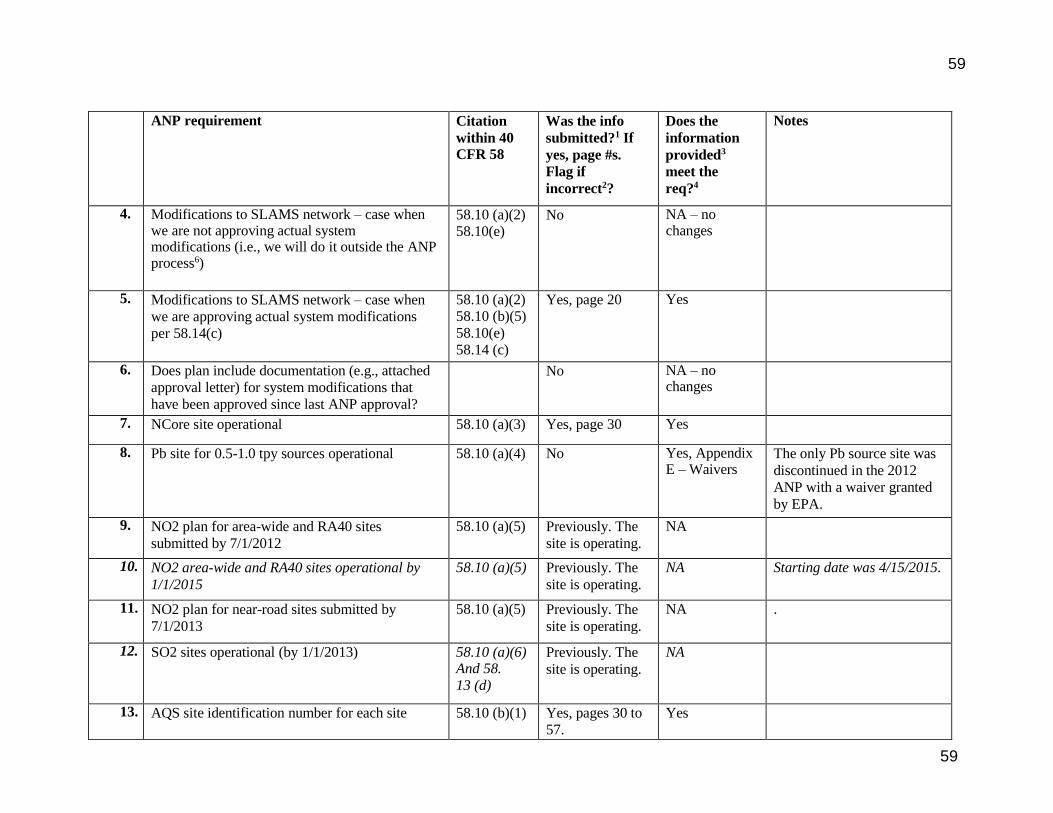
59
59
ANP requirement Citation
within 40 CFR 58
Was the info
submitted?1 If
yes, page #s.
Flag if
incorrect2?
Does the
information
provided3
meet the
req?4
Notes
4. Modifications to SLAMS network – case when we are not approving actual system modifications (i.e., we will do it outside the ANP process6)
58.10 (a)(2) 58.10(e)
No NA – no changes
5. Modifications to SLAMS network – case when
we are approving actual system modifications
per 58.14(c)
58.10 (a)(2) 58.10 (b)(5)
58.10(e)
58.14 (c)
Yes, page 20 Yes
6. Does plan include documentation (e.g., attached
approval letter) for system modifications that
have been approved since last ANP approval?
No NA – no changes
7. NCore site operational 58.10 (a)(3) Yes, page 30 Yes
8. Pb site for 0.5-1.0 tpy sources operational 58.10 (a)(4) No Yes, Appendix E – Waivers
The only Pb source site was
discontinued in the 2012
ANP with a waiver granted
by EPA.
9. NO2 plan for area-wide and RA40 sites
submitted by 7/1/2012
58.10 (a)(5) Previously. The
site is operating.
NA
10. NO2 area-wide and RA40 sites operational by
1/1/2015
58.10 (a)(5) Previously. The
site is operating.
NA Starting date was 4/15/2015.
11. NO2 plan for near-road sites submitted by
7/1/2013
58.10 (a)(5) Previously. The
site is operating.
NA .
12. SO2 sites operational (by 1/1/2013) 58.10 (a)(6) And 58.
13 (d)
Previously. The
site is operating.
NA
13. AQS site identification number for each site 58.10 (b)(1) Yes, pages 30 to
57.
Yes
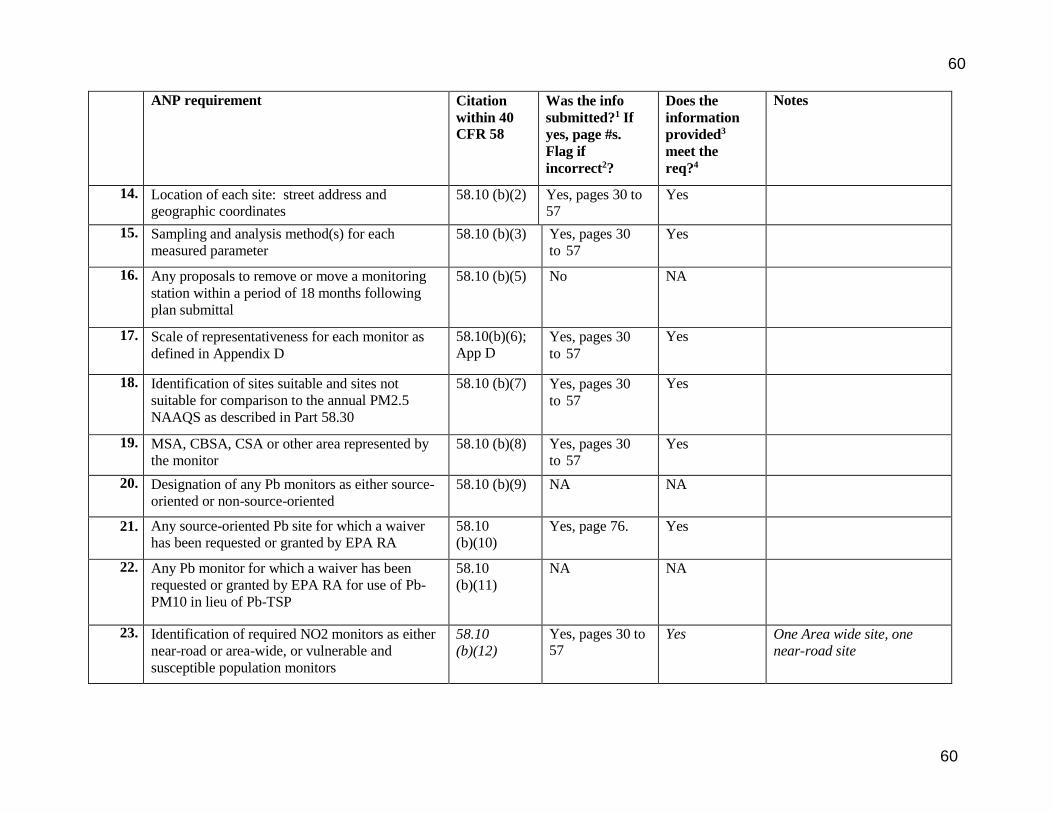
60
60
ANP requirement Citation
within 40 CFR 58
Was the info
submitted?1 If
yes, page #s.
Flag if
incorrect2?
Does the
information
provided3
meet the
req?4
Notes
14. Location of each site: street address and geographic coordinates
58.10 (b)(2) Yes, pages 30 to 57
Yes
15. Sampling and analysis method(s) for each
measured parameter
58.10 (b)(3) Yes, pages 30
to 57
Yes
16. Any proposals to remove or move a monitoring
station within a period of 18 months following
plan submittal
58.10 (b)(5) No NA
17. Scale of representativeness for each monitor as
defined in Appendix D
58.10(b)(6); App D
Yes, pages 30
to 57
Yes
18. Identification of sites suitable and sites not
suitable for comparison to the annual PM2.5
NAAQS as described in Part 58.30
58.10 (b)(7) Yes, pages 30
to 57
Yes
19. MSA, CBSA, CSA or other area represented by
the monitor
58.10 (b)(8) Yes, pages 30
to 57
Yes
20. Designation of any Pb monitors as either source-
oriented or non-source-oriented
58.10 (b)(9) NA NA
21. Any source-oriented Pb site for which a waiver
has been requested or granted by EPA RA
58.10
(b)(10) Yes, page 76. Yes
22. Any Pb monitor for which a waiver has been
requested or granted by EPA RA for use of Pb-
PM10 in lieu of Pb-TSP
58.10
(b)(11)
NA NA
23. Identification of required NO2 monitors as either
near-road or area-wide, or vulnerable and
susceptible population monitors
58.10
(b)(12)
Yes, pages 30 to 57
Yes One Area wide site, one
near-road site
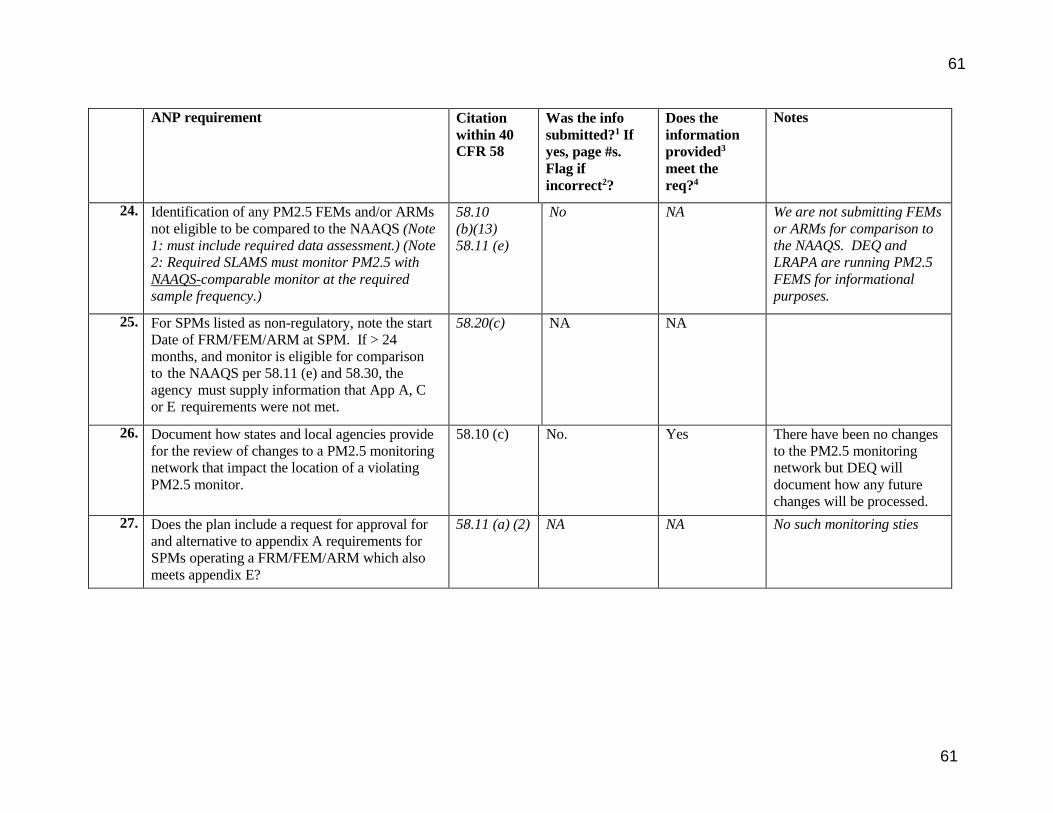
61
61
ANP requirement Citation
within 40 CFR 58
Was the info
submitted?1 If
yes, page #s.
Flag if
incorrect2?
Does the
information
provided3
meet the
req?4
Notes
24. Identification of any PM2.5 FEMs and/or ARMs
not eligible to be compared to the NAAQS (Note
1: must include required data assessment.) (Note
2: Required SLAMS must monitor PM2.5 with
NAAQS-comparable monitor at the required
sample frequency.)
58.10
(b)(13)
58.11 (e)
No NA We are not submitting FEMs
or ARMs for comparison to
the NAAQS. DEQ and
LRAPA are running PM2.5
FEMS for informational
purposes.
25. For SPMs listed as non-regulatory, note the start
Date of FRM/FEM/ARM at SPM. If > 24
months, and monitor is eligible for comparison
to the NAAQS per 58.11 (e) and 58.30, the
agency must supply information that App A, C
or E requirements were not met.
58.20(c) NA NA
26. Document how states and local agencies provide
for the review of changes to a PM2.5 monitoring
network that impact the location of a violating
PM2.5 monitor.
58.10 (c) No. Yes There have been no changes
to the PM2.5 monitoring
network but DEQ will
document how any future
changes will be processed.
27. Does the plan include a request for approval for
and alternative to appendix A requirements for
SPMs operating a FRM/FEM/ARM which also
meets appendix E?
58.11 (a) (2) NA NA No such monitoring sties
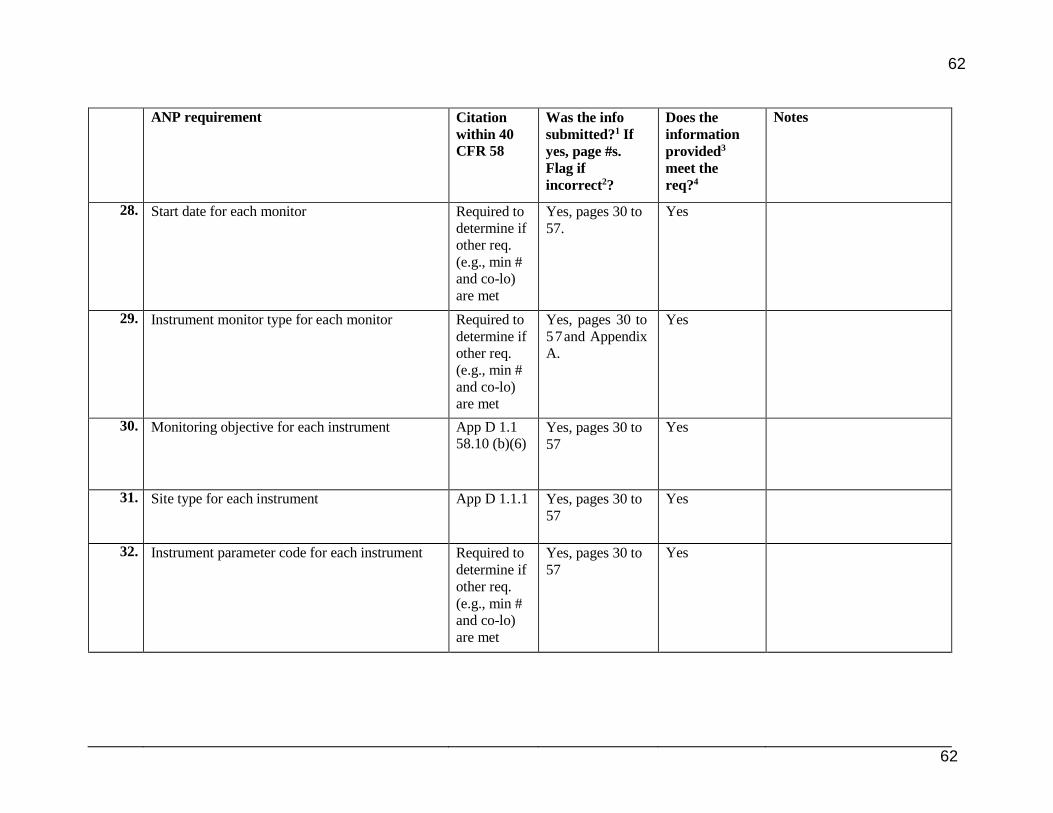
62
62
ANP requirement Citation
within 40 CFR 58
Was the info
submitted?1 If
yes, page #s.
Flag if
incorrect2?
Does the
information
provided3
meet the
req?4
Notes
28. Start date for each monitor Required to
determine if
other req.
(e.g., min #
and co-lo)
are met
Yes, pages 30 to
57.
Yes
29. Instrument monitor type for each monitor Required to
determine if
other req.
(e.g., min #
and co-lo)
are met
Yes, pages 30 to
57and Appendix
A.
Yes
30. Monitoring objective for each instrument App D 1.1 58.10 (b)(6)
Yes, pages 30 to
57
Yes
31. Site type for each instrument App D 1.1.1 Yes, pages 30 to
57
Yes
32. Instrument parameter code for each instrument Required to
determine if
other req.
(e.g., min #
and co-lo)
are met
Yes, pages 30 to
57
Yes
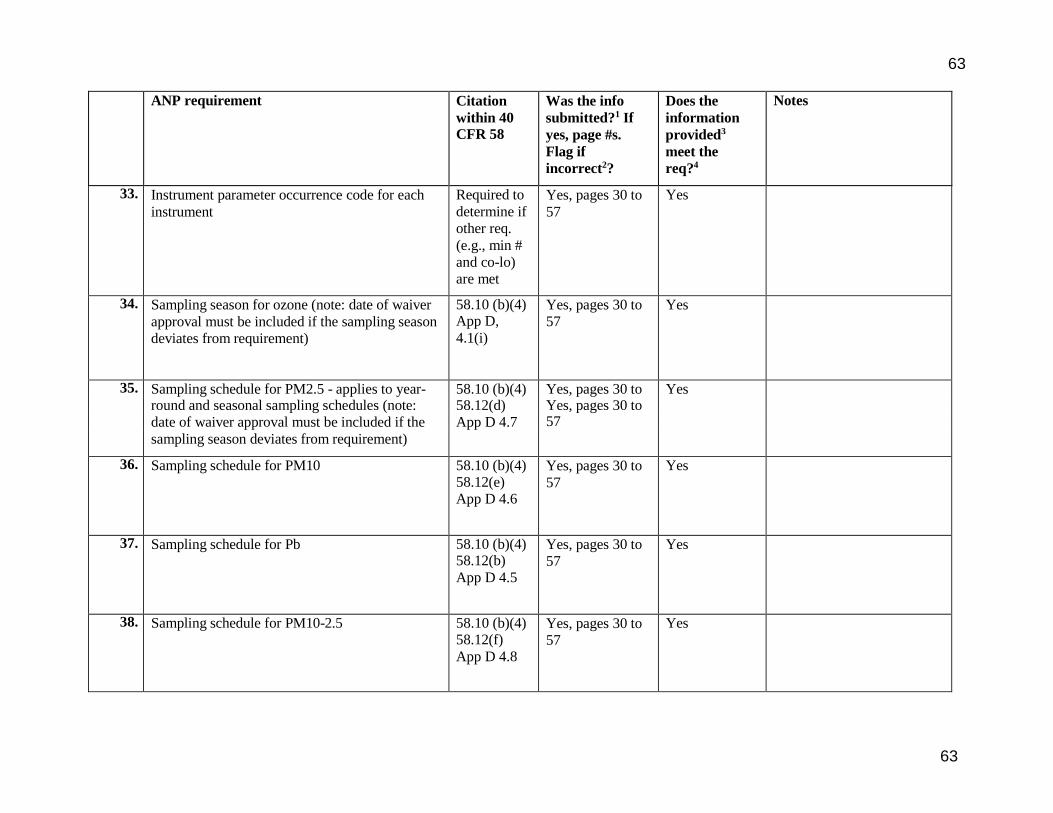
63
63
ANP requirement Citation
within 40 CFR 58
Was the info
submitted?1 If
yes, page #s.
Flag if
incorrect2?
Does the
information
provided3
meet the
req?4
Notes
33. Instrument parameter occurrence code for each
instrument
Required to
determine if
other req.
(e.g., min #
and co-lo)
are met
Yes, pages 30 to
57
Yes
34. Sampling season for ozone (note: date of waiver
approval must be included if the sampling season
deviates from requirement)
58.10 (b)(4) App D,
4.1(i)
Yes, pages 30 to
57
Yes
35. Sampling schedule for PM2.5 - applies to year- 58.10 (b)(4) Yes, pages 30 to 57
Yes round and seasonal sampling schedules (note: 58.12(d) Yes, pages 30 to
57 date of waiver approval must be included if the App D 4.7
sampling season deviates from requirement)
36. Sampling schedule for PM10 58.10 (b)(4) 58.12(e)
App D 4.6
Yes, pages 30 to
57
Yes
37. Sampling schedule for Pb 58.10 (b)(4) 58.12(b)
App D 4.5
Yes, pages 30 to
57
Yes
38. Sampling schedule for PM10-2.5 58.10 (b)(4) 58.12(f)
App D 4.8
Yes, pages 30 to
57
Yes

64
64
ANP requirement Citation
within 40 CFR 58
Was the info
submitted?1
If yes, page #s. Flag if
incorrect2?
Does the information
provided3
meet the
req?4
Notes
39. Minimum # of monitors for O3 met? [Note:
should be supported by MSA ID, MSA
population, DV, # monitors, and # required
monitors] (see footnote)7
App D,
4.1(a) &
Table D-2
Yes, pages 21 to
29.
Yes
40. Identification of max. conc. O3 monitor(s) App D 4.1 (b)
Yes, pages 30 to
57
Yes
41. Minimum monitoring requirements met for near-
road NO2 (2015 start date)
App D 4.3.2 Yes, pages 21 to
29.
Yes
42. Minimum monitoring requirements met for area-
wide NO2
App D 4.3.3 Yes, pages 21 to
29.
Yes
43. Minimum monitoring requirements met for SO2
[Note: Only monitors considered to be required
SLAMs are eligible to be counted towards
meeting minimum monitoring requirements.]
App D 4.4 Yes, pages 21 to
29.
Yes
44. Minimum monitoring requirements met for Pb
[Note: Only monitors considered to be required
SLAMs are eligible to be counted towards
meeting minimum monitoring requirements.]
App D 4.5
58.13(a)
Yes, pages 21 to
29.
Yes
7 Only monitors considered to be required SLAMs are eligible to be counted towards meeting minimum monitoring requirements. In addition,
ozone monitors that do not meet traffic count/distance requirements to be neighborhood scale (40 CFR 58 Appendix E, Table E-1) cannot be
counted towards minimum monitoring requirements.

65
65
ANP requirement Citation
within 40 CFR 58
Was the info
submitted?1
If yes, page #s. Flag if
incorrect2?
Does the information
provided3
meet the
req?4
Notes
45. Minimum # of monitors for PM2.5 met? [Note 1:
should be supported by MSA ID, MSA
population, DV, # monitors, and # required
monitors] [Note 2: Only monitors considered to
be required SLAMs are eligible to be counted
towards meeting minimum monitoring
requirements.]
App D,
4.7.1(a) and
Table D-5
Yes, pages 21 to
29.
Yes
46. Minimum monitoring requirements for
continuous PM2.5 met?
App D 4.7.2 Yes, pages 21 to
29.
Yes These are used for the Air
Quality Index only.
47. Minimum # of monitors for PM10 met? App D, 4.6 (a) and Table
D-4
Yes, pages 21 to
29.
48. Minimum monitoring requirements met for
PM10-2.5 mass at NCore sites?
App D 4.8 App D 4.7.2
Yes, pages 21 to
29.
Yes
49. Distance of site from nearest road App E 6 Yes, pages 30 to
57.
Yes
7 Only monitors considered to be required SLAMs are eligible to be counted towards meeting minimum monitoring requirements. In addition,
ozone monitors that do not meet traffic count/distance requirements to be neighborhood scale (40 CFR 58 Appendix E, Table E-1) cannot be
counted towards minimum monitoring requirements.
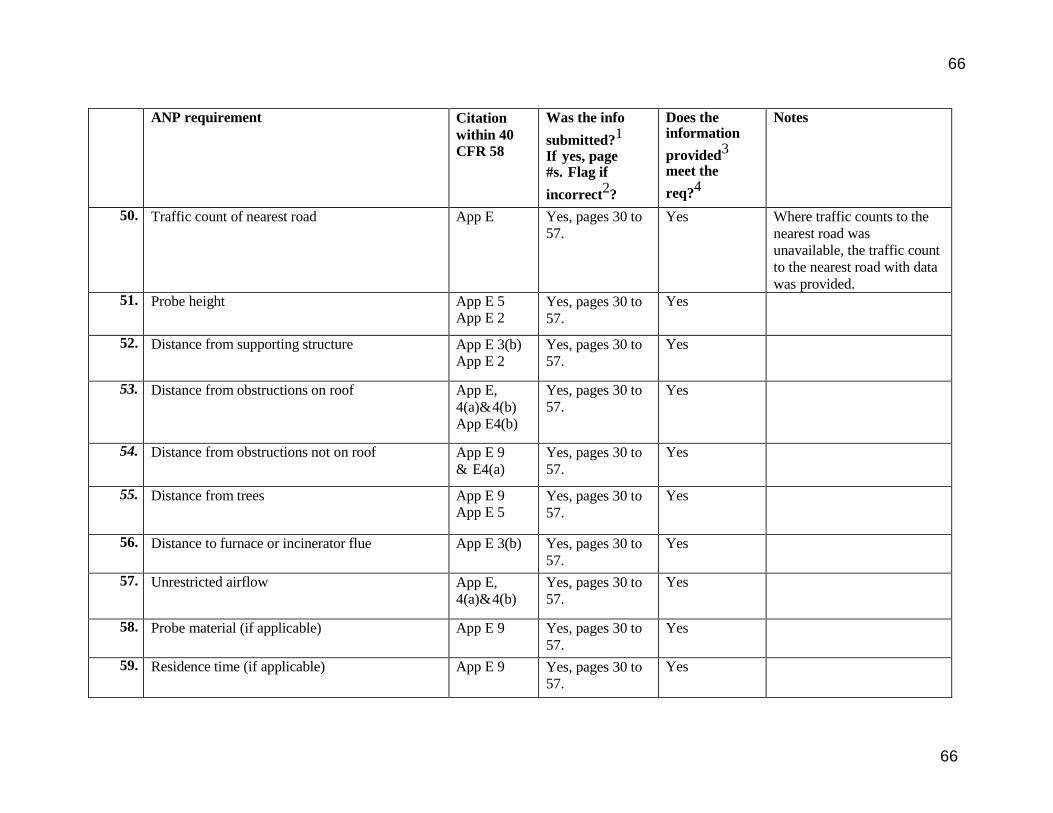
66
66
ANP requirement Citation
within 40 CFR 58
Was the info
submitted?1
If yes, page #s. Flag if
incorrect2?
Does the information
provided3
meet the
req?4
Notes
50. Traffic count of nearest road App E Yes, pages 30 to
57.
Yes Where traffic counts to the
nearest road was
unavailable, the traffic count
to the nearest road with data
was provided. 51. Probe height App E 5
App E 2 Yes, pages 30 to
57.
Yes
52. Distance from supporting structure App E 3(b)
App E 2
Yes, pages 30 to
57.
Yes
53. Distance from obstructions on roof App E,
4(a)&4(b)
App E4(b)
Yes, pages 30 to
57.
Yes
54. Distance from obstructions not on roof App E 9
& E4(a)
Yes, pages 30 to
57.
Yes
55. Distance from trees App E 9 App E 5
Yes, pages 30 to
57.
Yes
56. Distance to furnace or incinerator flue App E 3(b) Yes, pages 30 to
57.
Yes
57. Unrestricted airflow App E,
4(a)&4(b)
Yes, pages 30 to
57.
Yes
58. Probe material (if applicable) App E 9 Yes, pages 30 to
57.
Yes
59. Residence time (if applicable) App E 9 Yes, pages 30 to
57.
Yes
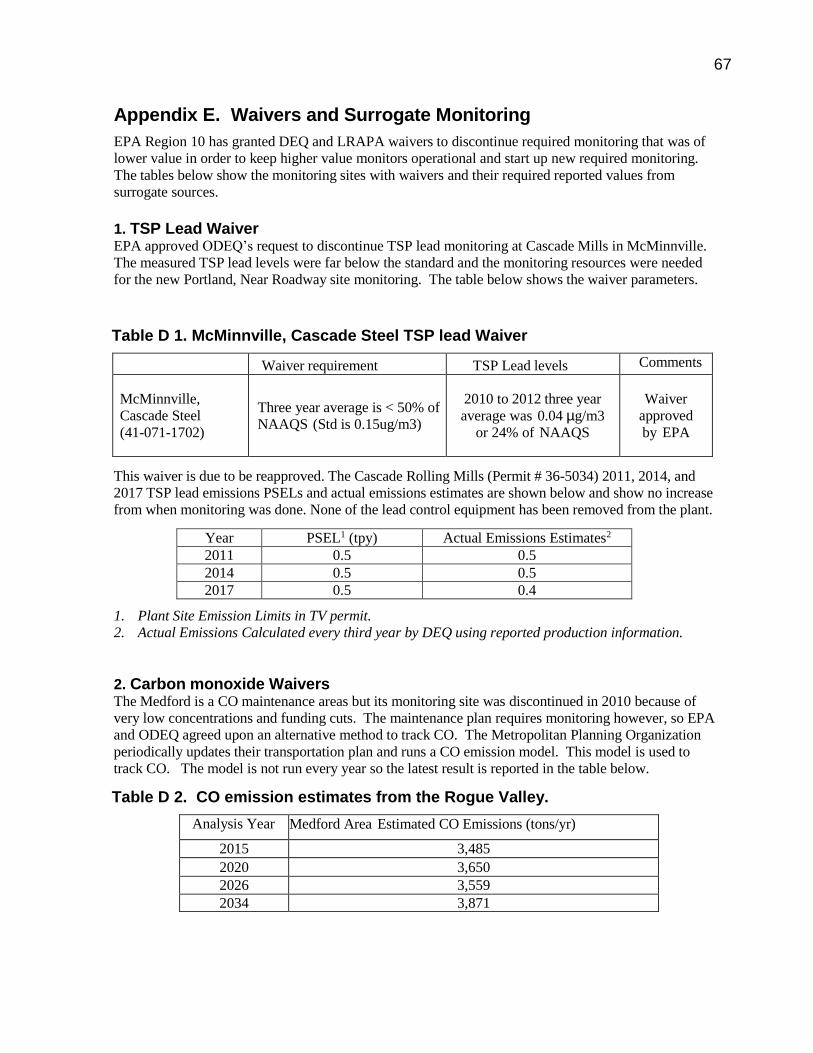
67
Appendix E. Waivers and Surrogate Monitoring
EPA Region 10 has granted DEQ and LRAPA waivers to discontinue required monitoring that was of
lower value in order to keep higher value monitors operational and start up new required monitoring.
The tables below show the monitoring sites with waivers and their required reported values from
surrogate sources.
1. TSP Lead Waiver EPA approved ODEQ’s request to discontinue TSP lead monitoring at Cascade Mills in McMinnville.
The measured TSP lead levels were far below the standard and the monitoring resources were needed
for the new Portland, Near Roadway site monitoring. The table below shows the waiver parameters.
Table D 1. McMinnville, Cascade Steel TSP lead Waiver
Waiver requirement TSP Lead levels Comments
McMinnville,
Cascade Steel
(41-071-1702)
Three year average is < 50% of
NAAQS (Std is 0.15ug/m3)
2010 to 2012 three year
average was 0.04 µg/m3
or 24% of NAAQS
Waiver
approved
by EPA
This waiver is due to be reapproved. The Cascade Rolling Mills (Permit # 36-5034) 2011, 2014, and
2017 TSP lead emissions PSELs and actual emissions estimates are shown below and show no increase
from when monitoring was done. None of the lead control equipment has been removed from the plant.
Year PSEL1 (tpy) Actual Emissions Estimates2
2011 0.5 0.5
2014 0.5 0.5
2017 0.5 0.4
1. Plant Site Emission Limits in TV permit.
2. Actual Emissions Calculated every third year by DEQ using reported production information.
2. Carbon monoxide Waivers The Medford is a CO maintenance areas but its monitoring site was discontinued in 2010 because of
very low concentrations and funding cuts. The maintenance plan requires monitoring however, so EPA
and ODEQ agreed upon an alternative method to track CO. The Metropolitan Planning Organization
periodically updates their transportation plan and runs a CO emission model. This model is used to
track CO. The model is not run every year so the latest result is reported in the table below.
Table D 2. CO emission estimates from the Rogue Valley.
Analysis Year Medford Area Estimated CO Emissions (tons/yr)
2015 3,485
2020 3,650
2026 3,559
2034 3,871

68
3. PM10 Surrogate Monitoring In 2010 the Grants Pass PM10 monitor was discontinued because its values had dropped far below the
NAAQS and funding was cut. The PM10 maintenance plans for this site required continued monitoring so
EPA and ODEQ agreed upon an alternate method to track PM10. EPA allowed ODEQ to discontinue
PM10 monitoring if we used PM2.5 monitoring as a surrogate. In the 2010 network plan, we showed that
the PM10 consisted predominantly of PM2.5. We developed correlation equations and calculated 2015
PM10 estimates for these sites based on PM2.5. The PM10 standard is 150µg/m3.
Table D 3. Linear regression equations used to estimate PM10 using PM2.5.
Grants Pass Klamath Falls
Linear Regression Equation y = 1.2x + 2.6 y = 1.4x + 3.2
Y = PM10, X = PM2.5
Table D 4. 2013 PM10 estimates for Klamath Falls and Grants Pass.
Klamath Falls a Grants Pass
PM10 estimate. Number of days >150 (µg/m3)
2018 – 18 (6 actual days on 1/3 schedule)
2019 – 0 2018-20 Average = 7.0
2020 – 3
2018 – 0
2019 – 0 2018-20 Average = 2.0
2020 – 6 (1 actual day on 1/6 schedule)
a. All of the PM2.5 days were from wildfire impacts.
4. Existing Monitoring Waivers. 4.1 2005 - Klamath Falls CO Monitoring Waiver Approval
4.2 2011 - Klamath Falls PM10, Grants Pass PM10, and Medford CO Monitoring Waiver Request
and Approval
4.3 2012 - McMinnville Lead Monitoring Waiver Request and Approval
4.4 2012 - NCORE NOy Monitoring Waiver Request and Approval
5. New Monitoring Waiver Request

69
4.1. 2005 Klamath Falls CO Monitoring Waiver Approval
70
4.2. 2011 - Klamath Falls PM10, Grants Pass PM10, and Medford CO Monitoring Waiver Request and Approval Waiver Request: Justification for Discontinuation of Monitoring in Carbon Monoxide and PM10 Maintenance Areas (This document is too large to post here and is available upon request)
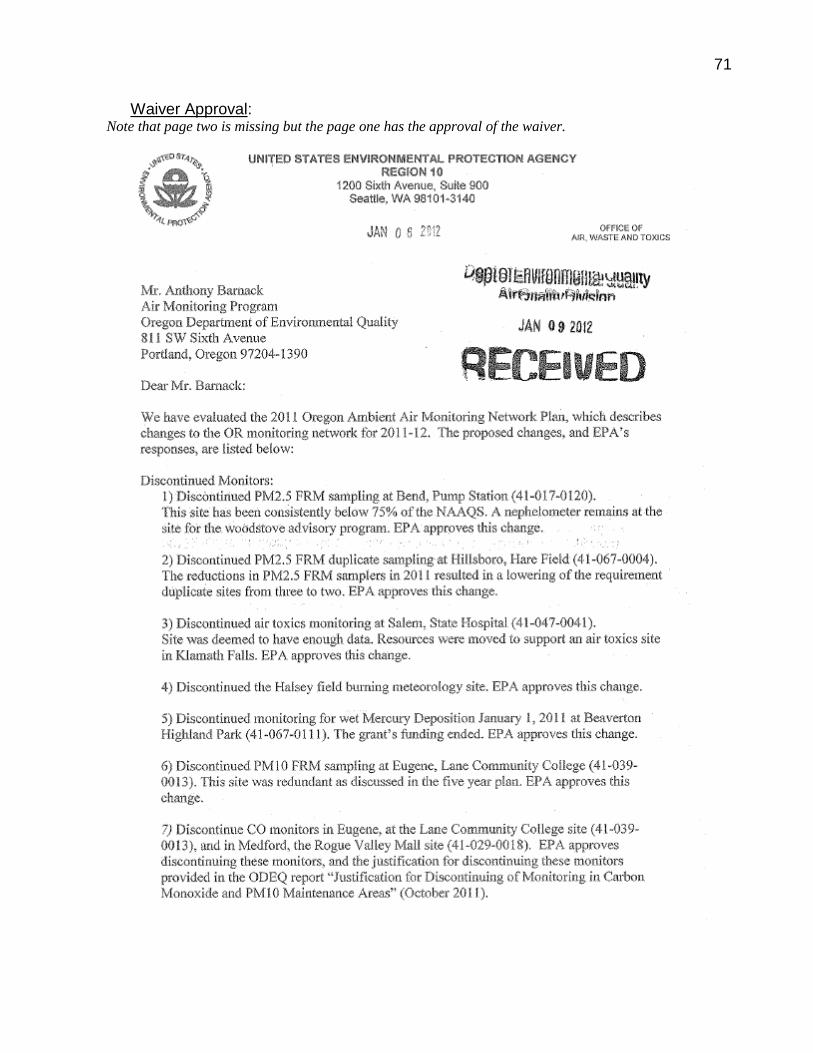
71
Waiver Approval: Note that page two is missing but the page one has the approval of the waiver.
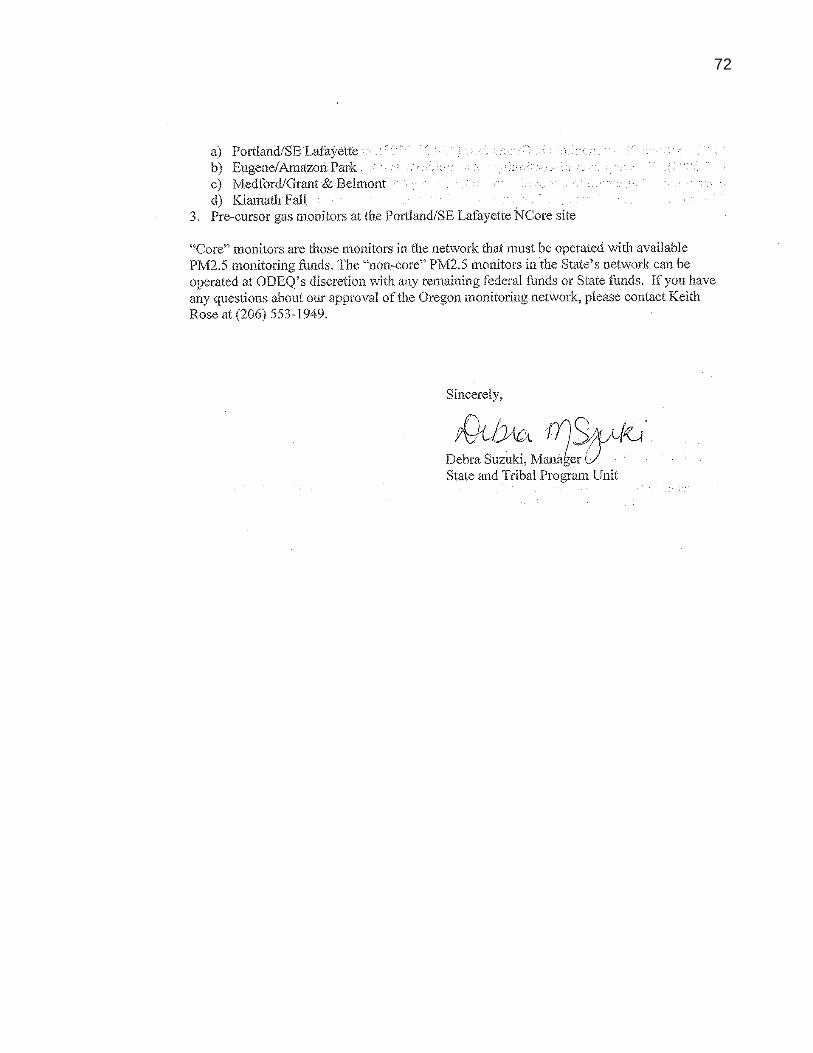
72
73
4.3. 2012 - McMinnville Lead Monitoring Waiver Request and Approval Waiver Request Note that the Re: statement is labeled NOy but the content is for TSP lead.
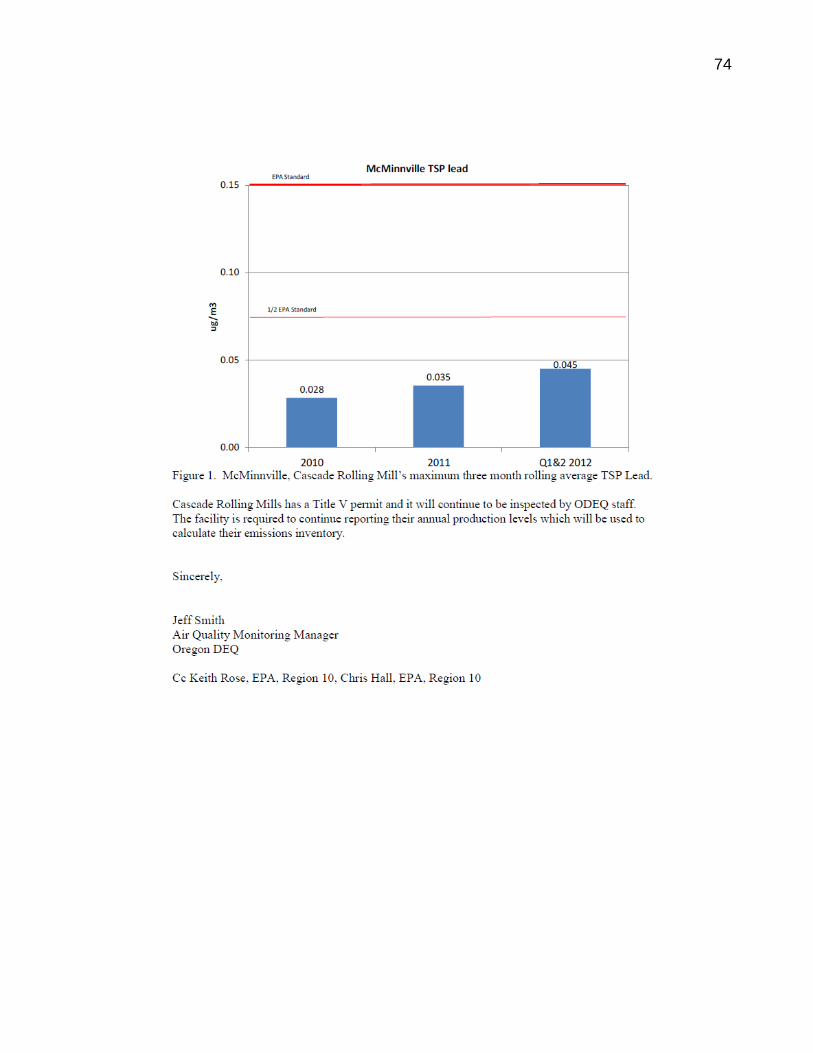
74
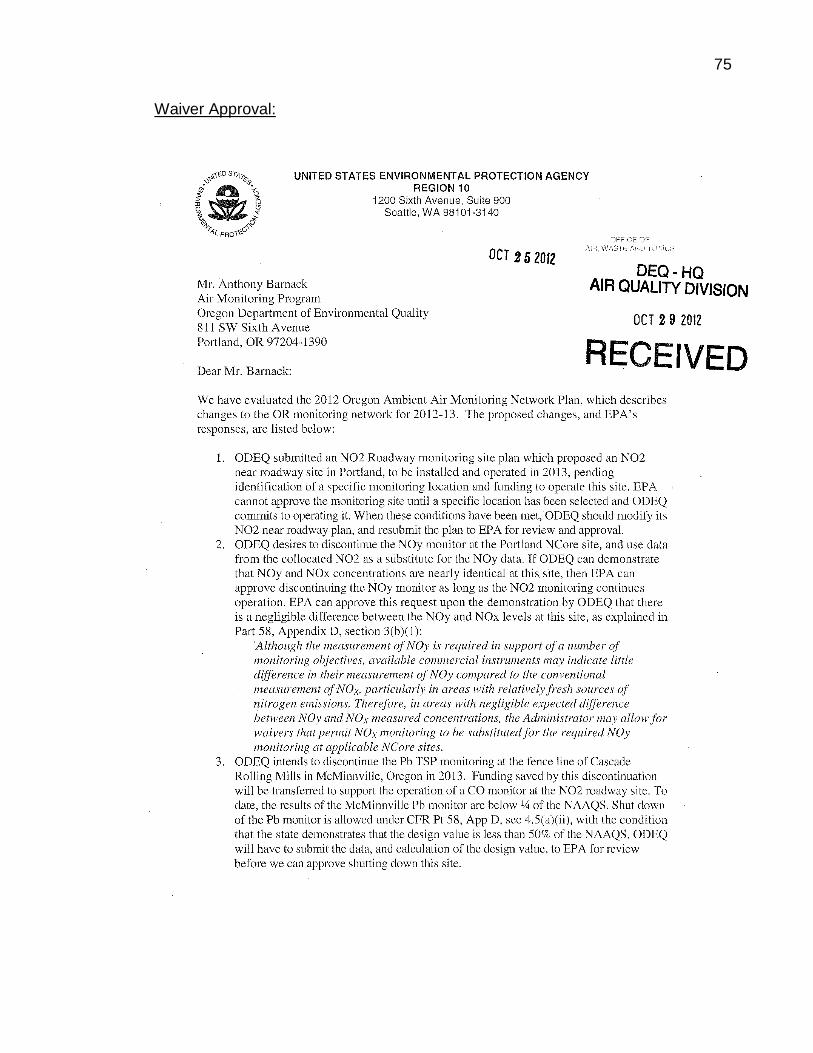
75
Waiver Approval:
76
77
4.4. 2012 - NCORE NOy Monitoring Waiver Request and Approval Waiver Request
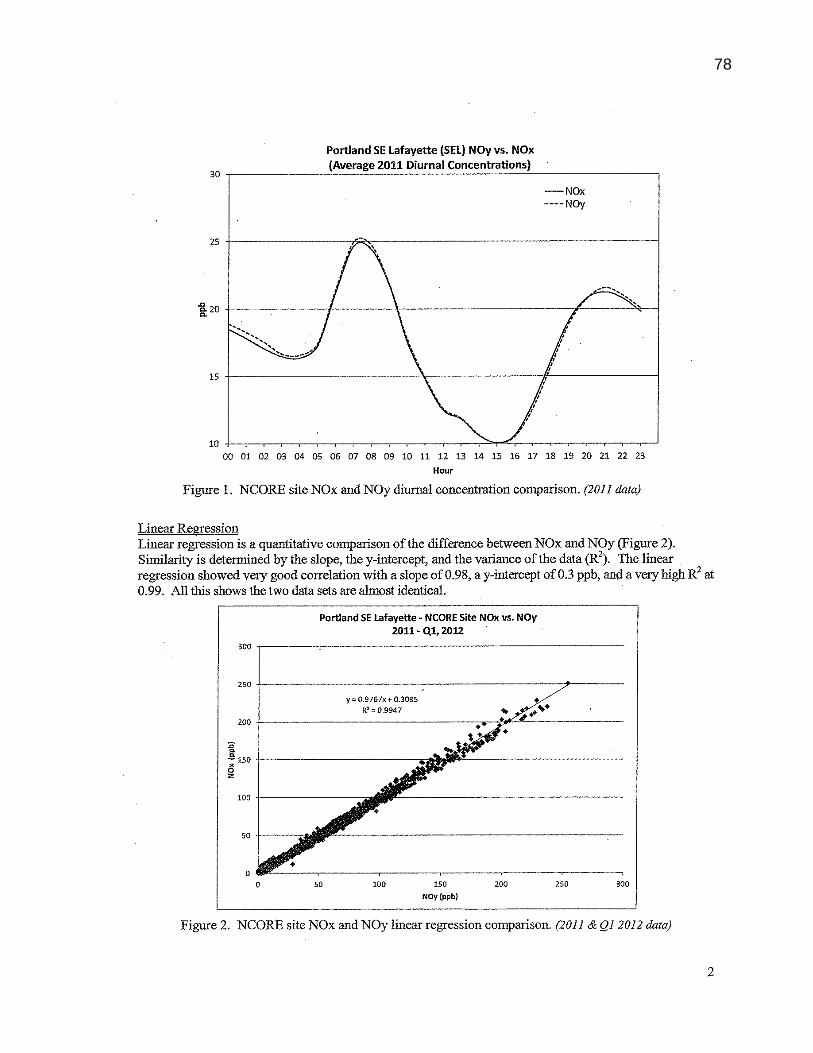
78
79
80
Waiver Approval
81
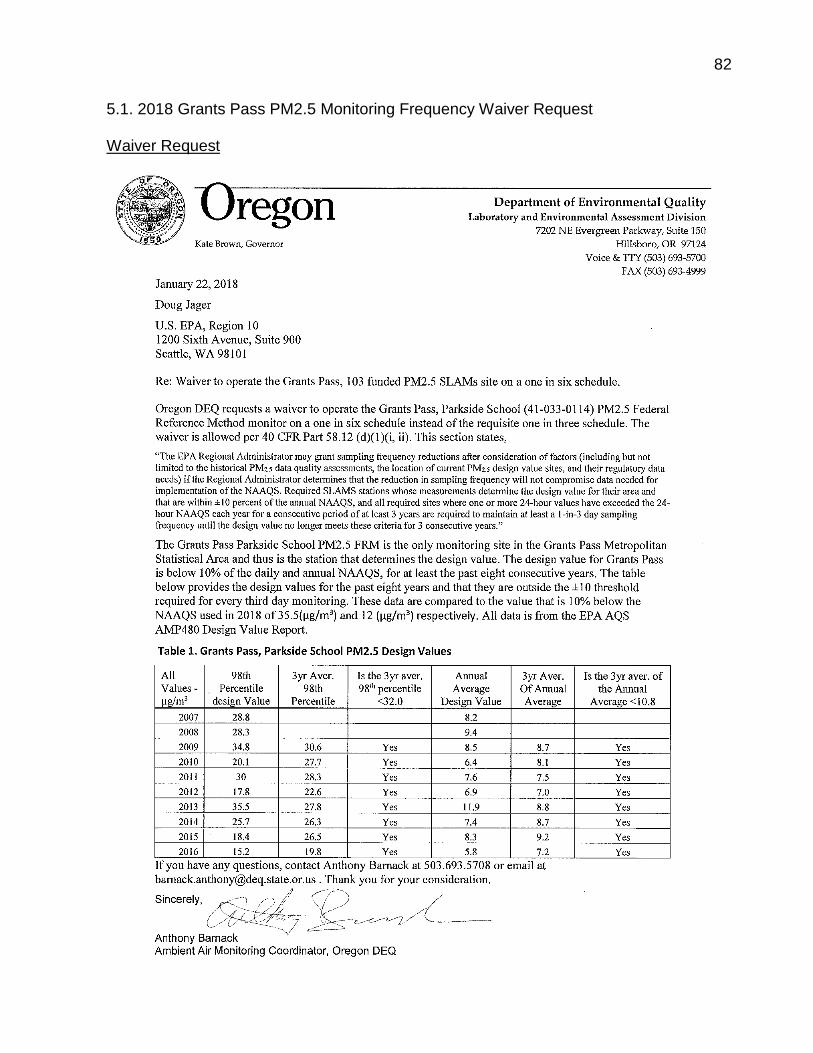
82
5.1. 2018 Grants Pass PM2.5 Monitoring Frequency Waiver Request Waiver Request
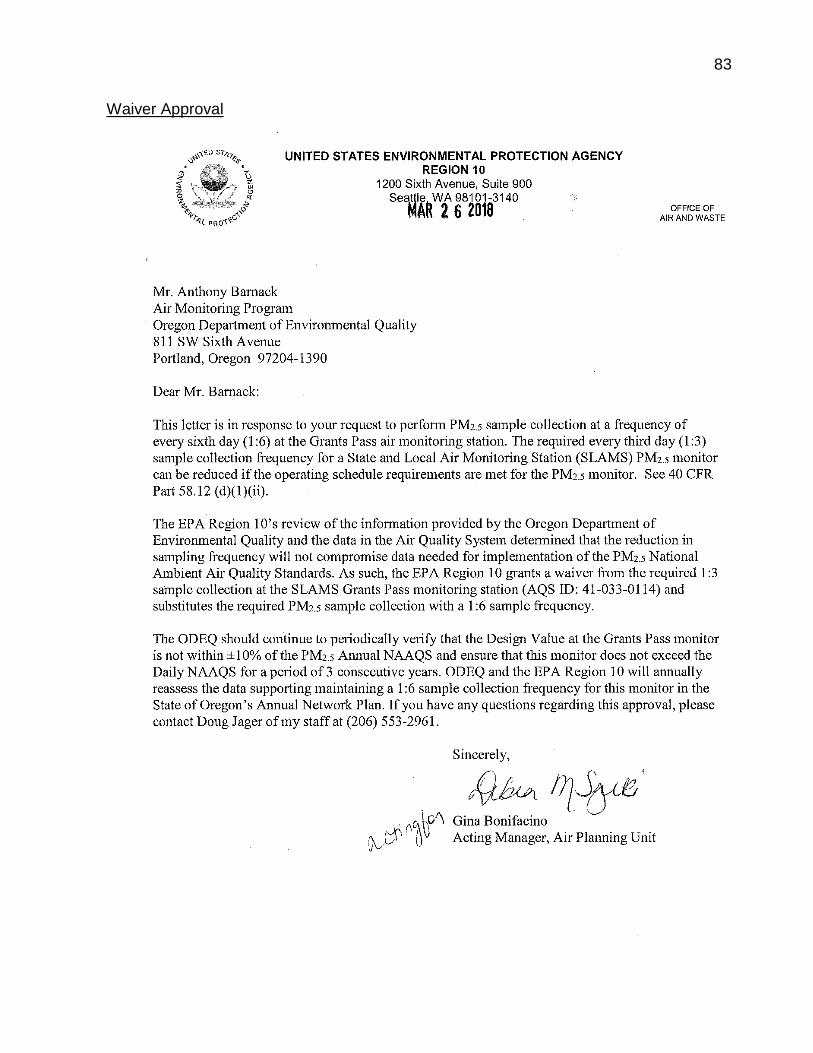
83
Waiver Approval

84
Appendix F. Interstate Memos of Understanding F.1 Portland/Vancouver Airshed.

85
86

87
Appendix G. Review of Violating monitor changes.
DEQ, LRAPA, and EPA may decide that a monitoring location, method, frequency, or other
properties needs to be changed to provide more accurate or representative information for an
area. Any changes will go through public notice and be approved by Region 10 EPA, Oregon
DEQ or (Lane Regional Air Protection Agency depending on the location). Changes will meet
the siting criteria in 40 CFR Part 58.