Embed Size (px)
Citation preview
1
Synopsis SNPP Stability Deconvolution and Translation SNO
CrIS, Three Years of Operation, Stability andComparison to AIRS
Chris Hepplewhite, L. Larrabee Strow, Howard Motteler,Sergio De Souza-Machado, and Steven Buczkowski
UMBCDepartment of Physics and
Joint Center for Earth Systems Technology
AIRS Science Team MeetingGreenbelt, MD, 13 - 16 October 2015
2
Synopsis SNPP Stability Deconvolution and Translation SNO
What, Why and How
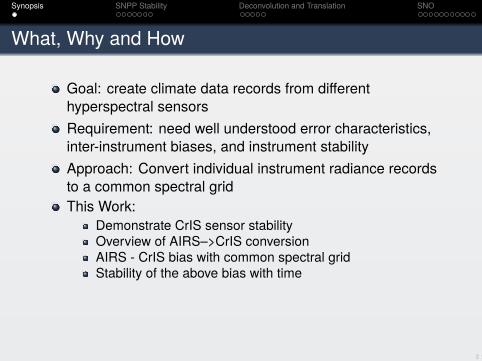
Goal: create climate data records from differenthyperspectral sensorsRequirement: need well understood error characteristics,inter-instrument biases, and instrument stabilityApproach: Convert individual instrument radiance recordsto a common spectral gridThis Work:
Demonstrate CrIS sensor stabilityOverview of AIRS–>CrIS conversionAIRS - CrIS bias with common spectral gridStability of the above bias with time
3
Synopsis SNPP Stability Deconvolution and Translation SNO
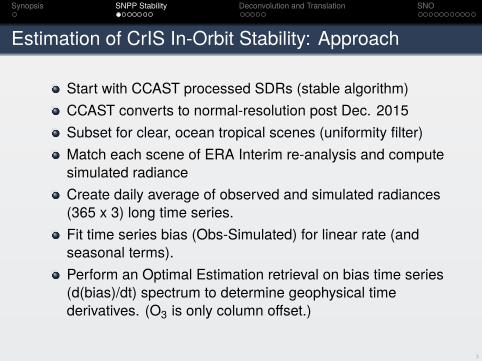
Estimation of CrIS In-Orbit Stability: Approach
Start with CCAST processed SDRs (stable algorithm)CCAST converts to normal-resolution post Dec. 2015Subset for clear, ocean tropical scenes (uniformity filter)Match each scene of ERA Interim re-analysis and computesimulated radianceCreate daily average of observed and simulated radiances(365 x 3) long time series.Fit time series bias (Obs-Simulated) for linear rate (andseasonal terms).Perform an Optimal Estimation retrieval on bias time series(d(bias)/dt) spectrum to determine geophysical timederivatives. (O3 is only column offset.)
4
Synopsis SNPP Stability Deconvolution and Translation SNO
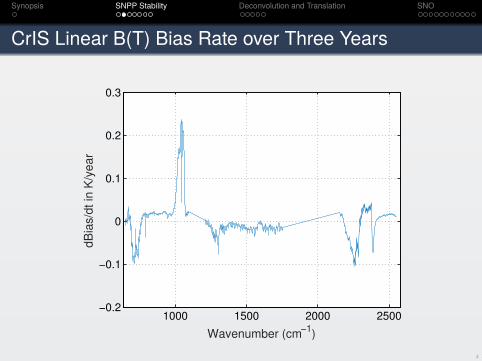
CrIS Linear B(T) Bias Rate over Three Years
1000 1500 2000 2500−0.2
−0.1
0
0.1
0.2
0.3
Wavenumber (cm−1
)
dB
ias/d
t in
K/y
ear
5
Synopsis SNPP Stability Deconvolution and Translation SNO
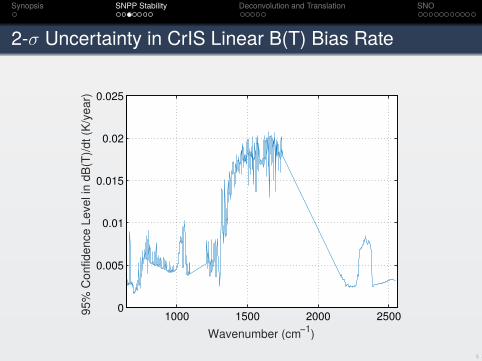
2-σ Uncertainty in CrIS Linear B(T) Bias Rate
1000 1500 2000 25000
0.005
0.01
0.015
0.02
0.025
Wavenumber (cm−1
)
95%
Confidence L
evel in
dB
(T)/
dt (K
/year)
6
Synopsis SNPP Stability Deconvolution and Translation SNO
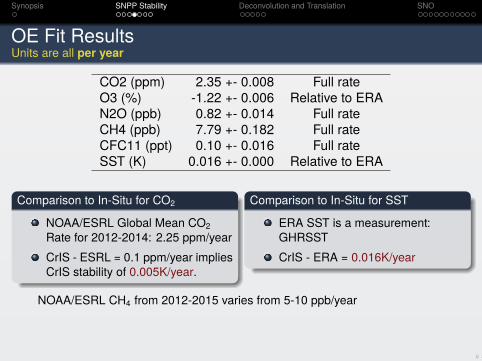
OE Fit ResultsUnits are all per year
CO2 (ppm) 2.35 +- 0.008 Full rateO3 (%) -1.22 +- 0.006 Relative to ERAN2O (ppb) 0.82 +- 0.014 Full rateCH4 (ppb) 7.79 +- 0.182 Full rateCFC11 (ppt) 0.10 +- 0.016 Full rateSST (K) 0.016 +- 0.000 Relative to ERA
Comparison to In-Situ for CO2
NOAA/ESRL Global Mean CO2Rate for 2012-2014: 2.25 ppm/yearCrIS - ESRL = 0.1 ppm/year impliesCrIS stability of 0.005K/year.
Comparison to In-Situ for SST
ERA SST is a measurement:GHRSSTCrIS - ERA = 0.016K/year
NOAA/ESRL CH4 from 2012-2015 varies from 5-10 ppb/year
7
Synopsis SNPP Stability Deconvolution and Translation SNO
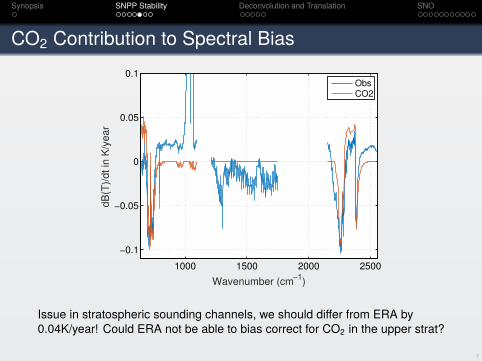
CO2 Contribution to Spectral Bias
1000 1500 2000 2500
−0.1
−0.05
0
0.05
0.1
Wavenumber (cm−1
)
dB
(T)/
dt in
K/y
ear
ObsCO2
Issue in stratospheric sounding channels, we should differ from ERA by0.04K/year! Could ERA not be able to bias correct for CO2 in the upper strat?
8
Synopsis SNPP Stability Deconvolution and Translation SNO
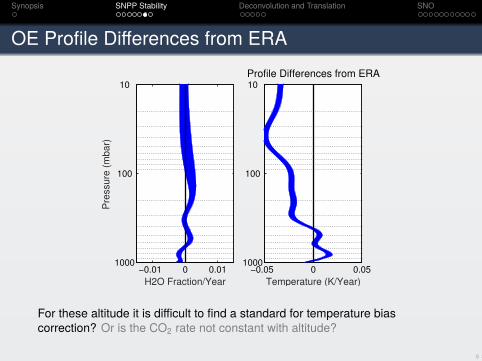
OE Profile Differences from ERA
−0.01 0 0.01
10
100
1000
H2O Fraction/Year
Pre
ssu
re (
mb
ar)
−0.05 0 0.05
10
100
1000
Temperature (K/Year)
Profile Differences from ERA
For these altitude it is difficult to find a standard for temperature biascorrection? Or is the CO2 rate not constant with altitude?
9
Synopsis SNPP Stability Deconvolution and Translation SNO
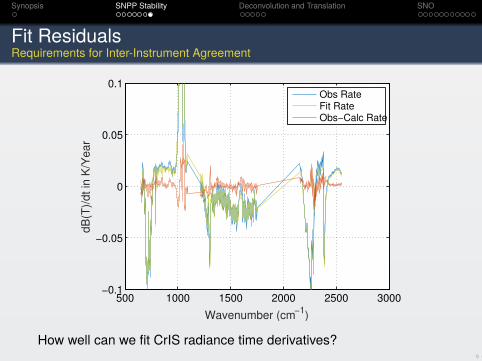
Fit ResidualsRequirements for Inter-Instrument Agreement
500 1000 1500 2000 2500 3000−0.1
−0.05
0
0.05
0.1
Wavenumber (cm−1
)
dB
(T)/
dt
in K
/Ye
ar
Obs RateFit RateObs−Calc Rate
How well can we fit CrIS radiance time derivatives?
10
Synopsis SNPP Stability Deconvolution and Translation SNO
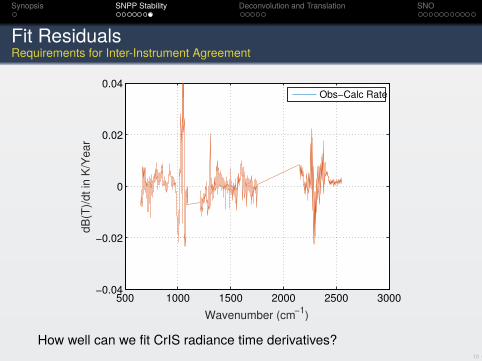
Fit ResidualsRequirements for Inter-Instrument Agreement
500 1000 1500 2000 2500 3000−0.04
−0.02
0
0.02
0.04
Wavenumber (cm−1
)
dB
(T)/
dt
in K
/Ye
ar
Obs−Calc Rate
How well can we fit CrIS radiance time derivatives?
11
Synopsis SNPP Stability Deconvolution and Translation SNO
AIRS–>CrIS SRF Conversion: Basis of MethodObjectives
To create a common radiance climate record for differentsensors.To aid comparison and bias estimates between differentsensors.In this case use the CrIS standard resolution as thecommon and convert the measured AIRS and IASI signalto CrIS, but in principle to any other.Method developed by Howard Motteler
Source code for deconvolutions:https://github.com/strow/airs/deconv.git
https://github.com/strow/iasi/decon.git
12
Synopsis SNPP Stability Deconvolution and Translation SNO
Basis of MethodBackground
Use the AIRS SRFs from TVAC to deconvolve themeasured spectral radiance to a finer user grid (0.1 cm−1)is optimum.Reconvolve to the common sensor spectral response(CrIS).Works best for continuous spectral band with uniformresponse and sensors with parameterized ILS.AIRS conversion uses L1C which fills gaps and repairs badchannels.Method validated using TOA radiance calculated for 49atmospheric profiles that cover wide dynamic range.TOA calculated using kcarta LBL at native 0.0025 cm−1
resolution.
13
Synopsis SNPP Stability Deconvolution and Translation SNO
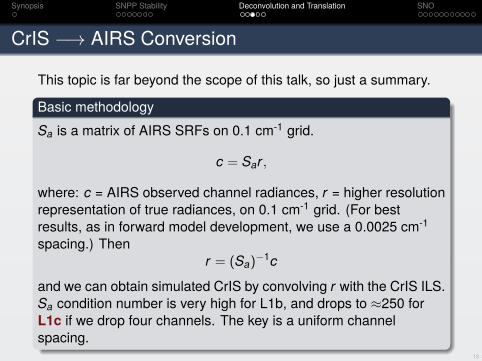
CrIS −→ AIRS Conversion
This topic is far beyond the scope of this talk, so just a summary.
Basic methodologySa is a matrix of AIRS SRFs on 0.1 cm-1 grid.
c = Sar,
where: c = AIRS observed channel radiances, r = higher resolutionrepresentation of true radiances, on 0.1 cm-1 grid. (For bestresults, as in forward model development, we use a 0.0025 cm-1
spacing.) Thenr = (Sa)
−1c
and we can obtain simulated CrIS by convolving r with the CrIS ILS.Sa condition number is very high for L1b, and drops to ≈250 forL1c if we drop four channels. The key is a uniform channelspacing.
14
Synopsis SNPP Stability Deconvolution and Translation SNO
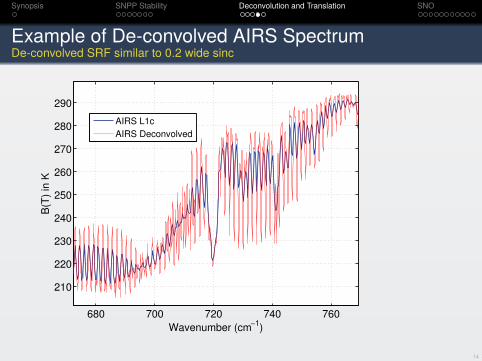
Example of De-convolved AIRS SpectrumDe-convolved SRF similar to 0.2 wide sinc
680 700 720 740 760
210
220
230
240
250
260
270
280
290
Wavenumber (cm−1
)
B(T
) in
K
AIRS L1c
AIRS Deconvolved
15
Synopsis SNPP Stability Deconvolution and Translation SNO
Basis of MethodIASI to CrIS
IASI to CrIS is an easy translation because IASI spans the CrISbands and has a nominal (though strongly apodized) higherresolution. The main steps, for each CrIS band, are
apply a bandpass filter to the IASI channel radiances torestrict them to a single CrIS band with a rolloff outside theCrIS user gridtake the filtered radiances to an interferogram with aninverse Fourier transformapply the pointwise inverse of the IASI Gaussian over theIASI 1 cm opd and truncate this to the 0.8 cm CrIS opd.take the interferogram back to radiance at the CrIS 0.625wn channel spacing with a forward Fourier transform
16
Synopsis SNPP Stability Deconvolution and Translation SNO
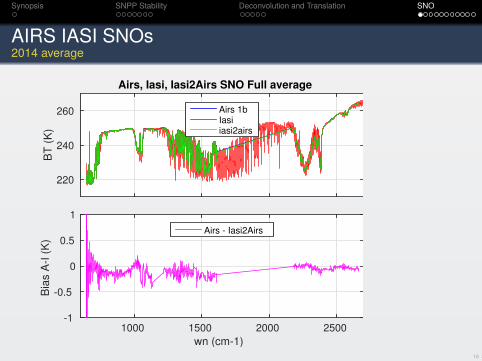
AIRS IASI SNOs2014 average
BT
(K
)
220
240
260
Airs, Iasi, Iasi2Airs SNO Full average
Airs 1bIasiiasi2airs
wn (cm-1)
1000 1500 2000 2500
Bia
s A
-I (
K)
-1
-0.5
0
0.5
1
Airs - Iasi2Airs
17
Synopsis SNPP Stability Deconvolution and Translation SNO
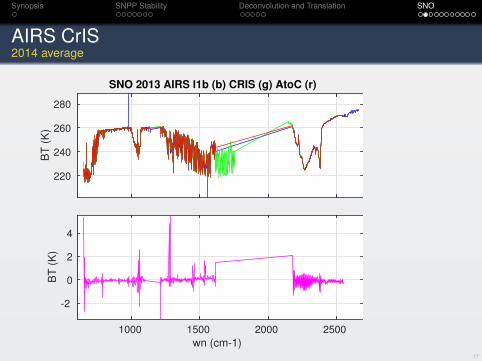
AIRS CrIS2014 average
BT
(K
)
220
240
260
280
SNO 2013 AIRS l1b (b) CRIS (g) AtoC (r)
wn (cm-1)
1000 1500 2000 2500
BT
(K
)
-2
0
2
4
18
Synopsis SNPP Stability Deconvolution and Translation SNO
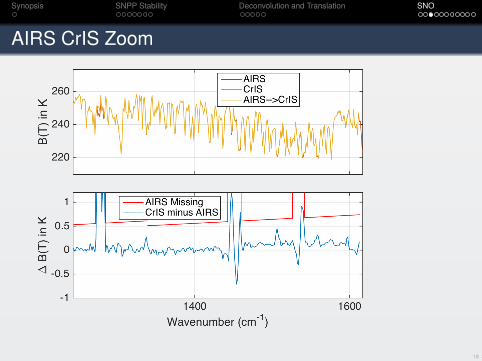
AIRS CrIS Zoom
19
Synopsis SNPP Stability Deconvolution and Translation SNO
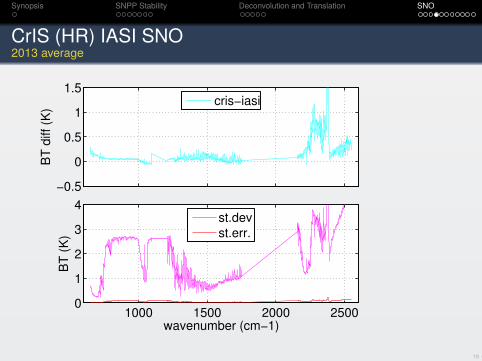
CrIS (HR) IASI SNO2013 average
−0.5
0
0.5
1
1.5
BT
diff
(K)
cris−iasi
1000 1500 2000 25000
1
2
3
4
wavenumber (cm−1)
BT
(K
)
st.dev
st.err.
20
Synopsis SNPP Stability Deconvolution and Translation SNO
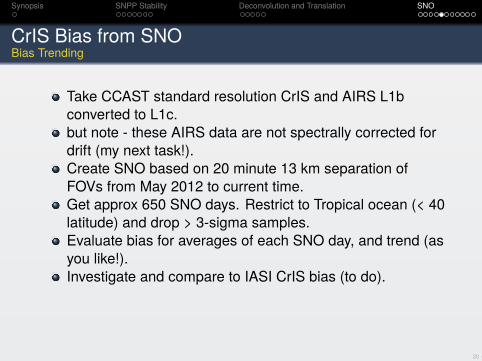
CrIS Bias from SNOBias Trending
Take CCAST standard resolution CrIS and AIRS L1bconverted to L1c.but note - these AIRS data are not spectrally corrected fordrift (my next task!).Create SNO based on 20 minute 13 km separation ofFOVs from May 2012 to current time.Get approx 650 SNO days. Restrict to Tropical ocean (< 40latitude) and drop > 3-sigma samples.Evaluate bias for averages of each SNO day, and trend (asyou like!).Investigate and compare to IASI CrIS bias (to do).
21
Synopsis SNPP Stability Deconvolution and Translation SNO
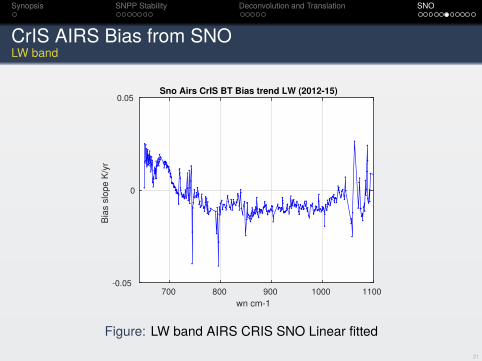
CrIS AIRS Bias from SNOLW band
wn cm-1
700 800 900 1000 1100
Bia
s s
lop
e K
/yr
-0.05
0
0.05Sno Airs CrIS BT Bias trend LW (2012-15)
Figure: LW band AIRS CRIS SNO Linear fitted
22
Synopsis SNPP Stability Deconvolution and Translation SNO
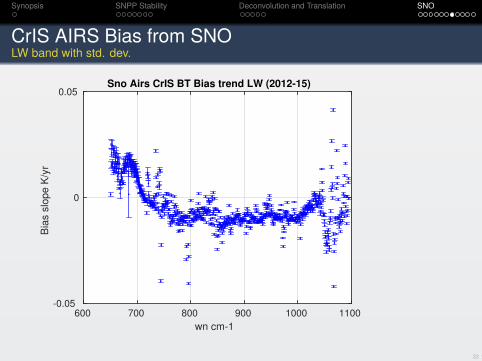
CrIS AIRS Bias from SNOLW band with std. dev.
wn cm-1
600 700 800 900 1000 1100
Bia
s s
lop
e K
/yr
-0.05
0
0.05Sno Airs CrIS BT Bias trend LW (2012-15)
23
Synopsis SNPP Stability Deconvolution and Translation SNO
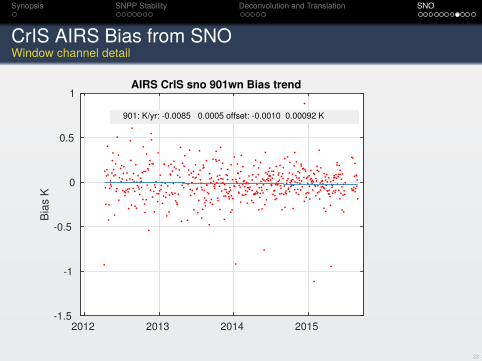
CrIS AIRS Bias from SNOWindow channel detail
2012 2013 2014 2015
Bia
s K
-1.5
-1
-0.5
0
0.5
1AIRS CrIS sno 901wn Bias trend
901: slope: -2.32e-05 1.24e-06 offset: -0.0010 0.00092
901: slope: -8.46e-03 4.53e-04 offset: -0.0010 0.00092
901: slope: -0.0085 0.0005 offset: -0.0010 0.00092
901: K/yr: -0.0085 0.0005 offset: -0.0010 0.00092
901: K/yr: -0.0085 0.0005 offset: -0.0010 0.00092 K
24
Synopsis SNPP Stability Deconvolution and Translation SNO
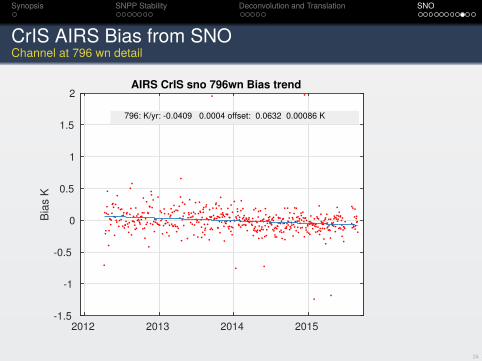
CrIS AIRS Bias from SNOChannel at 796 wn detail
2012 2013 2014 2015
Bia
s K
-1.5
-1
-0.5
0
0.5
1
1.5
2AIRS CrIS sno 796wn Bias trend
796: K/yr: -0.0409 0.0004 offset: 0.0632 0.00086 K
25
Synopsis SNPP Stability Deconvolution and Translation SNO
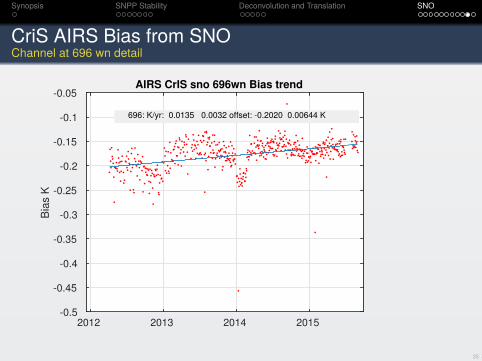
CriS AIRS Bias from SNOChannel at 696 wn detail
2012 2013 2014 2015
Bia
s K
-0.5
-0.45
-0.4
-0.35
-0.3
-0.25
-0.2
-0.15
-0.1
-0.05AIRS CrIS sno 696wn Bias trend
696: K/yr: 0.0135 0.0032 offset: -0.2020 0.00644 K
26
Synopsis SNPP Stability Deconvolution and Translation SNO
Conclusions and Future Work
Comparison with CO2 growth rates indicates CrIS is stableto about 5 mK/year.Comparison with SST linear rate indicates CrIS is stable to16 mK/year (includes cloud leakage).Premature to conclude comparison with AIRS and CrIS,worst case from this work suggests they are within 9mK/year of each other (LW window region).Apply frequency correction to AIRS and repeat. Comparewith IASI.Evaluate uncertainty of method (SNO method alonedoesnot tell who is nearer the truth, but is guide to stability).Evaluate optimum method to null out the bias of (merge)the two radiance records.