Embed Size (px)
Citation preview

1
Public Safety - Crime Mapping and Spatial Analysis Using ArcGIS Online for Police Officers 10/16/2015
I. Knowledge, Skills, and Abilities (KSAs) Supported
This training module aids in the development of several KSAs that are fundamental to using GIS in support of public safety planning and operations. The ability to perform a specific crime mapping using ArcGIS Online is a foundation-level skill and ability that is relevant to a multitude of GIS applications. In addition, the following training tutorial builds the essential knowledge of how to design and use crime data for web mapping.
Knowledge Gained:
Definition of Crime Mapping: Crime mapping is a sub-discipline of geography that works to answer the question, “What crime is happening where?” It focuses on mapping incidents, identifying hot spots where the most crime occurs and analyzing the spatial relationships of targets and these hot spots.
Definition of Hot Spot Analysis: The main reason for using this technique (also known as Heat Map Analysis) is because it is used to visualize geographic data in order to show areas where a higher density or cluster of activity occurs. For both types of spatial analysis, a color gradient is used to indicate areas of increasingly higher density. See the following example from Jersey City:

2
Esri has selected HERE Map Content (www.esri.com/here) as the foundation street
data for its cloud-based mapping platform as well as for StreetMap Premium and
numerous other Esri products.
Esri uses HERE map content and HERE point addressing to build the geocoding
locators used in both ArcGIS Online (AGOL) and StreetMap Premium (SMP).
Skills and Abilities Developed:
Ability to develop a table with the essential spatial data for crime mapping and how to adjust the address format to be recognized in ArcGIS Online platform.
How to add an attribute field and how to populate it in the data table of the crime incident feature service layer.
How to download and add a correct symbology templates for crime mapping through ArcGIS Server and Change Style tool.
How to overlay features and layers from Esri Web Layers (Adding Broward County boundary) in the map content while maintaining visibility of the current layers created. This includes demonstrating how to find other web map layers and how to add them to ArcGIS Online
Conducting hotspot analysis to better determine crime incident concentration and geographical distribution of burglaries.
How to set a time line showing the data through several days of the analysis.
Designing a web application for showing the analysis result.
II. Scenario and Data
This tutorial provides the following scenarios:
Mapping the crime incident report data from November 2014 in Broward County, Florida. Processing the data in terms of standardization the type of crimes according to the National Incident –Based Reporting System (NIBRS) and Uniform Crime Reporting (UCR).
Performing a Hot Spot Analysis to defined what areas illustrate more signs of risk and how to develop the following strategies:
-Short Term protocol for taking action in situations that are currently taking place.
-Long Term protocol for taking action in ongoing issues. Its focus is often on identifying areas with high crime rates and problem solving ways to decrease the overall crime rates.
-Administrative Analysis. This type of analysis looks at the administration and deployment of police and resources and asks the questions, “Are there enough police officers at the right time and place? There should be more police departments in the areas with high level of risk and high crime rates?

3
Additionally Information about obtaining and managing the data for creating and representing features in ArcGIS Online.
First at all, the main component of this tutorial is to explain where to find crime data and how to manipulate the data to be acceptable in ArcGIS Online for educational purposes.
In this case, it is essential to find crime data for our analysis (Burglary and Burglary Conveyance) in free sources on the Internet. For our tutorial, the crime data has been selected from http://www.crimemapping.com/ due to it is easy to visualize and fast to download in an Excel Spreadsheet. The street data was the Streets Basemap in ArcGIS Online which is primarily HERE Map Content. The Broward County boundary layer came from ArcGIS Online.
In the application crime mapping, we have selected Broward County, FL, in the browser and we delimited the specific period of time (November 2014).
In terms of selecting the appropriate number of registers, it is fundamental to zoom to the entire map extent of Broward County so all the crimes are properly selected on the map and then choose detailed report option. For our analysis we obtained 507 records. (It is important to note that over 3,000 records indicating crime incidents in Broward County in November 2014 were selected but the number was reduced to only 507 records for burglary type incidents to facilitate the analysis.)
Furthermore, we deleted the crime incident case number in order to protect the anonymity of those arrested. However, we classified our type of crimes according to the National Incident–Based Reporting System (NIBRS) and Uniform Crime Reporting (UCR) of Florida Department for Law Enforcement.
In addition we have developed the address geocoding according to the US Standard Address for digitizing the streets according to their name, type and number so they can be recognized by ArcGIS Online.
At the same time, we have separated the date and time field into different fields (they were originally in the same field) in order to set up a time line showing our data through a specific period of time.
Finally, when the crime data base was homogenized, we converted the Excel file (.xls) into Comma Separated Values (.csv) in order to display the information correctly in ArcGIS Online, furthermore if this process hasn´t been executed, ArcGIS Online will not be able to read our data properly.
Additional data processing included removing the text “BLOCK” for the Location or address field as the addresses would not geocode otherwise.

4
III. Exercise Overview Introduction: This is a stand-alone tutorial, however it builds upon the knowledge acquired in the previous two tutorials. This tutorial will continue to use Broward County data as the previous educational materials. Scenario: Mapping crime incident data from November 2104 Broward County, FL – A section explaining how the data was collected and “massaged” to make it more manageable for the educational purposes of this tutorial including removing case #s, only using burglaries (to limit number of geocodes) and separating date/time into two separate fields. Main Steps:
1. Setting an ArcGIS Online basemap for use in this tutorial
2. Adding crime incident data (burglaries) to the ArcGIS Online map canvas – Adding
this data as a feature service so we could add attribute data later
3. Symbology – Finding and adding a predefined set of symbols for public safety and
applying these symbols to burglary data
4. Adding Broward County boundary data
5. Conducting hotspot analysis to better determine crime incident concentration
and geographical distribution of burglaries
6. Learning about time lines and adding a time line widget to ArcGIS Online
7. Adding attribute data to the crime incident feature service layer
I. Explanation about using NIBRS and UCR Codes for representing our features in Crime
Mapping through ArcGIS Online
[Feel free to skip this section and go directly to Step 1 if you are familiar with the crime terminology] Source: http://www.fdle.state.fl.us/Content/getdoc/7fad02e4-96bd-46d9-82fc-4a5c46f0be22/datahistory_ucrmanual-1-.aspx
-Historical Background
In 1971, the Florida Legislature established Section 923.089, F.S., mandating the responsibility and authority for Uniform Crime Reports data collection and dissemination to the Florida Department of Law Enforcement (FDLE). This statute has been revised four times since its creation and the program has undergone many changes. As a result of amendments to Florida Statute Section 943.05 in 1995, the FDLE redesigned the Uniform Crime Reports Program.
The new program is a more focused statistical summary reporting system rather than one containing information on individual offenses. The new reporting system became effective January 1, 1996. The goal is to re-focus the UCR program to its original purpose: to provide a barometer of the crime conditions within a geographic jurisdiction. FDLE’s goal is to collect the required data with as little impact upon the participating agencies as possible.
-Purpose and Objectives

5
The quantitative statistical data derived from the UCR Program provides assistance in determining the overall scope of the reported criminal activity in Florida and aids in making effective management studies possible. The fundamental objectives of the Florida UCR Program are to:
1. Collect from all law enforcement agencies in the state accurate summary crime data that meet the minimum requirements of the National Uniform Crime Reports (UCR) Program.
2. Maintain agency crime statistics in a statewide database and provide a barometer of the number of index crimes that occur, determine crime and clearance rates, and ascertain how often crime occurs.
3. Publish Semiannual and annual reports to inform the Commissioner, Governor, Legislature, other government officials, and the public of the types, magnitude, and trends of crimes in Florida.
4. Collect from the UCR Program contributors to the number of offenses known to them in the following categories: murder, manslaughter, forcible sex, robbery, aggravated assault, burglary, larceny, motor vehicle theft, arson and simple assault. The UCR Program also collects data on domestic violence offenses, property stolen and recovered, motor vehicle recovery information and arrest information. Additional offense information concerning homicide circumstances and those in which an officer is killed or assaulted, is collected through supplemental reports.
Burglary
The unlawful entry into a building or other structure with the intent to commit a felony or theft.
-General Rule
Report as one offense any unlawful entry or attempted forcible entry to any dwelling, house, attached structure, public building, shop, office, factory, storehouse, apartment, house trailer, warehouse, mill, barn, other building, ship or railroad car.
For UCR purposes, if there is apparent unlawful entry and the offender has not completed an act or the actions or intent of the offender are unknown, it should be reported as a Burglary. As a general rule, any time there is an uncertainty as to why entry was made to a structure; it should be reported as a Burglary for UCR purposes.
A structure for UCR purposes is defined as a permanently affixed building, which has four walls and a roof and is capable of being closed.
The unlawful entry of a tent, camping trailer, mobile home on a sales lot, etc., should be classified as a Larceny.
This would also apply with a house under construction that is not capable of being closed.
When determining if a theft from a hotel room should be reported as a burglary or a larceny, the investigating officer’s findings are an important part of correctly classifying this offense.

6
If the officer believes that a hotel employee who had legal access to the room was involved, it can be classified as a larceny.
If a hotel employee does not appear to be involved, it can be classified as a burglary.
If the actions or intent of the offender are unknown, it should be reported as a Burglary.
-Force Categories
Forcible Entry
It counts, in this column, all burglaries where force of any kind is used to unlawfully enter a locked structure, as defined in the general rule, with intent to steal or commit a felony.
This includes entry by use of a master key, celluloid, or other device that leaves no outward mark but is used to open a lock.
Concealment inside a building followed by the breaking out of the structure should be counted in this column. The following scenarios illustrate incidents known to law enforcement classified as Burglary–Forcible Entry:
1. A liquor store was broken into on a holiday when the store was closed. The next day, the manager found alcoholic beverages and money were missing and called the police.
2. A burglar used a key to enter four units in a condominium complex and stole numerous articles from each residence.
3. A man hid in a theater. After it closed, he stole money from the cash register and left the premises during the night.
Unlawful Entry
It counts in this column, all burglaries in which no force is used but unlawful entry into a structure to steal or commit a felony has occurred.
This includes incidents where the offender made access through an unlocked door or where no evidence of forcible entry was discovered.
The following scenarios illustrate incidents known to law enforcement classified as Burglary–Unlawful Entry:
1. While a woman was in the backyard hanging clothes, a 14-year-old boy entered her house through the unlocked front door and took her purse. When the woman realized her purse was missing, she called the police.
2. A woman posing as a maintenance employee entered an unlocked office and stole a wallet from a cabinet.
3. During the night, someone stole a $24,000 car out of an unlocked, but closed, private garage. Two days later, police found the car abandoned in a nearby town.

7
Attempted Forcible Entry
It counts in this column, all offenses for which the investigation determines that forcible entry into a dwelling has been attempted, but not completed.
Any time force of a physical nature has been used in order to gain entrance to a premise, the attempted burglary should be reported and the number of premises in which forcible entry was attempted should be counted.
The following scenario illustrates an incident known to law enforcement classified as Burglary–Attempted Forcible Entry:
1. Police investigation verified an attempted break-in at the local bank. There were no suspects in the incident.
Location Categories
Residence- A dwelling used as a home, including an apartment, condominium, or a house. If the dwelling is unoccupied, it is still considered a dwelling.
Non-Residence - A place used for other than dwelling purposes, for example, an office, warehouse, industrial building, store, etc.
Time of Day
Day -In this column, count all Burglaries that occur approximately one-half hour before sunrise to one-half hour after sunset.
Night - In this column, count all Burglaries that occur approximately one-half hour after sunset to one-half hour before sunrise.
Unknown - In this column, count all Burglaries for which it is not known whether the offense took place during the night or day.
Burglary vs. Larceny
Regardless of whether the structure is attached to a house or it is a separate building; any structure must have four walls, a roof, and be capable of being closed to be classified as a burglary. Some examples are:
Porches – Porches that have a minimal amount of screen and meet the qualifications for a structure should be reported as a burglary.
Carports – Any thefts from a carport should be reported as a larceny.
Pool Enclosures – Pool enclosures that are made up of a majority of screen should be counted as a larceny. As with porches, if the walls are solid, have a minimal amount of screening and a roof overhead, this would be considered a burglary.

8
Burglary to a conveyance – There should be no reports of burglary to a conveyance (motor vehicle). These are not burglaries and should be reported as Larceny, Theft from a Motor Vehicle.

9
IV. Exercise Steps Step 1: Sign In to AGOL Go to http://napsg.maps.arcgis.com/home/ and click on Sign In
Enter your organization’s credentials (or the credential provided to you by NAPSG). Username: XXXXXX Password: XXXXXX
Then click on Sign In. It should look like this after you sign-in:

10
Step 2: Activate the ArcGIS Online (AGOL) Map Canvas Click on the MAP tab to activate the AGOL map canvas.
The map will look like this after completing Steps 1 through 2:
11
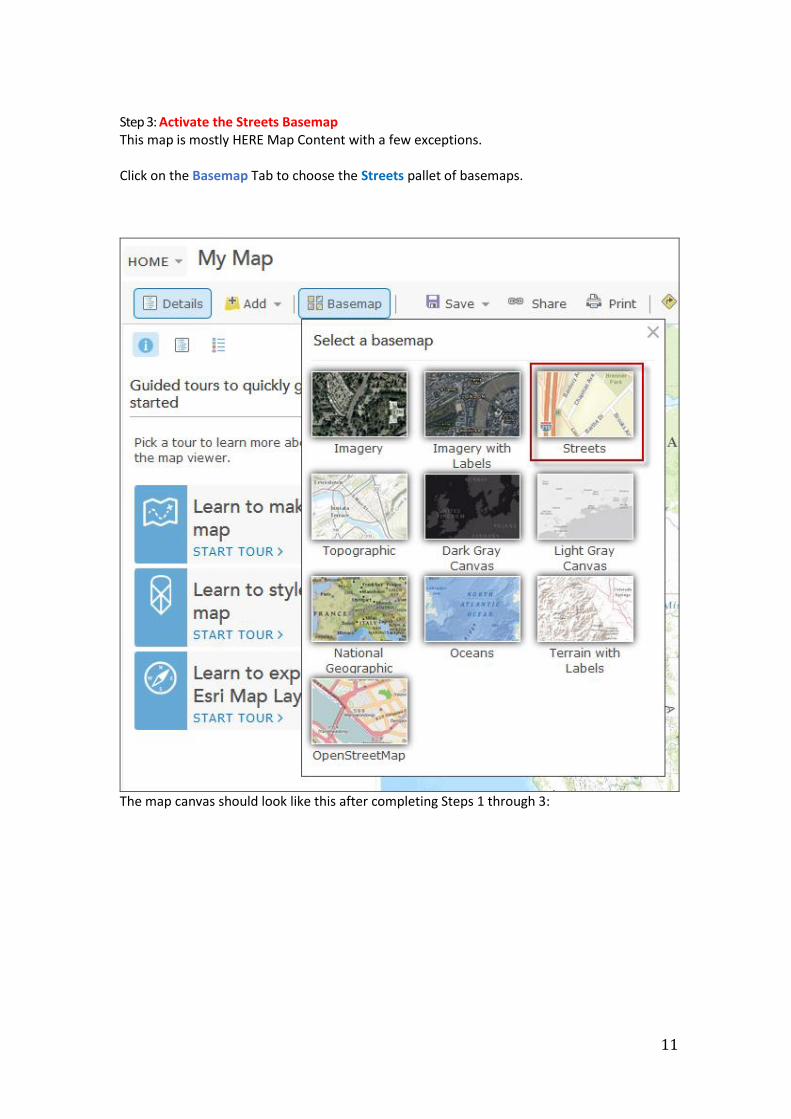
Step 3: Activate the Streets Basemap This map is mostly HERE Map Content with a few exceptions. Click on the Basemap Tab to choose the Streets pallet of basemaps.
The map canvas should look like this after completing Steps 1 through 3:

12

13
Step 4: Adding Broward County Crime Data (burglaries) to AGOL and adding this data as a Feature Service so we can add attribute data later. In this step we will add the crime incident data from November 2104 Broward County, FL. This data originally came from Broward County’s website at http://www.crimemapping.com/map.aspx?aid=ddc37d71-f6d0-4cb4-989c-3e8f6764444e Which allows you interactively to select an area of interest and “save” to an Excel spreadsheet. We selected an area roughly the equivalent of Broward County, FL and save the records on a spreadsheet. However we had to “massage” the data as the data included more information that was needed for the purposed of this exercise. For example:
- We removing case #s - We had to separate date and time (of crime incident) into two separate fields for
further use in this tutorial. - The crime incident data also had to be “cleaned up” from duplicates, addressing
coding as well as filed naming issues
Furthermore, it became clear early on that we had too much data. This is not usually a problem, however for educational purposes and to limit the cost of ArcGIS Online geocoding, we decided to limit the number of crime incident data and their type that we were going to use in this GIS tutorial. As a result, we decided to limit the use of number of crime incidents to just burglary type incident crime data which appear to be well distributed around the county (key for spatial analysis using ArcGIS Online) and a nice and manageable sample size of 505 crime incidents was assembled down from several thousands of incidents.
On your Police Tutorial Training folder you’ll find a .cvs file called “All Areas in Broward County Burglary Only.csv” If you open the file, it will look like this:
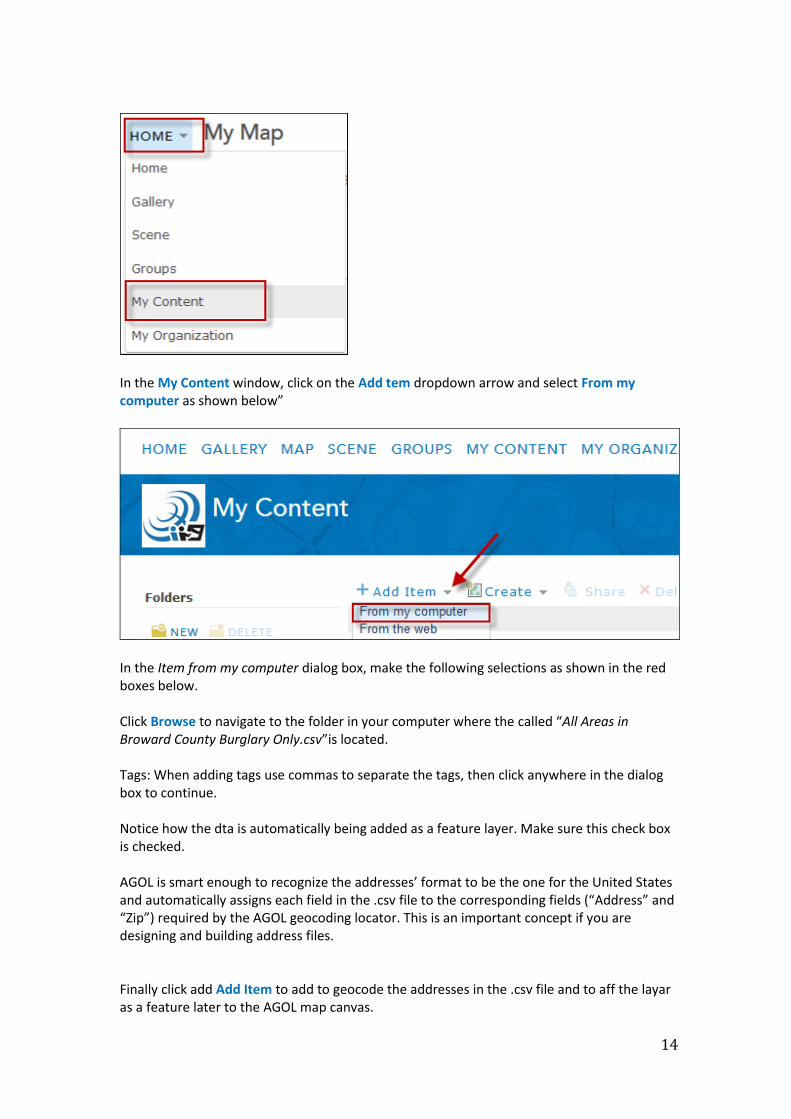
Step 5: Add .csv file into AGOL as a Feature Service so we can add attribute data later. Close the .csv file and add it the AGOL canvas: In the Table of Contents, select My Content by selecting it from the Home downward arrow.
14
In the My Content window, click on the Add tem dropdown arrow and select From my computer as shown below”
In the Item from my computer dialog box, make the following selections as shown in the red boxes below. Click Browse to navigate to the folder in your computer where the called “All Areas in Broward County Burglary Only.csv”is located. Tags: When adding tags use commas to separate the tags, then click anywhere in the dialog box to continue. Notice how the dta is automatically being added as a feature layer. Make sure this check box is checked. AGOL is smart enough to recognize the addresses’ format to be the one for the United States and automatically assigns each field in the .csv file to the corresponding fields (“Address” and “Zip”) required by the AGOL geocoding locator. This is an important concept if you are designing and building address files. Finally click add Add Item to add to geocode the addresses in the .csv file and to aff the layar as a feature later to the AGOL map canvas.

15
You will see AGOL processing this information and when compleed geocoding the addresses the screen will look like this. Click add No to review the addresses.

16
AGOL successfully geocoded these 505 addresses (representing burglary crime incidents) at once. Select Add layer to map from the Open to downward arrow as shown below:
All the addresses are in Broward County, FL. The map canvas should look like this after step 5 as the latest version of AGOL recognizes the type of data being added and it applies “smart mapping” which we will modify later:

17
Step 6: Finding and adding a predefined set of symbols for public safety and applying these symbols to burglary data In order to set the correct symbology for mapping the burglary data in Broward County, Florida, it is essential to follow these steps: In order to set the correct symbology for mapping the burglary data in Broward County, Florida, it is essential to follow these steps: Click on the Broward County Burglary layer’s dropdown arrow and then select the Change Style Option

18
The Change Style Principal menu will pop up.
From the pull down the menu select Description from the first option, then select the Choose and attribute to show option
The unique point symbols will automatically show the three different categories of our data, in this case, BURGLARY CONVEYANCE, BURGLARY and BURGLARY BUSINESS.
Now we need to change the point symbols into symbols that represent the field of our data correctly.
In the Select a drawing Style menu option choose types (unique symbols) and then click on the OPTIONS menu

19
The principal menu will pop up showing the DESCRIPTION, TRANSPARENCY and VISIBLE RANGE tabs.
Next, you need click in the predetermined point symbol in order to change it for a burglar mask figure by selecting in the SHAPE menu and pulling down the menu to Safety Health symbology.

20
In terms of choosing the right symbol for mapping the different robbery categories in Broward County, Florida. You need to select the burglar mask from the Safety Health menu.
For the Burglar Conveyance category, the yellow burglar mask is the most convenient since we want to distinguish the symbol from other features that shown in the map.
In addition, in order to improve the visualization of the symbol in the map, it is important to select the appropriate symbol size. You can change the size either by changing the number manually or moving the size bar. In this case, it is better to choose a 20 point size.

21
Repeat the last step for the other burglar categories.
You need to select the black burglar mask for the BURGLAR category and the white mask for the Business Burglary and keep the same 20 point size for both of them.
On the other hand, the Transparency menu offers the option to change the transparency of our symbols when showing them in the map.
We will leave the default option of the menu (0% of transparency), since we don´t want to show less transparency in our symbols.
Additionally, the Visible Range option offers the possibility to show our data according to different scales, from the World- Continent-Countries-Country-States-State-Counties-County-Metropolitan area-Cities-City-Town-Neighborhood-Streets-Buildings to Building.
In this case we will also leave the default option of the menu, World Scale.
After changing the symbols, color and size of the three burglary categories, you just need to

22
click on OK and then DONE.
This is the final result of how the map has to represent our data properly for the purposes of this exericse.
A close up will look like this:

23
Step 6: Adding Broward County Boundary Data In order to limit our burglary data is important to establish the boundaries of the Broward County in Florida. The following steps show how to find and set the boundaries from the Esri Map Layers for our map as shown below: Click Add and select Browse Esri Map Layers.
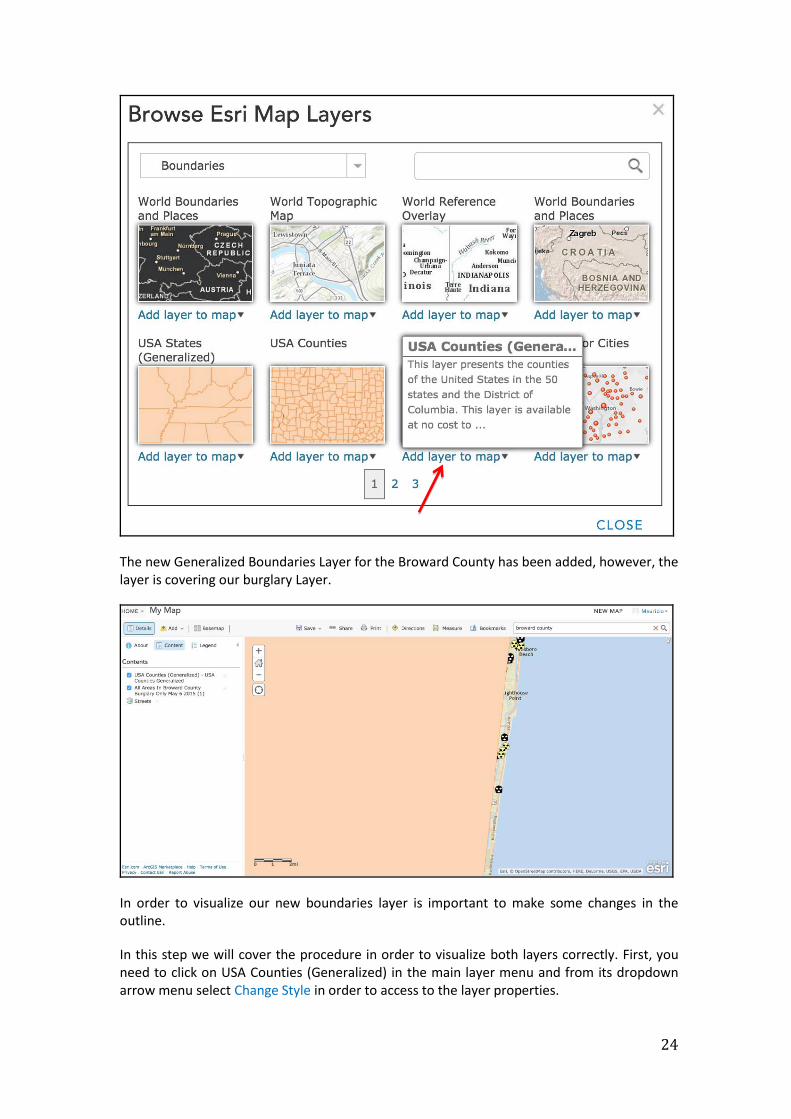
From the Browse Esri Map Layers menu scroll down and selct select Boundaries as follows:
After selecting the Boundaries from the menu, you need to select USA Counties (Generalized) Layer and finally click on Add layer to map in order to add the new counties boundary in the map.
24
The new Generalized Boundaries Layer for the Broward County has been added, however, the layer is covering our burglary Layer.
In order to visualize our new boundaries layer is important to make some changes in the outline.
In this step we will cover the procedure in order to visualize both layers correctly. First, you need to click on USA Counties (Generalized) in the main layer menu and from its dropdown arrow menu select Change Style in order to access to the layer properties.

25
In the Change Style menu, make these choices:

26
Then click on Symbols.

27
After clicking on symbols, the properties for changing the outline of the boundaries layer will pop up.
In the properties of the layer, you need to click on FILL to modify its properties and then select the No color.

28
Now click on Outline to modify its properties. Select red color, change the width of the line to 2 points.

29
Accept the transparency and pattern as a default and click on OK, then DONE to apply your changes.
The map canvas should look like this and you should be able to see the Broward County boundaries along with our burglary layer.

30

31
Step 7: Conducting heat map analysis to better determine crime incident concentration and geographical distribution of burglaries As you noticed in Step 6, AGOL automatically tries to display your data using smart mapping as it tries to find the most appropriate way to display your data. Smart mapping works in most case, however, you may want to try to map your data in different ways (AGOL provides many choices) so to get the most benefit from the data display and identify the data distribution display that better fits the message you want your map to portrait. Place your pointer over the Heat Map section in the AGOL table of Contents (TOC): It reads “Show areas of high activity with stronger colors that appear to glow hotter.”
Heat map or hot spot analysis is used to visualize geographic data in order to show areas where a higher density or cluster of activity occurs. For both types of spatial analysis, a color gradient is used to indicate areas of increasingly higher density. It will, in this case, highlight in bright yellow the areas with the heaviest concentrations of burglaries in Broward Count in the period of November 2014. Please note that AGOL chooses to map the crime (burglary) incident data using the UCR (Uniform Crime Reporting methodology for classifying crimes) attribute but you can change that to the NIBRS attribute data, if you like.

32
Now let’s set up the parameters for Heat Map1 analysis. Click Add Layer in the Heat Map section.
AGOL automatically modifies the crime burglary incident data and generates a heat map with the highest concentration of crime incidents:
1 In this exercise, the term ‘’Heat Map Analysis’ is used where maps of density are represented as ‘heat’. This can be a very effective way to visualize the density of data. A true hot spot analysis is a spatial statistics test that indicates areas of statistically significant high and low areas. Both methods have strengths and weaknesses that a crime analyst should become familiar with. For more information on this topic, see “Identifying High Crime Areas” by International Association of Crime Analysts (IACA). Download available: http://iaca.net/Publications/Whitepapers/iacawp_2013_02_high_crime_areas.pdf

33
Accepting the defaults, AGOL shows that the highest number of incidents occurred in the Laudarle Lakes area.
Click Options in the Heat Map section.
The TOC changes to show the different ways you can modicy your heat map analysis:

34
For example, use the slider bar to move the lever to the middle of the crime scale as shown in graphic below and notice how the definition of high crime (burgalry) incident data becomes broader and other areas of Broward county becomes highlighted in yeloow to show “morte areas” of hihg crime incident areas. Also notice the column chart legen changes to reflect the change you made with the slider bar.

35
Feel free to experiment some more with the slider bar to best portray the message you want to convey to your map readers. You can also modify the “Area of Influence” and the “Transparency” of the heat map. See some changes reflected by increasing the area of influence (heat map becomes larger/it covers a greater geographical rea) and the transparency is greater (you can see more details “below” the heat map.) The legend also reflects this changes.

36
Feel free to try out different options. Once you are happy with your messaging click Save to save your work.
Make the following edits:

37
Click Save Map to save your work.
Step 8: Learning about time lines and adding a time line widget to ArcGIS Online Spatial phenomena collected with time information may allow map users to see what happened at a specific time, or what may happen in the future; by animating time-based data you can visualize it at each step and see patterns or trends emerging over time. Examples of phenomena whose data is well suited for this purpose include hurricanes, tornadoes, and other meteorological events; population migrations; land-use and environment change; or wildfire or flood event progression.
Some map layers are time enabled, containing spatial datasets that contain different information for the same location at different times. If a map contains time-enabled layers, it is time-aware and the display can be configured to show the data during a specific period of time, or to animate the data over time. *
* Esri: “ArcGIS Online Help https://doc.arcgis.com/en/arcgis-online/create-maps/configure-time.htm
In our example, we will use the burglary data of Broward County to identify and analyze the different crime categories according to date and time when they occurred.
In addition, according to this analysis, the Police Department could use this application as a tool, which focuses on mapping incidents, identifying hot spots where the most crime occurs and analyzing the spatial relationships of targets and these hot spots.
From the HOME dropdown aroow menu, select My Contnet.
My content principal menu will show up immediately. Next, we need to find our feature which contents the temporal data. In our case, Burglaries in Broward County, Florida.
It is important to mention that this data set has been modified in terms of setting up the time line widget correctly. As mentioned before, the data set contains two different fields with the date and time categories separated.
Lkl;svjva;s
In the My Content menu click on the dropdown arrow menu for All Areas In Broward County Burglary Only feature layer which contain temporal data that allows us to use in an ArcGIS Time Line and click on View Item Details.

38
In the new menu, click on the dropdown arroe menu for our layer and select Time Settings.

39
Under the Time Settings menu, we will have the chance to configure our time line according to the parameters and the data that we want to show conforming to a specific date and a particular time. Make the following choices:
Check the box Enable Time and the in time ranges with a start and end time submenu, select as follows: For the start time field: select Date and for end time field: select Time. This will allow you to show the cumulative data (all the crimes are going to be added from the first day to the last day, obtaining a mass of total crimes by the end of the study period).

40
Note: If you want to show the crimes that happened on a specific date and time, you need to select the Specific events in time option.
Click OK to apply the parameters chosen.
Now Click on OPEN and then select Add layer to the map.
The time line widget will be shown on the bottom of our map frame as shown below:

41
Now let’s configure the time settings parameters:
OClick on the time settings icon
In the Time settings menu you can change the speed of the animation by clicking on the specific Playback Speed in the bar. We will leave the speed as it is shown in the following image (medium-fast) since we don´t want a slow animation for our data because we have only a 30-days period of time and that would cause a long and slow animation for our data.
Now, let’s explore configuring advanced options for the time line widget:
Click on Show Advance options in order to access to the principal menu of the time settings.

42
In this menu, we need to make some modifications in order to display our burglary data and show a smooth animation through the 30 days period of time.
At first, you need to change the Start Time and End Time according to the image below by clicking on the specific date to show our data and a particular time to start and end the animation.
Secondly, in the Time Display section we need to display the data by day per 1-day interval, so we can visualize all the crimes that happened in that particular day in a specific time.
Finally, in the As Time Passes, select only display the data in the current time interval. Makke your choices look like these shown below:

43
Click OK when done to apply our changes.
Click on the play button and as the animation moves forward as per our parameters, you will see the crime data display accordingly.
As a crime analyst, you can us the ArcGIS Online time line to observe and analyze the temporal progression of time and to try to understand why it happens the way it does. Are there patterns from month to month?
When done Click Save to save your work.

44
Step 9: Adding attribute data to the crime incident feature service layer The Broward County Sheriff may want to assign different crime burglary incident data to different officers. By adding the “All Areas in Broward County Burglary Only.csv” as a feature layer to AGOL, you will be able to add fields and attributes to this table. From the Table of Contents, click the back arrow
Until you can see the Table of Contents layers names as shown below:
Notice tha the “All Areas In Broward County Burglary Only” layer has a downward arrow associted with it. Click on this layer downward arrow and select Show Table as shown below:

45
The AGOL map canvas changes to also show the layer’s table:

46
Now that you have the “All Areas In Broward County Burglary Only” layer display on the map canvas, you can add fileds and edits them.
Click on the Table Options downward arrow and select Add field as shown below:
Under (field) Name type Officer and for default Value type Staff.
Finally click on Add New Filed to add this field which is type “string” meaning you can type a text string such an officer’s name.

47
The field is added. To see it, widen the map canvas to make it bigger so that the new filed is shown.
Do notice that the table has 505 records (burglary crime incidents) none are selected now:
Now let’s populate this table by adding an officer’s name to the Lauderdale Lakes area first.
Click on the Table Options downward arrow and select Filter as shown below
48
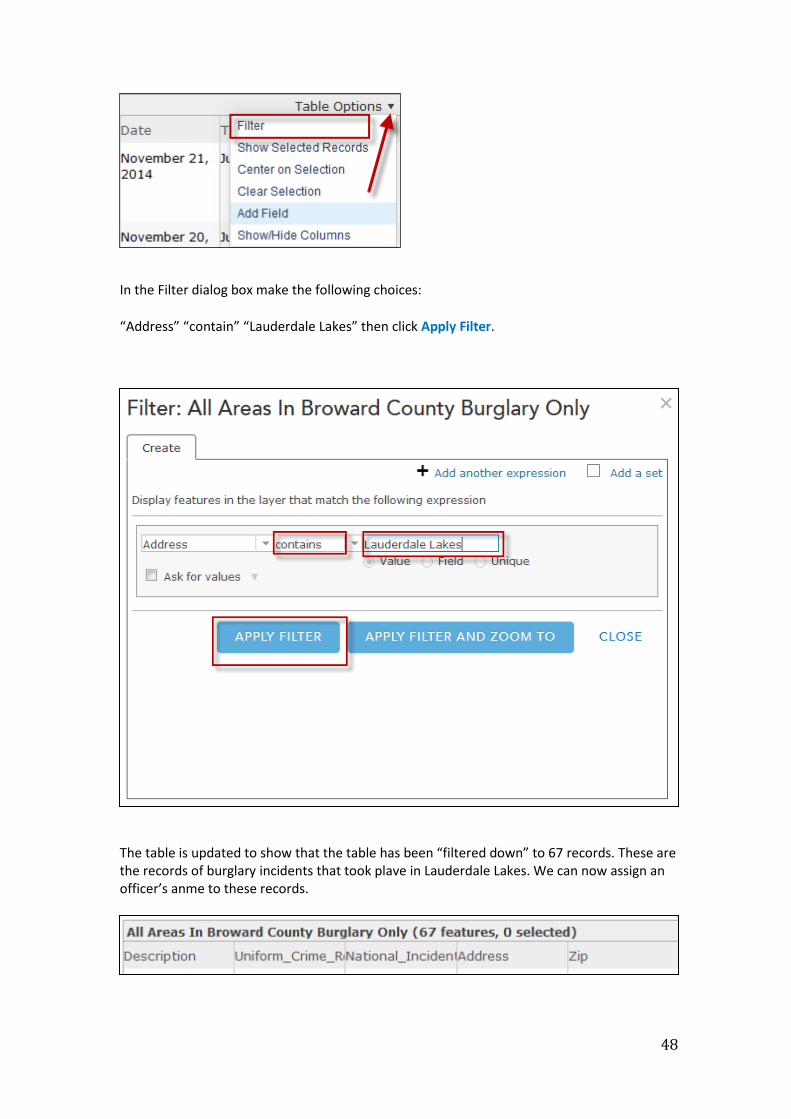
In the Filter dialog box make the following choices:
“Address” “contain” “Lauderdale Lakes” then click Apply Filter.
The table is updated to show that the table has been “filtered down” to 67 records. These are the records of burglary incidents that took plave in Lauderdale Lakes. We can now assign an officer’s anme to these records.

49
To calculate these records. Left-click inside the Officer’s filed name and in the pop-up window select Calculate.
In the Expression Builder dialog box, type inside the red box ‘Velasco’ (with single quotes) as shown below. The expression reads “Officer = Velasco” Then click Calculate.

50
AGOL calculates those 67 records to have Officer Velasco assigned to him.
Let’s calculate one more area to Officer Harned.
First, we need to clear the current selction (Lauderdale Lakes.)
Click on the Table Options downward arrow and select Filter as shown below
In the Filter dialog box click on Remove Filter:

51
Notice that the table has 505 records (burglary crime incidents) none are selected now again:
Now let’s Filter again to select Oakland Park and assign those burglary incidents to Officer Harned.
Click on the Table Options downward arrow and select Filter as shown below
In the Filter dialog box make the following choices:
“Address” “contain” “Oakland Park” then click Apply Filter.

52
The table is updated to show that the table has been “filtered down” to 54 records. These are the records of burglary incidents that took plave in Lauderdale Lakes. We can now assign an officer’s anme to these records.
To calculate these records. Left-click inside the Officer’s filed name and in the pop-up window select Calculate.
In the Expression Builder dialog box, type inside the red box ‘Harned’ (with single quotes) as shown below. The expression reads “Officer = harned” Then click Calculate.

53
AGOL calculates those 54 records to have Officer Harned assigned to him.
Feel free to assign (calculate) other incidents to other officers.
When done Click Save to save your work.

54
Special Thanks to the following NAPSG Volunteers:
Mauricio Velasco Rey, University of Wisconsin-Stevens Point
Chris Delaney, Esri
Milton Ospina, HERE – A Nokia Company
June 15, 2015