Embed Size (px)
Citation preview
1
TECHNICAL NOTETransportation Air Quality Technical Support
Interagency Contractwith
Texas Commission on Environmental Quality
TO: Peter Ogbeide, Project Manager DATE: 31 August 2004Texas Commission on Environmental Quality
FROM: Dennis G. Perkinson, Ph.D., TTI Study No.: 402131-25Texas Transportation Institute
SUBJECT: Assess Currently Available Houston Ship Channel Area VMT Mix Data andIdentify Additional Data Required (Umbrella Contract 60200-04-17: Task 1) -Revised Final
INTRODUCTION
The Texas Commission on Environmental Quality (TCEQ) works with local planning districts,
the Texas Department of Transportation (TxDOT), and the Texas Transportation Institute (TTI)
to provide on-road mobile source inventories of air quality pollutants. TxDOT typically funds
transportation conformity determinations required under 40 CFR part 93, and the TCEQ
typically funds mobile source inventory work in support of Federal Clean Air Act requirements
for attainment of the National Ambient Air Quality Standards (NAAQS, 42 USCA 7409).
BACKGROUND
Transportation professionals have long recognized that high quality data is the cornerstone of
transportation planning, research and analysis. Current air quality regulations and procedures
require planners to address transportation and environmental issues with a precision and
accuracy that challenges the capabilities of the data and methods in use today. The models and
other analytical tools used to provide these analyses are only as good as the data fed into them.
2
TxDOT maintains vehicle classification data collection sites throughout Texas. However,
interest in some nonattainment areas has focused on very specific specialized locations. These
areas of interest (e.g., the Houston ship channel area) contain specialized activities that may have
significantly different distributions of vehicle miles traveled among the various vehicle types
(VMT mix) than the region as a whole. A better understanding of these specialized locations
could improve emissions estimates and the effectiveness of reduction measures.
TASK DESCRIPTION
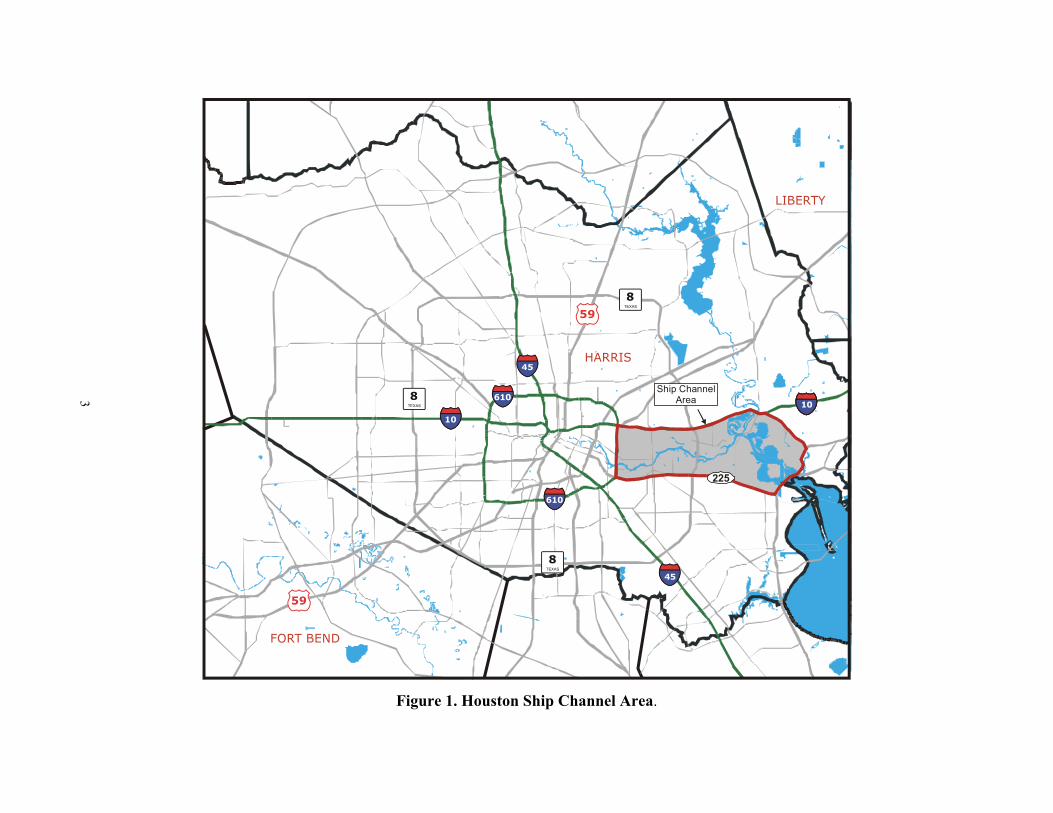
TTI reviewed available TxDOT vehicle classification data for the Houston ship channel area
(Figure 1). VMT mix for the ship channel area was calculated using the currently available
vehicle classification data and procedures. The results of these calculations are documented in a
summary table. The quality of these data is assured by the collecting agency (TxDOT), however,
the adequacy of the data for this analysis (i.e., ship channel VMT mix) was assessed by TTI. To
the extent that the data are inadequate, a determination is provided regarding the additional data
needed to adequately represent VMT mix in the ship channel area. The following activities were
completed under this task.
• Review the current TxDOT vehicle classification data for the Houston ship channel area.
An estimate ship channel area VMT from existing data sources is also provided.
Summarize ship channel VMT mix (and VMT) in a summary table format.
• If the current vehicle classification data are deemed inadequate for determining a ship
channel specific VMT mix, develop a data collection plan that will provide adequate data
for calculating the geographic specific VMT mix.
• Prepare complete documentation, which includes all TTI generated data files used in this
analysis consistent in format and level of detail with previous TTI reports.
3
Figure 1. Houston Ship Channel Area.
HARRIS
FORT BEND
LIBERTY
59
59
8
8
8
10
45
45
610
101010610
Ship ChannelArea
225
4
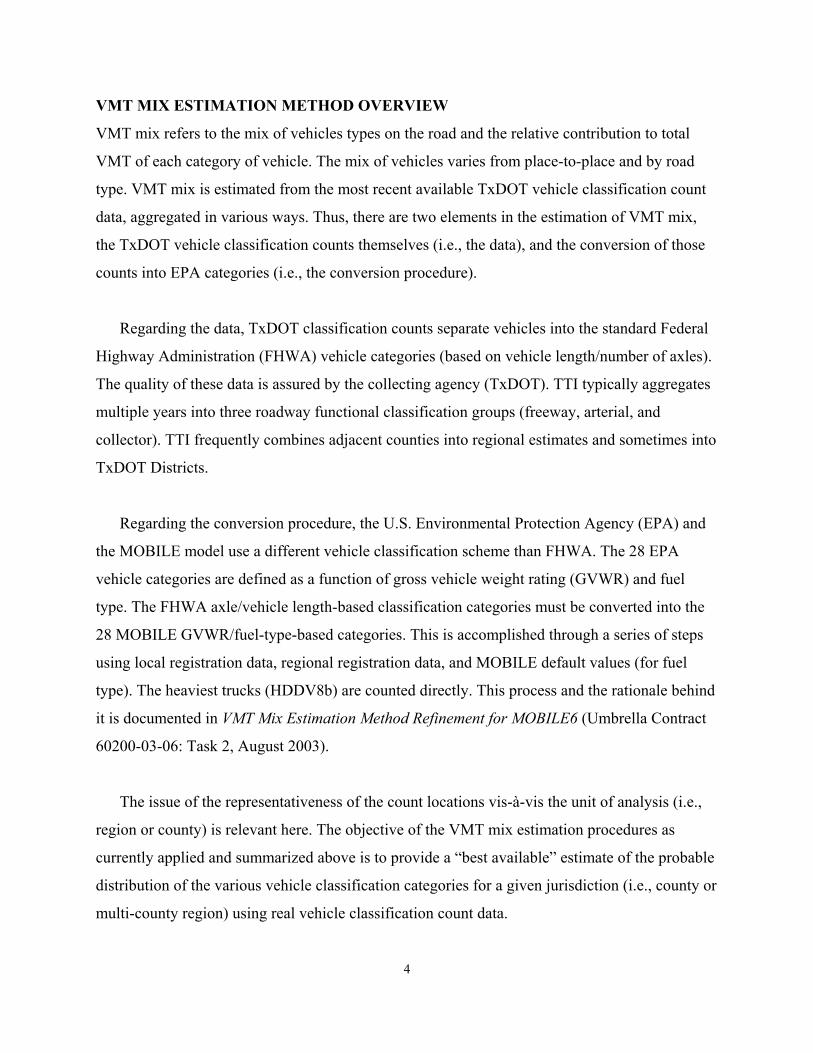
VMT MIX ESTIMATION METHOD OVERVIEW
VMT mix refers to the mix of vehicles types on the road and the relative contribution to total
VMT of each category of vehicle. The mix of vehicles varies from place-to-place and by road
type. VMT mix is estimated from the most recent available TxDOT vehicle classification count
data, aggregated in various ways. Thus, there are two elements in the estimation of VMT mix,
the TxDOT vehicle classification counts themselves (i.e., the data), and the conversion of those
counts into EPA categories (i.e., the conversion procedure).
Regarding the data, TxDOT classification counts separate vehicles into the standard Federal
Highway Administration (FHWA) vehicle categories (based on vehicle length/number of axles).
The quality of these data is assured by the collecting agency (TxDOT). TTI typically aggregates
multiple years into three roadway functional classification groups (freeway, arterial, and
collector). TTI frequently combines adjacent counties into regional estimates and sometimes into
TxDOT Districts.
Regarding the conversion procedure, the U.S. Environmental Protection Agency (EPA) and
the MOBILE model use a different vehicle classification scheme than FHWA. The 28 EPA
vehicle categories are defined as a function of gross vehicle weight rating (GVWR) and fuel
type. The FHWA axle/vehicle length-based classification categories must be converted into the
28 MOBILE GVWR/fuel-type-based categories. This is accomplished through a series of steps
using local registration data, regional registration data, and MOBILE default values (for fuel
type). The heaviest trucks (HDDV8b) are counted directly. This process and the rationale behind
it is documented in VMT Mix Estimation Method Refinement for MOBILE6 (Umbrella Contract
60200-03-06: Task 2, August 2003).
The issue of the representativeness of the count locations vis-à-vis the unit of analysis (i.e.,
region or county) is relevant here. The objective of the VMT mix estimation procedures as
currently applied and summarized above is to provide a “best available” estimate of the probable
distribution of the various vehicle classification categories for a given jurisdiction (i.e., county or
multi-county region) using real vehicle classification count data.
5
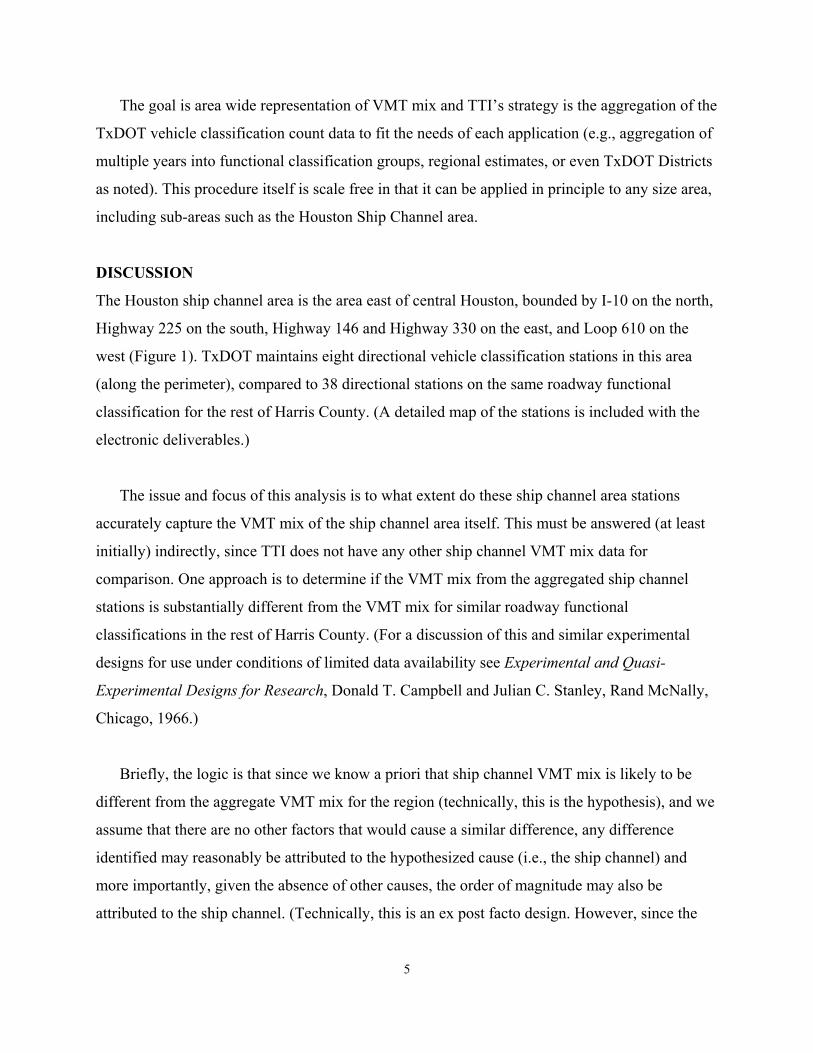
The goal is area wide representation of VMT mix and TTI’s strategy is the aggregation of the
TxDOT vehicle classification count data to fit the needs of each application (e.g., aggregation of
multiple years into functional classification groups, regional estimates, or even TxDOT Districts
as noted). This procedure itself is scale free in that it can be applied in principle to any size area,
including sub-areas such as the Houston Ship Channel area.
DISCUSSION
The Houston ship channel area is the area east of central Houston, bounded by I-10 on the north,
Highway 225 on the south, Highway 146 and Highway 330 on the east, and Loop 610 on the
west (Figure 1). TxDOT maintains eight directional vehicle classification stations in this area
(along the perimeter), compared to 38 directional stations on the same roadway functional
classification for the rest of Harris County. (A detailed map of the stations is included with the
electronic deliverables.)
The issue and focus of this analysis is to what extent do these ship channel area stations
accurately capture the VMT mix of the ship channel area itself. This must be answered (at least
initially) indirectly, since TTI does not have any other ship channel VMT mix data for
comparison. One approach is to determine if the VMT mix from the aggregated ship channel
stations is substantially different from the VMT mix for similar roadway functional
classifications in the rest of Harris County. (For a discussion of this and similar experimental
designs for use under conditions of limited data availability see Experimental and Quasi-
Experimental Designs for Research, Donald T. Campbell and Julian C. Stanley, Rand McNally,
Chicago, 1966.)
Briefly, the logic is that since we know a priori that ship channel VMT mix is likely to be
different from the aggregate VMT mix for the region (technically, this is the hypothesis), and we
assume that there are no other factors that would cause a similar difference, any difference
identified may reasonably be attributed to the hypothesized cause (i.e., the ship channel) and
more importantly, given the absence of other causes, the order of magnitude may also be
attributed to the ship channel. (Technically, this is an ex post facto design. However, since the
6
ship channel is already there, it is, practically speaking, our only choice in terms of experimental
design. We therefore use the inductive logic described above.)
Harris County and ship channel area VMT are provided for reference. Harris County VMT is
taken directly from official TxDOT Highway Performance Monitoring System (HPMS) VMT
data for 2002. Ship channel area VMT is estimated based on the Houston Galveston Area
Council’s current 2002 travel demand model and TxDOT HPMS VMT data for 2002.
Specifically, the proportion of travel demand model VMT attributable to the ship channel area as
defined (i.e., 5.6 percent, boundary road VMT included) is applied to TxDOT HPMS VMT
estimates. The resulting VMT estimates are therefore an upper bound and represent a maximum
likely value. They are also Average Annual Daily Traffic (AADT) and are not adjusted for day
of week or season.
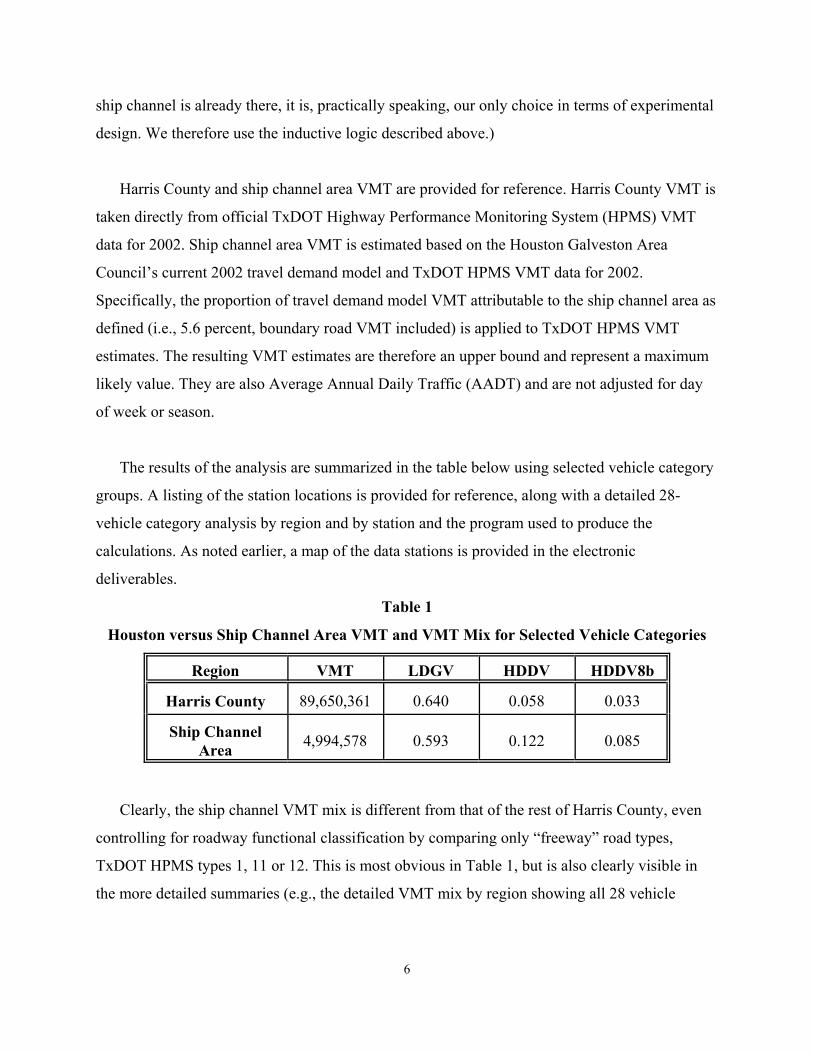
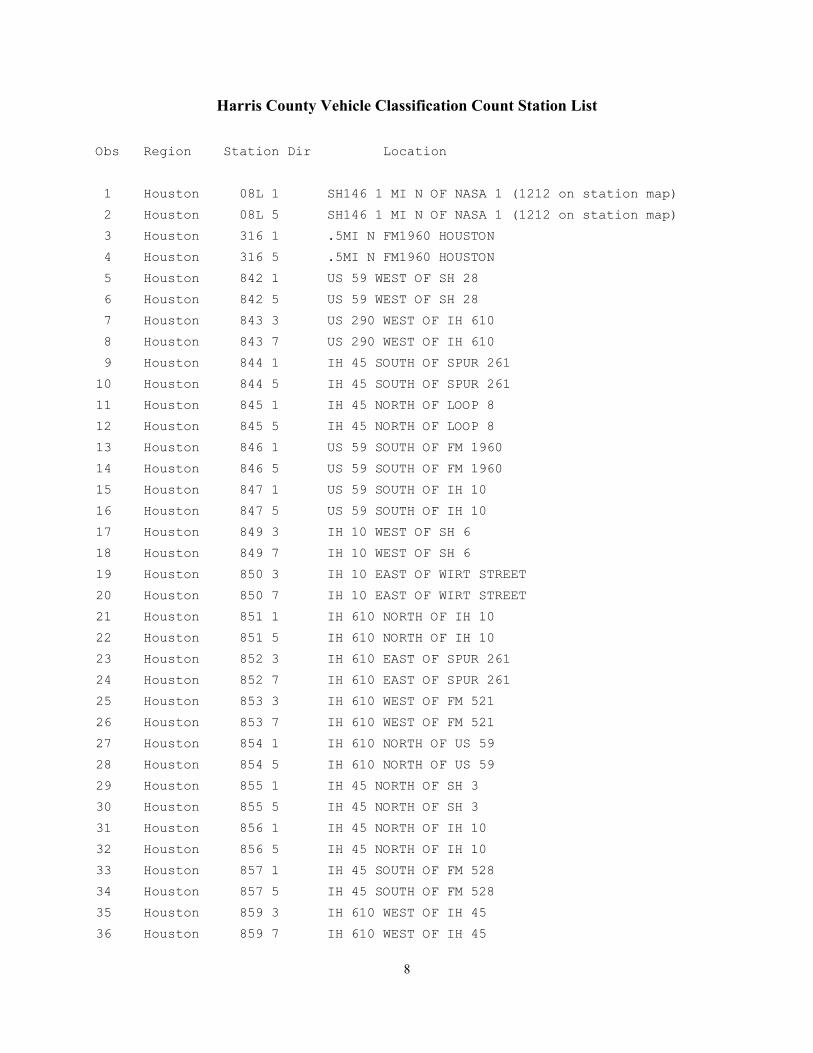
The results of the analysis are summarized in the table below using selected vehicle category
groups. A listing of the station locations is provided for reference, along with a detailed 28-
vehicle category analysis by region and by station and the program used to produce the
calculations. As noted earlier, a map of the data stations is provided in the electronic
deliverables.
Table 1
Houston versus Ship Channel Area VMT and VMT Mix for Selected Vehicle Categories
Region VMT LDGV HDDV HDDV8b
Harris County 89,650,361 0.640 0.058 0.033
Ship ChannelArea 4,994,578 0.593 0.122 0.085
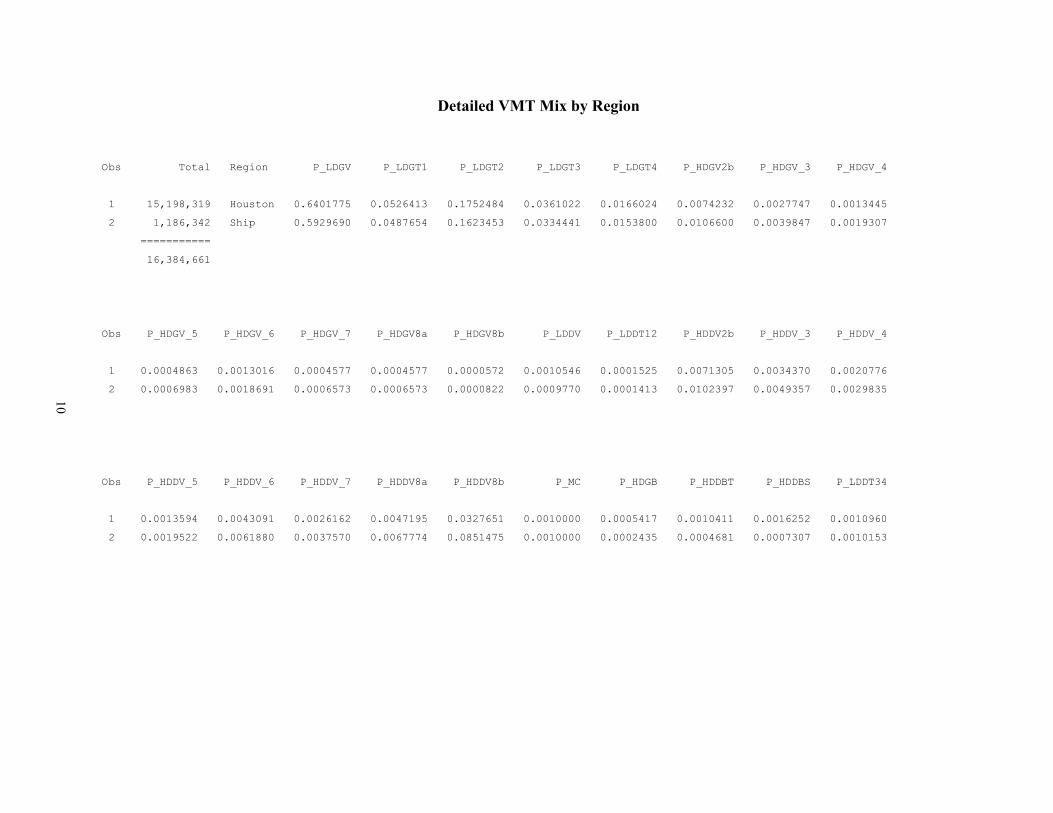
Clearly, the ship channel VMT mix is different from that of the rest of Harris County, even
controlling for roadway functional classification by comparing only “freeway” road types,
TxDOT HPMS types 1, 11 or 12. This is most obvious in Table 1, but is also clearly visible in
the more detailed summaries (e.g., the detailed VMT mix by region showing all 28 vehicle

7
categories). (This part of the analysis and the associated calculations constitutes Activity A. This
document and the associated electronic files constitutes Activity C.)
Activity B, the issue of the adequacy of these data to represent the VMT mix of the ship
channel area (and the concomitant data collection plan to remedy any identified inadequacy), is
less straight forward and requires some discussion. In terms of its incorporation into the
emissions estimation and regional analysis procedure, the representation of the ship channel area
is clearly adequate, based on the configuration of the current official TxDOT operated and
federally-approved sampling plan within the official HPMS protocols.
Consequently, for regional emissions estimation purposes, we believe the current vehicle
classification data provide an adequate representation of ship channel area VMT mix. For more
micro scale analyses (e.g., specific intersections), more detailed classification counts might be
required. The impact of more detailed classification data on regional or area emissions estimates,
however, would be negligible since the VMT associated with the more detailed counts would be
small compared to regional VMT. (VMT mix is applied to VMT to produce estimates of VMT
allocated to each of the 28 vehicle types.) In any case, were additional data to be collected
separately in the ship channel area for whatever reason, it could not be directly used in the
regional emissions estimation process, since it is not part of the TxDOT/HPMS sampling
protocol and would undermine the statistical validity of the rest of the data and the resulting
analyses.
8
Harris County Vehicle Classification Count Station List
Obs Region Station Dir Location
1 Houston 08L 1 SH146 1 MI N OF NASA 1 (1212 on station map)
2 Houston 08L 5 SH146 1 MI N OF NASA 1 (1212 on station map)
3 Houston 316 1 .5MI N FM1960 HOUSTON
4 Houston 316 5 .5MI N FM1960 HOUSTON
5 Houston 842 1 US 59 WEST OF SH 28
6 Houston 842 5 US 59 WEST OF SH 28
7 Houston 843 3 US 290 WEST OF IH 610
8 Houston 843 7 US 290 WEST OF IH 610
9 Houston 844 1 IH 45 SOUTH OF SPUR 261
10 Houston 844 5 IH 45 SOUTH OF SPUR 261
11 Houston 845 1 IH 45 NORTH OF LOOP 8
12 Houston 845 5 IH 45 NORTH OF LOOP 8
13 Houston 846 1 US 59 SOUTH OF FM 1960
14 Houston 846 5 US 59 SOUTH OF FM 1960
15 Houston 847 1 US 59 SOUTH OF IH 10
16 Houston 847 5 US 59 SOUTH OF IH 10
17 Houston 849 3 IH 10 WEST OF SH 6
18 Houston 849 7 IH 10 WEST OF SH 6
19 Houston 850 3 IH 10 EAST OF WIRT STREET
20 Houston 850 7 IH 10 EAST OF WIRT STREET
21 Houston 851 1 IH 610 NORTH OF IH 10
22 Houston 851 5 IH 610 NORTH OF IH 10
23 Houston 852 3 IH 610 EAST OF SPUR 261
24 Houston 852 7 IH 610 EAST OF SPUR 261
25 Houston 853 3 IH 610 WEST OF FM 521
26 Houston 853 7 IH 610 WEST OF FM 521
27 Houston 854 1 IH 610 NORTH OF US 59
28 Houston 854 5 IH 610 NORTH OF US 59
29 Houston 855 1 IH 45 NORTH OF SH 3
30 Houston 855 5 IH 45 NORTH OF SH 3
31 Houston 856 1 IH 45 NORTH OF IH 10
32 Houston 856 5 IH 45 NORTH OF IH 10
33 Houston 857 1 IH 45 SOUTH OF FM 528
34 Houston 857 5 IH 45 SOUTH OF FM 528
35 Houston 859 3 IH 610 WEST OF IH 45
36 Houston 859 7 IH 610 WEST OF IH 45
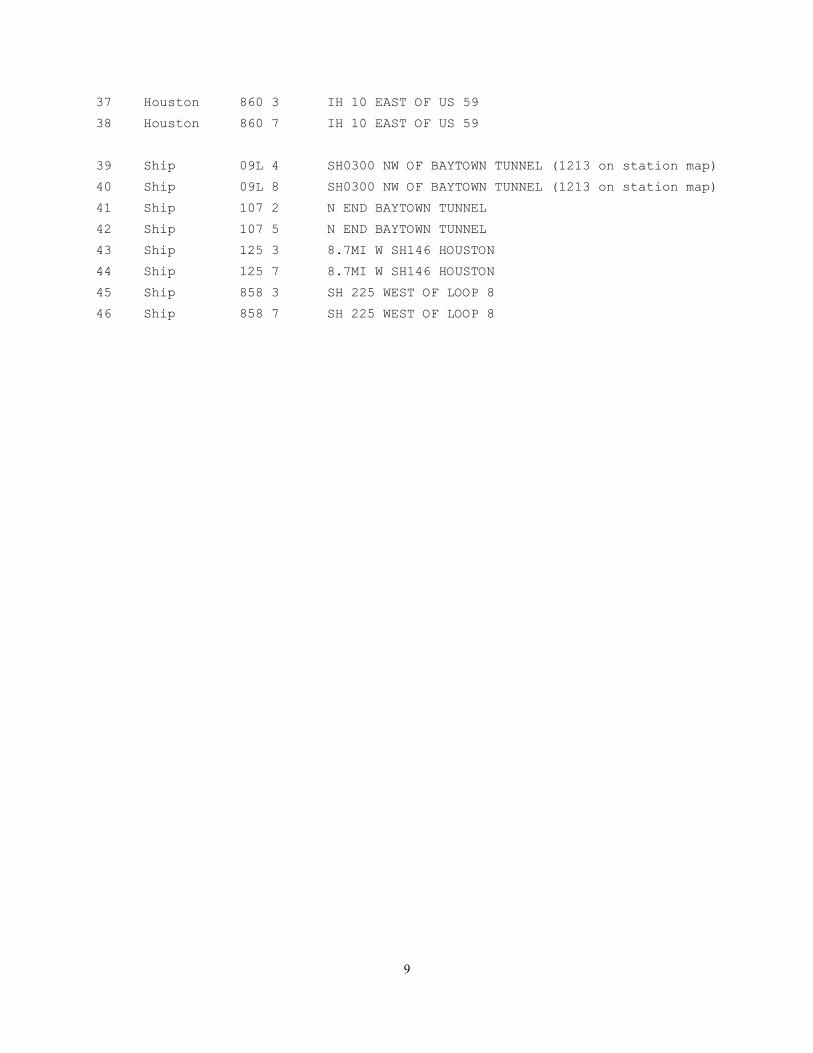
9
37 Houston 860 3 IH 10 EAST OF US 59
38 Houston 860 7 IH 10 EAST OF US 59
39 Ship 09L 4 SH0300 NW OF BAYTOWN TUNNEL (1213 on station map)
40 Ship 09L 8 SH0300 NW OF BAYTOWN TUNNEL (1213 on station map)
41 Ship 107 2 N END BAYTOWN TUNNEL
42 Ship 107 5 N END BAYTOWN TUNNEL
43 Ship 125 3 8.7MI W SH146 HOUSTON
44 Ship 125 7 8.7MI W SH146 HOUSTON
45 Ship 858 3 SH 225 WEST OF LOOP 8
46 Ship 858 7 SH 225 WEST OF LOOP 8
10
Detailed VMT Mix by Region
Obs Total Region P_LDGV P_LDGT1 P_LDGT2 P_LDGT3 P_LDGT4 P_HDGV2b P_HDGV_3 P_HDGV_4
1 15,198,319 Houston 0.6401775 0.0526413 0.1752484 0.0361022 0.0166024 0.0074232 0.0027747 0.0013445
2 1,186,342 Ship 0.5929690 0.0487654 0.1623453 0.0334441 0.0153800 0.0106600 0.0039847 0.0019307
===========
16,384,661
Obs P_HDGV_5 P_HDGV_6 P_HDGV_7 P_HDGV8a P_HDGV8b P_LDDV P_LDDT12 P_HDDV2b P_HDDV_3 P_HDDV_4
1 0.0004863 0.0013016 0.0004577 0.0004577 0.0000572 0.0010546 0.0001525 0.0071305 0.0034370 0.0020776
2 0.0006983 0.0018691 0.0006573 0.0006573 0.0000822 0.0009770 0.0001413 0.0102397 0.0049357 0.0029835
Obs P_HDDV_5 P_HDDV_6 P_HDDV_7 P_HDDV8a P_HDDV8b P_MC P_HDGB P_HDDBT P_HDDBS P_LDDT34
1 0.0013594 0.0043091 0.0026162 0.0047195 0.0327651 0.0010000 0.0005417 0.0010411 0.0016252 0.0010960
2 0.0019522 0.0061880 0.0037570 0.0067774 0.0851475 0.0010000 0.0002435 0.0004681 0.0007307 0.0010153