Embed Size (px)
Citation preview
Crenshaw Corridor Strategic Plan(Draft) Economic Findings
Presented to
The Crenshaw Corridor Stakeholder Task Force
November 15, 2007
November 15, 2007Crenshaw Corridor Strategy Slide 2
Table of Contents
I. IntroductionII. Understanding of the AssignmentIII. Socio-Demographic OverviewIV. Real Estate Market OverviewV. Supportable Development EstimatesVI. Strategic IssuesVII. Discussion
November 15, 2007Crenshaw Corridor Strategy Slide 3
Introduction - ERA Team
David A. Wilcox, FAICPSenior Vice President
10990 Wilshire Boulevard, Suite 1500Los Angeles, California 90024310.477.9585 FAX: 310.478.1950e-mail: [email protected]
Amitabh Barthakur, AICPPrincipal
10990 Wilshire Boulevard, Suite 1500Los Angeles, California 90024310.477.9585 FAX: 310.478.1950e-mail: [email protected]
Judith TaylorAssociate
10990 Wilshire Boulevard, Suite 1500Los Angeles, California 90024310.477.9585 FAX: 310.478.1950e-mail: [email protected]
November 15, 2007Crenshaw Corridor Strategy Slide 4
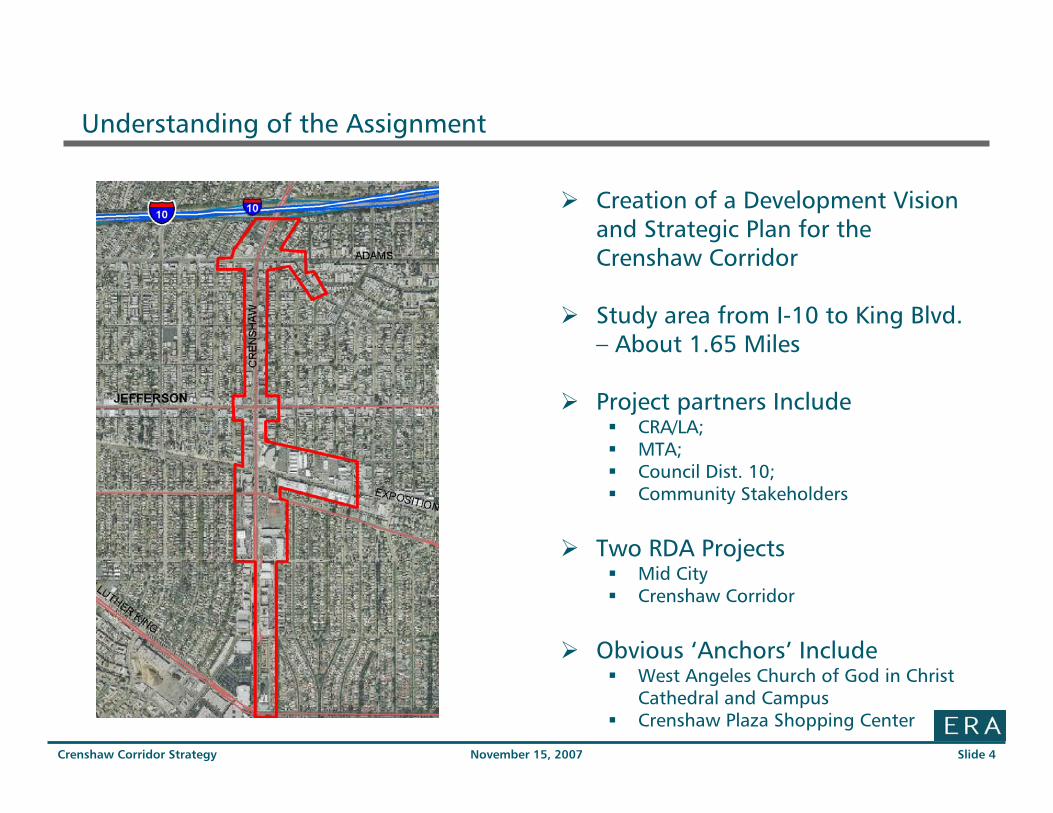
Understanding of the Assignment
Creation of a Development Vision and Strategic Plan for the Crenshaw Corridor
Study area from I-10 to King Blvd. – About 1.65 Miles
Project partners IncludeCRA/LA; MTA; Council Dist. 10; Community Stakeholders
Two RDA ProjectsMid CityCrenshaw Corridor
Obvious ‘Anchors’ IncludeWest Angeles Church of God in Christ Cathedral and CampusCrenshaw Plaza Shopping Center
November 15, 2007Crenshaw Corridor Strategy Slide 5
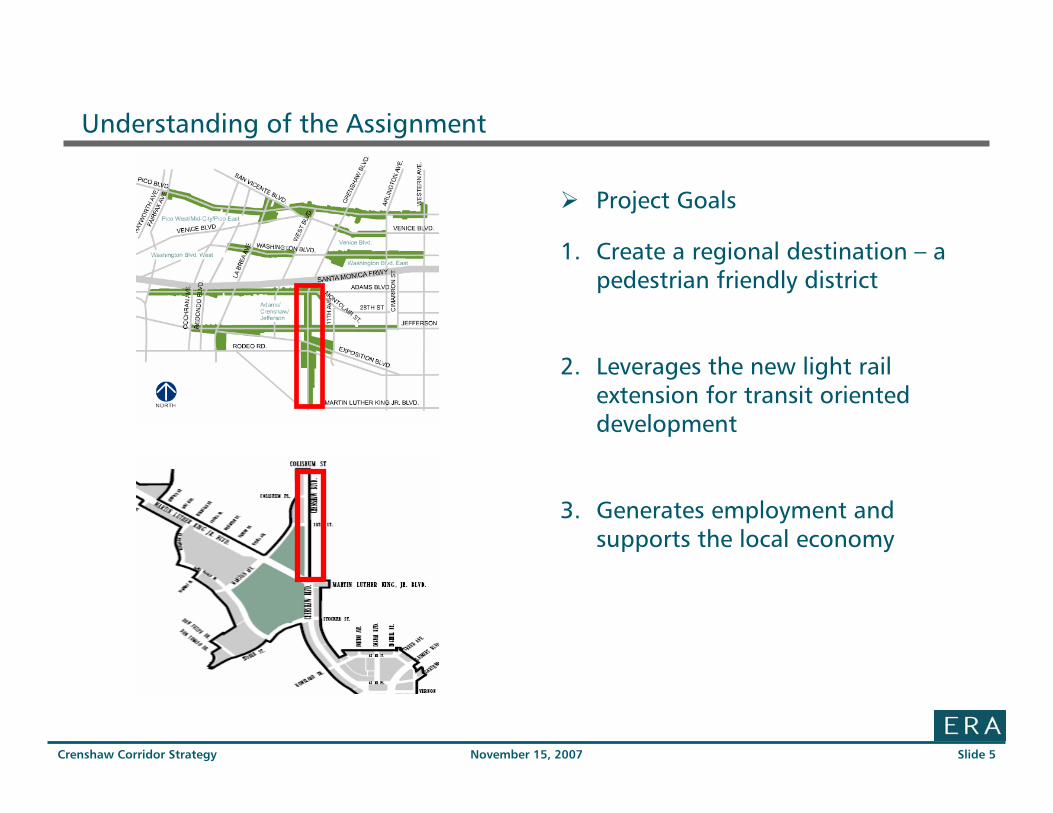
Understanding of the Assignment
Project Goals
1. Create a regional destination – a pedestrian friendly district
2. Leverages the new light rail extension for transit oriented development
3. Generates employment and supports the local economy
November 15, 2007Crenshaw Corridor Strategy Slide 6
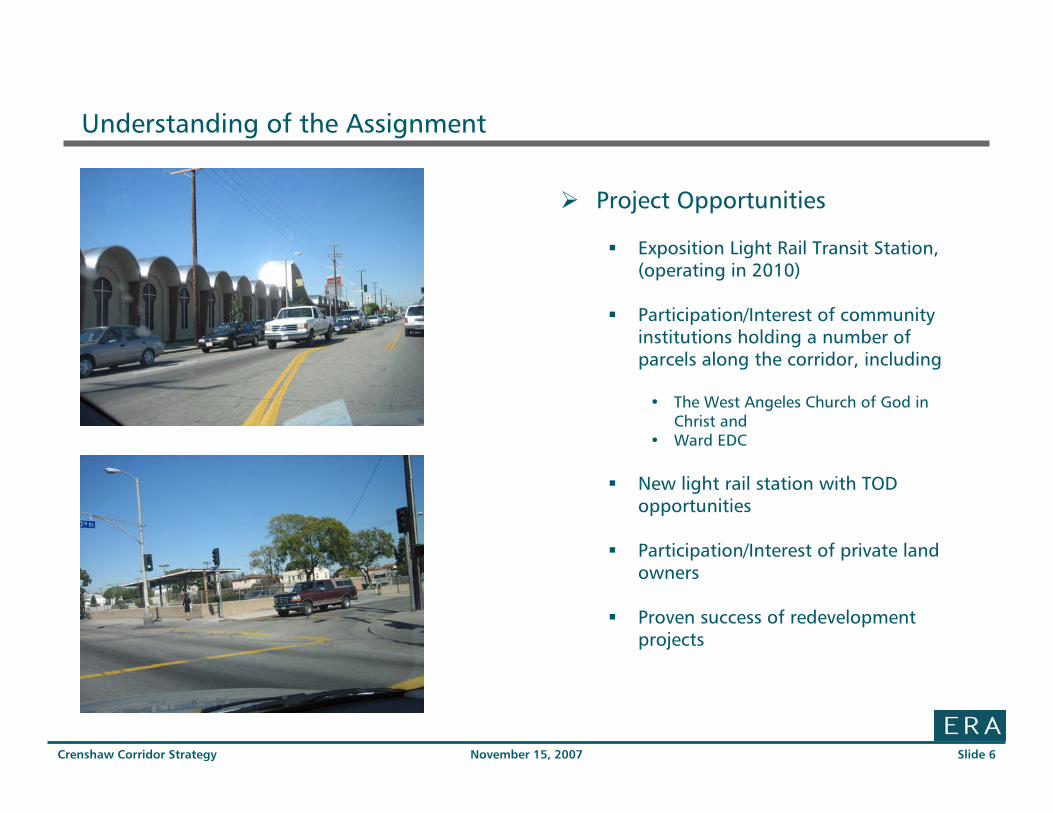
Understanding of the Assignment
Project Opportunities
Exposition Light Rail Transit Station, (operating in 2010)
Participation/Interest of community institutions holding a number of parcels along the corridor, including
• The West Angeles Church of God in Christ and
• Ward EDC
New light rail station with TOD opportunities
Participation/Interest of private land owners
Proven success of redevelopment projects
November 15, 2007Crenshaw Corridor Strategy Slide 7
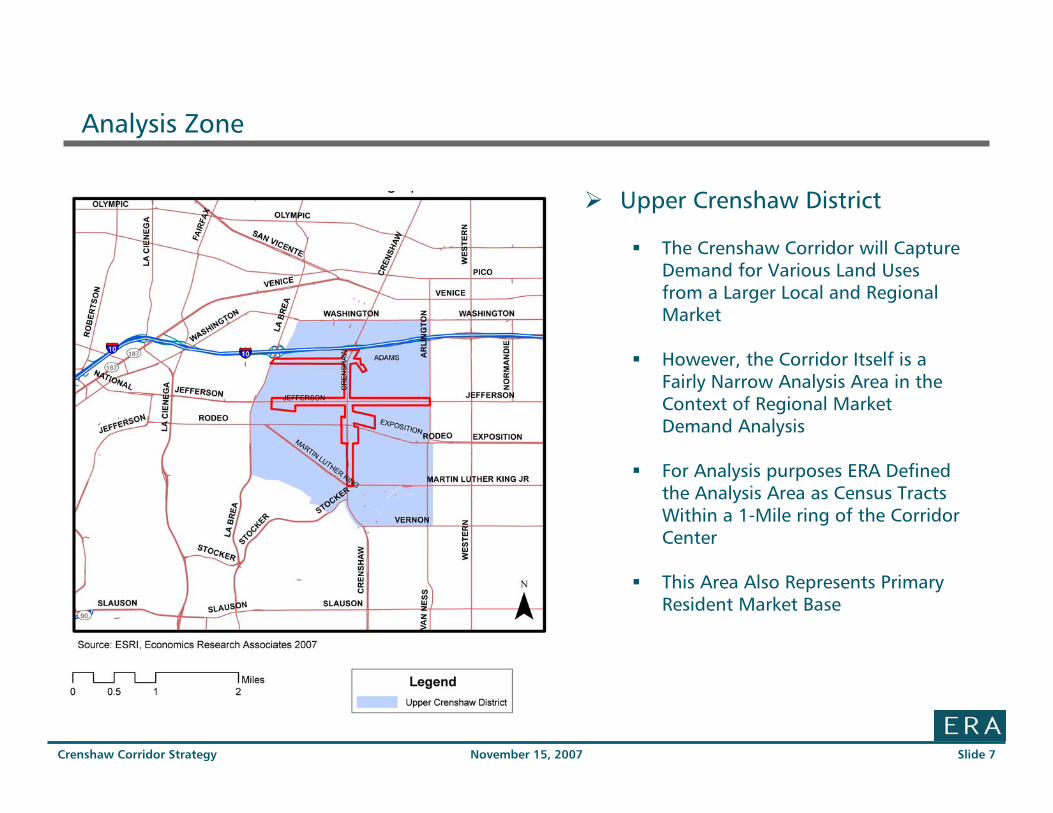
Analysis Zone
Upper Crenshaw District
The Crenshaw Corridor will Capture Demand for Various Land Uses from a Larger Local and Regional Market
However, the Corridor Itself is a Fairly Narrow Analysis Area in the Context of Regional Market Demand Analysis
For Analysis purposes ERA Defined the Analysis Area as Census Tracts Within a 1-Mile ring of the Corridor Center
This Area Also Represents Primary Resident Market Base
November 15, 2007Crenshaw Corridor Strategy Slide 8
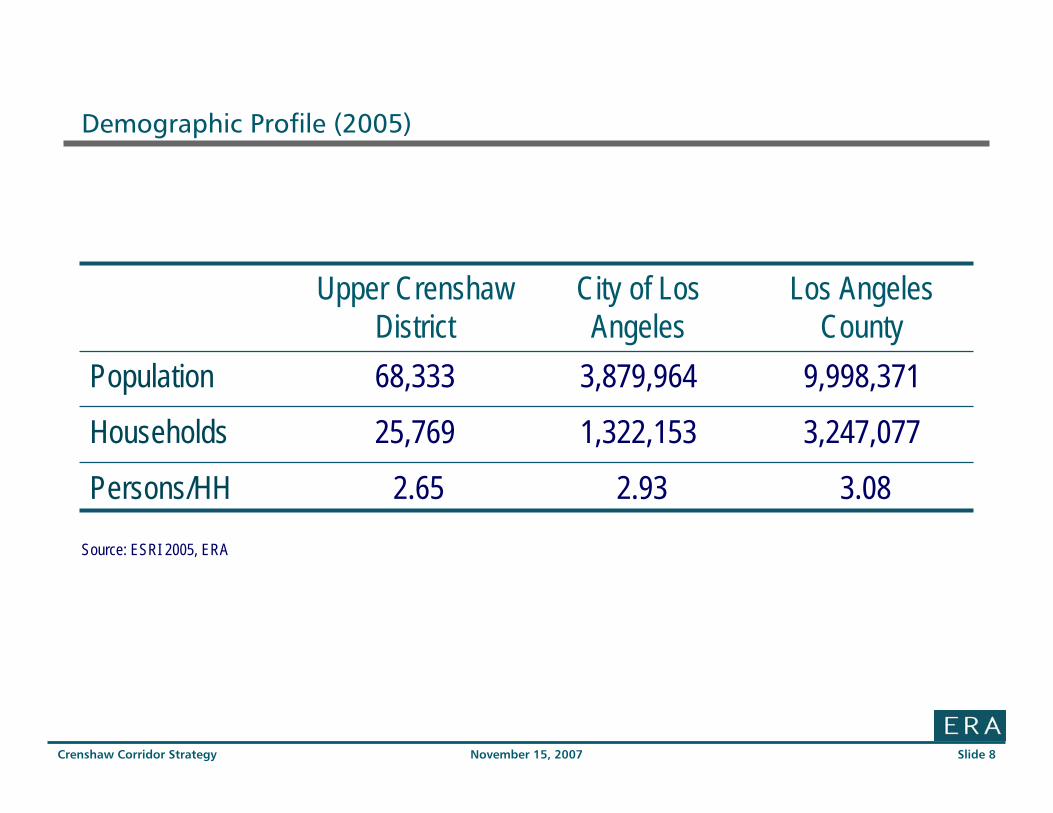
Demographic Profile (2005)
3.08 2.93 2.65 Persons/HH
3,247,0771,322,15325,769Households
9,998,3713,879,96468,333Population
Los Angeles County
City of Los Angeles
Upper Crenshaw District
Source: ESRI 2005, ERA
November 15, 2007Crenshaw Corridor Strategy Slide 9
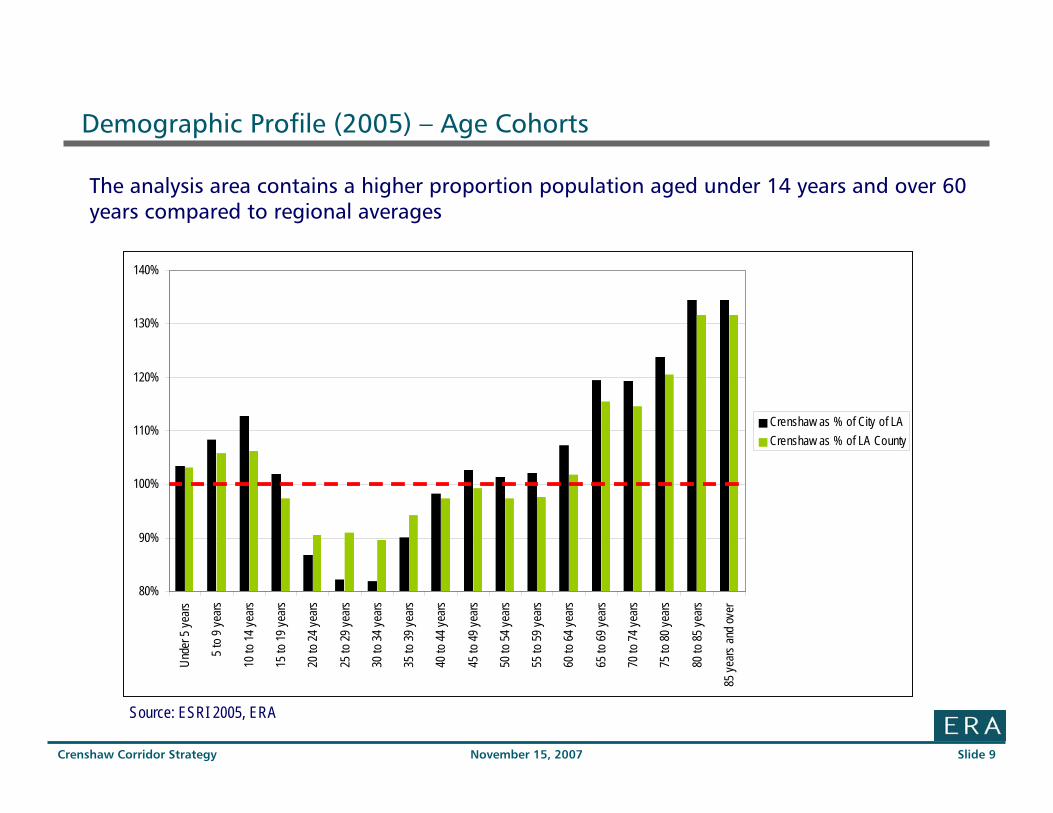
Demographic Profile (2005) – Age Cohorts
Source: ESRI 2005, ERA
80%
90%
100%
110%
120%
130%
140%
Unde
r 5 ye
ars
5 to 9
years
10 to
14 ye
ars
15 to
19 ye
ars
20 to
24 ye
ars
25 to
29 ye
ars
30 to
34 ye
ars
35 to
39 ye
ars
40 to
44 ye
ars
45 to
49 ye
ars
50 to
54 ye
ars
55 to
59 ye
ars
60 to
64 ye
ars
65 to
69 ye
ars
70 to
74 ye
ars
75 to
80 ye
ars
80 to
85 ye
ars
85 ye
ars an
d ove
r
Crenshaw as % of City of LACrenshaw as % of LA County
The analysis area contains a higher proportion population aged under 14 years and over 60 years compared to regional averages
November 15, 2007Crenshaw Corridor Strategy Slide 10
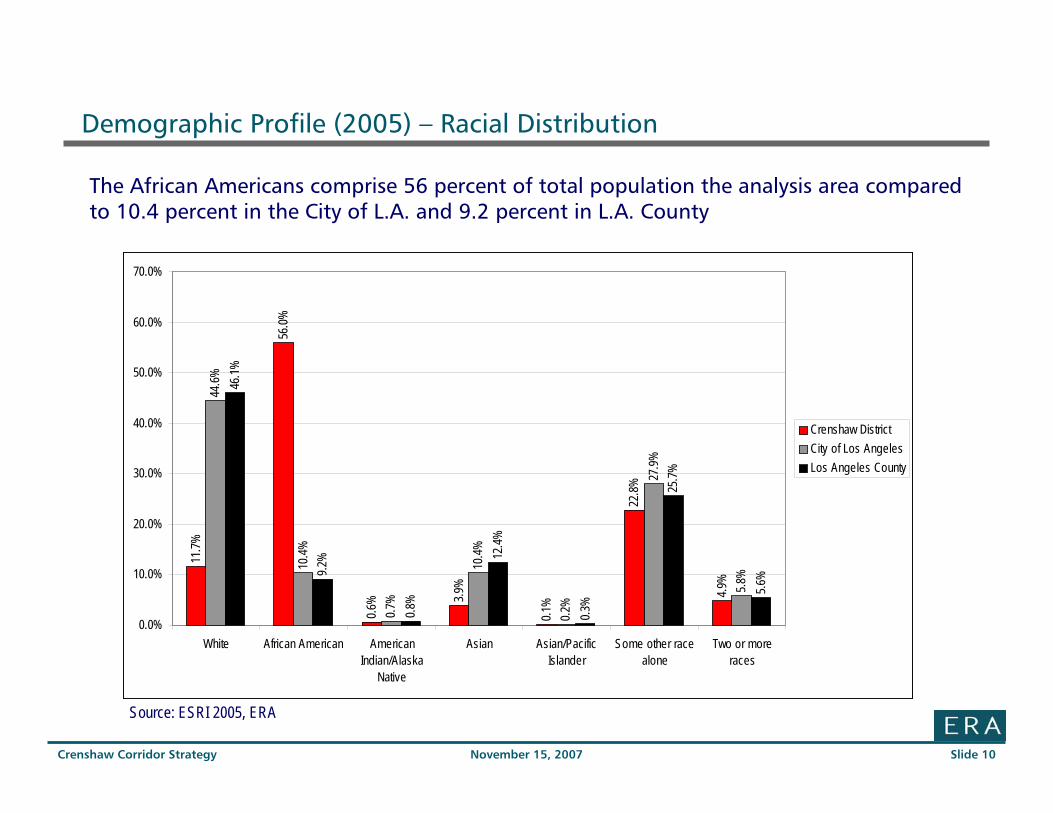
Demographic Profile (2005) – Racial Distribution
11.7%
56.0%
0.6% 3.9
%
0.1%
22.8%
4.9%
44.6%
10.4%
0.7%
10.4%
0.2%
27.9%
5.8%
46.1%
9.2%
0.8%
12.4%
0.3%
25.7%
5.6%
0.0%
10.0%
20.0%
30.0%
40.0%
50.0%
60.0%
70.0%
White African American AmericanIndian/Alaska
Native
Asian Asian/PacificIslander
Some other racealone
Two or moreraces
Crenshaw DistrictCity of Los AngelesLos Angeles County
Source: ESRI 2005, ERA
The African Americans comprise 56 percent of total population the analysis area compared to 10.4 percent in the City of L.A. and 9.2 percent in L.A. County
November 15, 2007Crenshaw Corridor Strategy Slide 11
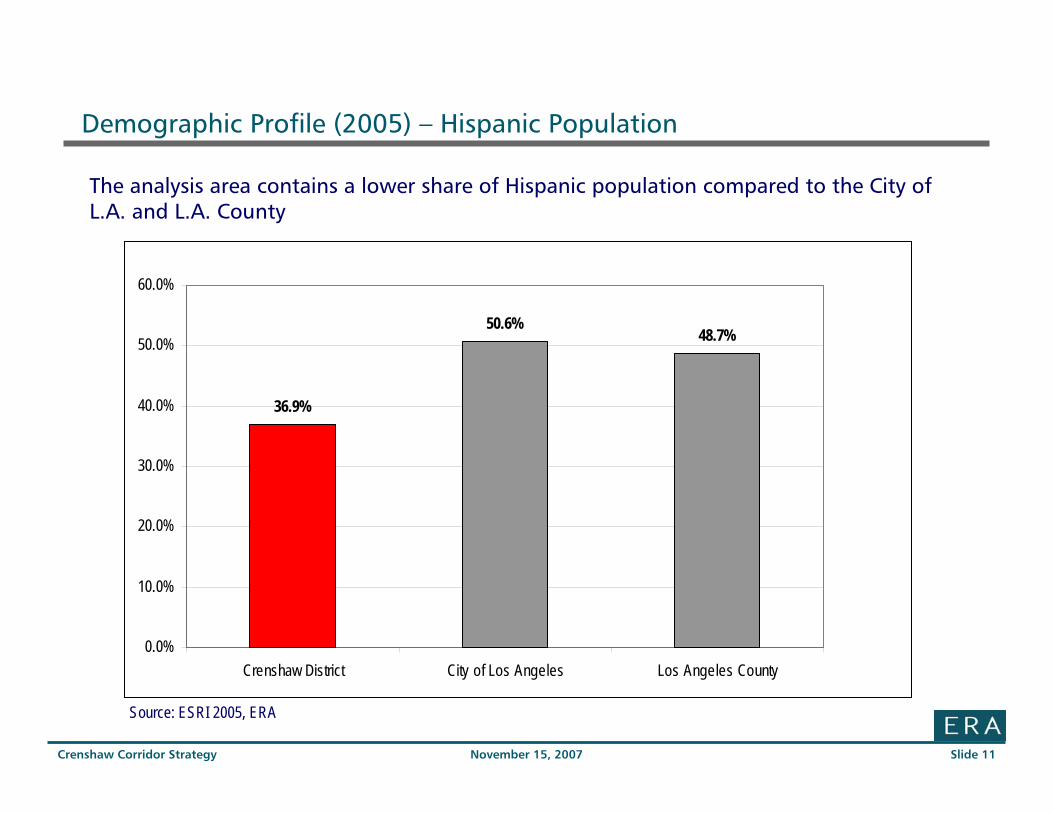
Demographic Profile (2005) – Hispanic Population
36.9%
50.6%48.7%
0.0%
10.0%
20.0%
30.0%
40.0%
50.0%
60.0%
Crenshaw District City of Los Angeles Los Angeles County
Source: ESRI 2005, ERA
The analysis area contains a lower share of Hispanic population compared to the City of L.A. and L.A. County
November 15, 2007Crenshaw Corridor Strategy Slide 12
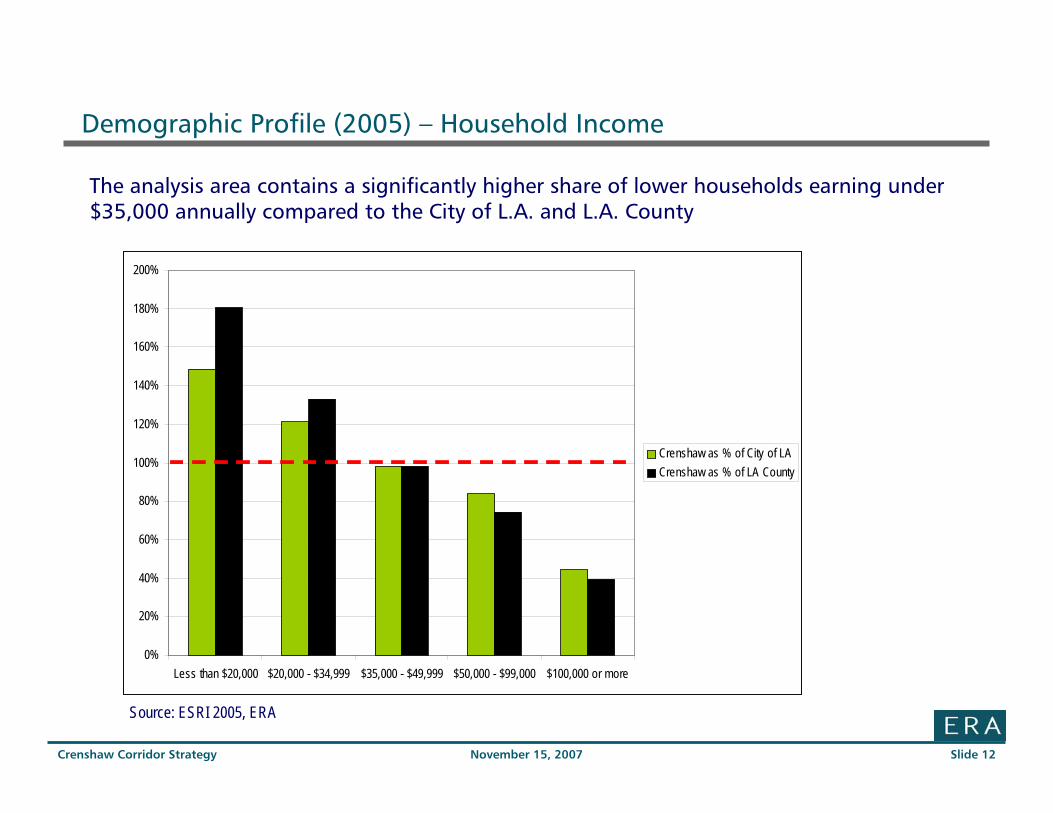
Demographic Profile (2005) – Household Income
0%
20%
40%
60%
80%
100%
120%
140%
160%
180%
200%
Less than $20,000 $20,000 - $34,999 $35,000 - $49,999 $50,000 - $99,000 $100,000 or more
Crenshaw as % of City of LACrenshaw as % of LA County
Source: ESRI 2005, ERA
The analysis area contains a significantly higher share of lower households earning under $35,000 annually compared to the City of L.A. and L.A. County
November 15, 2007Crenshaw Corridor Strategy Slide 13
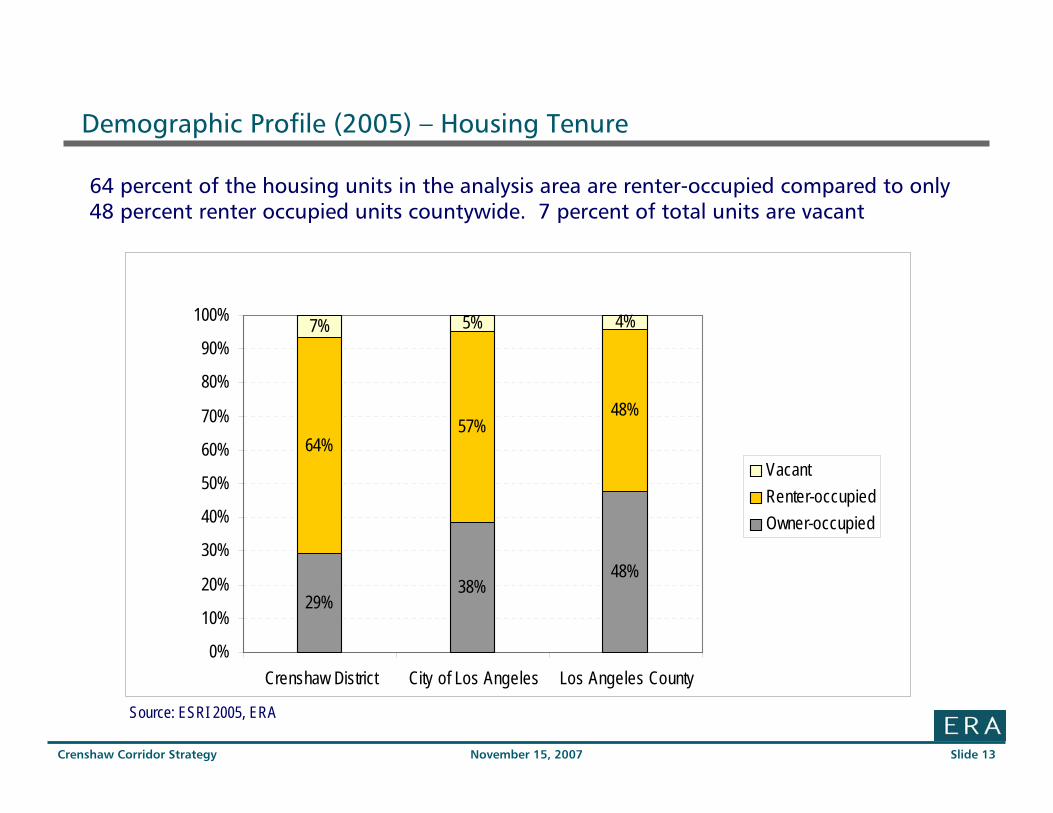
Demographic Profile (2005) – Housing Tenure
29%38%
48%
64%57%
48%
7% 5% 4%
0%
10%
20%
30%
40%
50%
60%
70%
80%
90%
100%
Crenshaw District City of Los Angeles Los Angeles County
VacantRenter-occupiedOwner-occupied
Source: ESRI 2005, ERA
64 percent of the housing units in the analysis area are renter-occupied compared to only 48 percent renter occupied units countywide. 7 percent of total units are vacant
November 15, 2007Crenshaw Corridor Strategy Slide 14
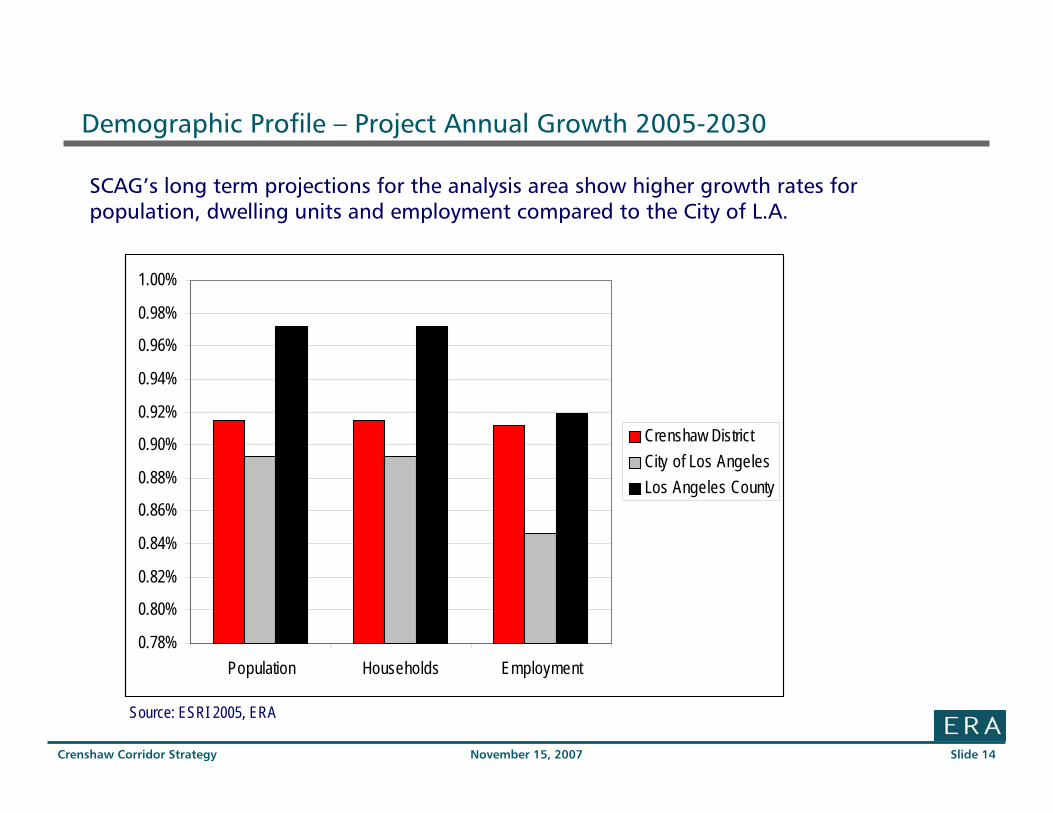
Demographic Profile – Project Annual Growth 2005-2030
0.78%
0.80%
0.82%
0.84%
0.86%
0.88%
0.90%
0.92%
0.94%
0.96%
0.98%
1.00%
Population Households Employment
Crenshaw DistrictCity of Los AngelesLos Angeles County
Source: ESRI 2005, ERA
SCAG’s long term projections for the analysis area show higher growth rates for population, dwelling units and employment compared to the City of L.A.
November 15, 2007Crenshaw Corridor Strategy Slide 15
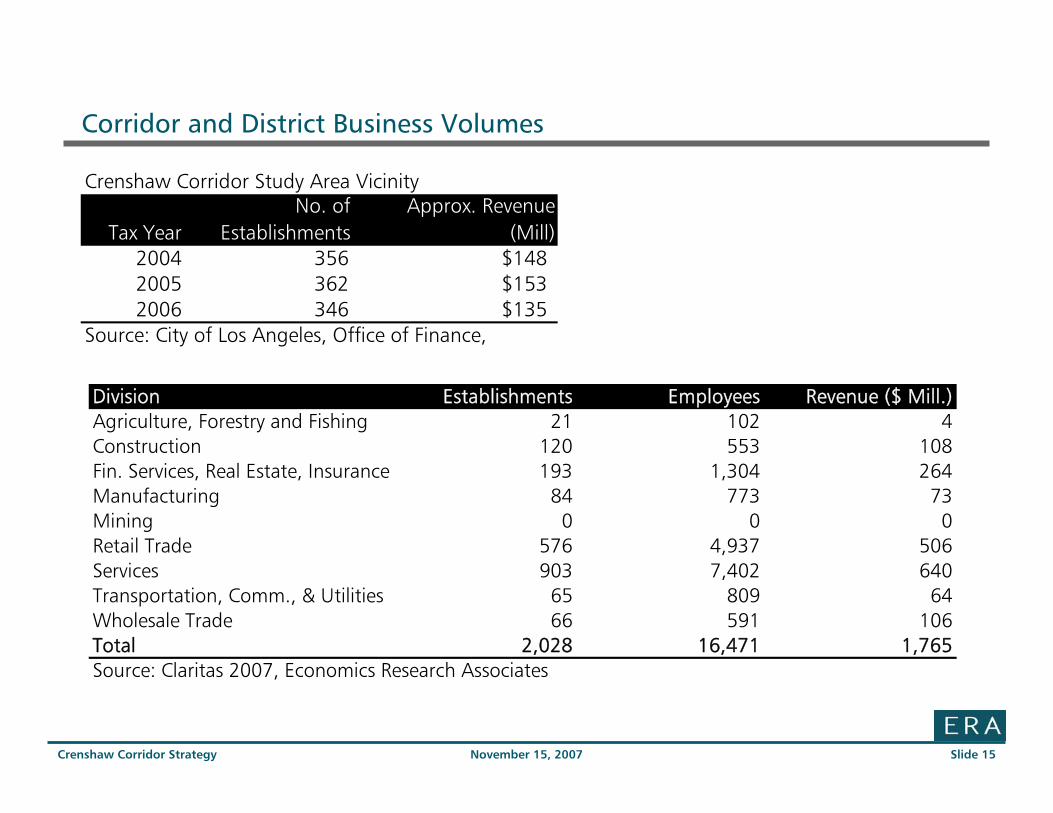
Corridor and District Business Volumes
Crenshaw Corridor Study Area Vicinity
Tax YearNo. of
EstablishmentsApprox. Revenue
(Mill)2004 356 $1482005 362 $1532006 346 $135
Source: City of Los Angeles, Office of Finance,
Division Establishments Employees Revenue ($ Mill.)Agriculture, Forestry and Fishing 21 102 4Construction 120 553 108Fin. Services, Real Estate, Insurance 193 1,304 264Manufacturing 84 773 73Mining 0 0 0Retail Trade 576 4,937 506Services 903 7,402 640Transportation, Comm., & Utilities 65 809 64Wholesale Trade 66 591 106Total 2,028 16,471 1,765Source: Claritas 2007, Economics Research Associates
November 15, 2007Crenshaw Corridor Strategy Slide 16
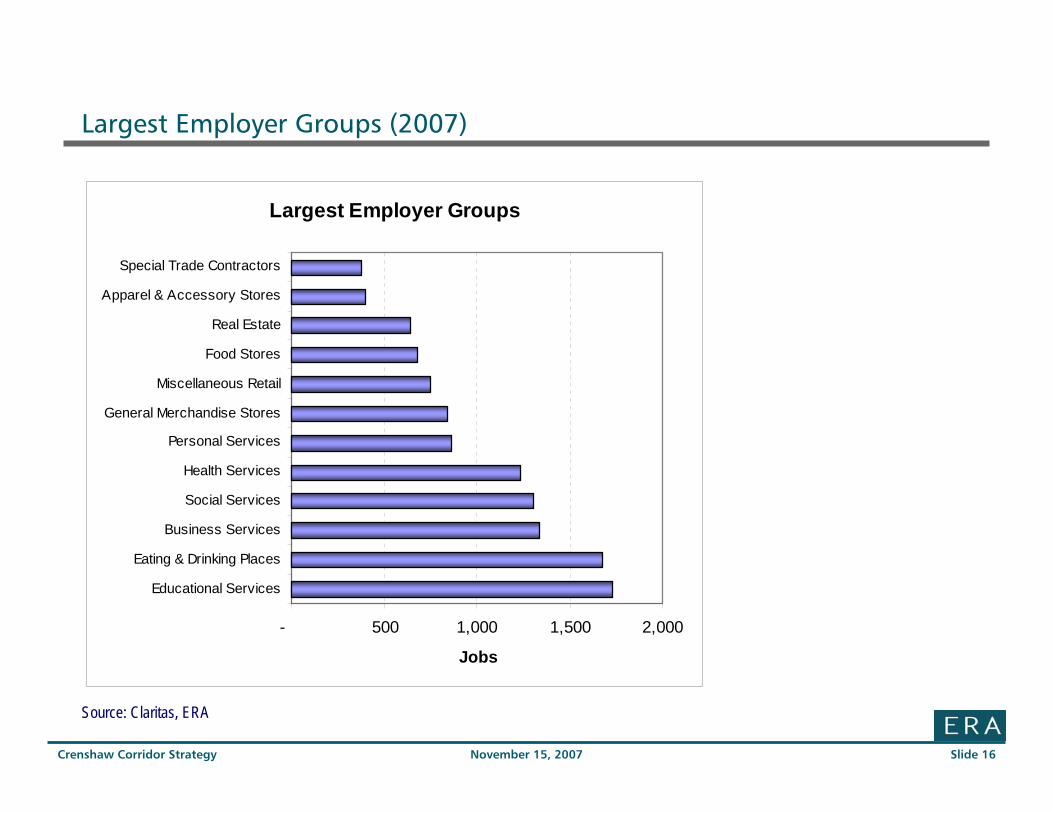
Largest Employer Groups (2007)
Source: Claritas, ERA
Largest Employer Groups
- 500 1,000 1,500 2,000
Educational Services
Eating & Drinking Places
Business Services
Social Services
Health Services
Personal Services
General Merchandise Stores
Miscellaneous Retail
Food Stores
Real Estate
Apparel & Accessory Stores
Special Trade Contractors
Jobs
November 15, 2007Crenshaw Corridor Strategy Slide 17
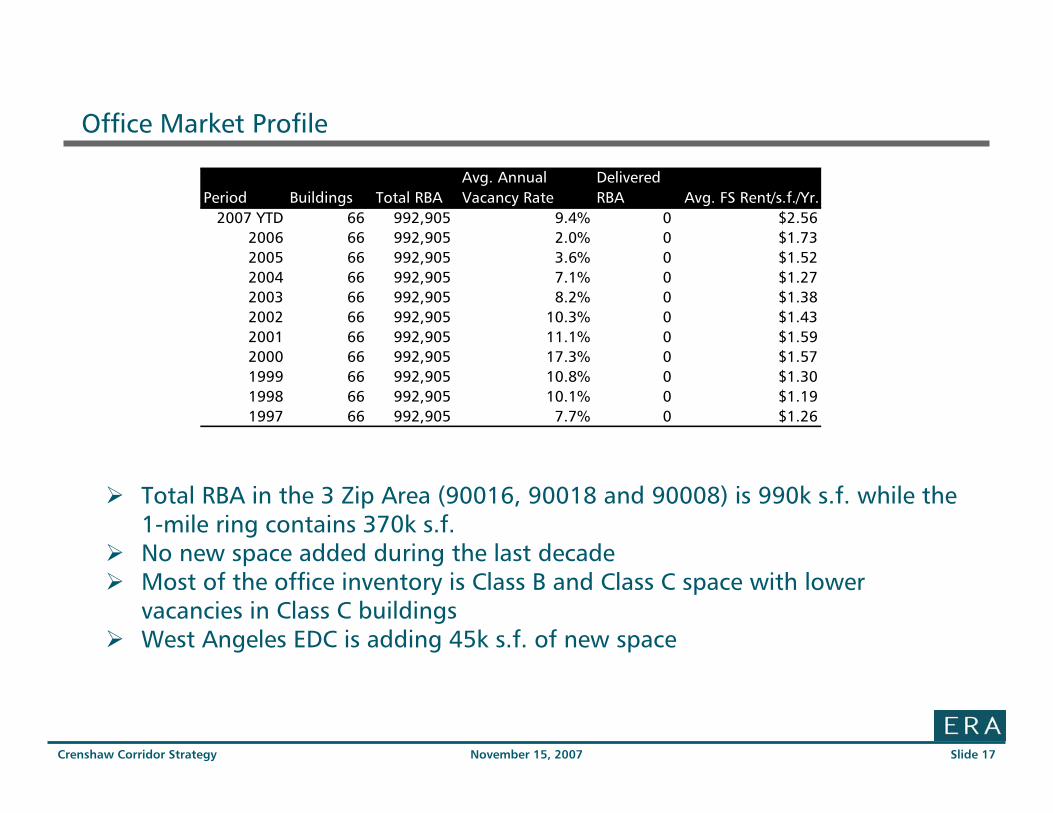
Office Market Profile
Total RBA in the 3 Zip Area (90016, 90018 and 90008) is 990k s.f. while the 1-mile ring contains 370k s.f.No new space added during the last decadeMost of the office inventory is Class B and Class C space with lower vacancies in Class C buildingsWest Angeles EDC is adding 45k s.f. of new space
Period Buildings Total RBAAvg. Annual Vacancy Rate
Delivered RBA Avg. FS Rent/s.f./Yr.
2007 YTD 66 992,905 9.4% 0 $2.562006 66 992,905 2.0% 0 $1.732005 66 992,905 3.6% 0 $1.522004 66 992,905 7.1% 0 $1.272003 66 992,905 8.2% 0 $1.382002 66 992,905 10.3% 0 $1.432001 66 992,905 11.1% 0 $1.592000 66 992,905 17.3% 0 $1.571999 66 992,905 10.8% 0 $1.301998 66 992,905 10.1% 0 $1.191997 66 992,905 7.7% 0 $1.26
November 15, 2007Crenshaw Corridor Strategy Slide 18
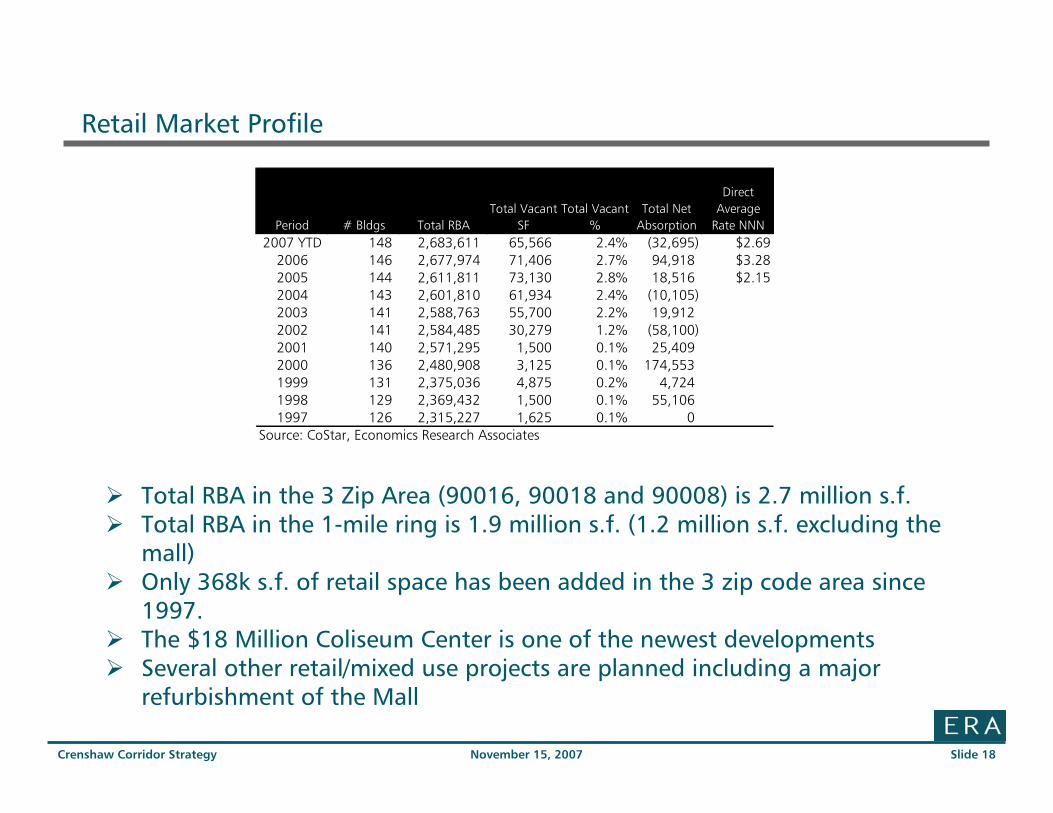
Retail Market Profile
Period # Bldgs Total RBATotal Vacant
SFTotal Vacant
%Total Net
Absorption
Direct Average
Rate NNN2007 YTD 148 2,683,611 65,566 2.4% (32,695) $2.69
2006 146 2,677,974 71,406 2.7% 94,918 $3.282005 144 2,611,811 73,130 2.8% 18,516 $2.152004 143 2,601,810 61,934 2.4% (10,105)2003 141 2,588,763 55,700 2.2% 19,9122002 141 2,584,485 30,279 1.2% (58,100) 2001 140 2,571,295 1,500 0.1% 25,409 2000 136 2,480,908 3,125 0.1% 174,553 1999 131 2,375,036 4,875 0.2% 4,724 1998 129 2,369,432 1,500 0.1% 55,106 1997 126 2,315,227 1,625 0.1% 0
Source: CoStar, Economics Research Associates
Total RBA in the 3 Zip Area (90016, 90018 and 90008) is 2.7 million s.f.Total RBA in the 1-mile ring is 1.9 million s.f. (1.2 million s.f. excluding the mall)Only 368k s.f. of retail space has been added in the 3 zip code area since 1997. The $18 Million Coliseum Center is one of the newest developmentsSeveral other retail/mixed use projects are planned including a major refurbishment of the Mall
November 15, 2007Crenshaw Corridor Strategy Slide 19
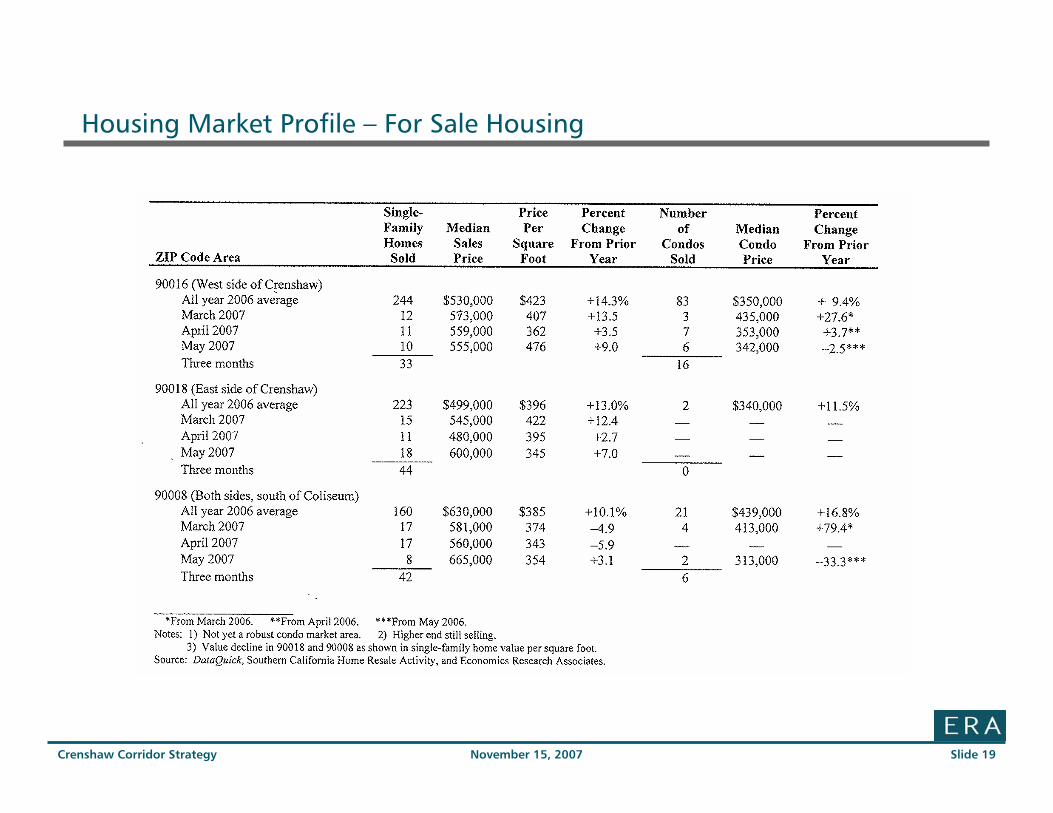
Housing Market Profile – For Sale Housing
November 15, 2007Crenshaw Corridor Strategy Slide 20
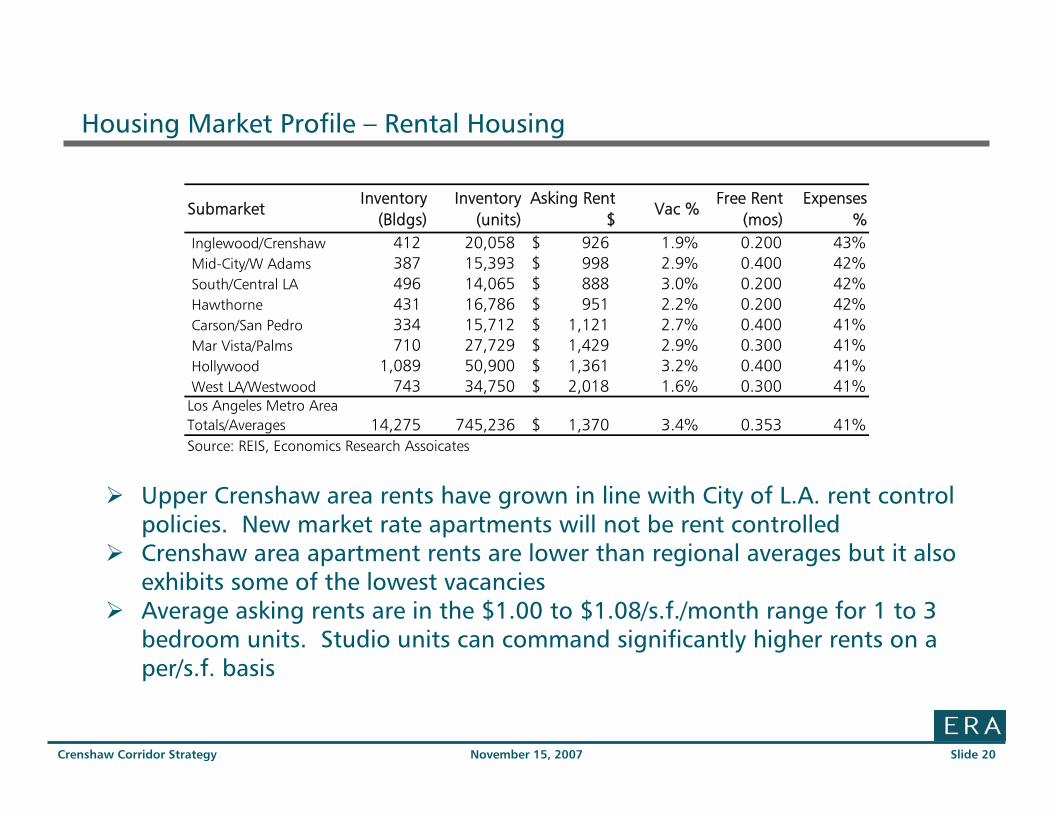
Housing Market Profile – Rental Housing
SubmarketInventory
(Bldgs)Inventory
(units)Asking Rent
$Vac %
Free Rent (mos)
Expenses %
Inglewood/Crenshaw 412 20,058 926$ 1.9% 0.200 43% Mid-City/W Adams 387 15,393 998$ 2.9% 0.400 42% South/Central LA 496 14,065 888$ 3.0% 0.200 42% Hawthorne 431 16,786 951$ 2.2% 0.200 42% Carson/San Pedro 334 15,712 1,121$ 2.7% 0.400 41% Mar Vista/Palms 710 27,729 1,429$ 2.9% 0.300 41% Hollywood 1,089 50,900 1,361$ 3.2% 0.400 41% West LA/Westwood 743 34,750 2,018$ 1.6% 0.300 41%Los Angeles Metro Area Totals/Averages 14,275 745,236 1,370$ 3.4% 0.353 41%Source: REIS, Economics Research Assoicates
Upper Crenshaw area rents have grown in line with City of L.A. rent control policies. New market rate apartments will not be rent controlled Crenshaw area apartment rents are lower than regional averages but it also exhibits some of the lowest vacanciesAverage asking rents are in the $1.00 to $1.08/s.f./month range for 1 to 3 bedroom units. Studio units can command significantly higher rents on a per/s.f. basis
November 15, 2007Crenshaw Corridor Strategy Slide 21
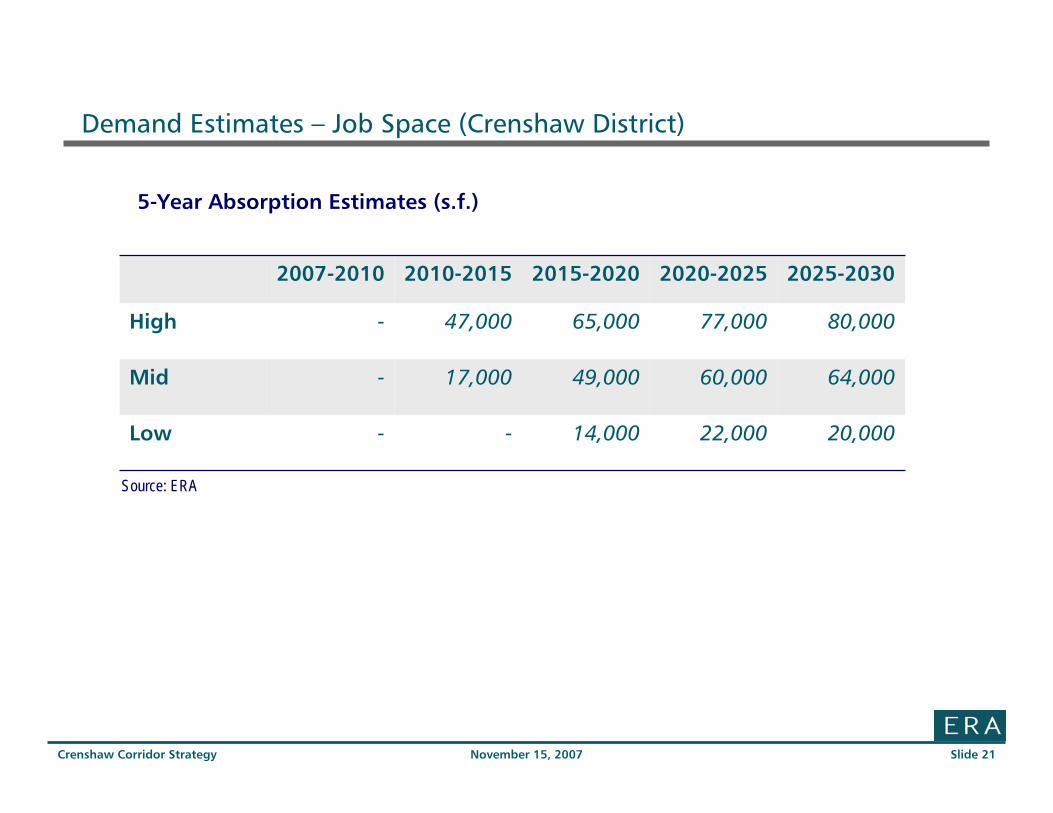
Demand Estimates – Job Space (Crenshaw District)
20,000 22,000 14,000 --Low
64,000 60,000 49,000 17,000 -Mid
80,000 77,000 65,000 47,000 -High
2025-20302020-20252015-20202010-20152007-2010
Source: ERA
5-Year Absorption Estimates (s.f.)
November 15, 2007Crenshaw Corridor Strategy Slide 22
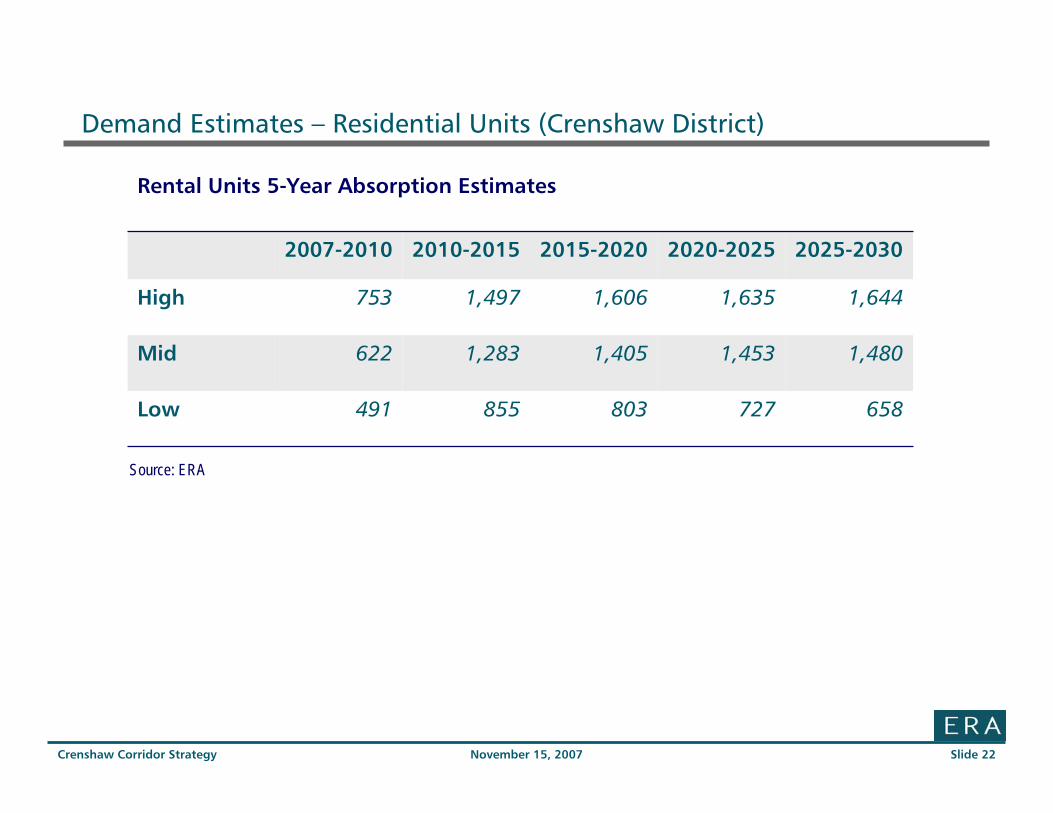
Demand Estimates – Residential Units (Crenshaw District)
658 727 803 855 491 Low
1,480 1,453 1,405 1,283 622 Mid
1,644 1,635 1,606 1,497 753 High
2025-20302020-20252015-20202010-20152007-2010
Rental Units 5-Year Absorption Estimates
Source: ERA
November 15, 2007Crenshaw Corridor Strategy Slide 23
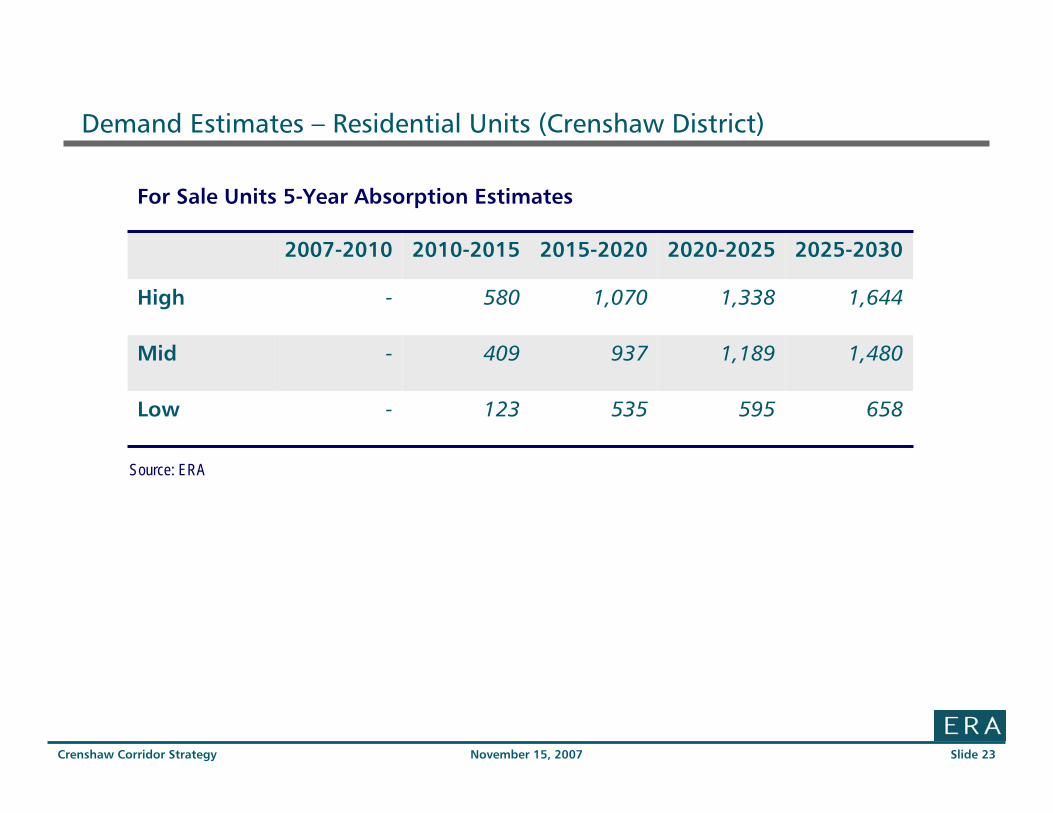
Demand Estimates – Residential Units (Crenshaw District)
658 595 535 123 -Low
1,480 1,189 937 409 -Mid
1,644 1,338 1,070 580 -High
2025-20302020-20252015-20202010-20152007-2010
For Sale Units 5-Year Absorption Estimates
Source: ERA
November 15, 2007Crenshaw Corridor Strategy Slide 24
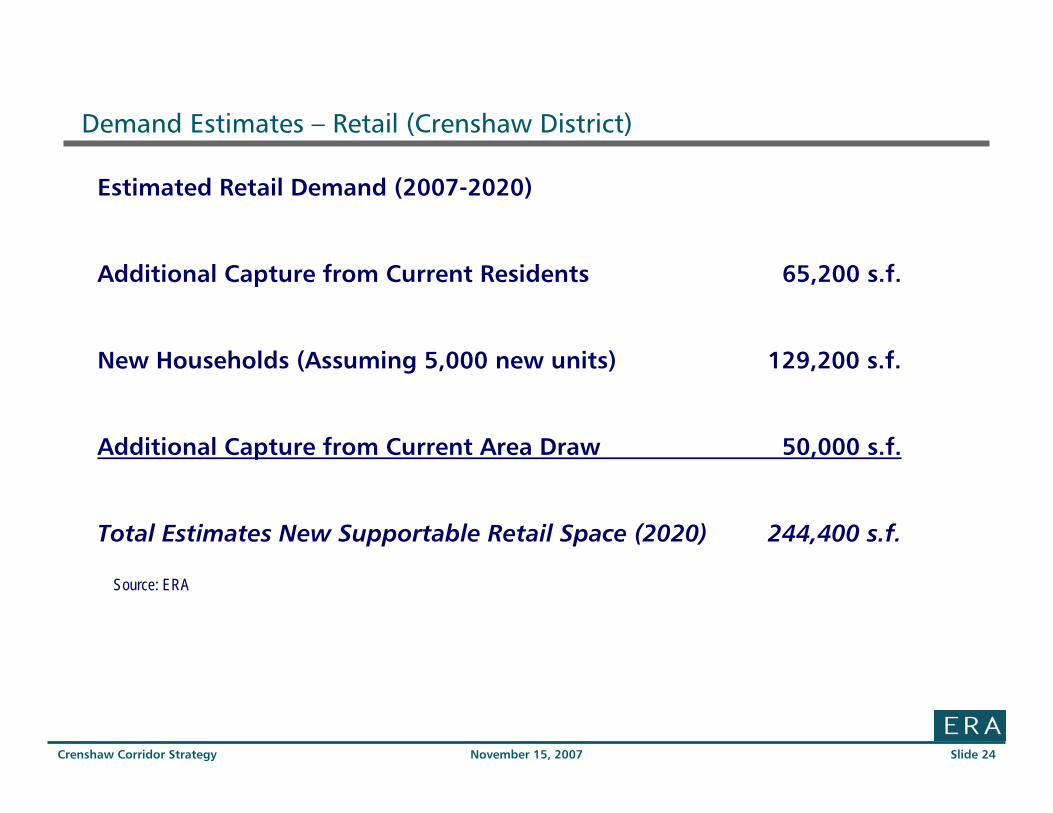
Demand Estimates – Retail (Crenshaw District)
Estimated Retail Demand (2007-2020)
Additional Capture from Current Residents 65,200 s.f.
New Households (Assuming 5,000 new units) 129,200 s.f.
Additional Capture from Current Area Draw 50,000 s.f.
Total Estimates New Supportable Retail Space (2020) 244,400 s.f.
Source: ERA
November 15, 2007Crenshaw Corridor Strategy Slide 25
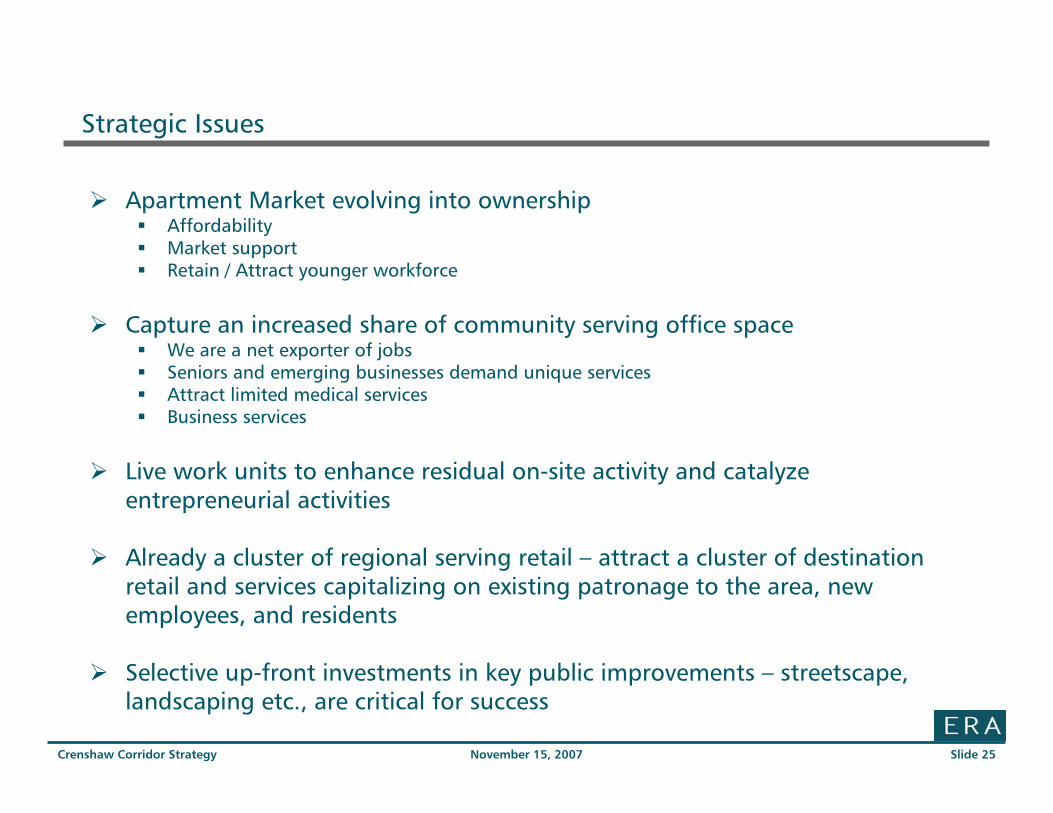
Strategic Issues
Apartment Market evolving into ownershipAffordabilityMarket supportRetain / Attract younger workforce
Capture an increased share of community serving office spaceWe are a net exporter of jobsSeniors and emerging businesses demand unique servicesAttract limited medical servicesBusiness services
Live work units to enhance residual on-site activity and catalyze entrepreneurial activities
Already a cluster of regional serving retail – attract a cluster of destination retail and services capitalizing on existing patronage to the area, new employees, and residents
Selective up-front investments in key public improvements – streetscape, landscaping etc., are critical for success
November 15, 2007Crenshaw Corridor Strategy Slide 26
QUESTIONS