Embed Size (px)
Citation preview

Smart Structures and Systems, Vol. 24, No. 6 (2019) 000-000
DOI: https://doi.org/10.12989/sss.2019.24.6.000 000
Copyright © 2019 Techno-Press, Ltd. http://www.techno-press.com/journals/sss&subpage=7 ISSN: 1738-1584 (Print), 1738-1991 (Online)
1. Introduction
Fusion power is an almost perfect energy source, owing
to its abundance, sustainability, and low cost (Cowley
2016). In China, the Experimental Advanced
Superconducting Tokamak (EAST) in Hefei has realized a
stable steady-state high confinement plasma continued for
101.2 s. Correspondingly, the construction of the China
Fusion Engineering Test Reactor (CFETR) will start in
2020 (Song et al. 2014). The International Thermonuclear
Experimental Reactor (ITER) is being built in Europe,
where realization of a demonstration electricity-producing
reactor (DEMO) is projected for the 2040s (Romanelli et al.
2012). The hope is that, in the next 50 years, nuclear fusion
energy will replace fossil fuels globally as the primary
energy source.
After verification of the principles governing nuclear
fusion, several key issues must be overcome for engineering
realization of these principles. One of these issues is the
sustainability of the plasma-facing component (PFC), i.e., a
key component of nuclear fusion plants (Knaster et al.
2016). Located inside the annular vacuum chamber, PFC
directly faces the plasma (operating temperature: hundreds
of millions of degrees) and protects the peripheral
Corresponding author, Ph.D., Professor E-mail: [email protected]
** Ph.D., Professor
E-mail: [email protected] a Ph.D. b Ph.D. Student c Ph.D. Student
components and equipment from the impact of high heat
flow and high-energy particle flow. The PFC undergoes
high heat flux loading and, hence, an understanding of the
component material behavior under high heat flux cyclic
loading is critical (Linke et al. 1997, Arnoux et al. 2011,
Wirtz et al. 2013).
This paper presents an experimental study on the creep
of stainless steel under high flux cyclic loading. The Digital
image correlation (DIC) technique was used to measure the
strain at high temperature, owing to its attributes such as
simple equipment, high measurement accuracy, and strong
resistance to environmental noise (Yan et al. 2018, Zhang et
al. 2018). This technique is used to find the same physical
point in different images (Sutton et al. 2009, Xue et al.
2017, Aggelis et al. 2016). Employing blue light
illumination and a band-pass filter, Grant et al. used the
DIC method to measure the deformation occurring at
temperatures of up to 1100 °C (Grant et al. 2009). Pan et al.
fabricated a speckle pattern using cobalt oxide and
measured the coefficient of thermal expansion
corresponding to chromium-nickel austenitic stainless steel
at 1200°C (Pan et al. 2011). Guo et al. used the DIC
method to measure the elastic constants of graphite
materials at 500°C (Guo et al. 2014). Using microscopic
DIC, Chen et al. investigated the residual stress in thermal
barrier ceramic coatings under thermal shock loading of
1100°C (Chen et al. 2014). Wu et al. developed an optical
measurement system using 2D-DIC to evaluate the strain on
the heated front surfaces of components at 1200°C (Wu et
al. 2019). Hu et al. fabricated a speckle pattern via laser
engraving and achieved satisfactory mechanical properties
of the magnesium alloy exposed to high temperatures (Hu
et al. 2018a, b). Ye et al. (2013, 2015, 2016a, b, 2017) have
employed DIC technology for various studies that have
Creep of stainless steel under heat flux cyclic loading (500-1000°C) with different mechanical preloads in a vacuum environment using 3D-DIC
Yong Su1,2a, Zhiwei Pan1b, Yongpei Peng1c, Shenghong Huang1 and Qingchuan Zhang1**
1CAS Key Laboratory of Mechanical Behavior and Design of Materials, Department of Modern Mechanics, University of Science and Technology of China, Hefei 230027, China
2IAT-Chungu Joint Laboratory for Additive Manufacturing, Anhui Chungu 3D Printing Institute of Intelligent Equipment and Industrial Technology, Wuhu 241200, China
(Received June 11, 2019, Revised August 12, 2019, Accepted August 21, 2019)
Abstract. In nuclear fusion reactors, the key structural component (i.e., the plasma-facing component) undergoes high heat
flux cyclic loading. To ensure the safety of fusion reactors, an experimental study on the temperature-induced creep of stainless
steel under heat flux cyclic loading was performed in the present work. The strains were measured using a stereo digital image
correlation technique (3D-DIC). The influence of the heat haze was eliminated, owing to the use of a vacuum environment. The
specimen underwent heat flux cycles (500°C-1000°C) with different mechanical preloads (0 kN, 10 kN, 30 kN, and 50 kN). The
results revealed that, for a relatively large preload (for example, 50 kN), a single temperature cycle can induce a residual strain of
up to 15000
Keywords: digital image correlation; nuclear fusion; high temperature measurement; creep; vacuum chamber

Yong Su, Zhiwei Pan, Yongpei Peng, Shenghong Huang and Qingchuan Zhang
included structural characterization and assessment.
Nowadays, DIC is the strain metrology most widely used in
high-temperature environments.
The application of the DIC method in high-temperature
environments has been widely reported, but only a few
reports have focused on the full-field measurement of
dynamic thermal strains in high-temperature environments.
Specifically, few studies have considered the residual strain
associated with the working conditions (i.e., vacuum and
high temperatures) of a nuclear fusion reactor. Hence, in
this work, the application of the DIC method to
temperature-induced creep is investigated.
This paper is organized as follows. Section 2 introduces
the methods and principles. Sections 3, 4, 5, and 6 present
the experimental procedures, experimental results, strain
variation in an individual temperature cycle, and
conclusions of this work, respectively.
2. Methods and principles
2.1 High heat flow comprehensive experimental platform
To investigate the material behavior in nuclear fusion
environments, a high heat flow comprehensive experimental
platform was established by Prof. Huang’s Group at the
University of Science and Technology of China with the
support of CFETR. This platform consists of: a vacuum
chamber, a commercial 3D-DIC system (PMLAB DIC-3D,
Nanjing PMLAB Sensor Tech. Co., Ltd.), a mechanical
loading system (30 kN for stretching and compression, 5
kNm for bending), an induction heating system (200 kW), a
cooling circulation system (0-4 MPa, RT-200°C 7 m3/h), an
electron gun (20 kW, 85 keV, 350 mA, scanning speed 10k),
and a YAG high power laser (20 J/0.3-1ms). Equipped with
multiple advanced measurement systems, this platform can
simulate the cooling environment of nuclear fusion in
service, can couple multiple loads (thermal/mechanical),
and can be used for both material and component
experiments. The establishment of this platform is the
premise of current work.
2.2 Stereo digital image correlation technique
A stereo digital image correlation (3D-DIC) technique
was employed to measure the full-field deformation of the
specimen at high temperature. Previous studies including
high-temperature deformation measurements are generally
limited to the use of two-dimensional digital image
correlation (2D-DIC) (Wang et al. 2015, Sakanashi et al.
2016, Valeri et al. 2017, Wang et al. 2017). Compared with
3D-DIC, 2D-DIC has several drawbacks: 1. a flat specimen
is required for 2D-DIC; 2. for 2D-DIC, the optical axis must
be perpendicular to the specimen (Xu et al. 2017a, Lv et al.
2018); 3. 2D-DIC is sensitive to out-of-plane deformation.
Hence, if 3D-DIC is available, 3D-DIC (rather than 2D-
DIC) should be used (Sutton et al. 2008).
Fig. 1 Schematic of experimental setup. The vacuum
chamber provides two observation windows for 3D-DIC
Fig. 2 Transmission of the band-pass filter and the
spectral radiance calculated by Planck’s law
To utilize 3D-DIC, the high heat flow comprehensive
experimental platform provides two observation widows, as
shown in Fig. 1. With two pre-calibrated cameras, the entire
deformation field could be retrieved.
2.3 Pattern fabrication
The metrological performance of DIC is strongly
dependent on the quality of the speckle pattern (Chen et al.
2018). The speckle pattern should be isotropic, uniform,
and exhibit high image contrast (Sutton et al. 2009).
Specifically, for high-temperature measurements, the
speckle-making materials should be resistant to high
temperatures and have good adhesion.
The speckle pattern was fabricated as follows. First, the
white background was fabricated using a commercial
ceramic coating material Pyro-Paint 634-AL (Aremco
Products, Inc.). In general, the material is able to withstand
temperatures of up to 1760°C. The paint Pyro-Paint 634-AL
is composed of two ingredients: powder 634-AL-P and
liquid 634-AL-L. The powder and liquid were mixed in a
3:1 ratio by weight. This mixture was then sprayed onto the
specimen using a spray gun. Afterward, the specimen was
dried at room temperature for 2 h, and then subjected to a
heat cure at 93°C for 2 h. The black speckles were produced
by HiE-Coat 840-C (Aremco Products, Inc.). According to
the specifications, this material can resist temperatures of

Creep of stainless steel under heat flux cyclic loading (500-1000°C) with different mechanical preloads
up to 1371°C. HiE-Coat 840-C is a jet-black and water-
based ceramic coating. The black coating material was
transferred to the surface of the specimen using a pointed
bamboo stick. The specimen was then dried at room
temperature for 24 h.
2.4 Filtering
At high temperature, the specimen will radiate visible
light. Blue light (wavelength: 450 nm) and a band-pass
filter (MID Opt BN470-30.5, Midwest Optical Systems,
Inc.) were used to reduce the influence of radiation. The
transmission of the optical filter is shown in Fig. 2.
According to Planck’s equation, the spectral radiance is
given as follows
( )( )
2
5
B
2 1, ,
exp / 1
hcB T
hc k T
=
− (1)
Where, h is Plank’s constant, c is the speed of light, kB is
Boltzmann’s constant, and is the wavelength. The spectral
radiance of different temperatures is shown in Fig. 2. When
the temperature is lower than 1000°C, the filter can remove
virtually all spectral radiance of the specimen.
3. Experiment
Inside the chamber, a stainless steel specimen was fixed
using two grips, as shown in Figs. 3(a) and 3(b). An
induction coil, placed just behind the specimen, was used to
heat the specimen; non-uniform heating of the specimen
was expected, because the temperature distribution of the
plasma-facing component is non-uniform in practical
applications. The temperature was measured using a
thermocouple, which was inserted into a hole drilled in the
upper surface of the specimen (see Fig. 3(c) for a close view
of the specimen; speckle size: 9 pixels).
The door of the chamber was closed. A commercial 3D-
DIC system (PMLAB DIC-3D, Nanjing PMLAB Sensor
Tech. Co., Ltd.) was placed outside the chamber to measure
the entire deformation field, as shown in Fig. 3(d). This 3D-
DIC system consisted of two monochrome cameras
(GRAS-50S5M/C, Point Grey Research, Inc., Resolution
2448×2048), two 23-mm prime lens (Schneider Optics,
Inc.), two band-pass optical filters (MID Opt BN470-30.5,
Midwest Optical Systems, Inc.), two blue light sources
(PMLAB BLS), and a tripod (Manfrotto 161MK2B). An
optical filter was mounted in front of each lens to filter out
the black radiation of the specimen. The positions and
directions of both cameras were carefully adjusted to
maximize the specimen field of view. To reduce the
influence of refraction, the optical axis of each camera was
positioned perpendicular to the window (Gupta et al. 2014).
Figure 4(a) shows the images acquired by the cameras. The door of the chamber was opened. A calibration
target, which is fabricated from aluminium foam, was used
to calibrate the intrinsic and extrinsic parameters of the two
(a) High-temperature environmental chamber (b) Loading device
(c) Close view of the specimen (d) PMLAB DIC-3D system
Fig. 3 Experimental set-up

Yong Su, Zhiwei Pan, Yongpei Peng, Shenghong Huang and Qingchuan Zhang
cameras. The calibration target consists of a 12×9 grid of
circles, with a distance of 15 mm between successive
circles. The calibration images were processed by the
calibration module of the PMLAB DIC system (see Table 1
for the corresponding results). In Table 1, Cx and Cy denote
the principal point; fx, fy, and fs represent focal lengths in
unit of pixels; , , and represent the relative rotation of
the two cameras; tx, ty, and tz represent the translation of the
two cameras; k1 is the parameter describing the radial
distortion of the lens (Gao et al. 2017, Zhang et al. 2018).
The door of the chamber was closed again and the
chamber was sealed. The air was pumped out using a
mechanical pump and an ion pump, and a vacuum of 10-3
Pa was achieved. In such an environment, the thermal
conductance was extremely small (Xiong et al. 2007, Cheng
et al. 2008, Wu et al. 2013). In addition, the liquid cooling
system was embedded in the observation window. The
temperature rise of the observation window resulting from
the thermal radiation was therefore extremely small and was
unfelt by touch and, consequently, the refraction variation
outside the chamber was marginal. Furthermore, usage of
the vacuum environment eliminated the heat haze caused by
refraction variation inside the chamber. In general, the
influence of this variation (induced by high temperature)
was reduced, owing to the vacuum environment.
Black precipitation appeared on the surface of the
specimen after first heating and remained unchanged in the
subsequent cycles. The chamber contained no air and,
hence, this black substance resulted probably from the
precipitation of carbon in stainless steel. This precipitation
may cause pattern decorrelations, leading to significant
deterioration in the measurement performance.
To tackle this issue, we introduced a pre-heating
process, where the specimen was heated to 1000°C (see Fig.
4(b) for an image of the specimen after this process). The
images that contain black precipitation were used as the
reference images in the DIC analysis. Subsequently, the
specimen was heated to simulate the heat flux associated
with nuclear fusion. The specimen, with no mechanical
load, was heated until the temperature reached 1000°C.
Camera acquisition of the images was performed for 300 s
at a rate of 1 frame/s. The loads (10 kN, 30 kN, and 50 kN)
were then specified. For each mechanical load, three
temperature cycles were conducted, where the specimen
was heated to a temperature of 1000°C during each cycle.
Table 1 Calibration results of the measurement
parameter left camera right camera
Cx 1308.13 pixel 1198.62 pixel
Cy 1033.42 pixel 1027.15 pixel
fx 6775.42 pixel 6683.69 pixel
fy 6779.69 pixel 6685.22 pixel
fs 1.43 pixel -0.34 pixel
α 0 rad -0.01 rad
β 0 rad 0.55 rad
γ 0 rad -0.01 rad
tx 0 mm -445.93 mm
ty 0 mm 2.51 mm
tz 0 mm 122.86 mm
k1 -0.16 -0.18
Fig. 4 Image (a) before and (b) after the pre-heating

Creep of stainless steel under heat flux cyclic loading (500-1000°C) with different mechanical preloads
(a) Temperatures measured by the thermal couple (b) Mechanical load determined by the sensor
Fig. 5 Temperature and mechanical-load variation with time.
(a) Images obtained at 500 °C and 1000 °C (b) The paint buckled in the final stages of the experiment
Fig. 6 The speckle pattern could tolerate high temperatures and finally failed via buckling.
(a) Region of interest and the seed point (b) The change of strain xx over time
Fig. 7 Region of interest and strains measured by DIC

Yong Su, Zhiwei Pan, Yongpei Peng, Shenghong Huang and Qingchuan Zhang
Image acquisition started at a temperature of 500 °C and
lasted for 360 s (see Table 2 for a summary of the image
acquisition time and number of repetitions). The results in
Figs. 5(a) and 5(b) show the temperature measured by the
thermal couple (the heat flux is observed) and the
mechanical loads, respectively.
Thanks to the blue light illumination and band-pass
filter, the black radiation of the specimen was virtually
eliminated. Fig. 6(a) shows the images obtained at 500°C
and 1000°C. The good contrast of the speckle pattern was
maintained even at a temperature of 1000°C. However, the
fabricated speckle pattern buckled and, as shown in Fig.
6(b), was no longer adhered to the specimen surface in the
final stages of the experiment.
Fig. 8 Strain field of xx at 1000 °C. The upper, middle, and lower rows correspond to mechanical preloads of 10 kN, 30
kN, and 50 kN, respectively, and the three columns correspond to three repetitions of each load
(a) Variation in strain and temperature over time (b) Temperature dependence of strain
Fig. 9 Strain and temperature variation

Creep of stainless steel under heat flux cyclic loading (500-1000°C) with different mechanical preloads
(a) strain field at time a (reference image at time o)
(b) strain field at time d (reference image at time l)
(c) The strain field at time g (reference image at time p)
Fig. 10 Strain field at different times
Table 2 Image acquisition time an the numbers of
repetitions
Load (kN) Acquisition time (s) Number of repetitions
0 300 1
10 360 3
30 360 3
50 360 3
4. Results The images were analyzed using the correlation module
of commercial DIC system PMLAB DIC-3D. The region of
interest and the seed point are shown in Fig. 7(a). In this
work, we focus on the creep under mechanical preloads
and, hence, the images at time o (see Fig. 5(a)) are selected
as the reference images; that is, the strain at time o is
regarded as zero. The grid step, subset size, and boundary
validation are 5 pixels, 39 pixels, and 80%, respectively.
PMLAB DIC-3D utilizes a modified version of the inverse
compositional Gauss-Newton method for subpixel
registration (Gao et al. 2015, Shao et al. 2015). The
interpolation algorithm is a bi-cubic B-spline (Pan et al.
2016, Gao et al. 2016, Liu et al. 2019). In addition, a first-
order shape function is employed (Xu et al. 2015, 2017b)
and the similarity is characterized via the zero-mean
normalized sum of squared difference.
Fig. 8 illustrates the strain filed xx calculated via 3D-
DIC at 1000°C. The results shown in Figs. 8(a)-8(i)
correspond to times a-i, respectively, in Fig. 5(a). The
results corresponding to mechanical preloads of 10 kN, 30
kN, and 50 kN are shown in the top, middle, and bottom
rows, respectively, and the three columns correspond to the
three repetitions of each loading. As Fig. 8 shows, with
increasing mechanical preload, the strain increases and the
deformation becomes increasingly localized. The strain in
Fig. 8(i) is non-symmetric, as evidenced by buckling of the
paint (see Fig. 6(b)). To analyze the strain, a rectangular
region is chosen and the average strain inside this region is
determined (see Fig. 7(b)). The results reveal that the
residual strain increases with increasing mechanical
preload, and is quite significant at a preload of 50 kN.
The mechanical load is time dependent, as shown in Fig.
5(b). Nevertheless, the influence of the mechanical-load
variation is negligible, because the thermally induced strain
is considerably larger than the mechanically induced stain.
For example, at time t=1380 s, the mechanical load
increases by 20 kN and, hence, the strain is discontinuous
and increases (see Fig. 7(b)). This increase is, however,
relatively small compared with the thermally induced strain;
since the variation in the mechanical load is <<20 kN, the
influence of this variation could be ignored.
Changes in the temperature and strain over time are
further investigated by combining Figs. 5(a) and 7(b) into
Fig. 9(a). Fig. 9(b) shows the temperature dependence of
the strain. When the mechanical preload is relatively small,
the residual strain is negligible, whereas for a relatively
large preload (e.g., 50 kN), the residual strain is quite
significant.
5. Discussion
The evolution of deformation in an individual heat cycle
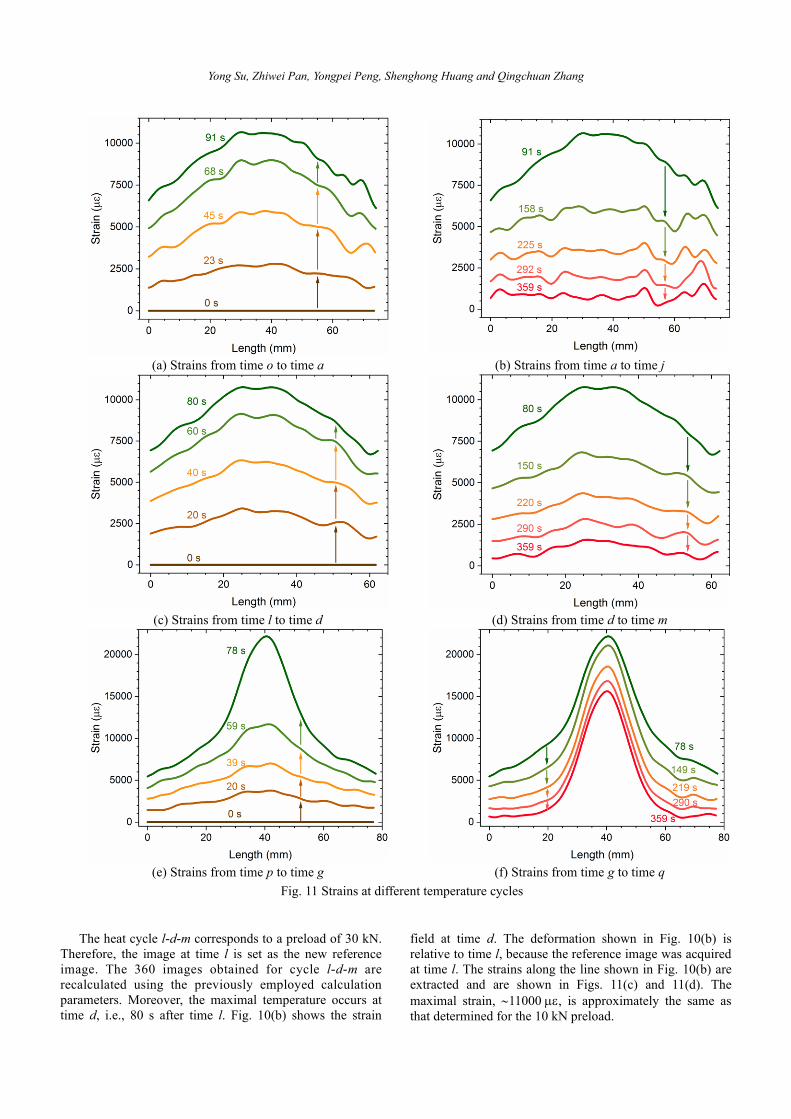
is evaluated by analyzing the deformations in cycles o-a-j,
l-d-m, and p-g-q (see Fig. 7(b)), corresponding to
mechanical loads of 10kN, 30kN, and 50kN, respectively.
The temperature cycle o-a-j corresponds to a mechanical
preload of 10 kN. The maximal temperature occurs at time
a, i.e., 91 s after time o. Fig. 10(a) shows the strain field at
time a. The strain variation is illustrated (see Figs. 11(a) and
11(b)) by extracting the strains along the line shown in Fig.
10(a). The plots in Figs. 11(a) and 11(b) show the strains
generated during the o-a heating process and the strain
occurring at the end of the process, respectively. During
heating, the strains at the center are larger than those at the
two sides, and the maximal strain is 11000 .
Yong Su, Zhiwei Pan, Yongpei Peng, Shenghong Huang and Qingchuan Zhang
The heat cycle l-d-m corresponds to a preload of 30 kN.
Therefore, the image at time l is set as the new reference
image. The 360 images obtained for cycle l-d-m are
recalculated using the previously employed calculation
parameters. Moreover, the maximal temperature occurs at
time d, i.e., 80 s after time l. Fig. 10(b) shows the strain
field at time d. The deformation shown in Fig. 10(b) is
relative to time l, because the reference image was acquired
at time l. The strains along the line shown in Fig. 10(b) are
extracted and are shown in Figs. 11(c) and 11(d). The
maximal strain, 11000 , is approximately the same as
that determined for the 10 kN preload.
(a) Strains from time o to time a (b) Strains from time a to time j
(c) Strains from time l to time d (d) Strains from time d to time m
(e) Strains from time p to time g (f) Strains from time g to time q
Fig. 11 Strains at different temperature cycles

Creep of stainless steel under heat flux cyclic loading (500-1000°C) with different mechanical preloads
The heat cycle p-g-q corresponds to a preload of 50 kN.
The image at time p is set as the new reference image, and
the images in cycle p-g-q are recalculated. Furthermore, the
maximal temperature occurred at time g, i.e., 78 s after time
p. Fig. 10(c) shows the strain field at time g, where the
reference image is obtained at time p and the deformation
shown corresponds to this time. The strains along the line
shown in Fig. 10(c) are extracted and are depicted in Figs.
11(e) and 11(f). The maximal strain is 22000 which is
considerably larger than the strain associated with loads of
10 kN and 30 kN. Moreover, the deformation becomes quite
localized, and a maximum residual strain of 15000 is
noted.
Movies showing the evolution of the deformation can be
found in an open digital library (Su 2019).
6. Conclusions
Full-field measurements of thermally induced creep are
essential for structural materials exposed to the working
conditions associated with nuclear fusion reactors. In this
work, the temperature-induced creep of stainless steel under
heat flux cyclic loading with different mechanical preloads
in a vacuum environment was experimentally evaluated
using 3D-DIC. The influence of the heat haze was
eliminated, owing to the use of the vacuum environment.
Compared with 2D-DIC, the 3D-DIC technique used in this
work exhibited superior measurement performance. With
different mechanical preloads (0 kN, 10 kN, 30 kN, and 50
kN), the specimen underwent heat flux cycles from 500°C
to 1000°C.
The full-field deformations caused by the mechanical
and thermal loads were measured. The results revealed that
for a relatively large preload (e.g., 50 kN), the residual
strain induced by heat flux cyclic loading is quite
significant, reaching levels of up to 15000 . To the
authors’ knowledge, this is the first experimental study
employing 3D-DIC for full-time strain measurements under
heat flux cyclic loading with different mechanical preloads.
The novelty of this paper is as follows: (1) the
emergence and the evolution of a full-field thermally
induced residual strain was measured using 3D-DIC; (2) the
residual strain increased significantly and became quite
localized when the mechanical preload exceeded a certain
value (for example, 50 kN).
Acknowledgments
This work is supported by the National Natural Science
Foundation of China (Grant Nos. 11627803, 11702287,
11872354), the National Magnetic Confinement Fusion
Science Program of China (Grants Nos. 2015GB121007),
the Strategic Priority Research Program of the Chinese
Academy of Sciences (XDB22040502), and the
Fundamental Research Funds for the Central Universities
(WK2480000004).
References Aggelis, D.G., Verbruggen, S., Tsangouri, E., Tysmans, T. and Van
Hemelrijck, D. (2016), “Monitoring the failure mechanisms of a
reinforced concrete beam strengthened by textile reinforced
cement using acoustic emission and digital image correlation”,
Smart. Struct. Syst. 17(1), 91-105. https://doi.org/10.12989/sss.2016.17.1.091.
Arnoux, G., Bazylev, B., Lehnen, M., Loarte, A., Riccardo, V.,
Bozhenkov, S., Devaux, S., Eich, T., Fundamenski, W., Hender,
T., Huber, A., Jachmich, S., Kruezi, U., Sergienko, G. and
Thomsen, H. (2011). “Heat load measurements on the JET first
wall during disruptions”, J. Nucl. Mater. 415(1), S817-S820. DOI: 10.1016/j.jnucmat.2010.11.042.
Chen, X.M., Liu, Z.W. and Yang Y. (2014). “Residual stress
evolution regularity in thermal barrier coatings under thermal
shock loading”, Theor. Appl. Mech. Lett. 4(2), 021009. DOI: 10.1063/2.1402109.
Chen, Z.N., Shao, X.X., Xu, X.Y. and He, X.Y. (2018).
“Optimized digital speckle patterns for digital image correlation
by consideration of both accuracy and efficiency”, Appl. Opt.
57(4), 884-893. DOI: 10.1364/AO.57.000884.
Cheng, T., Zhang, Q.C., Wu, X.P., Chen, D.P and Jiao, B.B.
(2008). “Uncooled infrared imaging using a substrate-free focal-
plane array”, IEEE Electron Device Lett. 29(11), 1218-1221. DOI: 10.1109/LED.2008.2004568.
Cowley, S.C. (2016), “The quest for fusion power”, Nat. Phys., 12,
384. DOI: 10.1038/nphys3719.
Gao, Y., Cheng, T., Su, Y., Xu, X.H., Zhang, Y. and Zhang, Q.C.
(2015), “High-efficiency and high-accuracy digital image
correlation for three-dimensional measurement”, Opt. Lasers
Eng., 65, 73-80. DOI: 10.1016/j.optlaseng.2014.05.013.
Gao, Z.R., Xu, X.H., Su, Y. and Zhang, Q.C. (2016),
“Experimental analysis of image noise and interpolation bias in
digital image correlation”, Opt. Lasers Eng., 81, 46-53. DOI: 10.1016/j.optlaseng.2016.01.002.
Gao, Z.R., Zhang, Q.C., Su, Y. and Wu, S.Q. (2017), “Accuracy
evaluation of optical distortion calibration by digital image
correlation”, Opt. Lasers Eng., 98, 143-152. DOI: 10.1016/j.optlaseng.2016.01.002.
Grant, B.M.B., Stone, H.J., Withers, P.J. and Preuss, M. (2009),
“High-temperature strain field measurement using digital image
correlation”, J. Strain Anal. Eng. Des., 44(4), 263-271. DOI: 10.1243/03093247JSA478.
Guo, B.Q., Wang, H.X., Xie, H.M. and Chen, P.W. (2014), “Elastic
constants characterization on graphite at 500°C by the virtual
fields method”, Theor. Appl. Mech. Lett., 4(2), 021010. DOI: 10.1063/2.1402110.
Gupta, S., Parameswaran, V., Sutton, M.A. and Shukla, A. (2014).
“Study of dynamic underwater implosion mechanics using
digital image correlation”, Proc. R. Soc. A-Math. Phys. Eng.
Sci., 470(2172), 20140576-20140576. DOI: 10.1098/rspa.2014.0576.
Hu, Y.J., Wang, Y.J., Chen, J.B. and Zhu, J.M. (2018a), “A new
method of creating high-temperature speckle patterns and its
application in the determination of the high-temperature
mechanical properties of metals”, Exp. Tech., 42(5), 523-532. DOI: 10.1007/s40799-018-0256-z.
Hu, Y.J., Liu, F., Zhu, W.D. and Zhu, J.M. (2018b). “Thermally
coupled constitutive relations of thermoelastic materials and
determination of their material constants based on digital image
correlation with a laser engraved speckle pattern”, Mech. Mat.
121, 10-20. DOI: 10.1016/j.mechmat.2018.02.002.
Knaster, J., Moeslang, A. and Muroga, T. (2016), “Materials
research for fusion”, Nat. Phys., 12, 424. DOI: 10.1038/NPHYS3735.
Linke, J., Akiba, M., Bolt, H., Breitbach, G., Duwe, R.,

Yong Su, Zhiwei Pan, Yongpei Peng, Shenghong Huang and Qingchuan Zhang
Makhankov, A., Ovchinnikov, I., Rodig, M. and Wallura, E.
(1997), “Performance of beryllium, carbon, and tungsten under
intense thermal fluxes”, J. Nucl. Mater., 241, 1210-1216. DOI: 10.1016/S0022-3115(97)80222-X.
Liu, Y., Zhang, Q.C., Su, Y., Gao, Z.R., Fang, Z. and Wu, S.Q.
(2019), “The mechanism of strain influence on interpolation
induced systematic errors in digital image correlation method”,
Opt. Lasers Eng., 121, 323-333. DOI: 10.1016/j.optlaseng.2019.04.023.
Lv, Z.Q., Xu, X.H., Yan, T.H., Cai, Y.L., Su, Y. and Zhang, Q.C.
(2018), “High-accuracy optical extensometer based on
coordinate transform in two-dimensional digital image
correlation”, Opt. Lasers Eng., 100, 61-70. DOI: 10.1016/j.opdaseng.2017.06.010.
Pan, B., Wu, D.F., Wang, Z.Y. and Xia, Y. (2011), “High-
temperature digital image correlation method for full-field
deformation measurement at 1200°C”, Meas. Sci. Technol.,
22(1), 015701. DOI: 10.1088/0957-0233/22/1/015701.
Pan, Z., Chen, W., Jiang, Z.Y., Tang, L.Q., Liu. Y.P. and Liu, Z.J.
(2016), “Performance of global look-up table strategy in digital
image correlation with cubic B-spline interpolation and bicubic
interpolation”, Theor. Appl. Mech. Lett., 6(3), 126-130. DOI: 10.1016/j.taml.2016.04.003.
Romanelli, F., Barabaschi, P., Borba, D., Federici, G., Horton, L.,
Neu, R., Stork, D. and Zohm, H (2012), “Fusion electricity: a
roadmap to the realization of fusion energy”.
Sakanashi, Y., Gungor, S., Forsey, A.N. and Bouchard, P. J (2016),
“Measurement of creep deformation across welds in 316h
stainless steel using digital image correlation”, Exp. Mech.,
57(2), 231-244. DOI: 10.1007/s11340-016-0245-z.
Shao, X.X., Dai, X.J. and He, X.Y. (2015), “Noise robustness and
parallel computation of the inverse compositional Gauss–
Newton algorithm in digital image correlation”, Opt. Lasers
Eng., 71, 9-19. DOI: 10.1016/j.optlaseng.2015.03.005.
Song, Y.T., Wu, S.T., Li, J.G., Wan, B.N., Wan, Y.X., Fu, P., Ye.
M.Y., Zheng, J.X., Lu, K., Gao, X.G., Liu. S.M., Liu, X.F., Lei,
M.Z., Peng, X.B. and Chen, Y. (2014), “Concept design of
CFETR Tokamak machine”, IEEE T. Plasma Sci., 42(3), 503-
509. DOI: 10.1109/TPS.2014.2299277.
Su, Y. (2019), “Creep of stainless steel under heat flux cyclic
loading (500-1000°C) using 3D-DIC”, figshare [retrieved 17 Jul
2019], DOI: 10.6084/m9.figshare.8940341.v1.
Sutton, M.A., Yan, J.H., Tiwari, V., Schreier, H.W. and Orteu, J.J.
(2008), “The effect of out-of-plane motion on 2D and 3D digital
image correlation measurements”, Opt. Lasers Eng., 46(10),
746-757. DOI: 10.1016/j.optlaseng.2008.05.005.
Sutton, M.A., Schreier, H.W. and Orteu, J.J. (2009), Image
Correlation for Shape, Motion and Deformation Measurements:
Basic Concepts, Theory and Applications, Springer Publishing
Company, Incorporated. DOI: 10.1007/978-0-387-78747-3.
Valeri, G., Koohbor, B., Kidane, A. and Sutton, M.A. (2017).
“Determining the tensile response of materials at high
temperature using DIC and the Virtual Fields Method”, Opt.
Lasers Eng., 91, 53-61. DOI: 10.1016/j.optlaseng.2016.11.004.
Wang, S., Yao, X.F., Su, Y.Q. and Ma, Y.J. (2015). “High
temperature image correction in DIC measurement due to
thermal radiation”, Meas. Sci. Technol. 26(9), 095006. DOI: 10.1088/0957-0233/26/9/095006.
Wang, W., Xu, C.H., Jin, H., Meng, S.H., Zhang, Y.M. and Xie,
H.W. (2017). “Measurement of high temperature full-field
strain up to 2000 °C using digital image correlation”, Meas. Sci.
Technol., 28(3), 035007. DOI: 10.1088/1361-6501/aa56d1.
Wirtz, M., Linke, J., Pintsuk, G., De Temmerman, G. and Wright,
G.M. (2013), “Thermal shock behaviour of tungsten after high
flux H-plasma loading”, J. Nucl. Mater., 443(1-3), 497-501. DOI: 10.1016/j.jnucmat.2013.08.002.
Wu, D.F., Lin, L.J., Ren, H.Y., Zhu, F.H. and Wang, H.T. (2019),
“High-temperature deformation measurement of the heated
front surface of hypersonic aircraft component at 1200°C using
digital image correlation”, Opt. Lasers Eng. 122: 184-194. DOI: 10.1016/j.optlaseng.2019.06.006.
Wu, J.X., Cheng, T., Zhang, Q.C., Zhang, Y., Mao, L., Gao, J.,
Chen, D.P. and Wu X.P. (2013). “Research of infrared imaging
at atmospheric pressure using a substrate-free focal plane
array”, Chin. Phys. Lett., 30(1), 010701. DOI: 10.1088/0256-
307X/30/1/010701.
Xiong, Z.M., Zhang, Q.C., Gao, J., Wu, X.P., Chen, D.P. and Jiao,
B.B. (2007), “The pressure-dependent performance of a
substrate-free focal plane array in an uncooled infrared imaging
system”, J. Appl. Phys., 102(11), 113524. DOI: 10.1063/1.2822333.
Xu, X.H., Su, Y., Cai, Y.L., Cheng, T. and Zhang, Q.C. (2015).
“Effects of various shape functions and subset size in local
deformation measurements using DIC”, Exp. Mech., 55(8),
1575-1590. DOI: 10.1007/s11340-015-0054-9. Xu, X.H., Zhang, Q.C., Su, Y., Cai, Y.L., Xue, W.W., Gao, Z.R.,
Xue, Y, Lv, Z.Q. and Fu, S.H. (2017a), “High-accuracy, high-
efficiency compensation method in two-dimensional digital
image correlation”, Exp. Mech., 57(6), 831-846. DOI: 10.1007/s11340-017-0274-2.
Xu, X.H., Su, Y. and Zhang, Q.C. (2017b), “Theoretical estimation
of systematic errors in local deformation measurements using
digital image correlation”, Opt. Lasers Eng., 88, 265-279. DOI: 10.1016/j.optlaseng.2016.08.016.
Xue, Y., Su, Y., Zhang, C., Xu, X.H., Gao, Z.R., Wu, S.Q., Zhang,
Q.C. and Wu, X.P. (2017), “Full-field wrist pulse signal
acquisition and analysis by 3D digital image correlation”, Opt.
Lasers Eng., 98, 76-82. DOI: 10.1016/j.optlaseng.2017.05.018. Yan, T.H., Su, Y. and Zhang, Q.C. (2018), “Precise 3D shape
measurement of three-dimensional digital image correlation for
complex surfaces”, Sci. China-Technol. Sci., 61(1), 68-73. DOI: 10.1007/s11431-017-9125-7.
Ye, X.W., Ni, Y.Q., Wai, T.T., Wong, K.Y., Zhang, X.M. and Xu, F.
(2013), “A vision-based system for dynamic displacement
measurement of long-span bridges: algorithm and verification”,
Smart. Struct. Syst., 12(3-4), 363-379. https://doi.org/10.12989/sss.2013.12.3_4.363.
Ye, X.W., Yi, T.H., Wen, C. and Su, Y.H. (2015), “Reliability-
based assessment of steel bridge deck using a mesh-insensitive
structural stress method”, Smart. Struct. Syst., 16(2), 367-382. https://doi.org/10.12989/sss.2015.16.2.367.
Ye, X.W., Dong, C.Z. and Liu, T. (2016a), “Image-based structural
dynamic displacement measurement using different multi-object
tracking algorithms”, Smart. Struct. Syst., 17(6), 935-956. https://doi.org/10.12989/sss.2016.17.6.935.
Ye, X.W., Dong, C.Z. and Liu, T. (2016b), “Force monitoring of
steel cables using vision-based sensing technology:
methodology and experimental verification”, Smart. Struct.
Syst., 18(3), 585-599. https://doi.org/10.12989/sss.2016.18.3.585.
Ye, X.W., Yi, T.H., Su, Y.H., Liu, T. and Chen, B. (2017), “Strain-
based structural condition assessment of an instrumented arch
bridge using FBG monitoring data”, Smart. Struct. Syst., 20(2),
139-150. https://doi.org/10.12989/sss.2017.20.2.139.
Zhang, X., Su, Y., Gao, Z.R., Xu, T., Ding, X.H., Yu, Q.F. and
Zhang, Q.C. (2018). “High-accuracy three-dimensional shape
measurement of micro solder paste and printed circuits based on
digital image correlation”, Opt. Eng., 57(5), 054101. DOI: 10.1117/1.OE.55.5.054101.


![HIGH-TEMPERATURE EXPERIMENTAL ......hardening [4] and power law (Norton) creep is used to model the creep deformation during the dwell period of each forming cycle. Cyclic plasticity](https://img.pdfslide.us/doc/110x75/5fc43384d5073f285b2220ba/high-temperature-experimental-hardening-4-and-power-law-norton-creep.jpg)


![International Journal of Scientific & Engineering Research ... · the cyclic hardening behaviour [1] ... low cycle fatigue, creep and ratcheting [2-6]. ... that characterizes the](https://img.pdfslide.us/doc/110x75/5b4fef987f8b9a2a6e8d4855/international-journal-of-scientific-engineering-research-the-cyclic-hardening.jpg)