Embed Size (px)
Citation preview
Creep-Fatigue Damage Investigation and Modeling of Alloy 617 at High Temperatures
by
Fraaz Tahir
A Dissertation Presented in Partial Fulfillment
of the Requirements for the Degree
Doctor of Philosophy
Approved April 2017 by the
Graduate Supervisory Committee:
Yongming Liu, Chair
Hanqing Jiang
Jay Oswald
Jagannathan Rajagopalan
Yang Jiao
ARIZONA STATE UNIVERSITY
May 2017
i
ABSTRACT
The Very High Temperature Reactor (VHTR) is one of six conceptual designs proposed
for Generation IV nuclear reactors. Alloy 617, a solid solution strengthened Ni-base
superalloy, is currently the primary candidate material for the tubing of the Intermediate
Heat Exchanger (IHX) in the VHTR design. Steady-state operation of the nuclear power
plant at elevated temperatures leads to creep deformation, whereas loading transients
including startup and shutdown generate fatigue. A detailed understanding of the creep-
fatigue interaction in Alloy 617 is necessary before it can be considered as a material for
nuclear construction in ASME Boiler and Pressure Vessel Code. Current design codes for
components undergoing creep-fatigue interaction at elevated temperatures require creep-
fatigue testing data covering the entire range from fatigue-dominant to creep-dominant
loading. Classical strain-controlled tests, which produce stress relaxation during the hold
period, show a saturation in cycle life with increasing hold periods due to the rapid stress-
relaxation of Alloy 617 at high temperatures. Therefore, applying longer hold time in
these tests cannot generate creep-dominated failure. In this study, uniaxial isothermal
creep-fatigue tests with non-traditional loading waveforms were designed and performed
at 850 and 950°C, with an objective of generating test data in the creep-dominant regime.
The new loading waveforms are hybrid strain-controlled and force-controlled testing
which avoid stress relaxation during the creep hold. The experimental data showed
varying proportions of creep and fatigue damage, and provided evidence for the
inadequacy of the widely-used time fraction rule for estimating creep damage under
creep-fatigue conditions. Micro-scale damage features in failed test specimens, such as
fatigue cracks and creep voids, were quantified using a Scanning Electron Microscope
ii
(SEM) to find a correlation between creep and fatigue damage. Quantitative statistical
imaging analysis showed that the microstructural damage features (cracks and voids) are
correlated with a new mechanical driving force parameter. The results from this image-
based damage analysis were used to develop a phenomenological life-prediction
methodology called the effective time fraction approach. Finally, the constitutive creep-
fatigue response of the material at 950°C was modeled using a unified viscoplastic model
coupled with a damage accumulation model. The simulation results were used to validate
an energy-based constitutive life-prediction model, as a mechanistic model for potential
component and structure level creep-fatigue analysis.

iii
ACKNOWLEDGMENTS
I would like to express my sincere gratitude to my advisor, Dr Yongming Liu for his
guidance and unwavering support throughout the duration of my studies. I would like to
thank him for his mentorship and valuable insights which helped me achieve my research
objectives. I would also like to thank the members of my Supervisory Committee, Prof.
Hanqing Jiang, Prof. Jagannathan Rajagopalan, Prof. Jay Oswald, and Prof. Yang Jiao for
volunteering their time to provide advice regarding my research.
This work was sponsored by the U.S. Department of Energy under the Nuclear Energy
University Programs (NEUP) initiative (DE-NE0000675). I gratefully acknowledge
Richard Wright (Idaho National Lab) for his advice on testing methods and Sam Sham
(Argonne National Lab) for his valuable input on model development and prediction
methodology.
I am grateful to my fellow group members, current and former, for their willingness to
help and their strong work ethic which motivated me in my own research. Special thanks
to Hailong Chen for being a sounding board for my research ideas and for providing
insightful suggestions and to Sonam Dahire for helping me in the material
characterization part of this research.
iv
TABLE OF CONTENTS
Page
LIST OF TABLES……………………………………………………………………….vii
LIST OF FIGURES……………………………………………………………………..viii
CHAPTER
1. BACKGROUND AND MOTIVATION ................................................................ 1
2. NEW CREEP-FATIGUE EXPERIMENTAL TESTING METHOD .................... 5
2.1 Introduction .......................................................................................................... 5
2.2 Experimental Procedure ....................................................................................... 7
2.2.1 Purely Force-Controlled Test ......................................................................... 9
2.2.2 Hybrid-Control with Stress Hold at Peak Strain .......................................... 11
2.2.3 Hybrid-Control with Hold at Intermediate Stress ........................................ 12
2.2.4 Hybrid-Control with Ratcheting and Intermediate Stress Hold ................... 14
2.3 Results and Discussion ....................................................................................... 16
2.4 Conclusion .......................................................................................................... 20
3. IMAGE-BASED CREEP-FATIGUE DAMAGE MECHANISM
INVESTIGATION ............................................................................................................ 22
3.1 Introduction ........................................................................................................ 22
3.2 Experimental Testing and Imaging Analysis ..................................................... 24

v
CHAPTER Page
3.2.1 Testing Setup and Procedure ....................................................................... 24
3.2.2 Qualitative Image Analysis for Mechanism Investigation ........................... 26
3.2.3 Digital Imaging Measurements and Statistical Data Analysis ..................... 34
3.3 Correlational Analysis for Imaging Measurement and Mechanical Damage
Parameters ..................................................................................................................... 39
3.4 Interrupted Testing ............................................................................................. 46
3.5 Conclusion .......................................................................................................... 48
4. AN EFFECTIVE TIME FRACTION APPROACH FOR CREEP-FATIGUE
LIFE PREDICTION ......................................................................................................... 50
4.1 Introduction ........................................................................................................ 50
4.2 Experimental Procedure and Imaging Analysis Results .................................... 52
4.3 Proposed Life Prediction Model ........................................................................ 59
4.3.1 Review of the Time Fraction Rule ............................................................... 60
4.3.2 Effective Time Fraction Approach – Hybrid-Controlled Testing................ 61
4.3.3 Effective Time Fraction Approach – Strain-Controlled Testing ................. 66
4.4 Results and Discussion ....................................................................................... 69
4.5 Conclusion .......................................................................................................... 73

vi
CHAPTER Page
5. UNIFIED VISCOPLASTICITY MODELING FOR CREEP-FATIGUE LIFE
PREDICTION ................................................................................................................... 75
5.1 Introduction ........................................................................................................ 75
5.2 Results and Discussion ....................................................................................... 77
5.3 Conclusion .......................................................................................................... 89
6. CONCLUSION AND FUTURE WORK ............................................................. 90
7. REFERENCES ..................................................................................................... 93

vii
LIST OF TABLES
Table Page
2.1 – Comparison of Creep-Fatigue Loading Waveforms and Their Capacity to Generate
the Full Range of Creep-Fatigue Interaction. ................................................................... 17
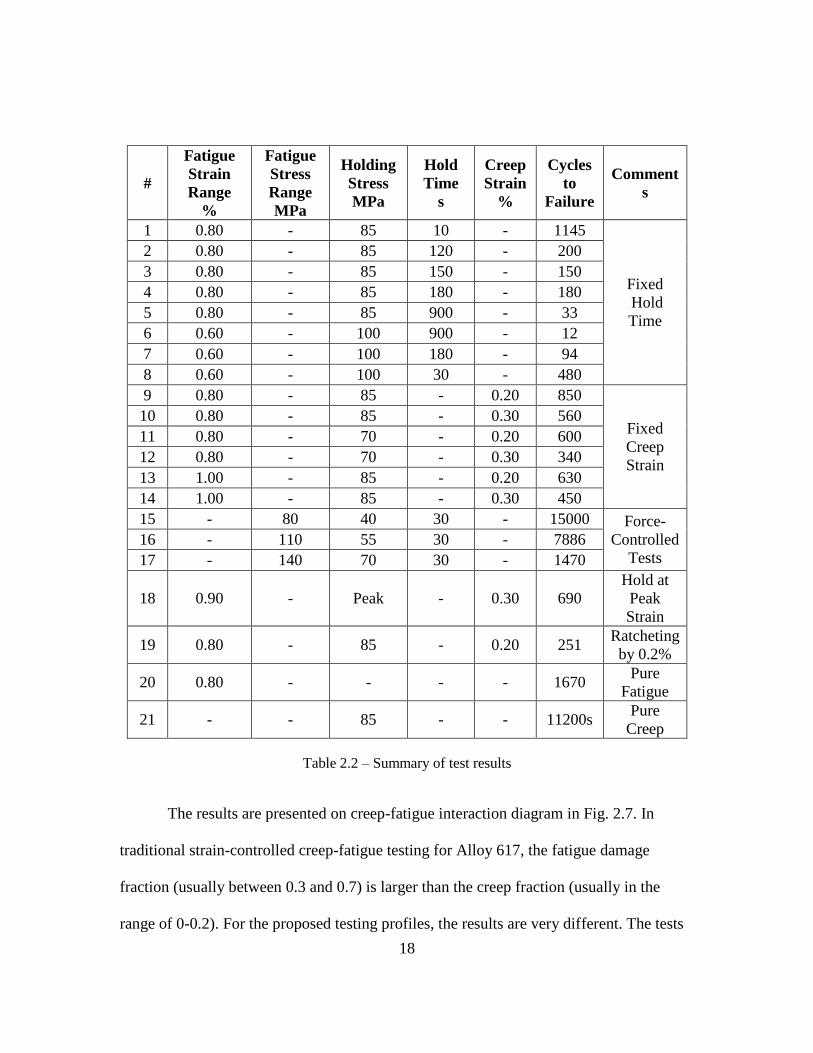
2.2 – Summary of Test Results ......................................................................................... 18
3.1 – Mean Crack Length and Standard Deviation Corresponding to Different Hold
Times................................................................................................................................. 36
3.2 – Variation in Number, Size and Area Fraction for Voids at Fixed Distances from the
Rupture Surface ................................................................................................................ 38
3.3 – Mean Crack Length and Standard Deviation at Different Interrupts ...................... 47

viii
LIST OF FIGURES
Figure Page
1.1 – Creep-Fatigue Interaction Diagram Highlighting the Creep-Dominant and Fatigue-
Dominant Regimes.............................................................................................................. 3
2.1 – (a) Load Frame with High-Temperature System; (b) Test Specimen Installed
between Grips. .................................................................................................................... 8
2.2 – (a) Applied Stress Profile and Corresponding Strain Response for One Cycle; (b)
Stress-Strain Curves for First, Mid and Last Cycle Showing Ratcheting. The Initial Strain
is Changed to Zero to Compare the Cycles. ..................................................................... 10
2.3 – (a) Stress Strain Curves for First, Mid and Last Cycle; (b) Increase in Hold Time
with Cycles Due to Softening. .......................................................................................... 11
2.4 – (a) Stress-Strain Curve for Loading Waveform with a 10s Hold at 85 MPa; (b)
Creep Strain Increasing with Cycles for a Fixed Hold Time of 10s. ................................ 13
2.5 – (a) Stress-Strain Curve for Loading Waveform with an 85 MPa Stress held Constant
up to a Strain of 0.2%; (b) Hold Time Decreasing with Cycles for a Fixed Creep Strain of
0.2%. ................................................................................................................................. 14
2.6 – (a) Stress-Strain Curve Showing Two Subsequent Cycles of the Loading Profile; (b)
Normalized Stress-Strain Curves at First, Mid and Last Cycle. Ratcheting is not Shown;
(c) Decreasing Hold Time with Cycles due to Softening. ................................................ 15
2.7 – Creep-Fatigue Damage Interaction Diagram for Hybrid-Control Tests with Hold at
Intermediate Stress. ........................................................................................................... 20

ix
Figure Page
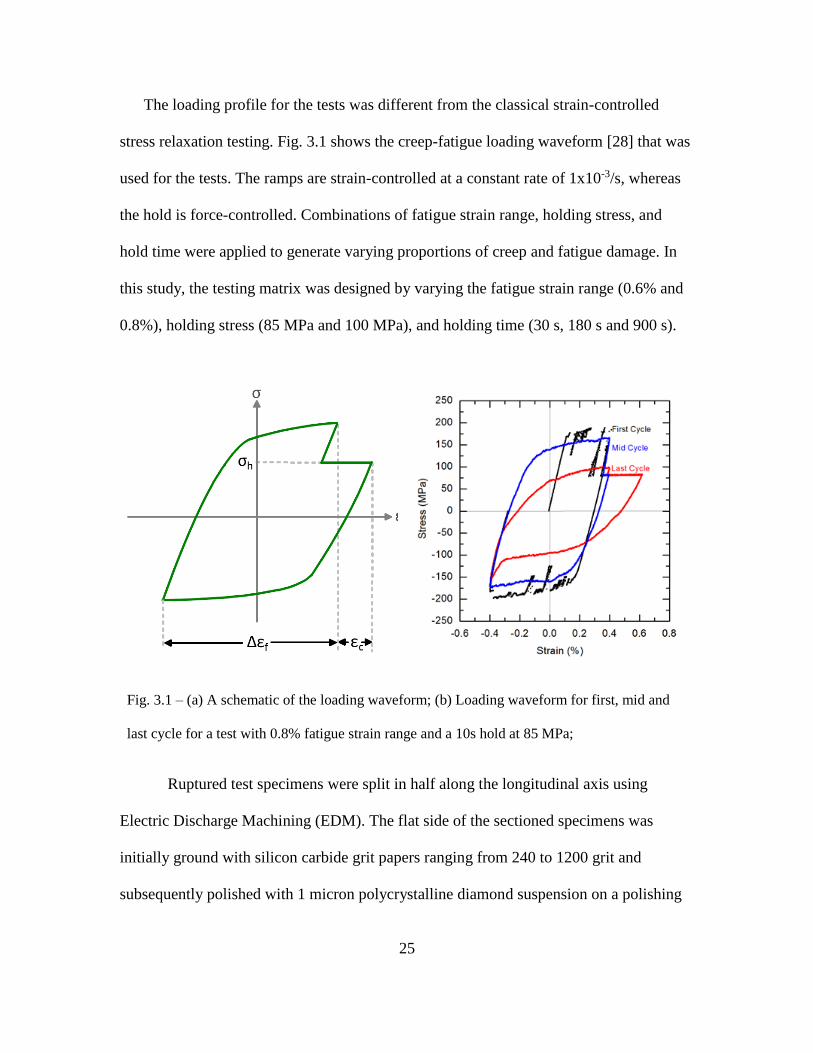
3.1 – (a) A Schematic of the Loading Waveform; (b) Loading Waveform for First, Mid
and Last Cycle for a Test with 0.8% Fatigue Strain Range and a 10s Hold at 85 MPa; .. 25
3.2 – Optical Images of the Sectioned Test Specimens for 0.8% Fatigue Strain Range and
85 MPa Holding Stress with (a) 30 s Holding Time; (b) 180 s Holding Time; (c) 900 s
Holding Time. ................................................................................................................... 27
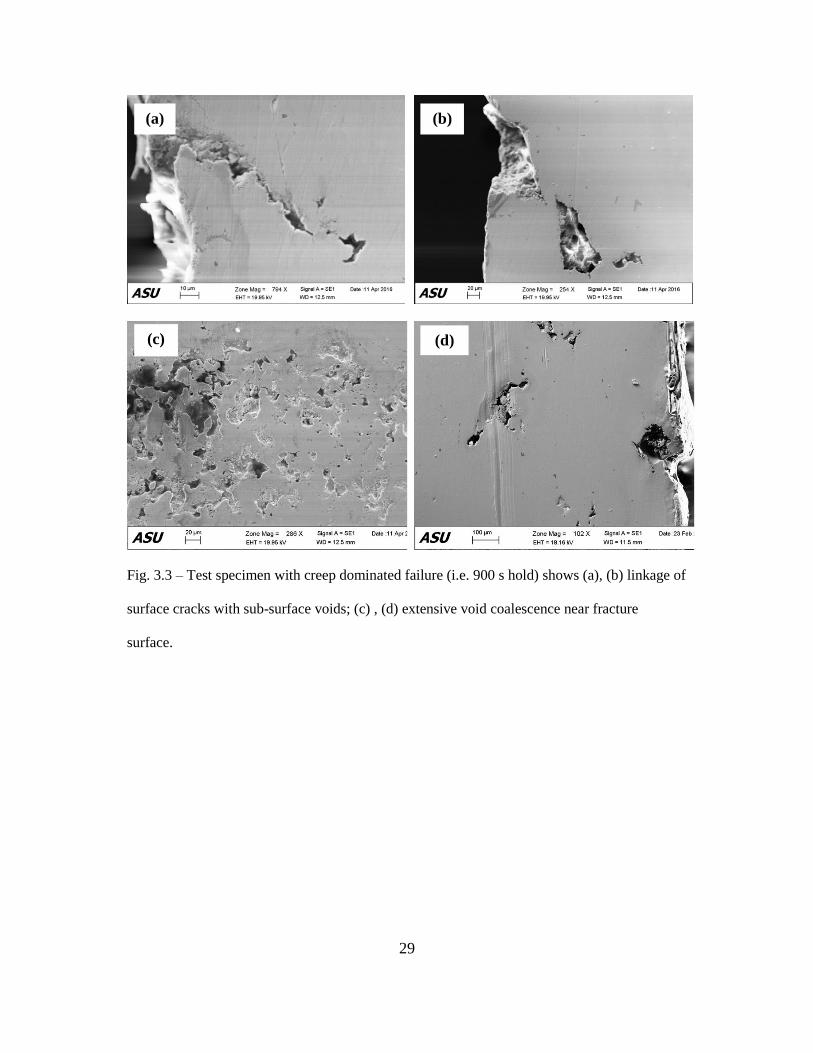
3.3 – Test Specimen with Creep Dominated Failure (i.e. 900 S Hold) shows (a), (b)
Linkage of Surface Cracks with Sub-Surface Voids; (c) , (d) Extensive Void Coalescence
near Fracture Surface. ....................................................................................................... 29
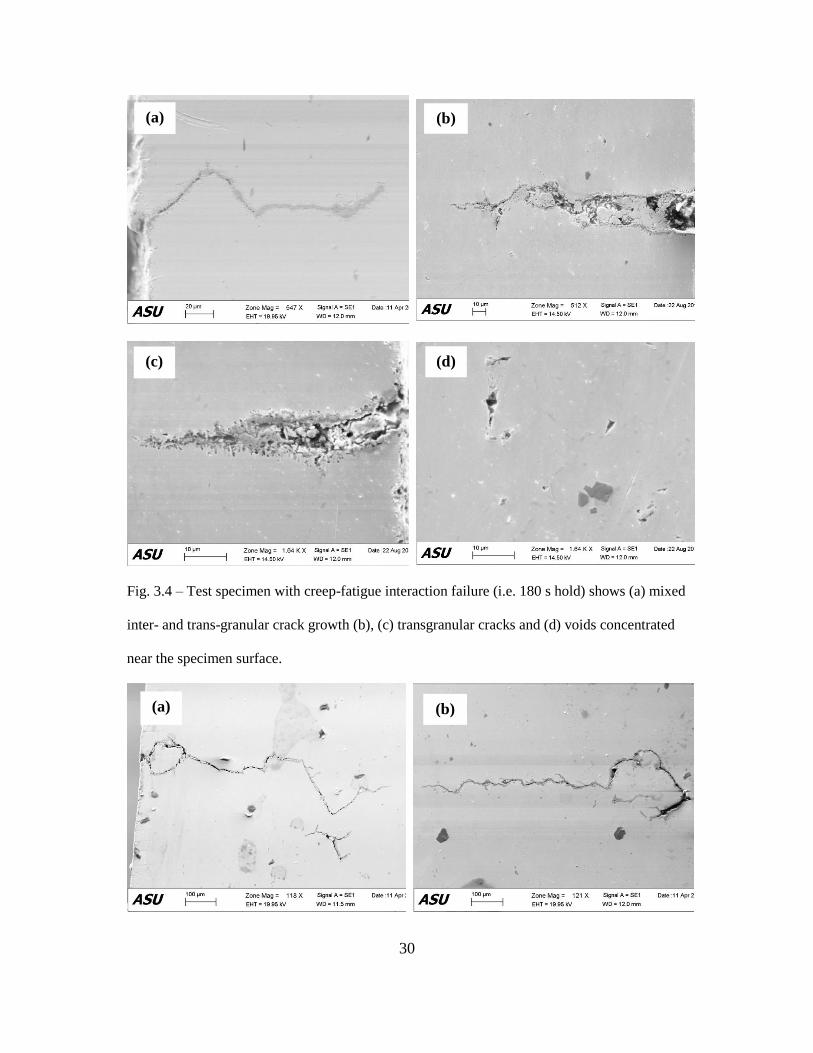
3.4 – Test Specimen with Creep-Fatigue Interaction Failure (i.e. 180 s Hold) shows (a)
Mixed Inter- and Trans-Granular Crack Growth (b), (c) Transgranular Cracks and (d)
Voids Concentrated near the Specimen Surface. .............................................................. 30
3.5 – Test Specimen with Fatigue Dominated Failure (i.e. 30 s hold) shows (a), (b) Long
Intergranular Cracks; (c), (d) Thin Oxide Layer Flanking the Cracks and Grain
Boundaries Ahead of the Crack Tip.................................................................................. 31
3.6 – SEM and EBSD Imaging for Internal Voids of Failed Specimen ........................... 32
3.7 – EDS Phase Maps for Surface Crack on a Test Specimen with Fatigue Dominated
Failure ............................................................................................................................... 33
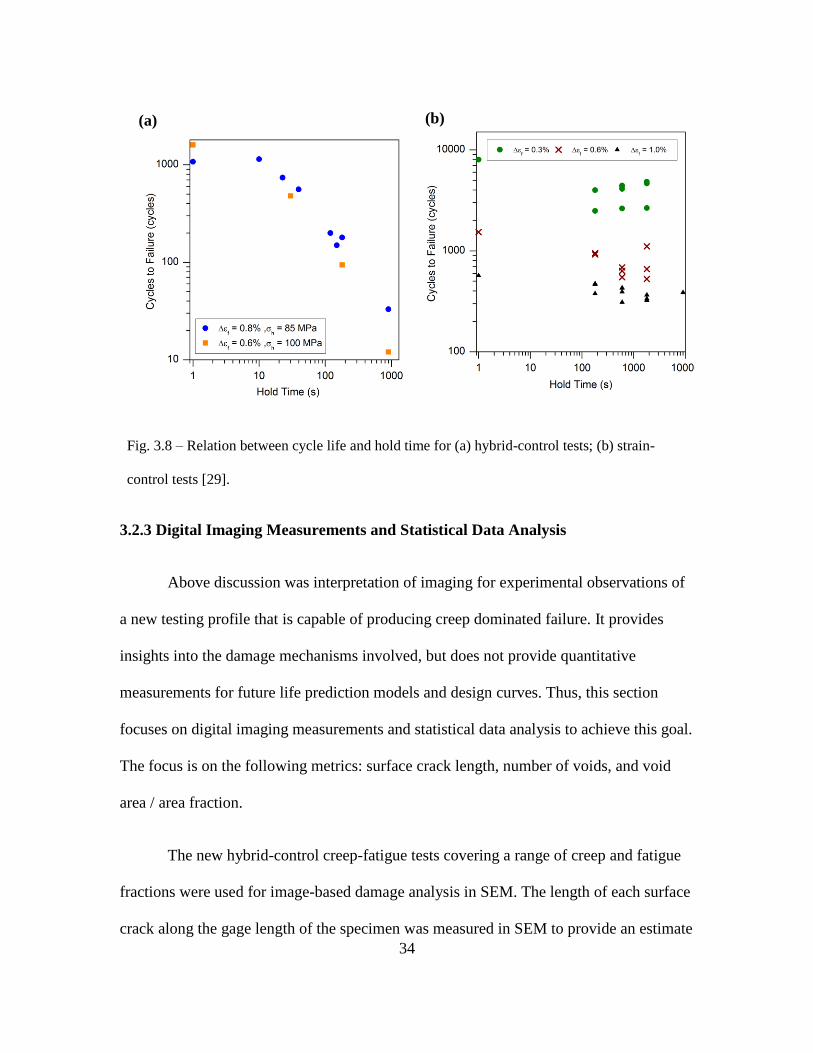
3.8 – Relation between Cycle Life and Hold Time for (a) Hybrid-Control Tests; (b)
Strain-Control Tests [30]. ................................................................................................. 34
3.9 – Empirical Cumulative Distribution Function (F(x)) for Length of Surface Cracks
(x) during Creep-Fatigue Tests with Varying Hold Time ................................................ 36
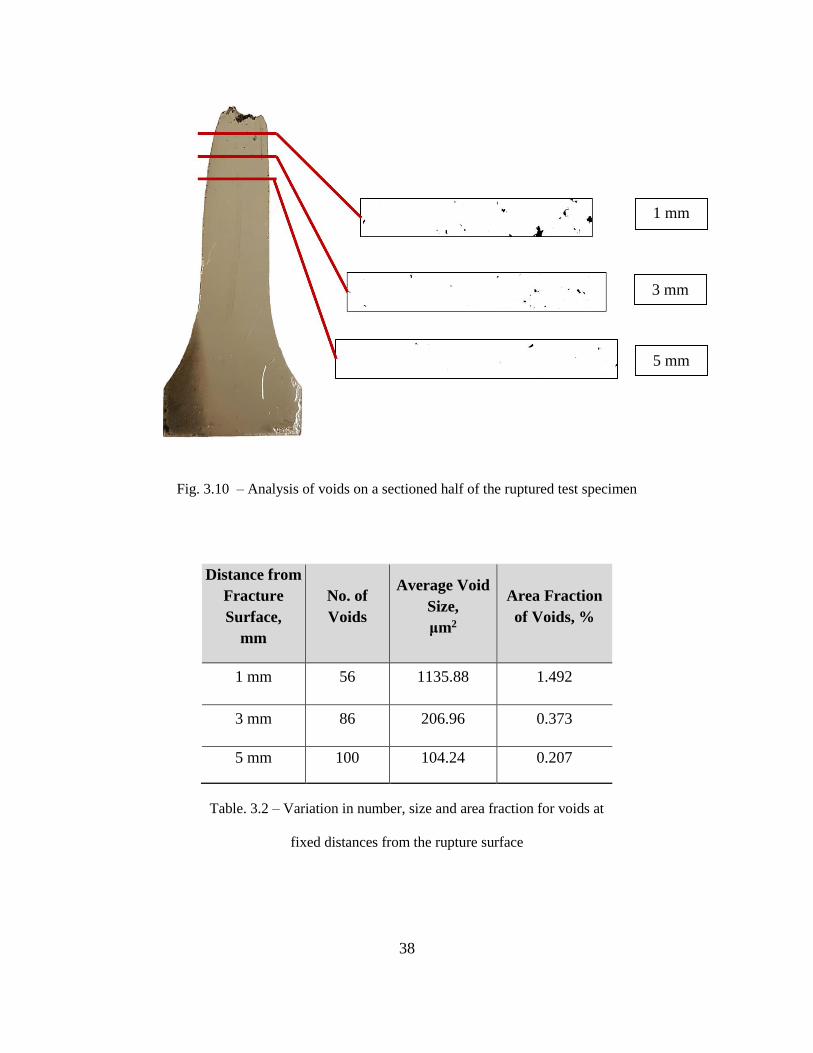
3.10 – Analysis of Voids on a Sectioned Half of the Ruptured Test Specimen .............. 38

x
Figure Page
3.11 – Variation in Distribution of Crack Lengths with Fatigue Damage Fraction. Error
Bars Represent Standard Deviation. ................................................................................. 40
3.12 – Mean and Standard Deviation of Crack Length Increase with Increasing Fatigue
Damage Fraction ............................................................................................................... 41
3.13 – Relation between Void Area Fraction 1mm below the Rupture Surface and Creep
Damage Fraction using Time Fraction Approach ............................................................. 42
3.14 – Correlation between Void Area Fraction and Effective Hold Time Creep Fraction
........................................................................................................................................... 44
3.15 –D Diagram Construction using Micro-Scale Imaging Results and Damage
Parameters (a) Damage Interaction Diagram Based on Microstructure; (b) Damage
Interaction Diagram based on Effective Hold Time Approach. ....................................... 45
3.16 – Peak and Valley Stresses for Interrupted Tests ..................................................... 46
3.17 – Probability Density Function of Crack Lengths at Different Interrupts ............... 47
4.1 (a), (b) – Traditional Strain-Controlled Creep-Fatigue Loading Profile; (c), (d)
Hybrid-Control Loading Profile. ...................................................................................... 54
4.2 – Test Data from an 850°C Test with 1.0% Fatigue Strain Range, 100 MPa Holding
Stress, and 180s Hold Time (a) Stress-Strain Curves from First, Mid and Last Cycles and
(b) Peak Tensile and Compressive Stresses Plotted against Cycle Count show Cyclic
Softening; (c) Creep Strain During the Hold Periods Increases with Cycles. .................. 56
4.3 (a) – Failed Specimen with Creep Dominated Failure Shows Short Surface Cracks
and Large Internal Voids and (b) – Failed Specimen with Fatigue Dominated Failure
shows Minimal Internal Voids and Long Surface Cracks. ............................................... 58

xi
Figure Page
4.4 (a) – Correlation between Classical Creep Time Fraction and Area Fraction of Voids
on the Failed Specimen; (b) – Correlation between Fatigue Cycle Fraction and Mean
Length of Surface Cracks on Failed Specimens. .............................................................. 59
4.5 – Damage Interaction Diagram using Time Fraction Rule for Hybrid-Controlled
Creep-Fatigue Tests. ......................................................................................................... 62
4.6 – Schematic showing First Three Cycles of a Creep-Fatigue Test. White Shaded Area
Represents the Strain Accumulated During the Effective Hold Time. ............................. 63
4.7 – Exponential Relation between Creep Strain Rate and Normalized Cycles. Green
Dots Represent Creep Strain Rate Vs Cycles Data from Multiple Hybrid-Control Tests. 65
4.8 – Damage Interaction Diagram using Effective Time Fraction Approach for Hybrid-
Controlled Creep-Fatigue Tests. ....................................................................................... 69
4.9 – (a) Creep-Fatigue Interaction Diagram and (b) Life Prediction using Effective Time
Fraction Approach for Strain-Control [30] and Hybrid-Control Tests at 950°C. ............. 71
4.10 – (a) Creep-Fatigue Interaction Diagram with Data Labels Indicating Fatigue Strain
Range, Holding Stress, and Hold Time; (b) Life Prediction using Effective Time Fraction
Approach for Hybrid-Control Tests at 850°C. .................................................................. 72
4.11 – Correlation between Effective Time Fraction for Creep and Area Fraction of Voids
on the Failed Specimen; .................................................................................................... 73
5.1 – Sensitivity of (a) Peak Stress and (b) Peak Strain to Changes in Model Parameters.
........................................................................................................................................... 81
5.2 – Damage Interaction Diagram to Determine the Exponent ‘q’ In Damage Interaction
Rule. .................................................................................................................................. 83
xii
Figure Page
5.3 – Degradation of Model Parameters (a)‘m’ and (b)‘E’ with Equivalent Damage, Deq
for Multiple Tests .............................................................................................................. 84
5.4– A Flowchart Showing the Development of the Life-Prediction Rule for Parameter
‘m’, from the Experimental Data and Damage Law. ........................................................ 85
5.5 – Predicted vs Observed Cycle for Hybrid-Control Tests. ......................................... 86
5.6 – Stress-Strain Response for Various Cycles Compared with Experiment For a
Hybrid Control Test with 0.8% Strain Range, 85 MPa Holding Stress, and 180 S Hold . 87
5.7 – (a) Cyclic Softening and (b) Peak Strain increase Comparison between Experiment
and Simulation. ................................................................................................................. 88

1
BACKGROUND AND MOTIVATION
Creep-fatigue is an important damage mechanism in high-temperature systems that
undergo cyclic thermal stresses interspersed with periods of constant load. Examples of
such systems include gas turbines, heat exchangers, and microelectronics packaging
[1,2]. Recent interest in creep-fatigue interaction in superalloys is driven by the need to
evaluate structural materials for future nuclear power plants. The Very High Temperature
Reactor (VHTR) is one of six conceptual designs proposed for Generation IV nuclear
reactors. The VHTR is a gas-cooled reactor with helium as the primary coolant. The
coolant is expected to reach temperatures up to 950°C at the reactor outlet, before passing
through an Intermediate Heat Exchanger (IHX) - which provides process heat for
electricity and hydrogen production [3,4]. Steady-state operation of the plant at elevated
temperatures leads to creep deformation, whereas loading transients including startup and
shutdown generate fatigue [5,6]. Hence, creep-fatigue interaction is expected to be a
major damage mechanism for structural materials in the IHX. Alloy 617 - a solid-solution
strengthened nickel-base superalloy - is the leading candidate material for IHX tubing
due to its thermal stability, creep strength, and oxidation resistance at high temperatures
[5,7,8]. A detailed understanding of the creep-fatigue interaction in Alloy 617 is
necessary before it can be considered as a material for nuclear construction in ASME
Boiler and Pressure Vessel Code, Section III, Subsection NH [9].
A majority of current creep-fatigue life prediction methods are based on time
fraction rule (TFR), ductility exhaustion (DE), or strain-range partitioning (SRP) [10].
Nuclear component design codes, namely ASME BPVC, Section III, Subsection NH[9],
RCC-MR [11], and R5 [12], suggest linear summation of creep and fatigue damage
2
fractions to predict failure. ASME and RCC-MR require a time fraction – based on TFR
– for calculating creep damage, whereas R5 requires a strain fraction calculation based on
DE. One limitation of the DE approach is that the value of creep fraction can exceed
unity for some materials, leading to highly conservative predictions [10,13,14].
Takahashi [13] proposed a modified ductility exhaustion method to alleviate this
limitation. The SRP method works well when enough test data is available to partition the
total strain range. Hoffelner [15] improved life prediction in SRP by modifying the creep
strain partition.
The time fraction rule can be used to predict creep-fatigue life with the help of the
following relation:
where n is the cycles to failure in creep-fatigue, Nf is the cycles to failure in pure fatigue
for the given strain range, th is the hold time in each cycle, Tr is the time to rupture in
pure creep for a given stress and temperature and D is the allowable combined damage
fraction. In this study, Nf was found from a fatigue strain-life curve and Tr was calculated
from a Larson-Miller plot. The first term in Eq. (1) is a cycle fraction representing fatigue
damage and the second term is a time fraction representing creep damage. The damage
fractions for Alloy 617 at 950°C are expected to follow a bilinear curve on a creep-
fatigue interaction diagram [6] as is typical for steels (see Fig. 1.1).
∑(n
Nf)ii
+∑(∑thTr)jj
≤ D (1)
3
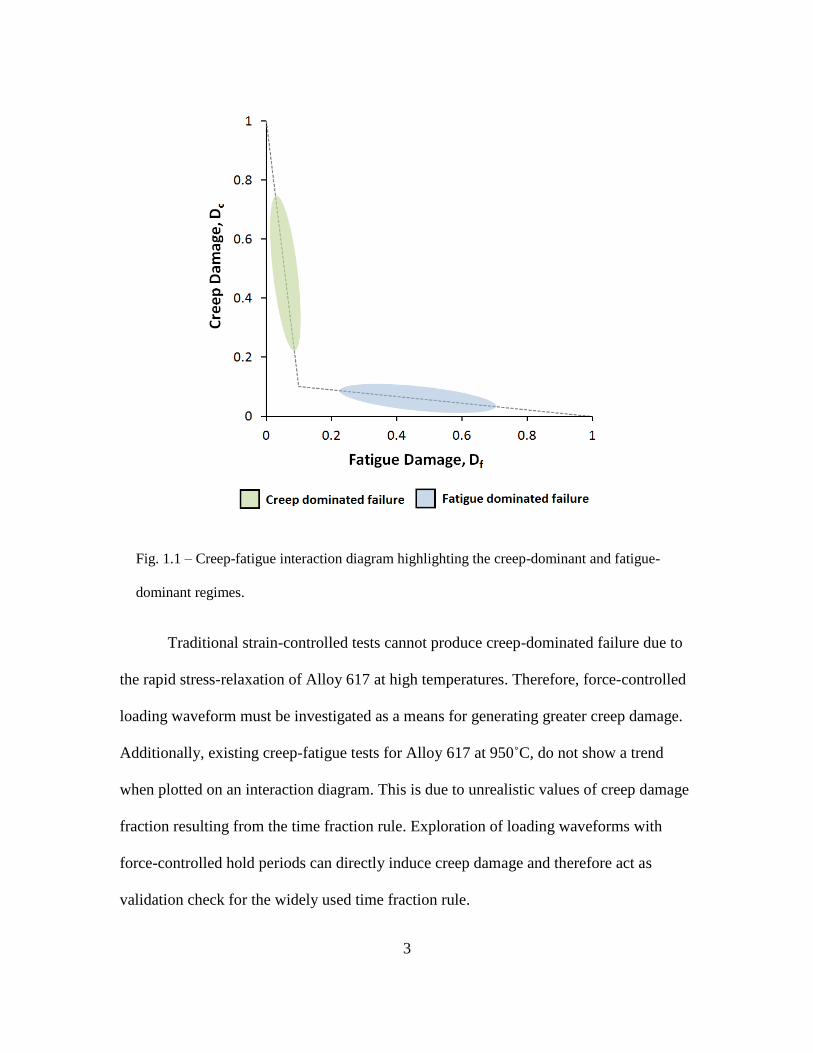
Fig. 1.1 – Creep-fatigue interaction diagram highlighting the creep-dominant and fatigue-
dominant regimes.
Traditional strain-controlled tests cannot produce creep-dominated failure due to
the rapid stress-relaxation of Alloy 617 at high temperatures. Therefore, force-controlled
loading waveform must be investigated as a means for generating greater creep damage.
Additionally, existing creep-fatigue tests for Alloy 617 at 950˚C, do not show a trend
when plotted on an interaction diagram. This is due to unrealistic values of creep damage
fraction resulting from the time fraction rule. Exploration of loading waveforms with
force-controlled hold periods can directly induce creep damage and therefore act as
validation check for the widely used time fraction rule.

4
The goals of this study are:
1. To propose novel test procedures to generate creep-dominated creep-fatigue
interaction with the introduction of force-controlled tensile hold periods.
2. To qualitatively and quantitatively distinguish between creep and fatigue dominated
damage in failed creep-fatigue test specimens using Scanning Electron Microscopy
(SEM), Electron Backscatter Diffraction (EBSD), Energy Dispersive Spectroscopy
(EDS) and optical profilometry.
3. To propose a life prediction methodology based on the findings from micro-scale
damage analysis.
4. To obtain an improved life-prediction by modeling the constitutive response of the
material under creep-fatigue cycling using a unified viscoplastic model with damage.
5
NEW CREEP-FATIGUE EXPERIMENTAL TESTING METHOD
2.1 INTRODUCTION
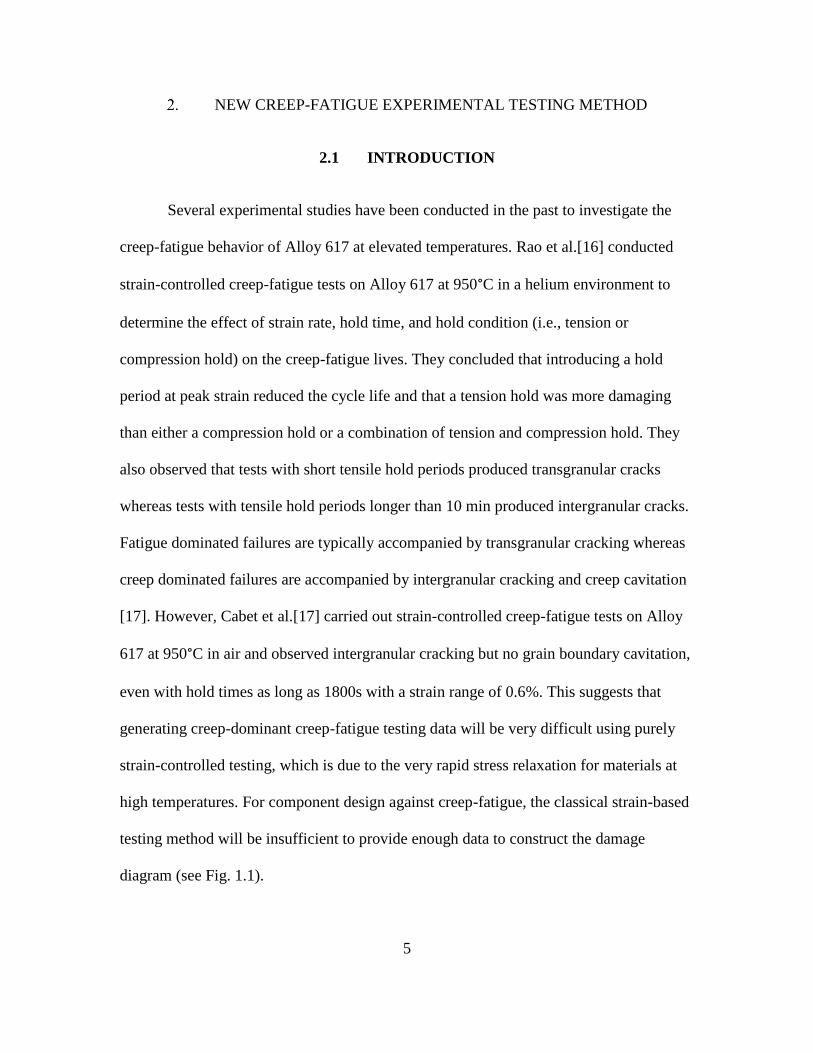
Several experimental studies have been conducted in the past to investigate the
creep-fatigue behavior of Alloy 617 at elevated temperatures. Rao et al.[16] conducted
strain-controlled creep-fatigue tests on Alloy 617 at 950°C in a helium environment to
determine the effect of strain rate, hold time, and hold condition (i.e., tension or
compression hold) on the creep-fatigue lives. They concluded that introducing a hold
period at peak strain reduced the cycle life and that a tension hold was more damaging
than either a compression hold or a combination of tension and compression hold. They
also observed that tests with short tensile hold periods produced transgranular cracks
whereas tests with tensile hold periods longer than 10 min produced intergranular cracks.
Fatigue dominated failures are typically accompanied by transgranular cracking whereas
creep dominated failures are accompanied by intergranular cracking and creep cavitation
[17]. However, Cabet et al.[17] carried out strain-controlled creep-fatigue tests on Alloy
617 at 950°C in air and observed intergranular cracking but no grain boundary cavitation,
even with hold times as long as 1800s with a strain range of 0.6%. This suggests that
generating creep-dominant creep-fatigue testing data will be very difficult using purely
strain-controlled testing, which is due to the very rapid stress relaxation for materials at
high temperatures. For component design against creep-fatigue, the classical strain-based
testing method will be insufficient to provide enough data to construct the damage
diagram (see Fig. 1.1).

6
The ASTM standard for creep-fatigue testing E2714-13 provides examples of
strain-controlled loading profile with a hold at peak strain and force-controlled loading
profile with a hold at peak stress. For Alloy 617, it is known that tensile hold periods are
more damaging than compressive hold periods [16,18]. Moreover, for a purely strain-
controlled loading profile, the stress during the hold period becomes steady after the
initial rapid stress relaxation. Therefore, after a certain threshold value, a longer hold time
does not produce more creep damage. To solve this problem, Fournier et al. [19]
conducted tests with a force-controlled hold period on 9Cr-1Mo martensitic steel at
550°C. They observed that fatigue life was reduced but the creep damage remained low.
Simpson et al. [6] suggested that, for Alloy 617 at 950°C, creep-dominant damage may
be produced by a loading profile similar to one used by Fournier et al. [19], but there is
no experimental evidence to support this hypothesis. In addition, TFR does not fully
account for the dependence of life on the type of loading waveform so it can be
inaccurate when applied to unconventional creep-fatigue loading [10,11]. Thus, any new
testing method for generating creep fatigue data must be carefully investigated with
respect to the TFR methodology.
Based on the above brief review and discussion, the objective of this study is to
experimentally explore the possible creep-fatigue testing procedures for generating creep-
dominant failure, which will aid in the construction of a damage interaction diagram for
creep-fatigue design. Several non-traditional creep-fatigue loading profiles, such as
stress-controlled, hybrid control with specified hold time, hybrid control with specified
hold strain, and cyclic ratcheting are investigated and compared for their suitability for
producing creep-dominant damage.
7
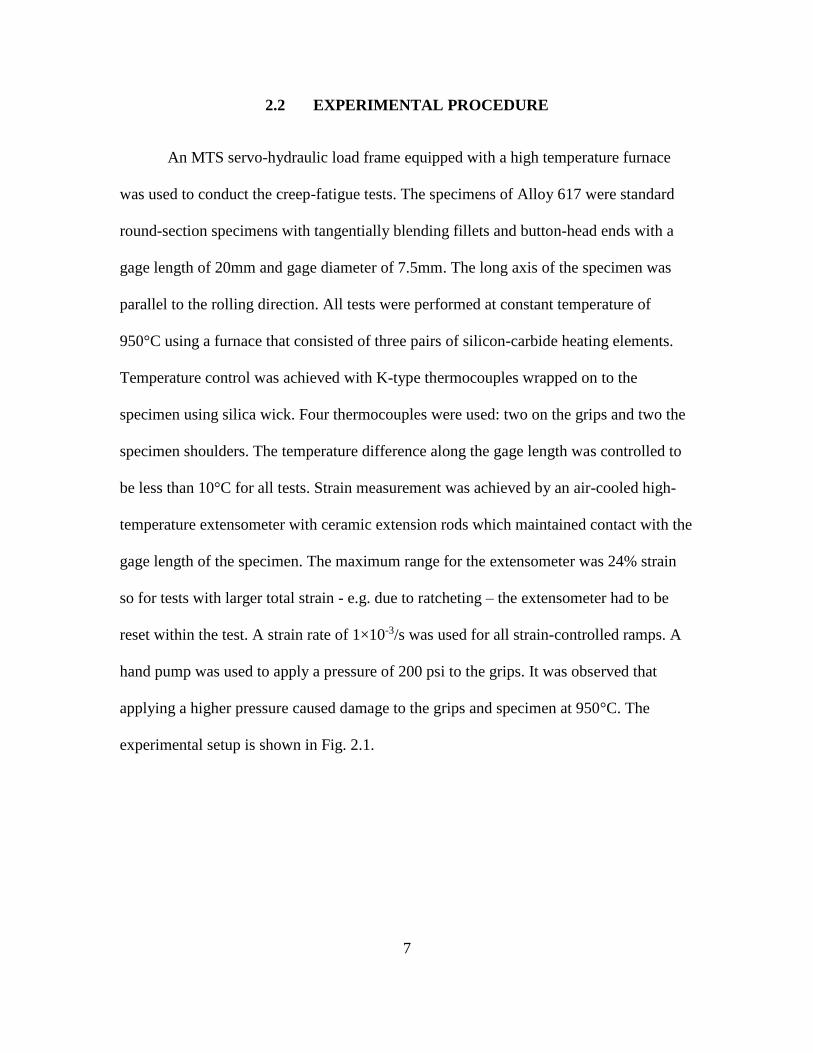
2.2 EXPERIMENTAL PROCEDURE
An MTS servo-hydraulic load frame equipped with a high temperature furnace
was used to conduct the creep-fatigue tests. The specimens of Alloy 617 were standard
round-section specimens with tangentially blending fillets and button-head ends with a
gage length of 20mm and gage diameter of 7.5mm. The long axis of the specimen was
parallel to the rolling direction. All tests were performed at constant temperature of
950°C using a furnace that consisted of three pairs of silicon-carbide heating elements.
Temperature control was achieved with K-type thermocouples wrapped on to the
specimen using silica wick. Four thermocouples were used: two on the grips and two the
specimen shoulders. The temperature difference along the gage length was controlled to
be less than 10°C for all tests. Strain measurement was achieved by an air-cooled high-
temperature extensometer with ceramic extension rods which maintained contact with the
gage length of the specimen. The maximum range for the extensometer was 24% strain
so for tests with larger total strain - e.g. due to ratcheting – the extensometer had to be
reset within the test. A strain rate of 1×10⁻³/s was used for all strain-controlled ramps. A
hand pump was used to apply a pressure of 200 psi to the grips. It was observed that
applying a higher pressure caused damage to the grips and specimen at 950°C. The
experimental setup is shown in Fig. 2.1.
8
Fig. 2.1 – (a) Load frame with high-temperature system; (b) Test specimen
installed between grips.
(b)
(a)
9
Traditional strain-controlled fatigue stress-relaxation testing of Alloy 617 at
950°C cannot populate the creep-dominant part of the creep-fatigue interaction diagram
[6]. Hence, loading waveforms with force-controlled hold must be applied to generate
creep-dominant damage. New loading waveforms were implemented to study creep-
fatigue interaction in the creep-dominant regime. These waveforms can be classified as:
(i) purely force-controlled; (ii) hybrid-control with stress hold at peak strain; (iii) hybrid-
control with an intermediate stress hold and (iv) hybrid-control with ratcheting and
intermediate stress hold. The term ‘hybrid’ here, refers to a combination of stress and
strain control. The end-of-test criterion for the force-controlled tests was complete
rupture whereas for all other tests it was a 50% drop in maximum tensile stress. In these
tests, creep strain Ԑc, is defined as the strain accumulated during the hold period [19];
fatigue strain range, ΔԐf, is defined as the difference between the total strain range, ΔԐt,
and creep strain. To prevent large data sets, cycle data was collected every 5 or 10 cycles,
depending on the expected cycle life of the given test. The loading profiles discussed here
were not available in the standard MTS fatigue database, custom loading profiles were
programmed in MTS Multipurpose Elite software. Hybrid control requires a switch from
a strain-controlled ramp to a force-controlled hold for each cycle. This was achieved in
the software by running a force limit detector in parallel with the strain ramp command.
The following sections will explain each of the tests in detail.
2.2.1 Purely Force-Controlled Test
The idea behind using force-control is to replace the stress-relaxation part of the
traditional strain-controlled loading waveform with creep deformation induced by a
10
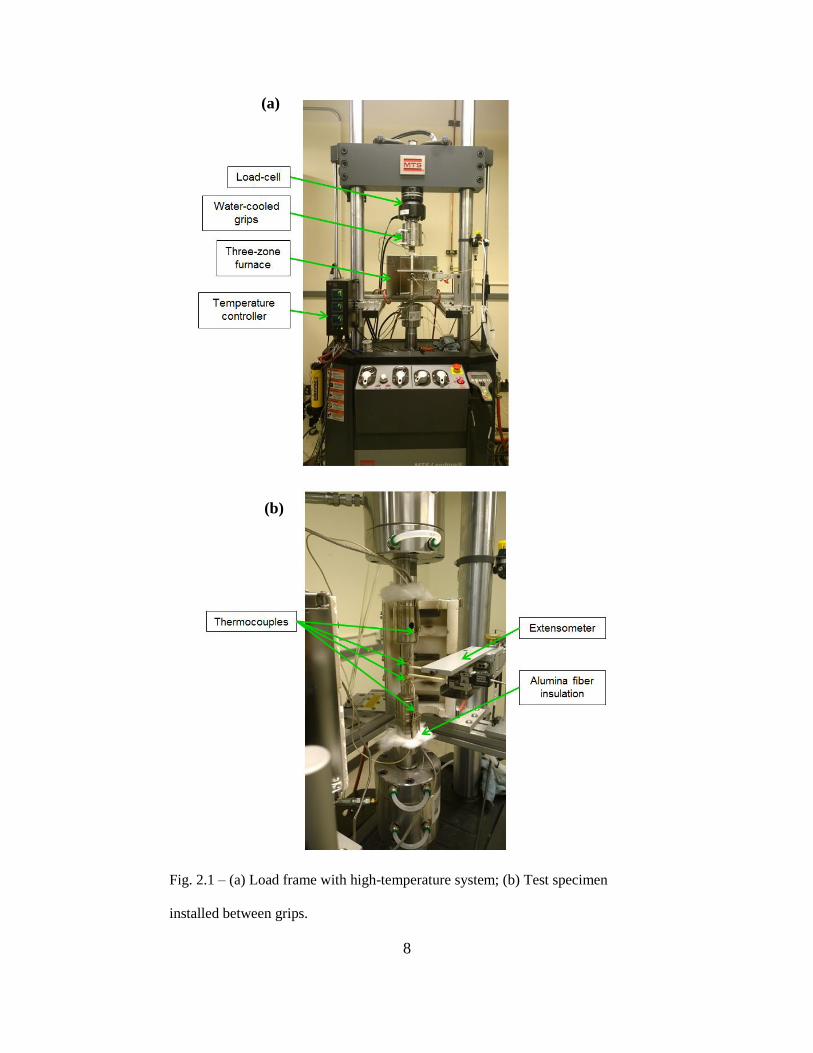
force-controlled hold. The entire test was performed in force-control. Loading and
unloading ramps were executed at 1000 N/s, whereas the peak stress was held constant
for a fixed time of 30s per cycle as shown in Fig. 2.1(a). The strain amplitude increased
with cycles due to softening. The mean strain also increased indicating ratcheting. Fig.
2.1(b) shows the ratcheting behavior between first, mid and last cycles. The ratcheting, in
this case, is a consequence of completely reversing the force instead of the strain. Three
tests were conducted with stress amplitudes of 40, 55 and 70 MPa respectively. In all
three tests, the creep damage fraction, Dc, was greater than unity and fatigue damage
fraction, Df, was close to zero. These fractions suggest highly creep-dominant damage
and therefore, an absence of creep-fatigue interaction. It was observed that applying a
waveform with higher stress amplitude does not lead to an increase in the fatigue
fraction. Applying shorter hold periods may cause a reduction in Dc and an increase in Df.
However, using hold periods less than 30s to produce creep-dominant damage is not
recommended because the creep damage incurred during the hold period may be less than
the creep damage during the loading and unloading parts of the cycle.
Fig. 2.2 – (a) Applied stress profile and corresponding strain response for
one cycle; (b) Stress-strain curves for first, mid and last cycle showing
ratcheting. The initial strain is changed to zero to compare the cycles.
(a) (b)
11
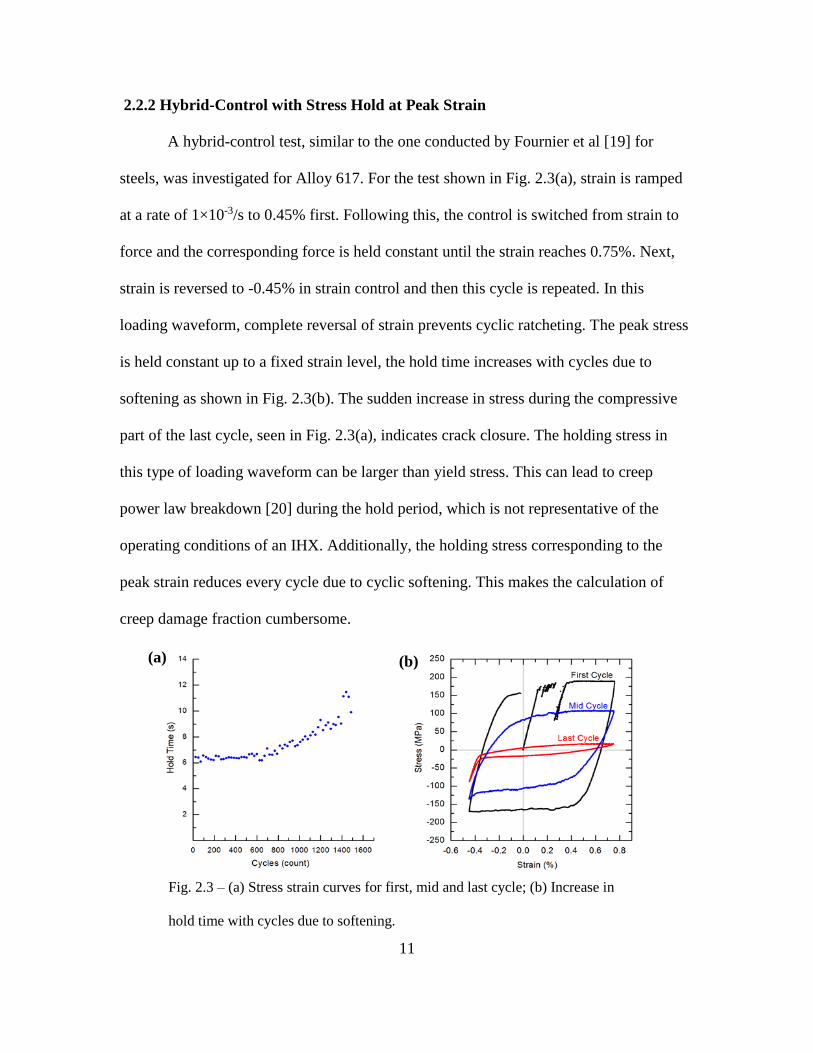
2.2.2 Hybrid-Control with Stress Hold at Peak Strain
A hybrid-control test, similar to the one conducted by Fournier et al [19] for
steels, was investigated for Alloy 617. For the test shown in Fig. 2.3(a), strain is ramped
at a rate of 1×10⁻³/s to 0.45% first. Following this, the control is switched from strain to
force and the corresponding force is held constant until the strain reaches 0.75%. Next,
strain is reversed to -0.45% in strain control and then this cycle is repeated. In this
loading waveform, complete reversal of strain prevents cyclic ratcheting. The peak stress
is held constant up to a fixed strain level, the hold time increases with cycles due to
softening as shown in Fig. 2.3(b). The sudden increase in stress during the compressive
part of the last cycle, seen in Fig. 2.3(a), indicates crack closure. The holding stress in
this type of loading waveform can be larger than yield stress. This can lead to creep
power law breakdown [20] during the hold period, which is not representative of the
operating conditions of an IHX. Additionally, the holding stress corresponding to the
peak strain reduces every cycle due to cyclic softening. This makes the calculation of
creep damage fraction cumbersome.
Fig. 2.3 – (a) Stress strain curves for first, mid and last cycle; (b) Increase in
hold time with cycles due to softening.
(a) (b)

12
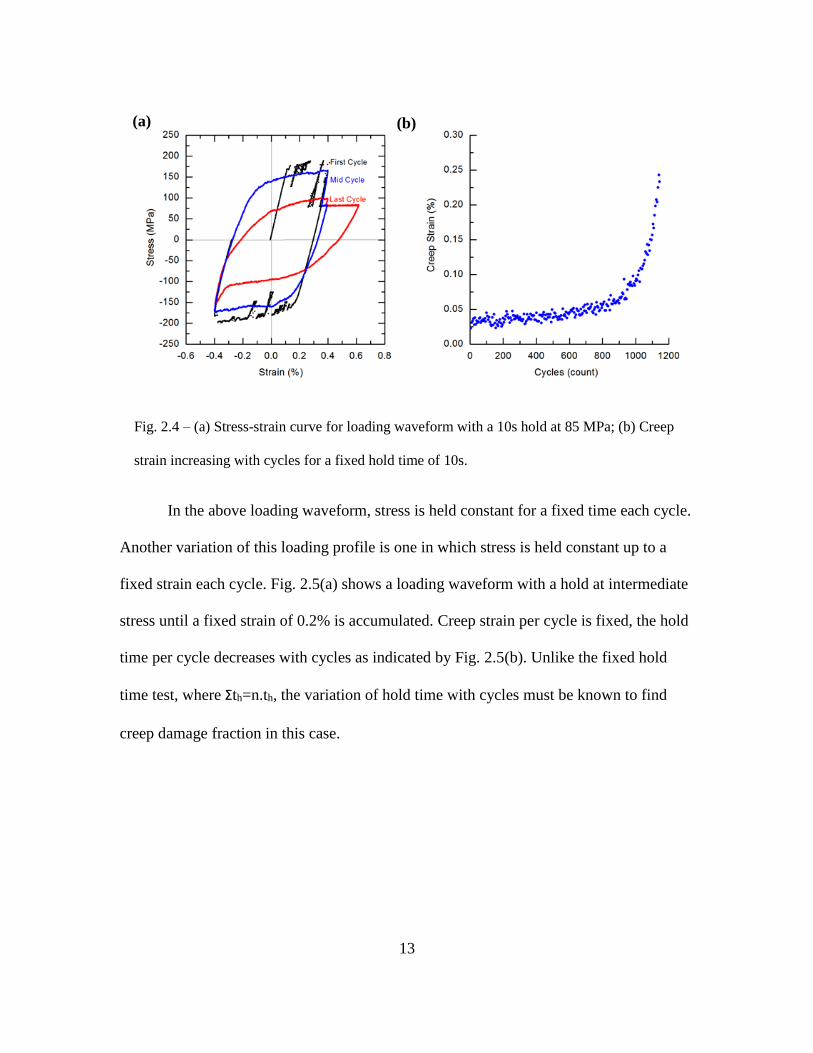
2.2.3 Hybrid-Control with Hold at Intermediate Stress
In time fraction approach, the creep fraction can be varied by changing the hold
time and hold stress, whereas the fatigue fraction can be varied by changing the fatigue
strain range. A loading profile in which the stress is held constant at an intermediate
stress level instead of the stress corresponding to peak strain can allow more flexible
control over the creep and fatigue fractions in a test. Moreover, the stress hold does not
have to be above the yield stress for the material. This type of loading waveform is also
closer to actual service conditions of a heat exchanger where a transient period produces
peak stresses, but steady state operation results in intermediate stress levels [21]. Fig.
2.4(a) shows an example of such a loading waveform. The strain is ramped up at a rate of
1x10⁻³/s to 0.4%. Following this, strain is reduced until stress is 85MPa and the control is
switched from strain to force. Next, the corresponding force is held constant for 10s and
the strain is reversed to -0.4% in strain control. This cycle is repeated until failure. Creep
hold time per cycle is fixed, the creep strain per cycle increases due to softening as
indicated by Fig. 2.4(b).
13
Fig. 2.4 – (a) Stress-strain curve for loading waveform with a 10s hold at 85 MPa; (b) Creep
strain increasing with cycles for a fixed hold time of 10s.
In the above loading waveform, stress is held constant for a fixed time each cycle.
Another variation of this loading profile is one in which stress is held constant up to a
fixed strain each cycle. Fig. 2.5(a) shows a loading waveform with a hold at intermediate
stress until a fixed strain of 0.2% is accumulated. Creep strain per cycle is fixed, the hold
time per cycle decreases with cycles as indicated by Fig. 2.5(b). Unlike the fixed hold
time test, where Σth=n.th, the variation of hold time with cycles must be known to find
creep damage fraction in this case.
(a) (b)

14
Fig. 2.5 – (a) Stress-strain curve for loading waveform with an 85 MPa stress held constant up
to a strain of 0.2%; (b) Hold time decreasing with cycles for a fixed creep strain of 0.2%.
In the aforementioned tests, the value of creep damage fraction was greater than
unity. A possible explanation for this result can be the complete reversal of fatigue strain
amplitude, which prohibits the accumulation of creep strain with increasing cycles.
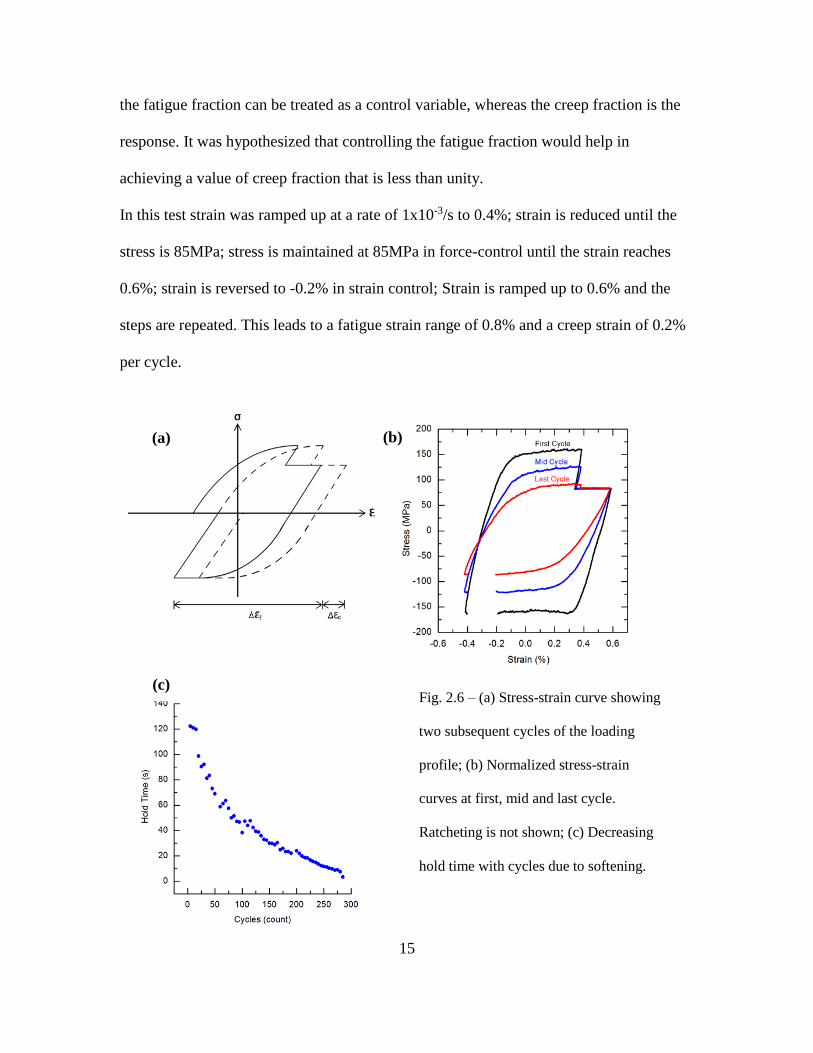
2.2.4 Hybrid-Control with Ratcheting and Intermediate Stress Hold
In hybrid-control tests, the fatigue strain range ΔԐf is completely reversed so the
creep strain cannot accumulate with cycles. In contrast, for force-controlled tests the
creep strain can accumulate with cycles due to ratcheting. The hybrid-controlled loading
profile can be modified in such a way that the peak and valley strains increment by a
fixed amount each cycle as shown in Fig. 2.6. Since the total strain to failure is
approximately 50% and each cycle increments the peak strain by x%, the cycles to
failure, n, for these tests can be controlled by changing the strain increment, x. Therefore,
(a) (b)
15
the fatigue fraction can be treated as a control variable, whereas the creep fraction is the
response. It was hypothesized that controlling the fatigue fraction would help in
achieving a value of creep fraction that is less than unity.
In this test strain was ramped up at a rate of 1x10⁻³/s to 0.4%; strain is reduced until the
stress is 85MPa; stress is maintained at 85MPa in force-control until the strain reaches
0.6%; strain is reversed to -0.2% in strain control; Strain is ramped up to 0.6% and the
steps are repeated. This leads to a fatigue strain range of 0.8% and a creep strain of 0.2%
per cycle.
Fig. 2.6 – (a) Stress-strain curve showing
two subsequent cycles of the loading
profile; (b) Normalized stress-strain
curves at first, mid and last cycle.
Ratcheting is not shown; (c) Decreasing
hold time with cycles due to softening.
(a) (b)
(c)

16
In this loading profile, creep fraction is very large due to the ratcheting, which indicates
that this loading waveform may not be suitable for producing creep-dominant creep-
fatigue interaction data. Thus, this loading profile has similar limitations as purely stress-
controlled testing.
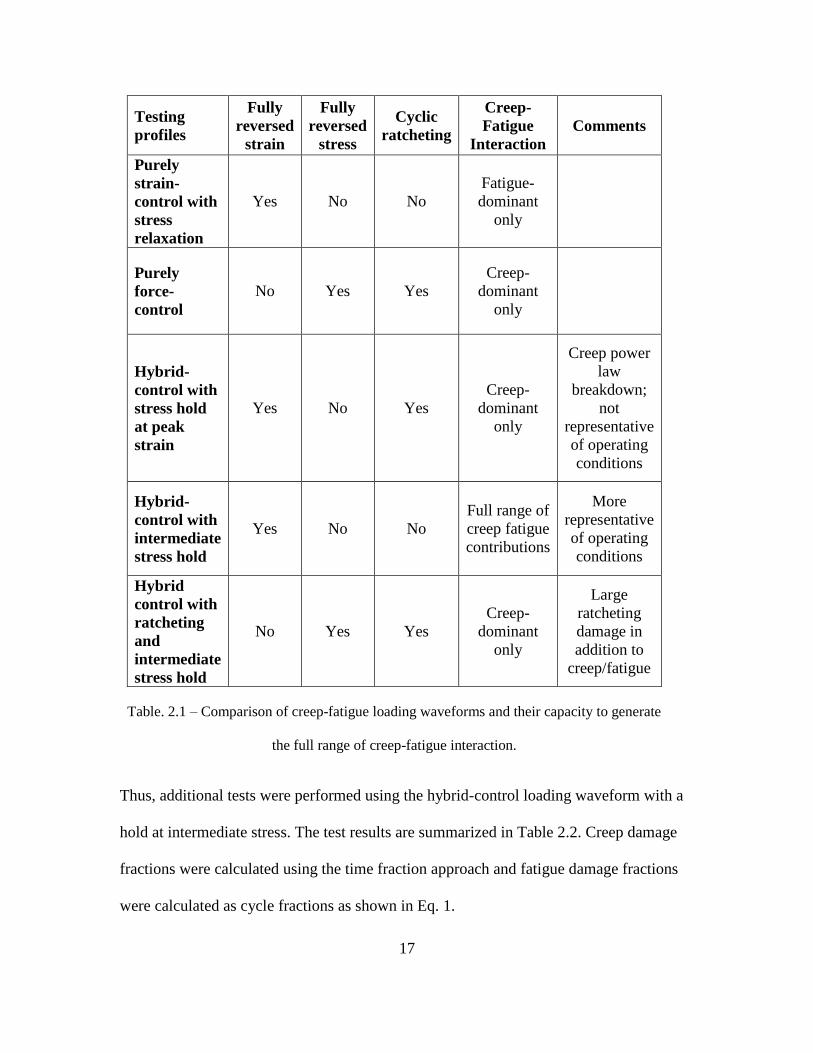
2.3 RESULTS AND DISCUSSION
A summary of different types of loading profiles is shown in Table 2.1, each with
their unique pros and cons. Some tests are fully strain-reversed and some are fully stress-
reversed. For the objective of this study, the hybrid control test with intermediate stress
hold (either for a constant time or to a constant strain) is considered to be the optimal
testing procedure due to: 1) its flexibility in generating the full range of test runs with
varying contributions of creep and fatigue damage by changing the creep holding stress,
hold time (or creep strain) and fatigue strain range; 2) absence of ratcheting damage; 3)
its creep holding stress being less than the yield stress which is a realistic loading state for
the power plant.
17
Testing
profiles
Fully
reversed
strain
Fully
reversed
stress
Cyclic
ratcheting
Creep-
Fatigue
Interaction
Comments
Purely
strain-
control with
stress
relaxation
Yes No No
Fatigue-
dominant
only
Purely
force-
control
No Yes Yes
Creep-
dominant
only
Hybrid-
control with
stress hold
at peak
strain
Yes No Yes
Creep-
dominant
only
Creep power
law
breakdown;
not
representative
of operating
conditions
Hybrid-
control with
intermediate
stress hold
Yes No No
Full range of
creep fatigue
contributions
More
representative
of operating
conditions
Hybrid
control with
ratcheting
and
intermediate
stress hold
No Yes Yes
Creep-
dominant
only
Large
ratcheting
damage in
addition to
creep/fatigue
Table. 2.1 – Comparison of creep-fatigue loading waveforms and their capacity to generate
the full range of creep-fatigue interaction.
Thus, additional tests were performed using the hybrid-control loading waveform with a
hold at intermediate stress. The test results are summarized in Table 2.2. Creep damage
fractions were calculated using the time fraction approach and fatigue damage fractions
were calculated as cycle fractions as shown in Eq. 1.
18
#
Fatigue
Strain
Range
%
Fatigue
Stress
Range
MPa
Holding
Stress
MPa
Hold
Time
s
Creep
Strain
%
Cycles
to
Failure
Comment
s
1 0.80 - 85 10 - 1145
Fixed
Hold
Time
2 0.80 - 85 120 - 200
3 0.80 - 85 150 - 150
4 0.80 - 85 180 - 180
5 0.80 - 85 900 - 33
6 0.60 - 100 900 - 12
7 0.60 - 100 180 - 94
8 0.60 - 100 30 - 480
9 0.80 - 85 - 0.20 850
Fixed
Creep
Strain
10 0.80 - 85 - 0.30 560
11 0.80 - 70 - 0.20 600
12 0.80 - 70 - 0.30 340
13 1.00 - 85 - 0.20 630
14 1.00 - 85 - 0.30 450
15 - 80 40 30 - 15000 Force-
Controlled
Tests
16 - 110 55 30 - 7886
17 - 140 70 30 - 1470
18 0.90 - Peak - 0.30 690
Hold at
Peak
Strain
19 0.80 - 85 - 0.20 251 Ratcheting
by 0.2%
20 0.80 - - - - 1670 Pure
Fatigue
21 - - 85 - - 11200s Pure
Creep
Table 2.2 – Summary of test results
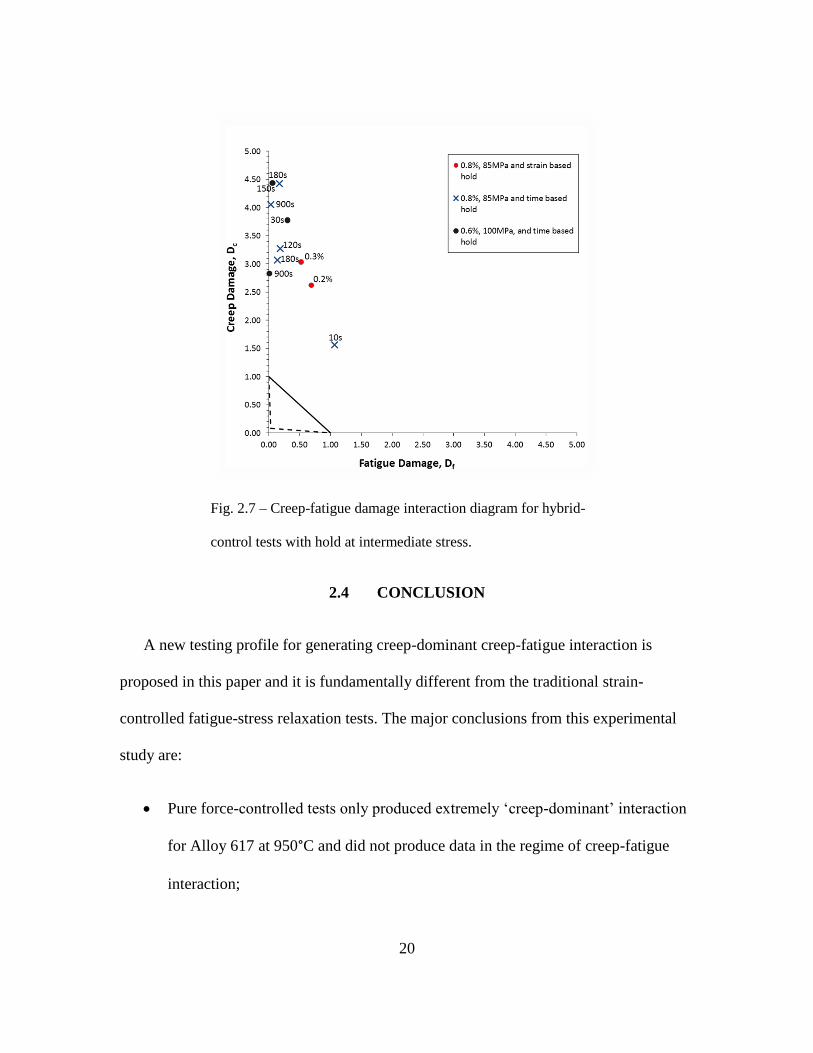
The results are presented on creep-fatigue interaction diagram in Fig. 2.7. In
traditional strain-controlled creep-fatigue testing for Alloy 617, the fatigue damage
fraction (usually between 0.3 and 0.7) is larger than the creep fraction (usually in the
range of 0-0.2). For the proposed testing profiles, the results are very different. The tests

19
have large creep fraction (ranging from 1.5 to 4.5) and a relatively small fatigue fraction
(mostly falling between 0 and 0.5). A creep fraction larger than unity has been reported in
the literature for steels [14,21,22]. It is also interesting to note that, using the new testing
profiles, creep fraction does not increase monotonically with increasing hold time. This
contradicts the common expectation that a longer hold time will lead to higher creep
damage fraction. The absence of a clear trend combined with large values of creep
fraction mean that damage summation and time fraction approach are not sufficient for
creep-fatigue life prediction for this new loading profile. A detailed explanation requires
further experiments and analysis. The authors suspect this phenomena is due to the
following reasons: (i) existing life prediction models with time fraction approach are
more suitable for strain-controlled loading waveforms; (ii) creep-fatigue interaction is
strongly dependent on the type of loading waveform used [21] so different loading
waveforms may follow different interaction curves; (iii) the definition of creep damage
fraction as a ratio of cyclic hold time and creep rupture time is not appropriate since creep
strain in creep-fatigue tests does not accumulate monotonically (i.e., in the case of creep
rupture testing) with cycles due to the strain reversal. The above statements would imply
that a new life-prediction methodology must be proposed to accurately predict life for
both strain-controlled and hybrid-controlled loading profiles.
20
Fig. 2.7 – Creep-fatigue damage interaction diagram for hybrid-
control tests with hold at intermediate stress.
2.4 CONCLUSION
A new testing profile for generating creep-dominant creep-fatigue interaction is
proposed in this paper and it is fundamentally different from the traditional strain-
controlled fatigue-stress relaxation tests. The major conclusions from this experimental
study are:
Pure force-controlled tests only produced extremely ‘creep-dominant’ interaction
for Alloy 617 at 950°C and did not produce data in the regime of creep-fatigue
interaction;

21
When Alloy 617 was subjected to novel loading waveforms - with a combination
of force and strain control at 950°C, the creep damage fraction as estimated by the
time fraction rule was greater than unity;
Experimental results from the new loading profiles did not show clear and
monotonic trends on the creep-fatigue damage interaction diagram;
Classical creep-fatigue life prediction models are based on strain-controlled tests
and cannot be extended to non-standard loading waveforms.
The damage interaction diagram based on time fraction rule - currently suggested by
Boiler and Pressure Vessel Code [23] – is not valid for creep-fatigue life prediction under
unconventional loading waveforms. Hence, further experiments and analytical study are
required to develop a new creep-fatigue damage interaction diagram for design purposes.
The new diagram must work for the proposed loading waveforms as well as the
traditional strain-controlled testing. Moreover, a mechanism investigation of
microstructural damage evolution may be conducted to reveal any correlations between
local damage features and the applied loading waveforms. A life prediction model which
utilizes a damage interaction diagram based on micro-scale damage evolution
mechanisms will be valuable for a complete understanding of the proposed testing
profiles and creep-fatigue failure of Alloy 617 at elevated temperatures.

22
IMAGE-BASED CREEP-FATIGUE DAMAGE MECHANISM
INVESTIGATION
3.1 INTRODUCTION
Creep-fatigue interaction can be explained microstructurally as a combined effect of
creep and fatigue damage, where creep mainly produces internal voids while fatigue
generates surface cracks [1]. Alloy 617 contains M6C and M23C6 type carbides, where
Cr23C6 constitutes a large portion of the grain boundary and twin boundary precipitates
[24]. These precipitates provide creep resistance by preventing grain boundary sliding,
and they also act as void nucleation sites. Under creep-fatigue conditions, multiple voids
initiate and coalesce along the grain boundaries and eventually interact with surface
cracks to accelerate intergranular crack growth [16]. Alloy 617 is also known to form a
layer of Cr2O3 on the surface of test specimens in air at elevated temperatures and the
thickness of this oxide layer is a function of time and temperature [25]. Underneath the
surface oxide layer is a sub-layer consisting mainly of Al2O3 precipitates [8] and a
decarburized region due to the oxidation of chromium carbides [26]. Surface cracks are
typically flanked by a Cr rich oxide layer [7]. Dynamic recrystallization[25] and
precipitate redistribution[27] have also been studied for Alloy 617 at temperatures of 800-
1000°C. Studies on microstructural damage induced in Alloy 617 under strain-controlled
creep-fatigue loading at 950°C observe large amounts of grain-boundary cracking but
negligible cavitation, especially for longer hold times [8,16]. The absence of creep voids
coupled with internal grain boundary cracking [8] indicates that purely strain-controlled
loading causes fatigue-dominated failure for Alloy 617 at 950°C. This can be explained
23
by rapid stress relaxation of Alloy 617 at high temperatures which implies that increasing
hold time will not increase the creep damage fraction in the strain-controlled testing [6,7].
This study employs a loading profile with force-controlled hold periods [28] to generate a
larger proportion of creep damage, thereby allowing tests to cover the entire range from
fatigue dominated to creep dominated failure.
Fatigue life at elevated temperatures is influenced by strain rate, hold time, type of
hold – stress or strain, and type of loading waveform [1,21]. Existing creep-fatigue design
curves for Alloy 617 are derived from tests with strain-controlled loading profiles [7,9].
These design curves are based on damage summation rule using the time fraction
approach, which is inadequate for life prediction of Alloy 617, regardless of the loading
profile ( i.e. strain-controlled or force-controlled hold periods) [6,28]. Moreover, the
widely used damage diagram (D-diagram) is a phenomenological representation of macro
level testing data. An accurate D-diagram should be directly supported by the underlying
microstructural damage mechanisms, which is currently lacking in the open literature.
Thus, there is a need for a creep-fatigue life prediction methodology that is informed by
an analysis of microstructural damage features. The objective of this study is to
qualitatively and quantitatively investigate the microstructural failure mechanisms using
imaging analysis. The imaging analysis results are compared with the macro-level
loading parameters, both from classical creep-fatigue damage summation rule suggested
by the ASME Boiler and Pressure Vessel Code [9] and a newly proposed approach based
on correlational analysis.
24
The paper is organized as follows. First, the experimental testing procedure for the
new testing profile is discussed along with testing matrix, and specimen preparation.
Next, qualitative imaging interpretation is given for the damage features observed and
their relationship with loading conditions. A quantitative statistical analysis is performed
to extract the fatigue crack length distribution and interval void density distribution
information. The statistical information is then compared with the classical time fraction
approach for life prediction suggested in ASME codes. Following this, the same testing
procedure is applied to a set of interrupted test specimens and time-dependent micro-
scale damage evolution is investigated. Finally, some conclusions and future work are
drawn based on the proposed study.
3.2 EXPERIMENTAL TESTING AND IMAGING ANALYSIS
3.2.1 Testing Setup and Procedure
Creep-fatigue tests were carried out on a servo-hydraulic load frame equipped with a
three-zone furnace. Furnace temperature was maintained at 950°C for the duration of
each test. The test specimens had a circular cross-section, button-head ends, and
tangentially blended fillets between the test section and ends, in accordance with ASTM
2714-13. The specimen had a gage length of 20mm and reduced section diameter of
7.5mm. The temperature difference along the gage length was maintained below 10°C
with the aid of four thermocouples wrapped on to the specimen. Strain was measured by
an extensometer with ceramic extension rods that remained in contact with the specimen
during the test.
25
The loading profile for the tests was different from the classical strain-controlled
stress relaxation testing. Fig. 3.1 shows the creep-fatigue loading waveform [28] that was
used for the tests. The ramps are strain-controlled at a constant rate of 1x10⁻³/s, whereas
the hold is force-controlled. Combinations of fatigue strain range, holding stress, and
hold time were applied to generate varying proportions of creep and fatigue damage. In
this study, the testing matrix was designed by varying the fatigue strain range (0.6% and
0.8%), holding stress (85 MPa and 100 MPa), and holding time (30 s, 180 s and 900 s).
Fig. 3.1 – (a) A schematic of the loading waveform; (b) Loading waveform for first, mid and
last cycle for a test with 0.8% fatigue strain range and a 10s hold at 85 MPa;
Ruptured test specimens were split in half along the longitudinal axis using
Electric Discharge Machining (EDM). The flat side of the sectioned specimens was
initially ground with silicon carbide grit papers ranging from 240 to 1200 grit and
subsequently polished with 1 micron polycrystalline diamond suspension on a polishing
26
pad. The specimens were then examined under Scanning Electron Microscope (SEM) to
obtain qualitative and quantitative information about creep-fatigue damage.
3.2.2 Qualitative Image Analysis for Mechanism Investigation
Qualitative image analysis of failure patterns, microstructural damage features,
grain structures, and elemental analysis were performed. The failure surfaces were
investigated first. There are generally two distinct failure patterns observed in the test
specimens. One pattern is associated with significant necking and cup-shape failure
surface. The failure surface is very rough indicating ductile rupture. This failure pattern
usually occurs with longer hold time and lower fatigue cycles. Another pattern is
associated with less necking and relatively flat failure surface. The fracture surface is
relatively smooth and shows classical failure characteristics of brittle fatigue fracture.
This failure pattern usually occurs with shorter hold time and higher fatigue cycles. Fig.
3.2 shows tests specimens with the abovementioned failure patterns. This observation
strongly suggests that there are at least two failure modes in this testing: one is creep
rupture-dominated and the other is fatigue fracture-dominated.

27
(a) (b) (c)
Fig. 3.2 – Optical images of the sectioned test specimens for 0.8% fatigue strain range and 85
MPa holding stress with (a) 30 s holding time; (b) 180 s holding time; (c) 900 s holding time.
Following this, the SEM images for all failure specimens are taken and
observations focused on the internal voids and surface cracks. The representative results
are shown below with respect to different holding time. Fig. 3.3 shows the 900 s hold
time test resulted in creep dominated failure as evidenced by large voids which showed
signs of coalescence. Surface cracks are shorter and tend to link with the sub-surface
voids (Figs. 3.3(a) and 3.3(b)). Many internal voids are initiated and are linked together
to eventually break the specimen. Fig. 3.4 shows the 180 s hold time test which also
produced both voids and cracks, but there was minimal interaction between them. The
average crack length is longer than that observed for 900 s hold and the average void
density is smaller than that observed in 900 s hold (quantitative statistical analysis will be
shown later). Fig. 3.5 shows the 30s hold time test, which resulted in fatigue dominated
failure indicated by the long surface cracks, some internal cracks and no voids (or the
voids are smaller than the current resolution allows i.e. diameter > 1~2 μm). The long
28
surface cracks appear to show a mix of inter-granular and trans-granular crack growth. In
general, the surface cracks become more straight and perpendicular to the applied loading
direction in 900 s hold test than that in the 30 s hold test (see Figs. 3.3-3.5). This
observation suggests that the fatigue crack propagation tends to be more trans-granular
when the holding time decreased. This can be explained by the weakening of grain
boundaries by the creep voids. As most internal voids lie on the grain boundaries,
significant creep damage will make the fatigue crack propagate along the weakened grain
boundaries. If the grain boundary is not weakened significantly (i.e., lower hold time and
creep damage), the fatigue crack will propagate as trans-granular cracks.
The crack surfaces were oxidized (see Fig. 3.5(c) and 6(d)) which is due to the
long exposure time of fatigue crack surfaces under high temperature conditions. EDS
results will be shown later to confirm the oxidization by elemental analysis. Grain
boundary cracks in the interior of the specimen were only observed in fatigue dominated
case and it is known that strain-controlled creep-fatigue testing on Alloy 617 at 950°C
tends to generate interior grain boundary cracks instead of large voids [8]. This implies
that most strain-controlled creep-fatigue tests lie in the fatigue dominated failure regime.
29
Fig. 3.3 – Test specimen with creep dominated failure (i.e. 900 s hold) shows (a), (b) linkage of
surface cracks with sub-surface voids; (c) , (d) extensive void coalescence near fracture
surface.
(a) (b)
(c) (d)
30
Fig. 3.4 – Test specimen with creep-fatigue interaction failure (i.e. 180 s hold) shows (a) mixed
inter- and trans-granular crack growth (b), (c) transgranular cracks and (d) voids concentrated
near the specimen surface.
(a) (b)
(a) (b)
(c) (d)

31
Fig. 3.5 – Test specimen with fatigue dominated failure (i.e. 30 s hold) shows (a), (b) long
intergranular cracks; (c), (d) thin o layer flanking the cracks and grain boundaries ahead of the
crack tip.
Next, Electron Backscatter Diffraction (EBSD) was used on a specimen with
creep dominated failure to identify the grain structure with respect to damage. It is
observed that most internal voids are on the grain boundaries. An example is shown in
Fig. 3.6. SEM images were obtained to identify the region of interest (ROI) with voids.
The EBSD images for the ROI were then compared / overlapped with the SEM images. It
is clear that the voids were generated at the grain boundaries (GB), especially near triple
junctions and GBs with high misorientation angles. The voids tend to grow along the GB
and link with the neighboring GB voids.
(c) (d)

32
Fig. 3.6 – SEM and EBSD imaging for internal voids of failed specimen
Following this, Energy Dispersive Spectroscopy (EDS) was used to identify the
elements near the fatigue cracks. Fig. 3.7 show an EDS phase map for a test specimen
with 0.6% fatigue strain range, 100 MPa holding stress, and 30 s hold time. This
condition represents fatigue dominated failure for current loading profile. The crack
surfaces were flanked by an external layer of chromium oxide and an internal layer of
aluminum oxide. The precipitates were titanium nitride. In contrast to the fatigue
dominated test specimen, the creep dominated specimen showed blunt cracks with no
oxidation layer. This indicates that creep dominated specimens developed surface cracks
near the end of the cycle life, whereas fatigue dominated specimens developed surface
cracks early on, allowing sufficient time for the exposed surfaces to oxidize. The EDS
composition map is shown in Fig. 3.7.

33
Fig. 3.7 – EDS phase maps for surface crack on a test specimen with fatigue dominated
failure
Fig. 3.8 compares the relation between cycle life and hold time for hybrid-control
and strain control tests. In traditional strain-controlled creep-fatigue tests, increasing the
hold time does not lead to increase in creep damage, due to rapid stress relaxation of
Alloy 617, as shown in Fig. 3.8(b). However, hybrid-control tests show a reduction in
cycle life with increase in hold time, as shown in Fig. 3.8(a). Generating creep dominated
damage is one of the main advantages of using a hybrid-control loading profile. Micro-
scale image analysis provides physical evidence for this behavior. Specimens undergoing
hybrid-control loading show that longer hold time does leads to more creep damage as
characterized by void initiation and coalescence at grain boundaries whereas shorter hold
time leads to fatigue dominated damage as represented by oxidation-assisted crack
growth at exposed outer surfaces.
34
Fig. 3.8 – Relation between cycle life and hold time for (a) hybrid-control tests; (b) strain-
control tests [29].
3.2.3 Digital Imaging Measurements and Statistical Data Analysis
Above discussion was interpretation of imaging for experimental observations of
a new testing profile that is capable of producing creep dominated failure. It provides
insights into the damage mechanisms involved, but does not provide quantitative
measurements for future life prediction models and design curves. Thus, this section
focuses on digital imaging measurements and statistical data analysis to achieve this goal.
The focus is on the following metrics: surface crack length, number of voids, and void
area / area fraction.
The new hybrid-control creep-fatigue tests covering a range of creep and fatigue
fractions were used for image-based damage analysis in SEM. The length of each surface
crack along the gage length of the specimen was measured in SEM to provide an estimate
(a) (b)

35
of fatigue damage. Fig. 3.9 shows the tail of an empirical cumulative distribution function
of the crack lengths from three tests with a fatigue strain range of 0.6%, a holding stress
of 100 MPa and hold times of 30, 180, and 900s, respectively. The distribution of crack
lengths less than 200μm was almost identical for the three tests. However, the 10%
percentile curves for cracks with lengths greater than 200μm showed significant
differences between creep dominated and fatigue dominated failure modes. In this case,
30s hold time represents fatigue dominated failure whereas a 900s hold time represents a
creep dominated failure. The fatigue dominated case has much longer crack lengths
compared to the creep dominated case. It should be noted that the mean crack length is
not compared here as the failure is an extreme event and only the tail region (i.e., longest
cracks in the specimen) affect the final failure. In the current investigation, the longest
crack observed in the fatigue dominated specimen is about 10 times the length of the
longest crack in the creep dominated case. The mean and standard deviation of the
measured cracks are shown in Table. 3.1. It is observed that, not only the mean crack
length, but also the standard deviation of the crack length increases as the hold time
decreases.

36
Fig. 3.9 – Empirical cumulative distribution function (F(x)) for length of surface cracks
(x) during creep-fatigue tests with varying hold time
Hold Time,
s
Mean Crack
Length
(μm)
Standard
Deviation
(μm)
30 94.05 230.62
180 69.06 76.30
900 51.59 47.80
Table. 3.1 – Mean crack length and standard deviation
corresponding to different hold times

37
The next digital measurements were for the internal voids. Multiple SEM images
were captured across the width of the specimen at distances of 1mm, 3mm and 5mm from
the rupture surface, as shown in Fig. 3.10. The reason is that the internal void distribution
is not uniform across the length of the specimen. Image analysis was performed to
determine the ratio of area covered by voids to the total area in the image. This void area
fraction was used as an indicator of creep damage in the sample. Fig. 3.10 summarizes
the void damage in a test specimen with creep dominated failure i.e. 0.6% fatigue strain
range, 100 MPa holding stress, and 900 s hold time. The results of image analysis for this
particular sample are shown in Table 3.2. The area fraction of voids and average void
size was highest near the rupture surface but the number of voids was lowest, indicating
that final failure was caused by void coalescence. Only voids larger than 1 μm were
analyzed. A similar analysis was performed on the fatigue dominated test specimen with
30 s hold time and creep-fatigue interaction test specimen with 180s hold time. No voids
larger than 1 μm were detected on the fatigue dominated test specimen with 30 s hold
time. For the creep-fatigue interaction specimen, voids were present but their average
size and area fraction was less than the creep dominated specimen.
38
Fig. 3.10 – Analysis of voids on a sectioned half of the ruptured test specimen
Distance from
Fracture
Surface,
mm
No. of
Voids
Average Void
Size,
μm2
Area Fraction
of Voids, %
1 mm 56 1135.88 1.492
3 mm 86 206.96 0.373
5 mm 100 104.24 0.207
Table. 3.2 – Variation in number, size and area fraction for voids at
fixed distances from the rupture surface
1 mm
3 mm
5 mm

39
3.3 CORRELATIONAL ANALYSIS FOR IMAGING MEASUREMENT AND
MECHANICAL DAMAGE PARAMETERS
As mentioned in the introduction, one benefit for the rigorous quantitative imaging
analysis is that it can provide a statistical correlation with the external damage
parameters. Thus, the micro-scale damage features and macro-level damage parameters
can be linked. This section focuses on this objective. For the micro-scale damage
features, the crack length and void area fraction are selected. For the macro-level damage
model, the widely used ASME damage summation rule with time fraction approach is
applied. The damage parameters are fatigue fraction (i.e., number of cycles to failure in
creep-fatigue testing normalized by the corresponding pure fatigue failure cycles) and
creep fraction (summation of hold time normalized by the creep rupture time). It is
expected that, if the model is correct, a correlation between the micro-scale features and
damage parameters can be identified. The following analyses are done for fatigue and
creep correlation, respectively.
If fatigue damage is considered as initiation and propagation of surface cracks and
creep damage is considered as initiation, growth, and linkage of voids, then creep-fatigue
interaction diagram based on these damage features can provide useful insights for the
purpose of developing microstructure-informed creep-fatigue life prediction models.
Tests were performed with varying fatigue strain range, holding stress, hold time, and
type of hold to generate creep-fatigue interaction. The type of hold refers to whether the
force-controlled hold during each cycle was for a fixed time period or up to a fixed strain
value. Fig. 3.11 shows a significant variation in crack lengths across different tests for
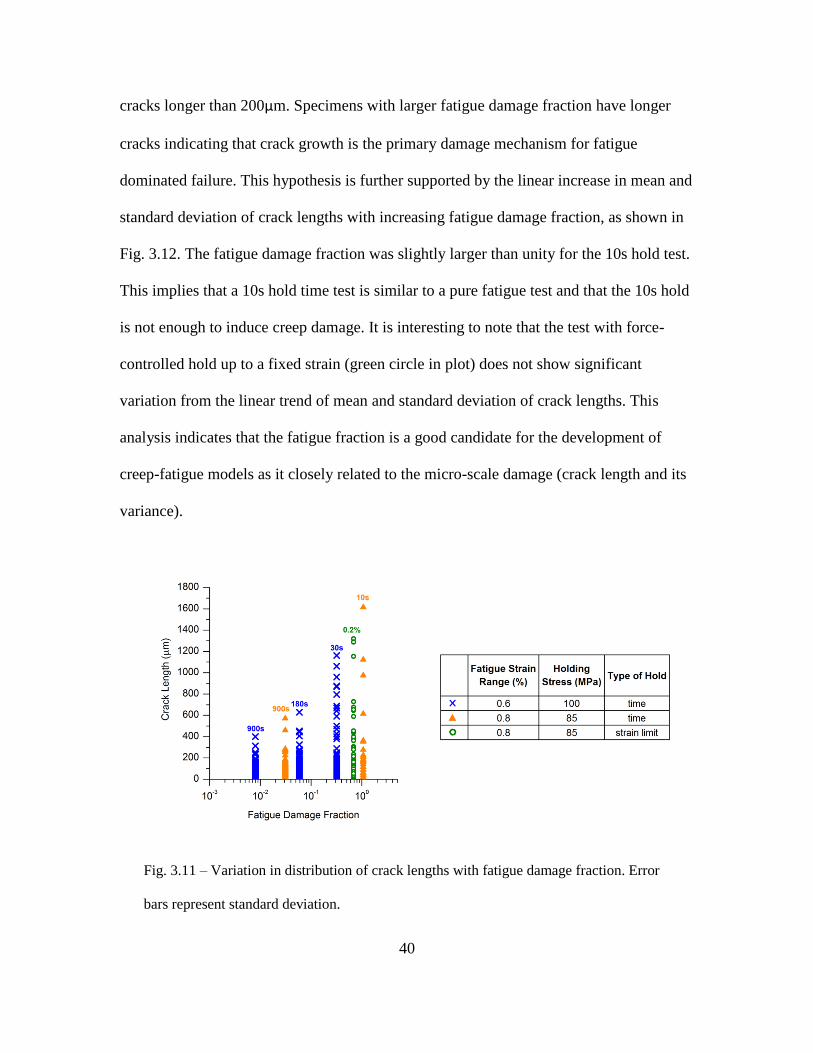
40
cracks longer than 200μm. Specimens with larger fatigue damage fraction have longer
cracks indicating that crack growth is the primary damage mechanism for fatigue
dominated failure. This hypothesis is further supported by the linear increase in mean and
standard deviation of crack lengths with increasing fatigue damage fraction, as shown in
Fig. 3.12. The fatigue damage fraction was slightly larger than unity for the 10s hold test.
This implies that a 10s hold time test is similar to a pure fatigue test and that the 10s hold
is not enough to induce creep damage. It is interesting to note that the test with force-
controlled hold up to a fixed strain (green circle in plot) does not show significant
variation from the linear trend of mean and standard deviation of crack lengths. This
analysis indicates that the fatigue fraction is a good candidate for the development of
creep-fatigue models as it closely related to the micro-scale damage (crack length and its
variance).
Fig. 3.11 – Variation in distribution of crack lengths with fatigue damage fraction. Error
bars represent standard deviation.

41
Fig. 3.12 – Mean and standard deviation of crack length increase with increasing fatigue
damage fraction
42
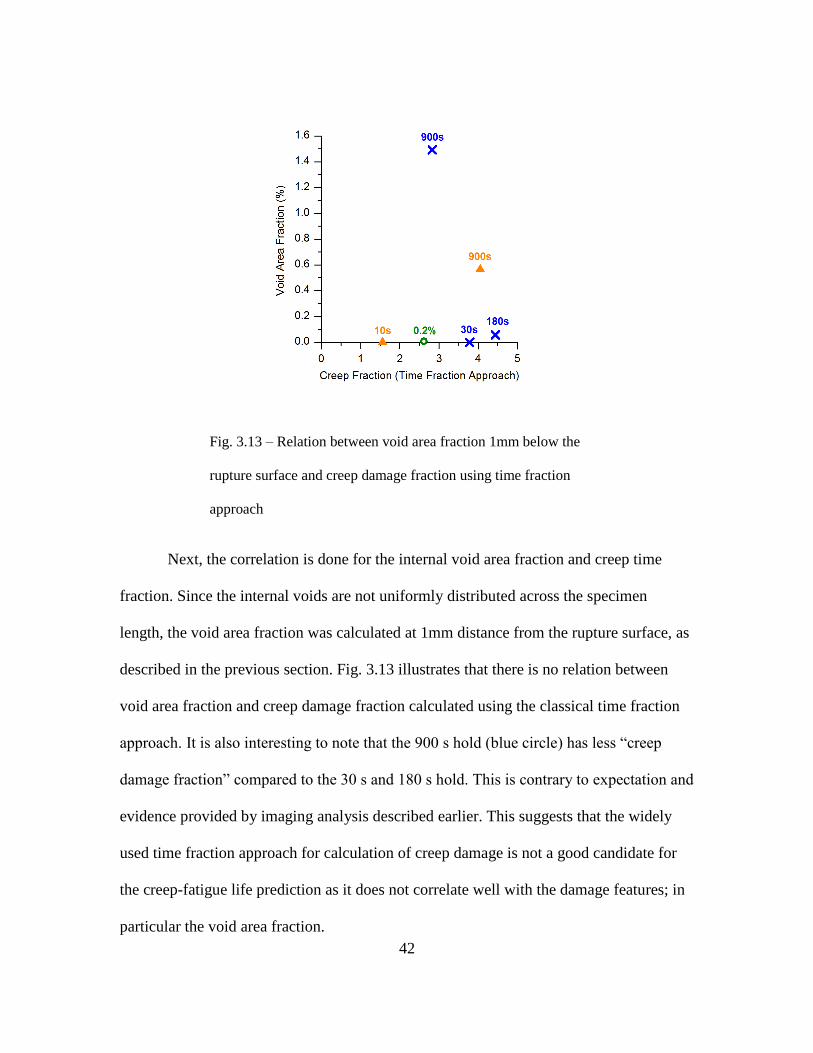
Fig. 3.13 – Relation between void area fraction 1mm below the
rupture surface and creep damage fraction using time fraction
approach
Next, the correlation is done for the internal void area fraction and creep time
fraction. Since the internal voids are not uniformly distributed across the specimen
length, the void area fraction was calculated at 1mm distance from the rupture surface, as
described in the previous section. Fig. 3.13 illustrates that there is no relation between
void area fraction and creep damage fraction calculated using the classical time fraction
approach. It is also interesting to note that the 900 s hold (blue circle) has less “creep
damage fraction” compared to the 30 s and 180 s hold. This is contrary to expectation and
evidence provided by imaging analysis described earlier. This suggests that the widely
used time fraction approach for calculation of creep damage is not a good candidate for
the creep-fatigue life prediction as it does not correlate well with the damage features; in
particular the void area fraction.

43
Creep-fatigue interaction in steels is traditionally represented by a bilinear trend
curve on an interaction diagram that is based on linear damage summation rule and time
fraction approach[21,30]. Fatigue damage is represented as a cycle fraction and creep
damage is represented as time fraction. Although, the time fraction approach is employed
in nuclear component design codes, namely, ASME BPVC Section III Subsection NH[9]
and RCC-MR[11], this approach has several limitations[19,31]. Moreover, elevated
temperature strain controlled testing of Alloy 617 fails to produce a clear trend on an
interaction diagram due to irregular values of creep damage fraction [5,28]. Further
theoretical and experimental study is required to find another parameter that is best
correlated with the observed internal voids. The current study only investigates a simple
alternative mechanical parameter, called effective creep time fraction. The basic idea is
briefly discussed here. For the investigated hybrid control loading profile, the total creep
strain will monotonically increase from cycle to cycle due to the softening. Thus, the hold
time can be divided into two parts: one part is to recover the creep strain happens in the
previous cycle and the other part is to increase the creep strain to a new high level. The
second part is referred to as the effective hold time and it indicates the time is “effective”
in causing monotonic creep strain increment. The summation of this part of hold time for
all cycles can be normalized by the creep rupture time and is defined as the effective
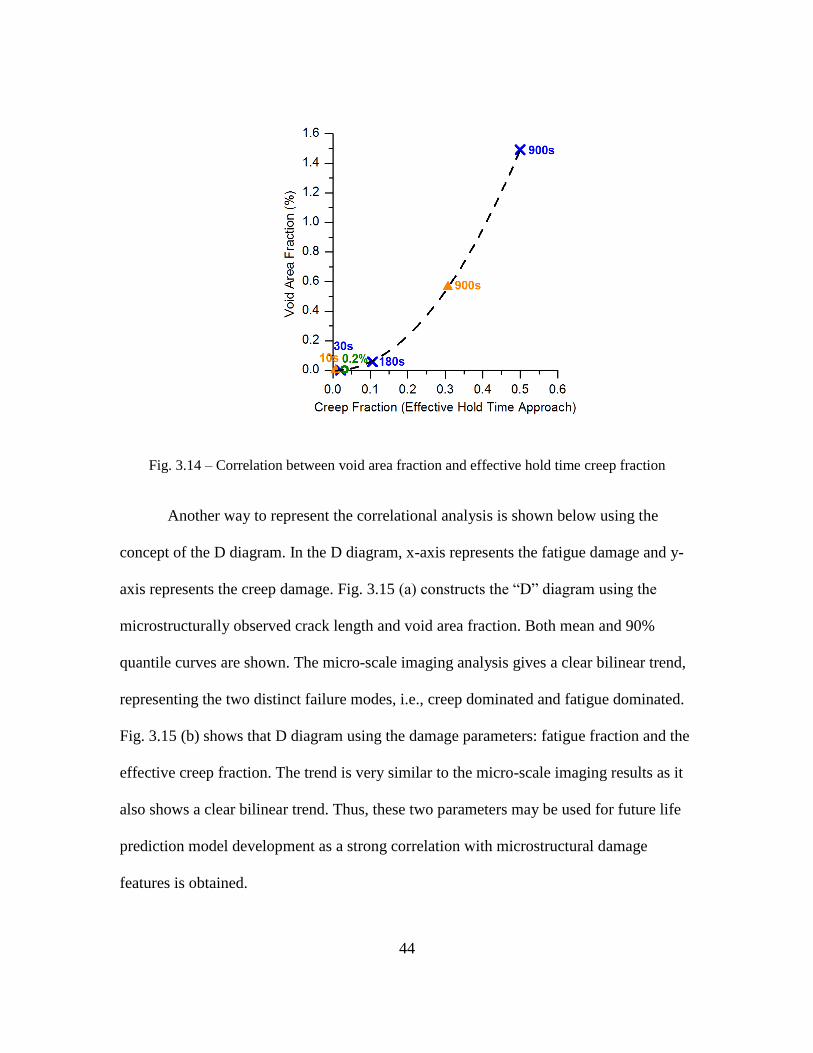
creep fraction. Fig. 3.14 shows that the observed internal void area fraction has a very
good correlation with the effective time fraction definition. It also shows that the creep
damage fraction increases as the hold time increases unlike the contradictory results from
the classical time fraction approach.
44
Fig. 3.14 – Correlation between void area fraction and effective hold time creep fraction
Another way to represent the correlational analysis is shown below using the
concept of the D diagram. In the D diagram, x-axis represents the fatigue damage and y-
axis represents the creep damage. Fig. 3.15 (a) constructs the “D” diagram using the
microstructurally observed crack length and void area fraction. Both mean and 90%
quantile curves are shown. The micro-scale imaging analysis gives a clear bilinear trend,
representing the two distinct failure modes, i.e., creep dominated and fatigue dominated.
Fig. 3.15 (b) shows that D diagram using the damage parameters: fatigue fraction and the
effective creep fraction. The trend is very similar to the micro-scale imaging results as it
also shows a clear bilinear trend. Thus, these two parameters may be used for future life
prediction model development as a strong correlation with microstructural damage
features is obtained.

45
Fig. 3.15 –D diagram construction using micro-scale imaging results and damage
parameters (a) Damage interaction diagram based on microstructure; (b) Damage
interaction diagram based on effective hold time approach.
(b)
(a)
46
3.4 INTERRUPTED TESTING
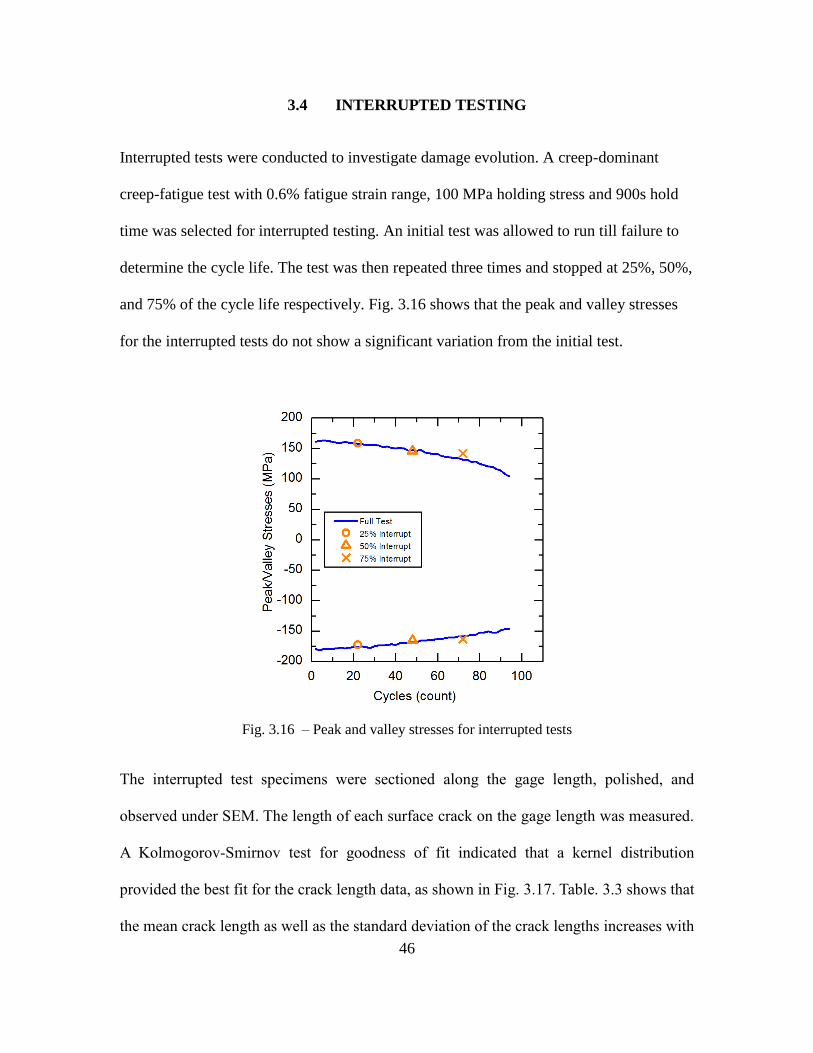
Interrupted tests were conducted to investigate damage evolution. A creep-dominant
creep-fatigue test with 0.6% fatigue strain range, 100 MPa holding stress and 900s hold
time was selected for interrupted testing. An initial test was allowed to run till failure to
determine the cycle life. The test was then repeated three times and stopped at 25%, 50%,
and 75% of the cycle life respectively. Fig. 3.16 shows that the peak and valley stresses
for the interrupted tests do not show a significant variation from the initial test.
Fig. 3.16 – Peak and valley stresses for interrupted tests
The interrupted test specimens were sectioned along the gage length, polished, and
observed under SEM. The length of each surface crack on the gage length was measured.
A Kolmogorov-Smirnov test for goodness of fit indicated that a kernel distribution
provided the best fit for the crack length data, as shown in Fig. 3.17. Table. 3.3 shows that
the mean crack length as well as the standard deviation of the crack lengths increases with

47
cycles. The exponential increase in standard deviation during the first three quarters of the
cycle life can be explained by the initiation of new cracks. The relatively smaller increase
in standard deviation during the final quarter indicates that new cracks initiated at a slower
rate during this period.
Fig. 3.17 – Probability density function of crack lengths at different
interrupts
Mean Crack
Length, μm
Standard
Deviation, μm
25% Cycle Life 15.40 10.30
50% Cycle Life 23.16 21.06
75% Cycle Life 43.54 44.25
100% Cycle Life 51.59 47.80
Table. 3.3 – Mean crack length and standard deviation at different
interrupts
48
The total number of micro-voids on the gage section of the test specimen was much higher
than the number of surface cracks and there was a significant variation in void damage
along the gage length. Therefore, an accurate representation of void damage required
capturing a large number of high-magnification images covering the entire gage length of
the specimen. Since, such a task was beyond the scope of this study, the void damage was
studied qualitatively by imaging localized regions of high void density on each specimen
and comparing amongst the interrupted tests. Void density was found to be highest near the
specimen surface. This can be attributed to oxidation on the surface of the test specimen
and consequent decarburization of grain boundary carbides located near the surface. A large
increase in mean void size and void area fraction was observed in the last quarter of the
cycle life indicating that most of the void growth and coalescence occurred towards the
end of the cycle life. This information combined with the crack length analysis shows that,
for a creep-dominant test, the damage mechanism changes from crack initiation and growth
to void growth and coalescence during the last quarter of the life.
3.5 CONCLUSION
Hybrid-control testing can generate creep dominated failure. Image-analysis
confirms that, unlike the classical strain-controlled testing, the new hybrid control testing
profile can increase the creep damage by increasing the hold time under force-control.
Qualitative image analysis shows that there are two distinct failure modes in the
investigated testing cases: ductile creep dominated failure with long hold time and brittle
fatigue dominated failure with short hold time. The fatigue crack length correlates well
with the cycle number ratios but the void area fraction does not correlate well with the
49
classical time fraction used by ASME code. An effective hold time approach (i.e. only
considering the part of the hold time when net creep strain increase happens) correlates
well with the observed void area fraction and provides an alternative way to formulate the
damage interaction diagram. These conclusions currently apply to creep-fatigue
interaction in Alloy 617 at 950˚C under force-controlled hold periods. A similar analysis
can be performed on tests with strain-controlled hold periods, to confirm their inadequacy
for generating significant creep damage. Further work may also include the development
of a life prediction model, similar to the effective hold time approach, which mimics the
bilinear damage curve obtained through micro-scale image analysis.

50
AN EFFECTIVE TIME FRACTION APPROACH FOR CREEP-FATIGUE
LIFE PREDICTION
4.1 INTRODUCTION
Accurate life prediction and design methods are critical to ensuring structural integrity
and reliability. Nuclear component design codes such ASME-NH [23], RCC-MR [11],
and R5 Procedure [12] suggest linear summation of fatigue and creep damage for life
prediction. ASME-NH and RCC-MR use a time fraction rule [18,32], where creep
damage is represented by a time fraction whereas the R5 Procedure uses a ductility
exhaustion concept [33,34], where creep damage is represented by a strain fraction. The
parameter that controls creep damage in time fraction approach is stress whereas in
ductility exhaustion it is inelastic strain [13,35]. Comparative studies on steels and alloys
showed that the time fraction rule underestimates the creep damage leading to non-
conservative prediction, whereas the ductility exhaustion approach overestimates the
creep damage leading to over-conservative life prediction [13,35]. Another widely
studied evaluation method is strain range partitioning [36], which divides the inelastic
strain range into three components. This approach requires collecting considerable
amount of hysteresis data with specialized loading waveforms [10]. Many other creep-
fatigue evaluation methods are available in literature [10,13,31,35,37], but few are simple
enough to be considered in design codes [38]. The focus of this study is the time fraction
approach, which is preferred by design codes due to its simplicity. Thus, the discussions
and comparisons in this paper are aimed at developing a more accurate time fraction
approach.
51
The time fraction approach requires a complete set of creep-fatigue test data for
calibration and validation. In open literature, most high temperature creep-fatigue tests
are performed using strain-controlled loading waveforms (i.e., fixed strain during hold
period leading to stress relaxation). For Alloy 617 at very high temperatures, the rapid
stress relaxation generally leads to fatigue dominated damage and therefore makes it
difficult to fully calibrate the damage diagram using the time fraction approach [6,13].
Thus, in the current study, a full range of creep-fatigue test data (i.e., both fatigue
dominated and creep dominated) at 850°C and 950°C is collected through a newly
developed hybrid-controlled loading profile with force-controlled hold periods [28].
Moreover, the experimental data, when plotted using the classical time fraction rule
suggested by the draft code case for Alloy 617 [9], shows a significant scatter [39] and
non-physical trends (e.g., values of creep damage fraction exceeding unity) [28]. The
authors have performed extensive image-based damage analysis and correlational study
using scanning electron microscopy of failed creep-fatigue test specimens [40]. It was
observed that the microstructural damage features (e.g., microstructural void density) did
not correlate with the classical time fraction calculation of creep damage. This
observation suggests that other mechanical parameters should be explored to correlate
with microstructural damage features and to predict the creep-fatigue life under such
loading conditions.
In view of the above discussion, this paper proposes a new life prediction model for
calculating creep damage in the particular case of Alloy 617 at temperatures above
850°C. The paper is organized as follows. First, the new experimental procedure for the

52
hybrid-control creep-fatigue loading [28] and the results of imaging analysis[40] are
reviewed and discussed. New tests at 850°C are presented to demonstrate the effect of
temperature on the proposed model. Following this, a detailed derivation of the proposed
effective time fraction approach is provided for both hybrid-controlled and strain-
controlled testing. A comparison with the classical time fraction approach is also given.
Next, both in-house data for the hybrid-controlled testing and literature data for the
strain-controlled testing are used to demonstrate and validate the proposed life-prediction
methodology. Finally, some conclusions are drawn and future work proposed based on
the results. The main novelties of the proposed study are: 1) provide a quantitative
mechanical model for life prediction using the hybrid-controlled testing profile [28] and
evidence from image-based analysis [40]; 2) provide a unified approach for the life
prediction using both hybrid-controlled testing and classical strain-controlled testing; 3)
check the applicability of the proposed method at both 850°C and 950°C using newly
generated experimental data.
4.2 EXPERIMENTAL PROCEDURE AND IMAGING ANALYSIS RESULTS
The authors have developed a new hybrid-controlled testing profile for creep-fatigue
testing of Alloy 617 at 950°C [28] and performed imaging analysis for the statistical
analysis of micro-scale damage features [40]. Only a brief review of these techniques is
given here for the completeness of this study. Detailed discussion and results can be
found in the referred articles. Additional experimental testing results at 850°C are
presented in this study in order to demonstrate the proposed model at different
temperatures.
53
The creep-fatigue tests in this study were run on an MTS servo-hydraulic load frame with
a three-zone furnace. The Alloy 617 specimens were machined from a block of raw
material such that the rolling direction was parallel to the loading axis of the specimen.
The specimens had a round section with button-head ends and tangentially blended fillets
at the gage section, in accordance with ASTM 2714-13. The specimen gage length was
20mm and gage section diameter was 7.5 mm.
All tests were performed in air at a constant temperature of either 850˚C or 950˚C. The
temperature difference along the gage length was maintained below 10˚C with the help of
four thermocouples that were wrapped on to the specimen at different locations. A
contact extensometer with ceramic extension rods was used for strain measurement at the
gage length. Fig. 4.1 (a) and (b) show the commonly used strain-controlled loading
profile where the test specimen undergoes stress relaxation during the hold period. In this
study, a hybrid-control loading profile [28] was applied, similar to the one shown in Fig.
4.1 (c) and (d). The loading and unloading was strain controlled at a rate of 1x10⁻³ /s,
whereas the hold period was force-controlled at a predetermined intermediate stress level.
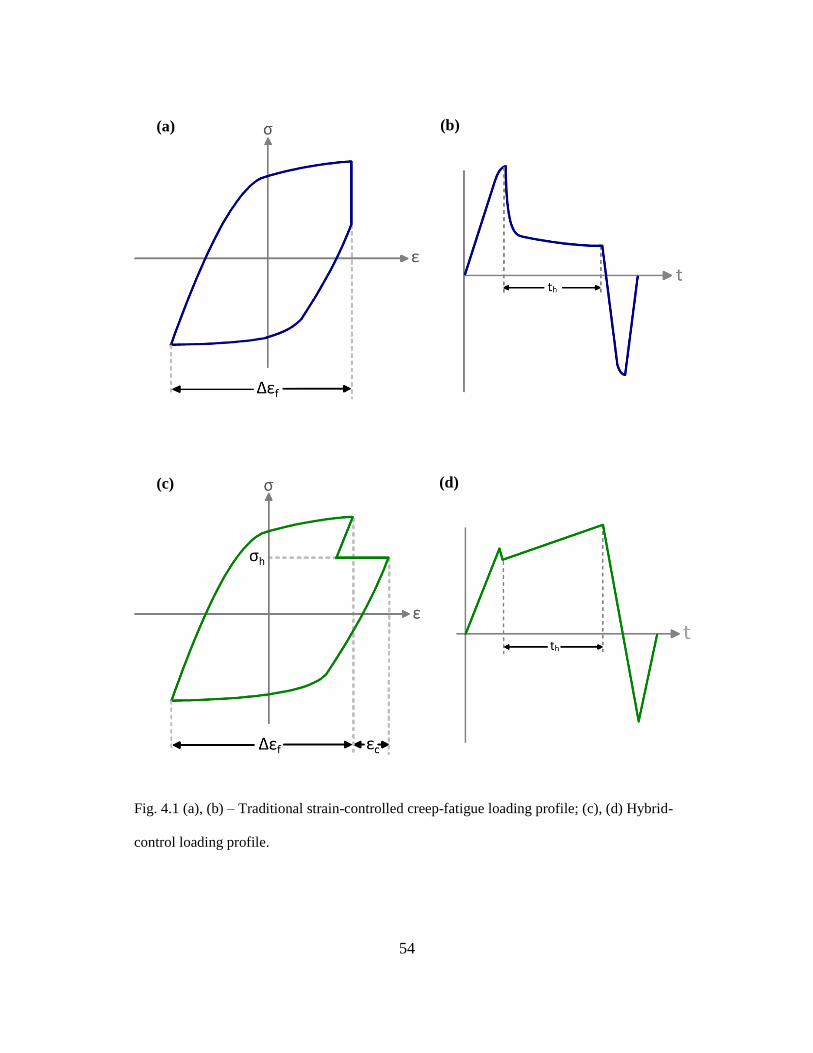
54
Fig. 4.1 (a), (b) – Traditional strain-controlled creep-fatigue loading profile; (c), (d) Hybrid-
control loading profile.
(a) (b)
(c) (d)

55
In hybrid controlled tests, increasing the hold time causes a significant reduction in cycle
life. This is contrary to strain controlled tests, where increasing the hold time beyond a
certain threshold does not lead to any decrease in cycle life. The hybrid-control loading
profile produces creep deformation instead of stress-relaxation during the hold period,
thereby avoiding the saturation effect of increasing hold time on cycle life that is
observed in strain-controlled testing. Moreover, in hybrid control loading profile, the
stress at which creep occurs does not have to be the peak stress. Therefore, hybrid control
loading waveforms can produce a variety of test data ranging from fatigue-dominated to
creep-dominated interaction. In this study, the creep-fatigue interaction was varied by
changing the fatigue strain range, (0.6% and 0.8%), holding stress (85 MPa and 100
MPa), and holding time (30 s, 180 s and 900 s). The 950°C creep-fatigue test data have
been presented in [28]. Additional tests at 850°C were performed for this study. Fig. 4.2
shows the hysteresis curves, cyclic softening, and cyclic creep strain behavior for an
850°C test with 1.0% fatigue strain range, 100 MPa holding stress, and a 180s hold time.
850°C tests require longer hold periods than 950°C tests to produce the same amount of
creep damage, as measured by effective time fraction approach. 850°C tests with hold
periods of up to 10 hours were performed.
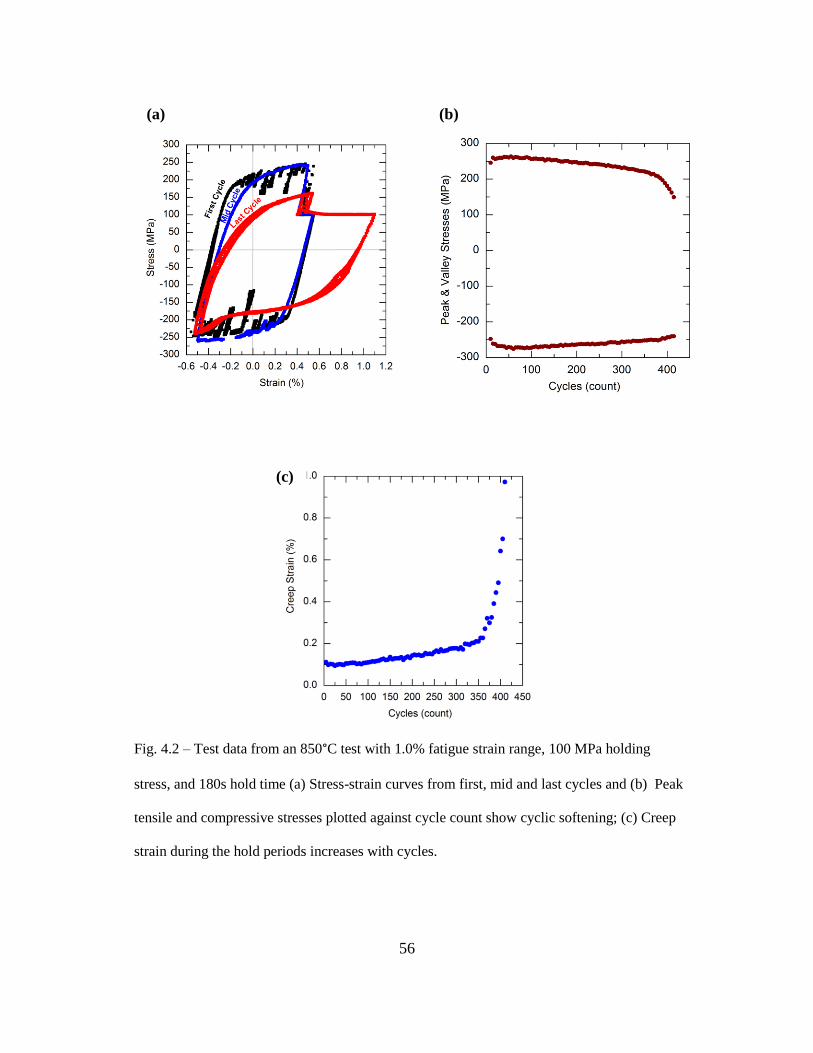
56
Fig. 4.2 – Test data from an 850°C test with 1.0% fatigue strain range, 100 MPa holding
stress, and 180s hold time (a) Stress-strain curves from first, mid and last cycles and (b) Peak
tensile and compressive stresses plotted against cycle count show cyclic softening; (c) Creep
strain during the hold periods increases with cycles.
(a) (b)
(c)
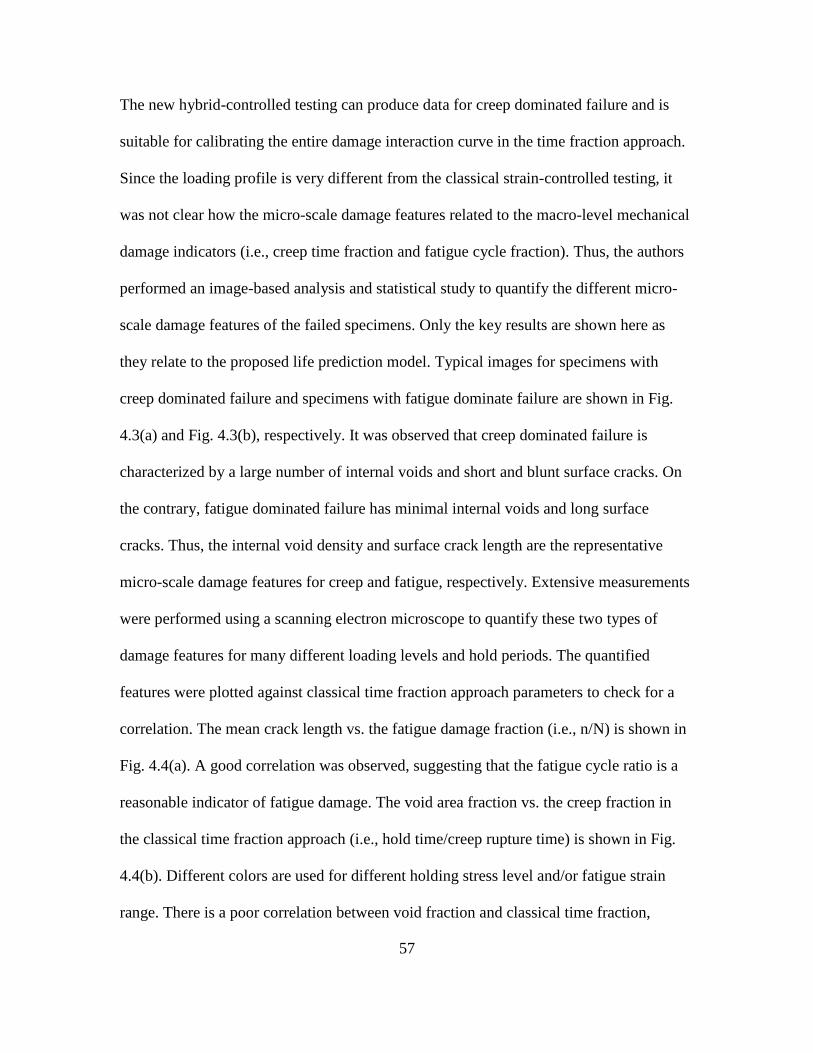
57
The new hybrid-controlled testing can produce data for creep dominated failure and is
suitable for calibrating the entire damage interaction curve in the time fraction approach.
Since the loading profile is very different from the classical strain-controlled testing, it
was not clear how the micro-scale damage features related to the macro-level mechanical
damage indicators (i.e., creep time fraction and fatigue cycle fraction). Thus, the authors
performed an image-based analysis and statistical study to quantify the different micro-
scale damage features of the failed specimens. Only the key results are shown here as
they relate to the proposed life prediction model. Typical images for specimens with
creep dominated failure and specimens with fatigue dominate failure are shown in Fig.
4.3(a) and Fig. 4.3(b), respectively. It was observed that creep dominated failure is
characterized by a large number of internal voids and short and blunt surface cracks. On
the contrary, fatigue dominated failure has minimal internal voids and long surface
cracks. Thus, the internal void density and surface crack length are the representative
micro-scale damage features for creep and fatigue, respectively. Extensive measurements
were performed using a scanning electron microscope to quantify these two types of
damage features for many different loading levels and hold periods. The quantified
features were plotted against classical time fraction approach parameters to check for a
correlation. The mean crack length vs. the fatigue damage fraction (i.e., n/N) is shown in
Fig. 4.4(a). A good correlation was observed, suggesting that the fatigue cycle ratio is a
reasonable indicator of fatigue damage. The void area fraction vs. the creep fraction in
the classical time fraction approach (i.e., hold time/creep rupture time) is shown in Fig.
4.4(b). Different colors are used for different holding stress level and/or fatigue strain
range. There is a poor correlation between void fraction and classical time fraction,
58
suggesting that the classical time fraction is not a reasonable indicator of creep damage.
Thus, alternative mechanical parameters should be proposed and developed to better
correlate with the micro-void density. The key challenge is how to define such a
mechanical parameter and how to calculate this for arbitrary loading profiles for life
prediction. This is the main motivation of the proposed study and is illustrated in detail in
the next section.
Fig. 4.3 (a) – Failed specimen with creep dominated failure shows short surface cracks and
large internal voids and (b) – failed specimen with fatigue dominated failure shows minimal
internal voids and long surface cracks.
(a)
(b)

59
Fig. 4.4 (a) – Correlation between classical creep time fraction and area fraction of voids on
the failed specimen; (b) – Correlation between fatigue cycle fraction and mean length of
surface cracks on failed specimens.
4.3 PROPOSED LIFE PREDICTION MODEL
This section develops the proposed life prediction model. The classical time fraction
approach is briefly reviewed, as it provides the basis for the proposed life prediction
methodology. Following this, the basic hypothesis and derivation of the effective time
fraction approach is shown based on the hybrid-controlled testing profile. Next, the
model is extended to strain-controlled testing profile as well, which aims to unify the
proposed concept to arbitrary loading waveforms. Details are shown below.
(a) (b)
60
4.3.1 Review of the Time Fraction Rule
Linear summation of fatigue cycle fraction (Df) and creep time fraction (Dc) in the
classical time fraction approach can be stated as [22]:
∑(𝑁𝑐𝑓
𝑁𝑓)𝑖𝑖
+∑(𝑡ℎ𝑇𝑟)𝑗𝑗
≤ 𝐷 (1)
where, Ncf is the cycle life in the creep-fatigue testing, Nf is the cycle life in pure fatigue
testing at the same strain level, th is the tensile hold time, Tr is time to rupture in pure
creep testing. D is a material dependent parameter. Creep-fatigue interaction is known to
follow a bilinear trend line on a damage interaction diagram for some steels [21,30,39].
In the case of Alloy 617 at 800-1000˚C, use of the time fraction rule to calculate creep
damage results in large scatter and absence of a trend on the creep-fatigue interaction
diagram [5,9,39]. There are several reasons for the absence of a trend on the interaction
diagram: (i) Rapid stress relaxation of Alloy 617 at high temperatures means that
increasing the hold time does not necessarily lead to a decrease in cycle life. After the
initial phase of rapid stress relaxation, maintaining the strain hold for a longer period of
time does not lead to an increase in creep strain. This is also known as the saturation
effect of hold time on creep damage [7]; (ii) The time fraction rule assumes that the entire
hold time is involved in irreversible creep deformation. For this to be true, the creep time
fraction cannot be larger than unity [13]. On the contrary, creep fractions larger than
unity have been reported for several metals [5,14,21,22,31,35]; (iii) Creep-fatigue tests
are traditionally conducted in strain-control where there is stress relaxation during the
hold time, instead of creep deformation. The creep time fraction, in which hold time is

61
normalized by creep rupture time, then assumes that steady-state creep behavior and
stress relaxation response are mechanistically equivalent.
4.3.2 Effective Time Fraction Approach – Hybrid-Controlled Testing
As illustrated in the previous section, image analysis shows that the classical time
fraction parameter for calculation for creep damage does not show a good correlation
with the micro-scale damage features. Further evidence for this hypothesis is obtained
when the experimental data are plotted on a damage diagram using the classical time
fraction approach. This damage diagram is shown in Fig. 4.5. The data shows a large
scatter with most of the creep fractions exceeding unity. This confirms that the classical
time fraction approach is not appropriate for the creep-fatigue life prediction, at least for
the hybrid-controlled testing data. The creep damage fraction should, in principle, be less
than unity for the creep-fatigue testing with an extreme value of unity being achieved for
pure creep rupture testing. This observation indicates that the classical time fraction
calculation for creep damage ‘overestimates’ the creep damage by using the entire
duration of the hold time. In other words, only a portion of the hold time contributes to
the creep damage so the calculation of the creep damage should only count this
‘effective’ portion of the hold time. For this reason, the proposed approach is called the
effective time fraction approach.

62
Fig. 4.5 – Damage interaction diagram using time fraction
rule for hybrid-controlled creep-fatigue tests.
A hypothesis is proposed based on the above observations: the effective hold time
corresponds to the time spent for the net creep strain increment compared to the last
cycle. In hybrid-controlled testing, cyclic softening is observed and the creep strain rate
during the hold time increases with cycles. The effective time fraction approach assumes
that after the first cycle, only a fraction of the hold time is involved in the net creep
deformation. This fraction, called effective hold time (𝑡𝑒ℎ), is part of the hold time during
which a net increase of creep strain occurs with respect to the previous cycle. The
schematic in Fig. 4.6 shows the application of the effective time fraction approach to the
first three cycles of a creep-fatigue test with fixed hold time per cycle. Given that hold
time is fixed, effective hold time for each cycle is the time spent to increase the creep

63
strain from the creep strain in the previous cycle. It can be calculated by considering the
increase in creep strain rate with each cycle as:
∑𝑡𝑒ℎ = ∑ (𝜀�̇�+1 − 𝜀�̇�𝜀�̇�+1
)
𝑁𝑐𝑓−1
𝑘=0
(𝑡ℎ(𝑘+1)) (2)
where, 𝜀�̇� represents the creep strain rate in cycle number k. The linear summation of
creep and fatigue damage then becomes:
∑(𝑁𝑐𝑓
𝑁𝑓)𝑖𝑖
+∑(𝑡𝑒ℎ𝑇𝑟)𝑗𝑗
≤ 𝐷 (3)
where, the first term is the fatigue damage fraction and the second term is the effective
creep damage fraction.
Fig. 4.6 – Schematic showing first three cycles of a creep-fatigue
test. White shaded area represents the strain accumulated during
the effective hold time.

64
For tests with fixed hold time per cycle, Eq. (2) can be simplified as:
∑𝑡𝑒ℎ =𝑡ℎ (∑(𝜀(𝑘+1) − 𝜀(𝑘)
𝜀(𝑘+1))
𝑛−1
𝑘=0
) (4)
Similarly, for tests with fixed creep strain per cycle, Eq. (2) can be simplified as:
∑𝑡𝑒ℎ =∑|𝑡ℎ(𝑘) − 𝑡ℎ(𝑘+1)|
𝑛−1
𝑘=0
(𝑡ℎ(𝑘+1)
𝑡ℎ(𝑘)) (5)
In hybrid-control tests, the stress is constant during the hold time so the effective creep
damage fraction (𝐷𝑒𝑐) is:
𝐷𝑒𝑐 =∑ (𝑡𝑒ℎ)𝑁𝑐𝑓𝑘=1
𝑇𝑟 (6)
The inputs required for this calculation are: creep strain rate/creep strain as a function of
cycles, and creep rupture time. For tests with fixed hold time per cycle, the creep strain
(𝜀𝑐) is approximated as:
𝜀𝑐 = 𝑐1𝑒𝑐2(
𝑘𝑁𝑐𝑓
) (7)
where, 𝑐1and 𝑐2 are fitting constants for the creep strain vs normalized cycles curve. An
average curve between creep strain rate and normalized cycles is shown in Fig. 4.7 for
multiple hybrid-control tests. Substituting Eq. (7) into Eq. (4) and simplifying gives:

65
∑𝑡𝑒ℎ
𝑁𝑐𝑓
𝑘=1
= 𝑁𝑐𝑓 (1 − 𝑒−𝑐2𝑁𝑐𝑓) (8)
Thus, for hybrid-control tests with a fixed hold time per cycle, the linear damage
summation rule of Eq. (1) becomes:
∑(𝑁𝑐𝑓
𝑁𝑓)𝑖𝑖
+∑
(
𝑁𝑐𝑓 (1 − 𝑒
−𝑐2𝑁𝑐𝑓)
𝑇𝑟
)
𝑗
𝑗
≤ 𝐷 (9)
Fig. 4.7 – Exponential relation between creep strain rate and normalized cycles.
Green dots represent creep strain rate vs cycles data from multiple hybrid-control
66
where, Ncf is the unknown. Nf is from the fatigue strain-life curve. Tr is the creep rupture
time from the creep Larson-Miller plot. c2 is from the creep strain vs normalized cycles
curve fit and D is from the creep-fatigue interaction diagram for the given material and
temperature.
4.3.3 Effective Time Fraction Approach – Strain-Controlled Testing
This section extends the effective hold time concept to the classical strain-controlled test
using literature test data. The hybrid-control loading profile has a force-controlled hold
period so the net creep increment can be extracted directly from the hysteresis curve.
However, for strain-controlled tests, which have stress relaxation during the hold period,
the net creep increment per cycle must be calculated. In the strain-controlled tests, the
stress relaxation data can be fitted by [30]:
𝜎 =𝜎0(𝑁)
𝑒𝑏1𝑡𝑏2
(10)
where, 𝜎0(𝑁) is the peak stress for cycle N. t is the time from start of the hold period. 𝑏1
and 𝑏2 are fitting constants for the stress relaxation curve. The peak stress drops as a
function of cycles due to the cyclic softening and damage accumulation. In the proposed
study, it is approximated as:
𝜎0(𝑁) = 𝑎1𝑁4 + 𝑎2𝑁
3 + 𝑎3𝑁2 + 𝑎4𝑁 + 𝑎5
(11)
where, 𝑎1−5 are fitting constants. Total strain (𝜀𝑡), which is constant for each cycle, can
be decomposed as:
67
𝜀𝑡 = 𝜀𝑒 + 𝜀𝑝 + 𝜀𝑐 (12)
where, 𝜀𝑒is the tensile elastic strain. 𝜀𝑝 is the tensile plastic strain. 𝜀𝑐 is the creep strain.
Rearranging Eq. (12) and substituting Eq. (10):
𝜀𝑐 = 𝜀𝑡 − 𝜀𝑝 −𝜎0(𝑁)
𝐸𝑒𝑏1𝑡𝑏2
(13)
For Cycle 1:
𝑡′ = 0 (14)
𝑡𝑒ℎ(𝑁 = 1) = 𝑡ℎ − 𝑡′ = 𝑡ℎ
(15)
𝜀𝑐(𝑡 = 𝑡ℎ, 𝑁 = 1) = 𝜀𝑡 − 𝜀𝑝 −𝜎0(1)
𝐸𝑒𝑏1𝑡ℎ𝑏2
(16)
where, 𝑡′ is defined as the time in current cycle when the creep strain equals the creep
strain in the previous cycle.
For Cycle 2:
At 𝑡 = 𝑡′, the creep strain in current cycle equals the creep strain in previous cycle, i.e.
𝜀𝑐(𝑡′, 2) = 𝜀𝑐(𝑡ℎ, 1)
(17)
𝜀𝑡 − 𝜀𝑝 −𝜎0(2)
𝐸𝑒𝑏1𝑡′𝑏2= 𝜀𝑡 − 𝜀𝑝 −
𝜎0(1)
𝐸𝑒𝑏1𝑡ℎ𝑏2
(18)

68
Assuming that the plastic strain and Young’s modulus do not change significantly for
consecutive cycles, Eq (18) becomes:
ln (𝑒𝑏1𝑡ℎ
𝑏2
𝑒𝑏1𝑡′𝑏2) = ln (
𝜎0(1)
𝜎0(2))
(19)
𝑏1𝑡ℎ𝑏2 − 𝑏1𝑡
′𝑏2 = ln(𝜎0(1)
𝜎0(2))
(20)
𝑡′ = [𝑡ℎ𝑏2 −
1
𝑏1ln (
𝜎0(1)
𝜎0(2))]
1𝑏2⁄
(21)
Therefore, for Cycle N:
𝑡′(𝑁) = [(𝑡′(𝑁 − 1))𝑏2−1
𝑏1ln (
𝜎0(𝑁 − 1)
𝜎0(𝑁))]
1𝑏2⁄
(22)
Effective creep damage fraction for the strain-controlled test is given by:
𝐷𝑒𝑐 = ∑∫ (1
𝑇𝑟) 𝑑𝑡
𝑡ℎ
𝑡′(𝑁)
𝑁𝑐𝑓
𝑁=1
(23)
Similar to the last section for the hybrid-controlled test, Eq. (23) and Eq. (3) provide the
proposed life prediction for a strain-controlled test.

69
4.4 RESULTS AND DISCUSSION
This section demonstrates the application and validation of the proposed life prediction
model to Alloy 617 at high temperatures. The model was first validated using the 950°C
test data. Two types of data was used. The first type is the hybrid-controlled testing data
reported in [28]. For each strain range (i.e. 0.6% and 0.8%), the hybrid-controlled tests
used holding stresses of 85MPa or 100MPa and various hold times. The second type is
strain-controlled test data reported in [29]. For each strain range (i.e. 0.3%, 0.6%, and
1.0%), the strain-controlled tests had hold times of 180s, 600s, or 1800s. The effective
time fraction approach is used to plot the experimental data in Fig. 4.8. The x-axis is the
fatigue cycle fraction and the y-axis is the effective time fraction for creep damage. A
clear bilinear trend is observed and experimental data has considerably less scatter
compared to the plot that used classical time fraction approach.
Fig. 4.8 – Damage interaction
diagram using effective time
fraction approach for hybrid-
controlled creep-fatigue tests.
70
An intersection point of (Df, Dec) = (0.0542, 0.0595) was obtained by curve fitting the
950°C hybrid-controlled test data, as shown in Fig. 4.9(a). ASME draft code case for
Alloy 617, which uses the classical time fraction rule, suggests (Df, Dc) = (0.1, 0.1) as the
intersection point for the bilinear damage envelope [9]. The values of the effective creep
fraction were less than 0.005 for all strain-controlled tests, indicating minimal creep
damage. The implication that strain-controlled tests are not capable of generating
significant creep damage is supported by damage observations of failed test specimens,
which only show intergranular fatigue cracks and no creep voids [8]. The life-prediction
for all tests is shown in Fig. 4.9(b). The x-axis is the experimental observed life and the
y-axis the predicted life using the effective time fraction model. Most data fall into the
scatter band with a life factor of 3. It should be noted that there is a systematic error
associated with the strain-controlled testing data as all predicted lives are longer than the
experimental lives. The reason for this behavior is not clear for now. The authors
suspected that this is possibly due to additional damage mechanisms that exist in the
strain-controlled CF testing, which are not included in the current formulation. Additional
experimental and theoretical investigation is required to further explain this observation.
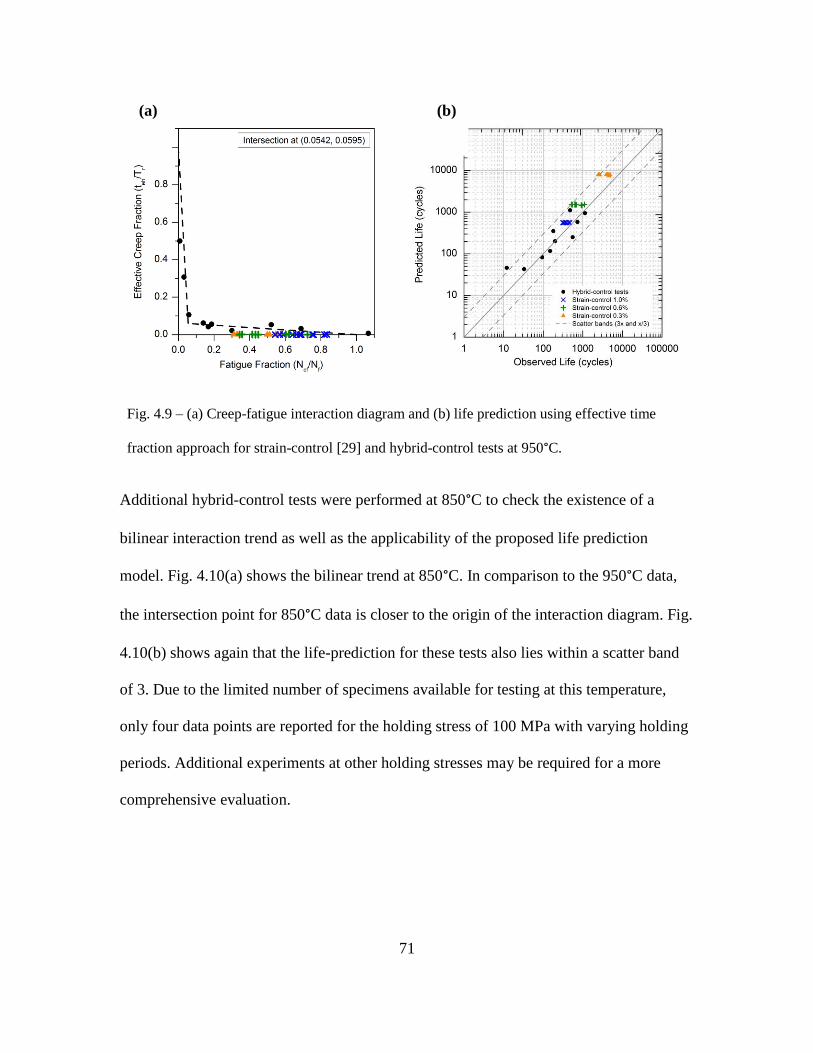
71
Fig. 4.9 – (a) Creep-fatigue interaction diagram and (b) life prediction using effective time
fraction approach for strain-control [29] and hybrid-control tests at 950°C.
Additional hybrid-control tests were performed at 850°C to check the existence of a
bilinear interaction trend as well as the applicability of the proposed life prediction
model. Fig. 4.10(a) shows the bilinear trend at 850°C. In comparison to the 950°C data,
the intersection point for 850°C data is closer to the origin of the interaction diagram. Fig.
4.10(b) shows again that the life-prediction for these tests also lies within a scatter band
of 3. Due to the limited number of specimens available for testing at this temperature,
only four data points are reported for the holding stress of 100 MPa with varying holding
periods. Additional experiments at other holding stresses may be required for a more
comprehensive evaluation.
(a) (b)
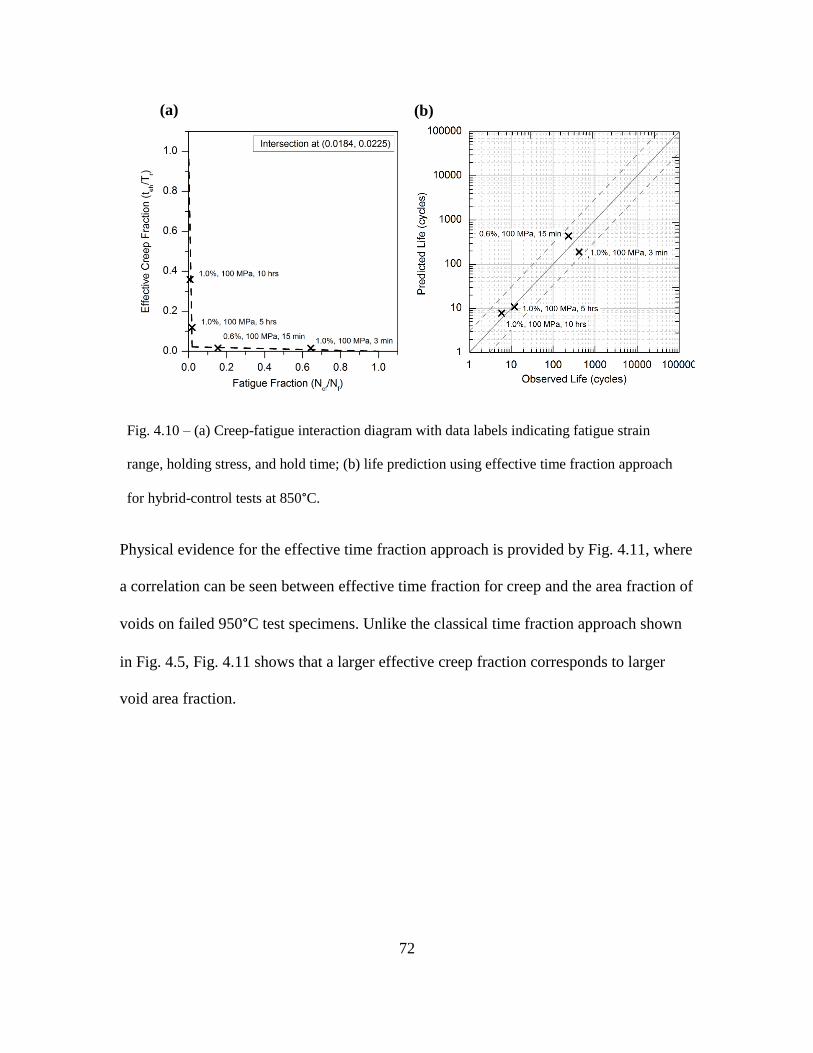
72
Fig. 4.10 – (a) Creep-fatigue interaction diagram with data labels indicating fatigue strain
range, holding stress, and hold time; (b) life prediction using effective time fraction approach
for hybrid-control tests at 850°C.
Physical evidence for the effective time fraction approach is provided by Fig. 4.11, where
a correlation can be seen between effective time fraction for creep and the area fraction of
voids on failed 950°C test specimens. Unlike the classical time fraction approach shown
in Fig. 4.5, Fig. 4.11 shows that a larger effective creep fraction corresponds to larger
void area fraction.
(a) (b)

73
Fig. 4.11 – Correlation between effective time fraction for
creep and area fraction of voids on the failed specimen;
4.5 CONCLUSION
An effective time fraction approach, that considers the increase in creep strain with
cycles, is introduced within the framework of the widely-used time fraction and damage
summation rule. Several major conclusions can be drawn based on this study.
Classical time fraction rule fails to correlate with the hybrid-controlled creep-
fatigue test data and the creep fraction is usually larger than unity, which is not
physically sound;
74
The effective time fraction approach correlates well with experimental data with
smaller scatter bands in life prediction;
The damage diagram using the effective time fraction concept has a clear bilinear
trend for the experimental data;
A lower temperature will move the intersection point of the bilinear curve (in the
effective time fraction approach) towards the origin of the damage interaction
diagram.
The proposed model shows a systematic error for strain-controlled testing
although the scatter band is less than 3.
The proposed model relies on the hypothesis that only the time during the net creep strain
increment is responsible for the creep damage. This is only tested for Alloy 617 at
temperatures of 850°C and 950°C. Extension of this concept to other materials at high
temperatures needs significant future research. Care must be taken when using the
conclusions of this study to lower temperatures as the deformation mechanisms are
different and stress relaxation behavior may not be as significant as Alloy 617 at high
temperatures. Additional study is required to investigate the proposed model to strain-
controlled experiments as the results suggest additional failure mechanisms may exist.
The proposed model is a phenomenological model that is supported by observations of
physical damage. Approaches based on damage mechanics and fracture mechanics may
provide more physical insights into life prediction of hybrid-controlled and strain-
controlled test data.
75
UNIFIED VISCOPLASTICITY MODELING FOR CREEP-FATIGUE LIFE
PREDICTION
5.1 INTRODUCTION
Design codes for nuclear components typically adopt simple empirical models such as
time fraction rule [32,41], ductility exhaustion [33], and strain range partitioning [36] to
evaluate creep-fatigue life. The life assessment rules are calibrated by fitting
experimental data from many creep-fatigue tests. Running elevated temperature tests is
time consuming and resource intensive. Moreover, the loading waveforms for such tests
are not fully representative of the actual operating conditions of the components. Reliable
life prediction for components under complex loading waveforms can be achieved by
modeling the constitutive behavior of the material as well as the effects of microstructural
damage. The stresses and strain rates during service conditions of the components are
lower than what can be realistically achieved in creep-fatigue tests. Constitutive modeling
of cyclic deformation provides a means for extrapolating the results of short-term tests to
long-term operating conditions of the components.
Viscoplastic models are rate-dependent and therefore suitable for modeling the cyclic
deformation of metals and alloys at elevated temperatures. The Chaboche unified
viscoplastic model is used in literature to model a wide variety of materials [42–44],
including Ni-base superalloys at elevated temperatures [45–50]. Carroll et al. [51]
demonstrated the capability of the Chaboche model to simulate the creep-fatigue
response of Alloy 617 at 850 and 950°C. Sham et al. [52] used the Chaboche model to
simulate low-stress long-term creep behavior of Alloy 617. This model employs

76
mechanism-based internal state variables to capture various features of the stress-strain
response including monotonic hardening, cyclic hardening and softening, Bauschinger
effect and partially ratchetting [53]. The unified viscoplastic model makes use of internal
state variables, e.g. back stress and drag stress [54], that are analogous to physical
deformation mechanisms[55]. The back stress variable represents the interaction of
moving dislocations with grain boundaries, whereas the drag stress variable represents
the interaction of moving dislocations with precipitates or solute atoms. Since, plasticity
and creep are governed by the same deformation mechanism i.e. movement of
dislocations, the unified viscoplastic model represents the plastic and creep strains by a
single variable known as inelastic strain.
In Alloy 617, creep damage is produced by nucleation and linkage of intergranular voids,
whereas fatigue damage is caused by initiation and growth of oxidation-induced surface
cracks [25,26,40,56–58]. The interaction between creep and fatigue damage mechanisms
accelerates failure under creep-fatigue conditions. The effects of microscopic damage are
incorporated into the macroscopic unified viscoplastic model with the introduction of
internal damage variables [44,59–61]. Typically, the creep damage variable is a function
of time and fatigue damage variable is a function of cycles. The simultaneous effect of
creep and fatigue is modeled by linear or non-linear accumulation of creep and fatigue
damage variables [44].
This study combines the unified viscoplastic model with a damage variable based on a
model parameter to predict creep-fatigue life of Alloy 617 at 950°C for a non-standard
loading waveform with strain-controlled ramps and force-controlled tensile hold periods.
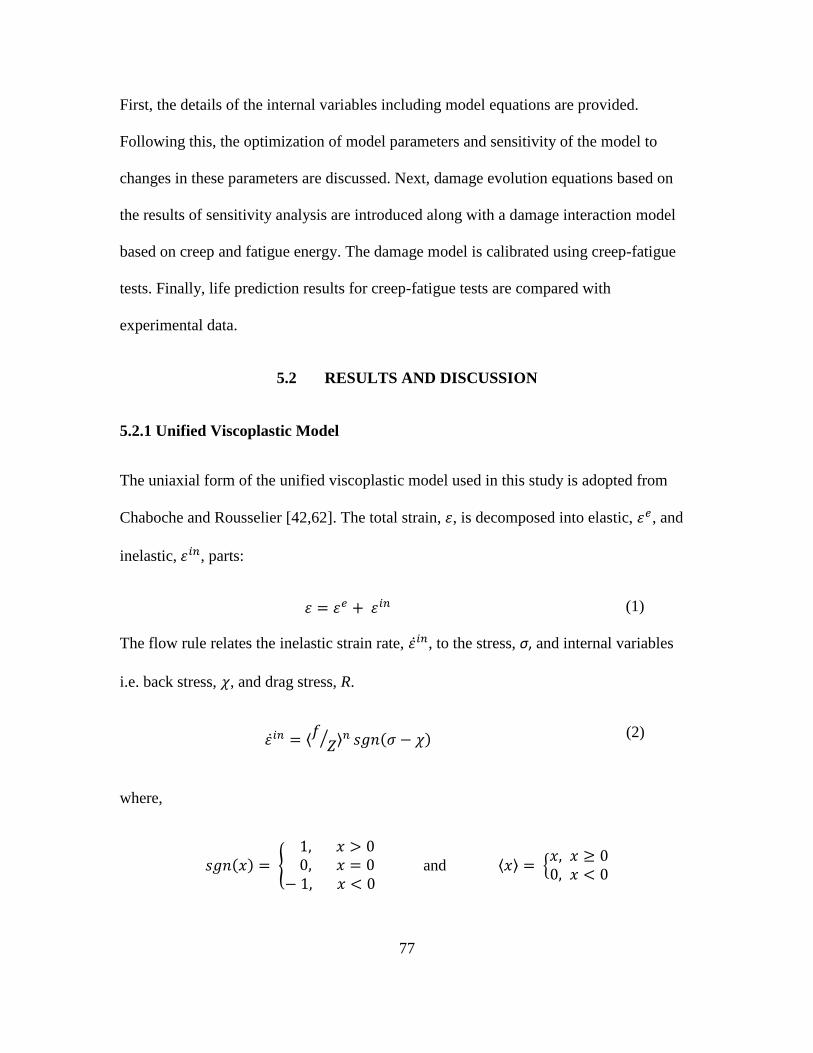
77
First, the details of the internal variables including model equations are provided.
Following this, the optimization of model parameters and sensitivity of the model to
changes in these parameters are discussed. Next, damage evolution equations based on
the results of sensitivity analysis are introduced along with a damage interaction model
based on creep and fatigue energy. The damage model is calibrated using creep-fatigue
tests. Finally, life prediction results for creep-fatigue tests are compared with
experimental data.
5.2 RESULTS AND DISCUSSION
5.2.1 Unified Viscoplastic Model
The uniaxial form of the unified viscoplastic model used in this study is adopted from
Chaboche and Rousselier [42,62]. The total strain, 𝜀, is decomposed into elastic, 𝜀𝑒, and
inelastic, 𝜀𝑖𝑛, parts:
𝜀 = 𝜀𝑒 + 𝜀𝑖𝑛 (1)
The flow rule relates the inelastic strain rate, 𝜀̇𝑖𝑛, to the stress, σ, and internal variables
i.e. back stress, 𝜒, and drag stress, R.
𝜀̇𝑖𝑛 = ⟨𝑓𝑍⁄ ⟩𝑛 𝑠𝑔𝑛(𝜎 − 𝜒)
(2)
where,
𝑠𝑔𝑛(𝑥) = { 1, 𝑥 > 0 0, 𝑥 = 0− 1, 𝑥 < 0
and ⟨𝑥⟩ = {𝑥, 𝑥 ≥ 00, 𝑥 < 0
78
Consequently, the viscoplastic multiplier, �̇�, is defined as
�̇� = ⟨𝑓
𝑍⟩𝑛
(3)
where, Z and n are viscous parameters responsible for rate dependence of the stress. The
function, f, defines the elastic domain as
𝑓(𝜎, 𝜒, 𝑅) = |𝜎 − 𝜒| − 𝑅 − 𝜎𝑌0 ≤ 0
(4)
where, 𝜎𝑌0 is the initial yield stress.
The back stress, 𝜒𝑖 , controls the direction-dependent Bauschinger effect. The evolution
of the back stress follows the non-linear kinematic hardening rule of Armstrong and
Frederick [63].
�̇�𝑖 = 𝐶𝑖(𝑎𝑖𝜀̇𝑖𝑛 − 𝜒𝑖�̇�) (5)
where, 𝐶𝑖 and 𝑎𝑖 are constants, and i = 1, 2
The drag stress, 𝑅, controls the direction-independent cyclic hardening or softening, also
known as isotropic hardening. The drag stress evolves as
�̇� = 𝑏(𝑄 − 𝑅)�̇� (6)
where, 𝑏 and 𝑄 are constants.
The viscous overstress, �̇�𝑣 , is given by the Norton’s power law equation for steady-state
creep
79
𝜎𝑣 = 𝑍�̇�1𝑚⁄ (7)
The stress decomposition is as follows
𝜎 = 𝜒 + (𝑅 + 𝜎𝑌0 + 𝜎𝑣)𝑠𝑔𝑛(𝜎 − 𝜒)
= 𝐸(𝜀 − 𝜀𝑖𝑛)
(8)
This form of the model requires 10 material parameters, namely, the Young’s modulus, E;
kinematic hardening parameters, a1, a2, C1, C2; isotropic hardening parameters, b and Q;
viscous parameters, Z and m; and the initial yield stress, 𝜎𝑌0.
5.2.2 Calibration of Model Parameters
The system of ordinary differential equations from the unified viscoplastic model was
solved in Matlab using the ‘ODE45’ solver which uses an explicit Runge-Kutta method.
The parameters were then optimized relative to an experimental stress-strain curve, using
the ‘fminsearch’ function in Matlab. The strain-controlled loading and unloading parts
were optimized first by comparing the stresses. Subsequently, the stress-controlled tensile
hold period was optimized by comparing the strains. Initial estimates for the material
parameters were taken from [64]. Table 5.1. shows the initial and optimized model
parameters.
E
(GPa)
σy0
(MPa)
b
Q
(MPa)
a1
(MPa)
C1
a2
(MPa)
C2
Z
(MPa s1/m)
m
Initial
parameters
139 30 28.6 27.4 80 7112 116 929 170 10
Optimized
parameters
124 19.4 43.7 -43.9 -394 1650 700 1583 706 3.69
Table 5.1. Initial and optimized model parameters for Alloy 617 at 950°C
80
5.2.3 Damage Model
The hybrid-control creep-fatigue loading waveform is particularly suitable of generating
varying proportions of creep and fatigue damage. Unlike the traditional strain-controlled
creep-fatigue loading, where strain hold periods cause stress relaxation, the hybrid-
control loading profile employs stress-controlled hold periods to generate creep
deformation. Under such loading conditions, the two main indicators of damage are: (i)
the decrease in peak stress with cycles; and (ii) the increase in creep strain with cycles.
Therefore, the sensitivity of these indicators to changes in model parameters were
analyzed. Since, the strain range for the fatigue cycle is fixed, the changes in creep strain
can be represented by peak strain. Fig. 5.1(a) and (b) show a sensitivity analyses for peak
stress and peak strain respectively, for a single cycle by changing one model parameter at
time.
The sensitivity analysis shows that both peak stress and peak strain are most sensitive to
the viscous parameter, ‘m’. Additionally, reducing ‘m’ can simultaneously cause a drop
in peak stress and a rise in creep strain. Although the model is also sensitive to
parameters Z, a1, and a2; the parameter ‘m’ is selected to represent the damage due to its
physical importance as the power in the Norton law equation, which relates applied stress
to the secondary creep strain rate.

81
Fig. 5.1 – Sensitivity of (a) peak stress and (b) peak strain to changes in model parameters.
(a)
(b)
82
Next, the experimental hysteresis data from a hybrid-control creep-fatigue test was
combined with the sensitivity analysis results to obtain the degradation of Young’s
modulus, E, and viscous parameter, m, as decreasing functions of cycles, n. The model
equations were then solved in Matlab to find the accumulated fatigue energy, ΣEf, and
cyclic creep energy, Ec. The model was then fitted with creep-fatigue data from multiple
tests to find a creep-fatigue interaction relation (Eq. 9) when equivalent damage, Deq,
equals unity. Fig. 5.2 shows the result of this fitting.
𝐷𝑒𝑞 = (∑𝐸𝑓∑𝐸𝑓
∗)
𝑞
+ (𝐸𝑐𝐸𝑐∗)𝑞
= 1
(9)
Following this, the degradation of parameter ‘m’ in the simulation with damage function,
Deq, was found. Fig. 5.3 show this degradation. Fig. 5.4 shows the procedure followed for
calibrating the damage model for parameter ‘m’. A similar procedure was followed for
Young’s modulus, E. ΣEf* is the accumulated fatigue energy for a pure fatigue test and
Ec* is the creep energy from a pure creep test.
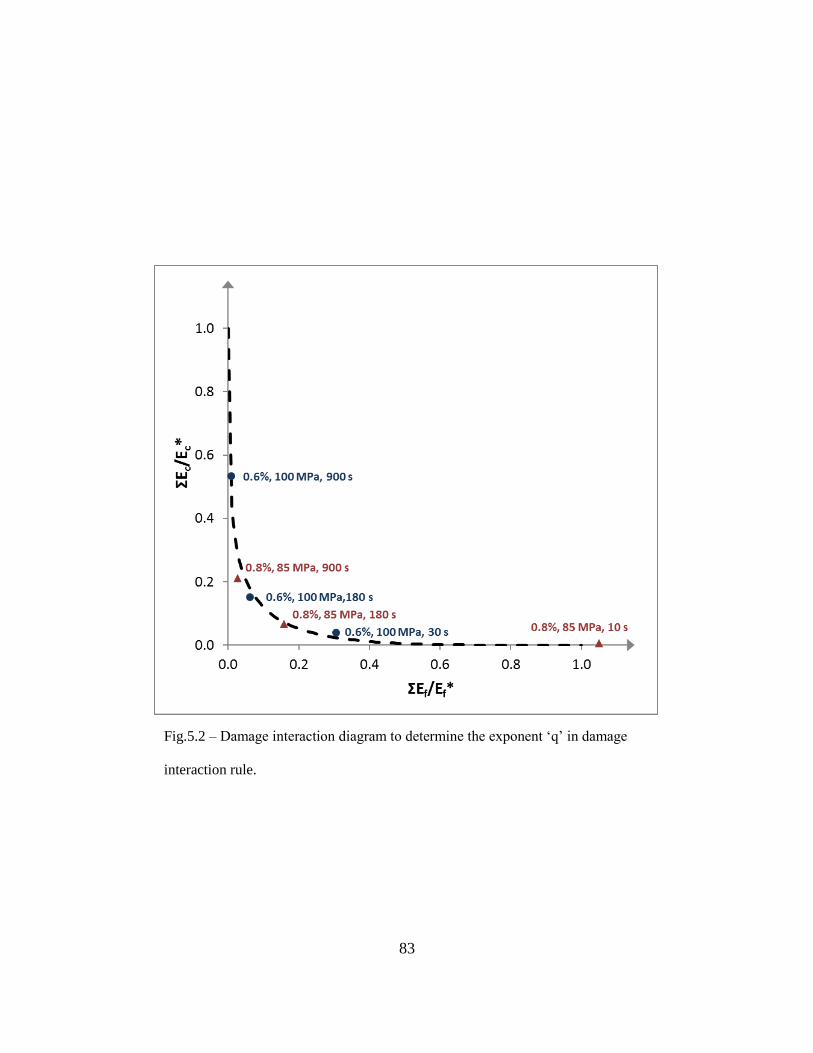
83
Fig.5.2 – Damage interaction diagram to determine the exponent ‘q’ in damage
interaction rule.
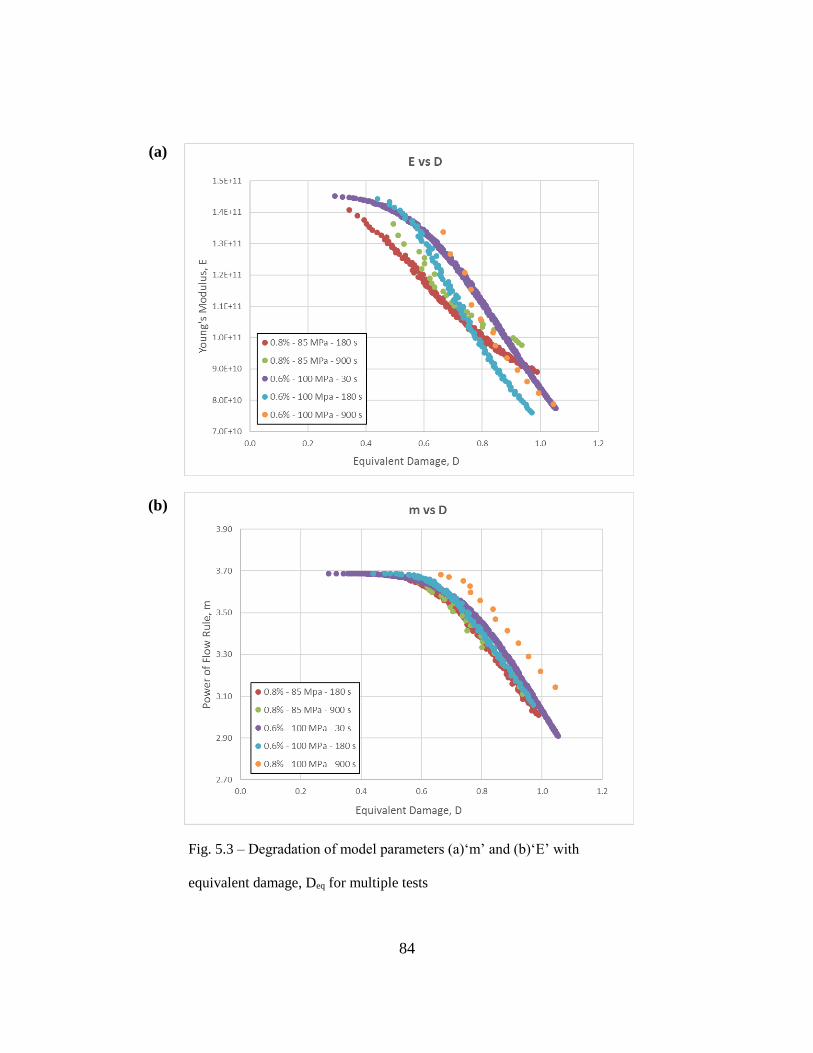
84
Fig. 5.3 – Degradation of model parameters (a)‘m’ and (b)‘E’ with
equivalent damage, Deq for multiple tests
(b)
(a)
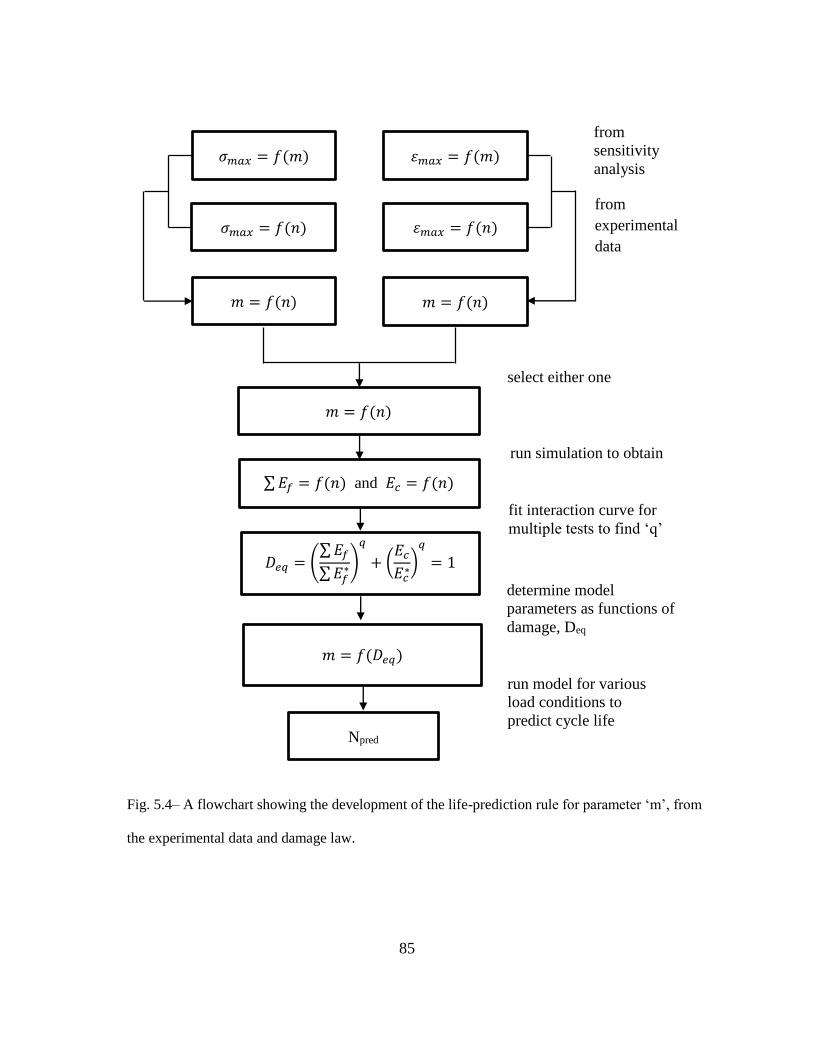
85
Fig. 5.4– A flowchart showing the development of the life-prediction rule for parameter ‘m’, from
the experimental data and damage law.
𝜎𝑚𝑎𝑥 = 𝑓(𝑚)
𝜎𝑚𝑎𝑥 = 𝑓(𝑛)
𝜀𝑚𝑎𝑥 = 𝑓(𝑚)
𝜀𝑚𝑎𝑥 = 𝑓(𝑛)
𝑚 = 𝑓(𝑛) 𝑚 = 𝑓(𝑛)
𝑚 = 𝑓(𝑛)
∑𝐸𝑓 = 𝑓(𝑛) and 𝐸𝑐 = 𝑓(𝑛)
𝐷𝑒𝑞 = (∑𝐸𝑓∑𝐸𝑓
∗)
𝑞
+ (𝐸𝑐𝐸𝑐∗)𝑞
= 1
from
sensitivity
analysis
from
experimental
data
select either one
run simulation to obtain
fit interaction curve for
multiple tests to find ‘q’
𝑚 = 𝑓(𝐷𝑒𝑞)
determine model
parameters as functions of
damage, Deq
run model for various
load conditions to
predict cycle life Npred
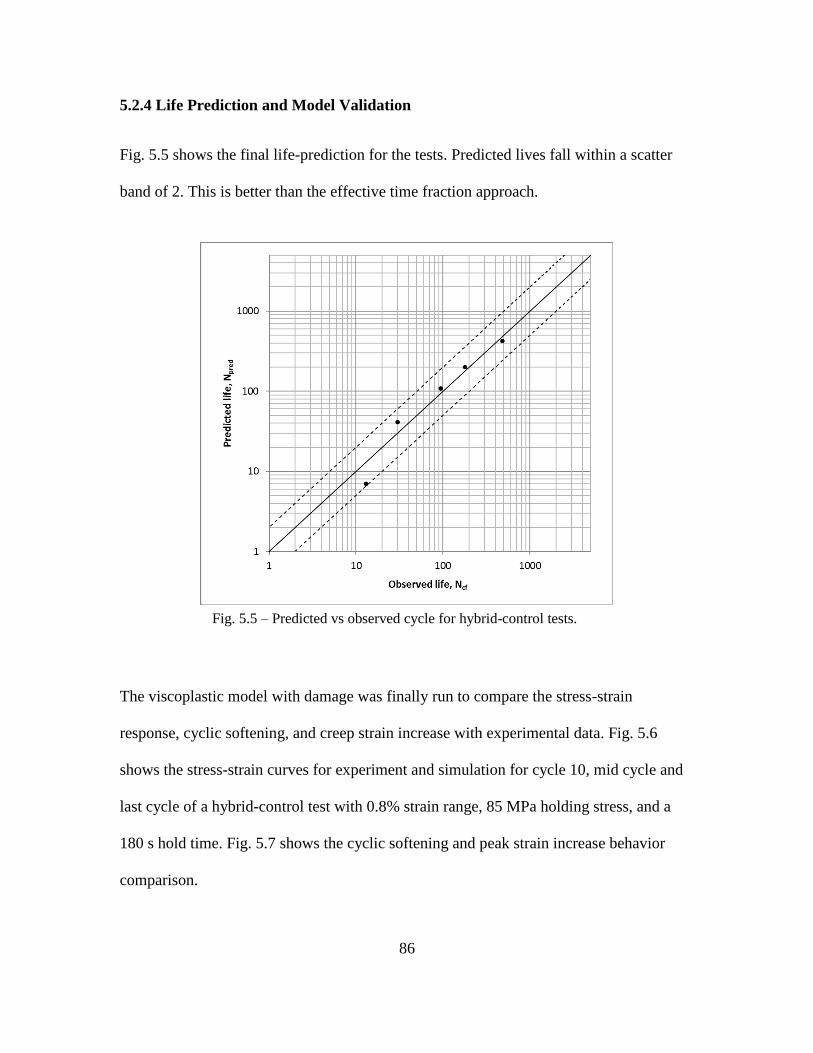
86
5.2.4 Life Prediction and Model Validation
Fig. 5.5 shows the final life-prediction for the tests. Predicted lives fall within a scatter
band of 2. This is better than the effective time fraction approach.
The viscoplastic model with damage was finally run to compare the stress-strain
response, cyclic softening, and creep strain increase with experimental data. Fig. 5.6
shows the stress-strain curves for experiment and simulation for cycle 10, mid cycle and
last cycle of a hybrid-control test with 0.8% strain range, 85 MPa holding stress, and a
180 s hold time. Fig. 5.7 shows the cyclic softening and peak strain increase behavior
comparison.
Fig. 5.5 – Predicted vs observed cycle for hybrid-control tests.

87
Fig. 5.6 – Stress-strain response for various cycles compared with experiment for a
hybrid control test with 0.8% strain range, 85 MPa holding stress, and 180 s hold

88
Fig. 5.7 – (a) Cyclic softening and (b) peak strain increase comparison
between experiment and simulation.
(b)
(a)

89
5.3 CONCLUSION
A unified viscoplastic model is coupled with a non-linear damage accumulation law to
predict creep-fatigue life for hybrid-controlled tests. The constitutive law is modified by a
damage rate model linked with the dissipation of hysteresis energy through cyclic fatigue
deformation and creep deformation. Several major conclusions are drawn: The
constitutive law coupled with damage shows the cyclic softening behavior for both peak
stress response and effective Young’s modulus; the hysteresis energy related to fatigue
deformation shows almost linear variation with respect to the number of cycles, while the
hysteresis creep energy shows a power law increase with respect to the number of cycles;
a nonlinear damage accumulation law by taking the power of the fatigue energy and
creep energy fractions shows a good correlation with the final failure life. The current
testing and simulation results suggest a power of ~1/3 as an estimate for the non-linear
damage accumulation law. In general, the proposed methodology shows good agreement
with the experimental data for hysteresis response, cyclic softening and life prediction.
90
CONCLUSION AND FUTURE WORK
The elevated temperature creep-fatigue behavior of Alloy 617 was investigated in this
study, using a combination of experimental testing, image-based damage analysis,
constitutive modeling and life-prediction. The initial problem of generating creep-
dominated creep-fatigue interaction was resolved by selecting a non-traditional loading
profile with force-controlled tensile hold periods. The failed test specimens from various
tests were analyzed using Scanning Electron Microscopy (SEM), Energy Dispersive
Spectroscopy (EDS), and Electron Backscatter Diffraction (EBSD). The area fraction of
creep-induced voids and average length of fatigue-induced surface cracks were quantified
to find correlations between creep and fatigue damage. Unlike the time fraction rule, the
image based damage analysis indicated a clear trend in creep-fatigue interaction. A new
life-prediction methodology based on an effective time fraction was proposed as an
alternative to the traditional time fraction rule. Finally, a unified viscoplastic model with
a damage variable was implemented to obtain an energy-based life prediction. The major
conclusions are:
1. Strain-controlled testing is not able to generate creep-dominant CF testing results
due to the rapid stress relaxation of Alloy 617 at high temperatures. On the
contrary, pure force-controlled testing produces cyclic ratchetting and is therefore
not ideal for the CF investigation. Hybrid controlled testing with stress hold at
peak strain tends to produce very large and non-representative CF interaction due
to the holding stress exceeding the initial yield stress. The proposed hybrid
control loading profile with a separately controlled holding stress appears to be

91
well suited for the investigated material and temperature range to generate
varying proportions of creep and fatigue damage.
2. Detailed imaging analysis showed that the microstructural damage features are
not correlated with the classical damage diagram parameters. Specifically, the
void density is not correlated with the classical time fraction. Instead, it is
correlated with the time spent for the net creep strain increment. The crack length
is well correlated with the cycle fraction in fatigue. Thus, the application of the
classical time fraction approach is questionable for the investigated load spectrum
as it is not supported by trends in physical damage.
3. An effective time fraction approach based on the image analysis shows good
agreement for the life prediction under both hybrid control and strain-controlled
testing. The scatter of life factor of three is observed for the in-house testing and
literature experimental data. The empirical damage interaction diagram using the
proposed effective time fraction approach shows a bi-linear curve for the creep
and fatigue damage.
4. A unified constitutive and damage model is developed by coupling the hysteresis
energy with the softening behavior of the material. The fatigue hysteresis energy
and creep hysteresis energy shows monotonic relationship with respect to the
Young’s modulus and creep law exponent. A nonlinear power damage summation
rule is proposed and shows that an exponent of ~1/3 for the two hysteresis
energies. The final failure prediction is in good agreement with experiments.

92
Several future studies are suggested based on the current investigation
1. In-situ testing with the real time monitoring of the microstructural damage
features is desired as it can provide more detailed insight of the damage
progression under different loading conditions;
2. Experimental testing under a variable loading spectrums of creep-fatigue may be
used to further validate the proposed methodology. It is expected that such testing
is required to investigate the nonlinear interaction of creep and fatigue
mechanism.
3. The current simulation study focuses on the macro level material behavior. A
micromechanics-based simulation revealing failure mechanisms at the grain level
is desired.
4. Uncertainties associated with the experimental testing and numerical simulation
have not been addressed in the current study. Probabilistic approach is required
for the failure probability and reliability estimation for future design and analysis.

93
REFERENCES
[1] K.B.S. Rodriguez, P., Rao, Nucleation and Growth of Cracks and Cavities under
Creep-Fatigue Interaction, Prog. Mater. Sci. 37 (1993) 403–480.
[2] A. Dasgupta, Solder Creep-Fatigue Analysis by an Energy-Partitioning Approach,
J. Electron. Packag. 114 (1992) 152–160.
[3] D. Chapin, S. Kiffer, J. Nestell, The Very High Temperature Reactor : A Technical
Summary, MPR Assoc. (2004).
[4] J.M. Corum, J.J. Blass, Rules for design of Alloy 617 nuclear components to very
high temperatures, Oak Ridge Natl. Lab. (1991).
[5] X. Chen, M.A. Sokolov, S. Sham, D.L. Erdman, J.T. Busby, K. Mo, J.F. Stubbins,
Experimental and modeling results of creep-fatigue life of Inconel 617 and Haynes
230 at 850C, J. Nucl. Mater. 432 (2013) 94–101.
doi:10.1016/j.jnucmat.2012.08.040.
[6] J.A. Simpson, J.K. Wright, L.J. Carroll, Novel Experiments to Characterize Creep-
Fatigue Degradation in VHTR Alloys, Idaho Natl. Lab. (2013).
http://www.osti.gov/scitech/biblio/1097150.
[7] L. Carroll, M. Carroll, Creep-Fatigue Behavior of Alloy 617 at 850 and 950°C,
Idaho Natl. Lab. INL/EXT-13 (2015).
[8] L.J. Carroll, C. Cabet, M.C. Carroll, R.N. Wright, The development of
microstructural damage during high temperature creep–fatigue of a nickel alloy,
Int. J. Fatigue. 47 (2013) 115–125. doi:10.1016/j.ijfatigue.2012.07.016.
[9] J.K. Wright, Draft ASME Boiler and Pressure Vessel Code Section III, Division 5,
Section HB, Subsection B, Code Case for Alloy 617 and Background
Documentation, Idaho Natl. Lab. (2015).
[10] W.Z. Zhuang, N.S. Swansson, Thermo-Mechanical Fatigue Life Prediction: A
Critical Review, 0 (1998).
[11] RCC-MRx, Design and Construction Rules for Mechanical Components of
Nuclear installations, AFCEN. (2012).
[12] R.A. Ainsworth, R5 procedures for assessing structural integrity of components
under creep and creep–fatigue conditions, Int. Mater. Rev. 51 (2006) 107–126.
doi:10.1179/174328006X79463.
[13] Y. Takahashi, Study on creep-fatigue evaluation procedures for high-chromium
steels-Part I: Test results and life prediction based on measured stress relaxation,
Int. J. Press. Vessel. Pip. 85 (2008) 406–422. doi:10.1016/j.ijpvp.2007.11.008.

94
[14] M.W. Spindler, An improved method for calculation of creep damage during
creep–fatigue cycling, Mater. Sci. Technol. 23 (2007) 1461–1470.
doi:10.1179/174328407X243924.
[15] W. Hoffelner, Creep-Fatigue Life Determination of Grade 91 Steel Using a Strain-
Range Separation Method, in: ASME 2009 Press. Vessel. Pip. Div. Conf., 2009:
pp. 1–5. doi:10.1115/PVP2009-77705.
[16] H. Rao, K Bhanu Sankara, Meurer, H. -P, Schuster, Creep-Fatigue Interaction of
lnconel 617 at 950 ° C in Simulated Nuclear Reactor Helium, Mater. Sci. Eng. A.
104 (1988) 37–51.
[17] C. Cabet, L. Carroll, R. Wright, Low Cycle Fatigue and Creep-Fatigue Behavior of
Alloy 617 at High Temperature, J. Press. Vessel Technol. 135 (2013) 61401.
doi:10.1115/1.4025080.
[18] H. Nickel, F. Schubert, H. Breitling, E. Bodmann, Development and qualification
of materials for components for high-temperature gas-cooled reactor, Nucl. Eng.
Des. (1990) 183–192. doi:10.1017/CBO9781107415324.004.
[19] B. Fournier, M. Sauzay, C. Caës, M. Noblecourt, M. Mottot, a. Bougault, V.
Rabeau, a. Pineau, Creep-fatigue-oxidation interactions in a 9Cr-1Mo martensitic
steel. Part I: Effect of tensile holding period on fatigue lifetime, Int. J. Fatigue. 30
(2008) 649–662. doi:10.1016/j.ijfatigue.2007.05.007.
[20] M.E. Kassner, γ/γ’ Nickel-Based Superalloys, 2015. doi:10.1016/B978-0-08-
099427-7.00011-6.
[21] E.P. Esztergar, Creep-fatigue Interaction and Cumulative Damage Evaluations for
Type 304 Stainless Steel, Oak Ridge Natl. Lab. Rep. (1972).
http://www.iaea.org/inis/collection/NCLCollectionStore/_Public/04/038/4038440.
pdf.
[22] G.J. Lloyd, J. Wareing, Life prediction methods for combined creep-fatigue
endurance, Met. Technol. 8 (1981) 297–305.
[23] ASME, Boiler and Pressure Vessel Code, Section III, Sub-Section NH, New York,
USA, 2001.
[24] S.F. Di Martino, R.G. Faulkner, S.C. Hogg, S. Vujic, O. Tassa, Characterisation of
microstructure and creep properties of alloy 617 for high-temperature applications,
Mater. Sci. Eng. A. 619 (2014) 77–86. doi:10.1016/j.msea.2014.09.046.
[25] S.K. Sharma, G.D. Ko, F.X. Li, K.J. Kang, Oxidation and creep failure of alloy
617 foils at high temperature, J. Nucl. Mater. 378 (2008) 144–152.
doi:10.1016/j.jnucmat.2008.04.021.
[26] T.C. Totemeier, H. Tian, Creep-fatigue–environment interactions in INCONEL
617, Mater. Sci. Eng. A. 468–470 (2007) 81–87. doi:10.1016/j.msea.2006.10.170.
95
[27] S. Schlegel, S. Hopkins, E. Young, J. Cole, T. Lillo, M. Frary, Precipitate
Redistribution during Creep of Alloy 617, Metall. Mater. Trans. A. 40 (2009)
2812–2823. doi:10.1007/s11661-009-0027-7.
[28] F. Tahir, Y. Liu, Development of Creep-Dominant Creep-Fatigue Testing for
Alloy 617, in: 57th AIAA/ASCE/AHS/ASC Struct. Struct. Dyn. Mater. Conf. San
Diego, California, USA., AIAA SciTech, San Diego, 2016.
doi:http://dx.doi.org/10.2514/6.2016-0668.
[29] R.N. Wright, High Temperature Materials Characterization Database, Idaho Natl.
Lab. (n.d.).
[30] R. Campbell, Creep/fatigue interaction correlation for 304 stainless steel subjected
to strain-controlled cycling with hold times at peak strain, J. Eng. Ind. (1971).
http://manufacturingscience.asmedigitalcollection.asme.org/article.aspx?articleid=
1442060.
[31] X.-L. Yan, X.-C. Zhang, S.-T. Tu, S.-L. Mannan, F.-Z. Xuan, Y.-C. Lin, Review
of creep–fatigue endurance and life prediction of 316 stainless steels, Int. J. Press.
Vessel. Pip. 126–127 (2015) 17–28. doi:10.1016/j.ijpvp.2014.12.002.
[32] E.L. Robinson, Effect of Temperature Variation on the Creep Strength of Steel,
Trans. ASME. 60 (1938) 253–259.
[33] R.H. Priest, E.G. Ellison, A combined deformation map-ductility exhaustion
approach to creep-fatigue analysis, Mater. Sci. Eng. 49 (1981) 7–17.
doi:10.1016/0025-5416(81)90128-2.
[34] R. Hales, a Method of Creep Damage Summation Based on Accumulated Strain
for the Assessment of Creep???Fatigue Endurance, Fatigue Fract. Eng. Mater.
Struct. 6 (1983) 121–135. doi:10.1111/j.1460-2695.1983.tb00329.x.
[35] Y. Takahashi, D.G. Bilal Dogan, Systematic Evaluation of Creep-Fatigue Life
Prediction Methods for Various Alloys, J. Press. Vessel Technol. 135 (2013)
61204. doi:10.1115/1.4024436.
[36] S.S. Manson, G.R. Halford, Creep-fatigue analysis by strain-range partitioning,
1971.
[37] E.H. Wong, W.D. van Driel, A. Dasgupta, M. Pecht, Creep fatigue models of
solder joints: A critical review, Microelectron. Reliab. (2015).
doi:10.1016/j.microrel.2016.01.013.
[38] T. Asayama, Update and Improve Subsection NH - Alternative Simplified Creep-
Fatigue Design Methods, 2011.
[39] L.J. Carroll, R.N. Wright, T.-L. Sham, N.J. Lybeck, R.N. Wright, Determination of
the creep-fatigue interaction diagram for Alloy 617, Proc. ASME 2016 Press.
Vessel. Pip. Conf. (2016) 1–10.

96
[40] F. Tahir, S. Dahire, Y. Liu, Image-based Creep-Fatigue Damage Mechanism
Investigation of Alloy 617 at 950°C, Mater. Sci. Eng. A. 679 (2017) 391–400.
doi:10.1016/j.msea.2016.10.050.
[41] S. Taira, Lifetime of Structures Subjected to Varying Load and Temperature, in:
N.J. Hoff (Ed.), Creep Struct. Colloq. Held Stanford Univ. Calif. July 11--15,
1960, Springer Berlin Heidelberg, Berlin, Heidelberg, 1962: pp. 96–124.
doi:10.1007/978-3-642-86014-0_6.
[42] J.L. Chaboche, G. Rousselier, On the Plastic and Viscoplastic Constitutive
Equations, Part I: Rules Developed With Internal Variable Concept, ASME J.
Press. Vessel Technol. 105 (1983) 153–164.
[43] C.J. Hyde, W. Sun, T.H. Hyde, J.P. Rouse, T. Farragher, N.P. O’Dowd, S.B. Leen,
Cyclic Viscoplasticity Testing and Modeling of a Service-Aged P91 Steel, J. Press.
Vessel Technol. 136 (2014) 44501. doi:10.1115/1.4026865.
[44] J. Lemaitre, J.-L. Chaboche, Mechanics of Solid Materials, 1990. doi:10.1139/l92-
025.
[45] J. Tong, B. Vermeulen, The description of cyclic plasticity and viscoplasticity of
waspaloy using unified constitutive equations, Int. J. Fatigue. 25 (2003) 413–420.
doi:10.1016/S0142-1123(02)00162-7.
[46] J. Tong, Z.L. Zhan, B. Vermeulen, Modelling of cyclic plasticity and
viscoplasticity of a nickel-based alloy using Chaboche constitutive equations, Int.
J. Fatigue. 26 (2004) 829–837. doi:10.1016/j.ijfatigue.2004.01.002.
[47] Z. Zhan, U.S. Fernando, J. Tong, Constitutive modelling of viscoplasticity in a
nickel-based superalloy at high temperature, Int. J. Fatigue. 30 (2008) 1314–1323.
doi:10.1016/j.ijfatigue.2007.06.010.
[48] J.-T. Yeom, S.J. Williams, I.-S. Kim, N.-K. Park, Unified viscoplastic models for
low cycle fatique behavior of Waspaloy, Met. Mater. Int. 7 (2001) 233–240.
doi:10.1007/BF03026981.
[49] M. Yaguchi, M. Yamamoto, T. Ogata, A viscoplastic constitutive model for
nickel-base superalloy, part 1: Kinematic hardening rule of anisotropic dynamic
recovery, Int. J. Plast. 18 (2002) 1083–1109. doi:10.1016/S0749-6419(01)00029-8.
[50] R. Ahmed, P.R. Barrett, T. Hassan, Unified viscoplasticity modeling for
isothermal low-cycle fatigue and fatigue-creep stress-strain responses of Haynes
230, Int. J. Solids Struct. 89 (2015) 131–145. doi:10.1016/j.ijsolstr.2016.03.012.
[51] L. Carroll, T. Hassan, Constitutive Modeling of High Temperature Uniaxial Creep-
Fatigue and Creep-Ratcheting Responses of Alloy 617, in: Proc. ASME 2013
Press. Vessel. Pip. Conf., 2013. doi:10.1115/PVP2013-97251.

97
[52] T.-L. Sham, K.P. Walker, Preliminary Development of a Unified Viscoplastic
Constitutive Model for Alloy 617 With Special Reference to Long Term Creep
Behavior, Fourth Int. Top. Meet. High Temp. React. Technol. Vol. 2. (2008) 81–
89. doi:10.1115/HTR2008-58215.
[53] R. Hales, S.R. Holdsworth, M.P. O’Donnell, I.J. Perrin, R.P. Skelton, A code of
practice for the determination of cyclic stress-strain data, Mater. High Temp. 19
(2002) 165–185. doi:10.3184/096034002783640332.
[54] V.G. Ramaswamy, D.C. Stouffer, J.H. Laflen, A Unified Constitutive Model for
the Inelastic Uniaxial Response of Rene’ 80 at Temperatures Between 538C and
982C, J. Eng. Mater. Technol. 112 (1990) 280. doi:10.1115/1.2903324.
[55] J.L. Chaboche, A review of some plasticity and viscoplasticity constitutive
theories, Int. J. Plast. 24 (2008) 1642–1693. doi:10.1016/j.ijplas.2008.03.009.
[56] R. Krishna, H. V. Atkinson, S. V. Hainsworth, S.P. Gill, Gamma Prime
Precipitation, Dislocation Densities, and TiN in Creep-Exposed Inconel 617 Alloy,
Metall. Mater. Trans. A Phys. Metall. Mater. Sci. 47 (2015) 178–193.
doi:10.1007/s11661-015-3193-9.
[57] D. Tytko, P.P. Choi, J. Kl??wer, A. Kostka, G. Inden, D. Raabe, Microstructural
evolution of a Ni-based superalloy (617B) at 700°C studied by electron
microscopy and atom probe tomography, Acta Mater. 60 (2012) 1731–1740.
doi:10.1016/j.actamat.2011.11.020.
[58] X. Chen, Z. Yang, M. a. Sokolov, D.L. Erdman, K. Mo, J.F. Stubbins, Effect of
creep and oxidation on reduced fatigue life of Ni-based alloy 617 at 850°C, J.
Nucl. Mater. 444 (2014) 393–403. doi:10.1016/j.jnucmat.2013.09.030.
[59] F.P.E. Dunne, D.R. Hayhurst, Continuum damage based constitutive equations for
copper under high temperature creep and cyclic plasticity, Proc. R. Soc. A. 437
(1992) 545–566. doi:10.1098/rspa.1983.0054.
[60] W. Wang, P. Buhl, A. Klenk, Y. Liu, A Continuum Damage Mechanics-Based
Viscoplastic Model of Adapted Complexity for High-Temperature Creep–Fatigue
Loading, J. Eng. Gas Turbines Power. 138 (2016) 92501. doi:10.1115/1.4032679.
[61] T.W. Kim, D.H. Kang, J.T. Yeom, N.K. Park, Continuum damage mechanics-
based creep-fatigue-interacted life prediction of nickel-based superalloy at high
temperature, Scr. Mater. 57 (2007) 1149–1152.
doi:10.1016/j.scriptamat.2007.08.014.
[62] J.L. Chaboche, G. Rousselier, On the Plastic and Viscoplastic Constitutive
Equations - Part II: Applications of Internal Variable Concepts to the 316 Stainless
Steel, J. Press. Vessel Technol. 105 (1983) 159–164.
[63] C.O. Frederick, P.J. Armstrong, A mathematical representation of the multiaxial
98
Bauschinger effect, Mater. High Temp. 24 (2007) 1–26.
doi:10.1179/096034007X207589.
[64] Y.P. Gong, C.J. Hyde, W. Sun, T.H. Hyde, Determination of material properties in
the Chaboche unified viscoplasticity model, Proc. Inst. Mech. Eng. Part L J. Mater.
Des. Appl. 224 (2009) 19–29. doi:10.1243/14644207JMDA273.