Embed Size (px)
Citation preview
CREEP BEHAVIOR OF SELF-CONSOLIDATING CONCRETE
Except where reference is made to the work of others, the work described in this thesis is my own or was done in collaboration with my advisory committee. This thesis does not
include proprietary or classified information. Certificate of Approval:
Bryan Palmer Kavanaugh
Anton K. Schindler, Chair Gottlieb Associate Professor Civil Engineering
Robert W. Barnes James J. Mallett Associate Professor Civil Engineering
Mary L. Hughes Assistant Professor Civil Engineering
George T. Flowers Interim Dean Graduate School

ii
CREEP BEHAVIOR OF SELF-CONSOLIDATING CONCRETE
Bryan Palmer Kavanaugh
A Thesis
Submitted to
the Graduate Faculty of
Auburn University
in Partial Fulfillment of the
Requirements for the
Degree of
Master of Science
Auburn, Alabama August 9, 2008

iii
CREEP BEHAVIOR OF SELF-CONSOLIDATING CONCRETE
Bryan Palmer Kavanaugh
Permission is granted to Auburn University to make copies of this thesis at its discretion, upon requests of individuals or institutions and at their expense. The author reserves all
publication rights.
Signature of Author
Date of Graduation

iv
VITA
Bryan Palmer Kavanaugh, son of Mark Edward and Carole Nichols Kavanaugh, was
born May 7, 1980, in Atlanta, Georgia. He is a 1998 graduate of Fayette County High
School, located in Fayetteville, Georgia. After graduating from high school, he attended
Auburn University, where he earned a Bachelor of Civil Engineering degree in May,
2006. Upon completion of his undergraduate course work, he entered graduate school at
Auburn University with the intent of earning the degree of Master of Science in Civil
Engineering (Structures). After completing this degree in August, 2008, he was employed
as a structural designer with The Preston Partnership, LLC in Atlanta, Georgia.

v
THESIS ABSTRACT
CREEP BEHAVIOR OF SELF-CONSOLIDATING CONCRETE
Bryan Palmer Kavanaugh
Master of Science, August 9, 2008 (B.C.E., Auburn University 2006)
233 Typed Pages
Directed by Anton K. Schindler
Self-consolidating concrete (SCC) is a highly flowable material that has the ability to
improve the quality and durability of structures; however, much is still unknown about
the hardened properties of this material, including the creep behavior. This thesis presents
research aimed at improving knowledge in this area by investigating the creep
performance of four SCC mixtures and one conventional-slump mixture. The four SCC
mixtures have varying water-to-cementitious materials ratios of 0.28 and 0.32, and use
differing powder combinations that include Type III portland cement, Class C fly ash,
and Ground Granulated Blast-Furnace (GGBF) slag. All four SCC mixtures’ fresh
properties were evaluated using the slump flow, T-50, and VSI tests. For each mixture,
the following five loading ages were investigated: 18 hours, 2 days, 7 days, 28 days, and
90 days. The 18-hour samples, which had compressive strengths ranging
vi
from 5,800 psi to 8,860 psi, were cured at predetermined elevated temperatures that are
typical of those used in the prestressing industry in the Southeastern United States. The
samples loaded at 2, 7, 28, and 90 days were moist cured prior to loading. Upon the
completion of curing, each sample was loaded to achieve a stress level equal to 40
percent of the concrete compressive strength.
All data collected from the SCC mixtures were compared to the data from the
conventional-slump mixture. When curing was accelerated and the load was applied at 18
hours, the creep of all the SCC mixtures was less than the conventional-slump mixture.
All SCC mixtures cured under elevated or standard laboratory temperatures exhibited
creep values similar to or less that of the conventional-slump concrete mixture. When
curing was not accelerated, the creep behavior of the moderate-strength fly ash SCC and
conventional-slump mixtures were similar. The high-strength mixtures had the highest
paste content, but exhibited less creep than any of the moderate-strength mixtures. At a
fixed water-to-cementitious materials ratio, SCC mixtures made with GGBF slag
exhibited less creep than those made with fly ash, regardless of the age at loading.
The accuracy of the following five creep prediction methods was also investigated:
ACI 209, AASHTO 2007, CEB 90, GL 2000, and B3. ACI 209 provided the most
accurate creep estimations for the accelerated-cured specimens, except for the high-
strength concrete mixture. The AASHTO 2007 method underestimated the creep at early
concrete ages, but overestimated it for later ages. Overall, the CEB 90 method was the
most accurate of the five models investigated in this study. The GL 2000 and B3 methods
significantly overestimated the creep for all mixtures.

vii
ACKNOWLEDGEMENTS
I would like to thank my advisor Dr. Anton K. Schindler for all his help and direction
throughout this entire process. His advice and time were of exceptional value to me over
the past several years. Additionally, I would like to thank Dr. Robert W. Barnes for his
input and guidance throughout the course of this research project.
Furthermore, none of this project would have been possible without the tireless
efforts of the many graduate and undergraduate students working in the Structural
Research Laboratory at Auburn University. A list of these hard working research
assistants includes, but is not limited to: Kurtis Boehm, Darren Dachelet, Dustin Swart,
Jason Meadows, Seth Green, Wes Bullock, and Nick Franklin. Special thanks also go to
Mr. Billy Wilson, the structural research laboratory technician at Auburn University, for
his friendship, guidance, and help throughout the latter course of my time at Auburn
University.
The support of my family, namely my mother and father, over the past 28 years has
been incredible and is greatly appreciated. I can never repay all they have done for me or
express how much it has meant to me, but I thank them for everything and I love them
dearly.
Finally, I would like to thank God. All things are truly possible in His name. I thank
Him for staying with me throughout all of my pitfalls and for blessing me with such a
wonderful life, family, and group of friends.

viii
Style manual or journal used Chicago Manual of Style
Computer software used Microsoft® Word, and Microsoft® Excel

ix
TABLE OF CONTENTS
LIST OF TABLES......................................................................................................... xviii
LIST OF FIGURES ......................................................................................................... xxi
CHAPTER 1: INTRODUCTION....................................................................................... 1
1.1 BACKGROUND ...................................................................................................... 1
1.2 RESEARCH OBJECTIVES ..................................................................................... 3
1.3 RESEARCH SCOPE ................................................................................................ 4
1.4 ORGANIZATION OF THESIS ............................................................................... 5
CHAPTER 2: LITERATURE REVIEW............................................................................ 7
2.1 INTRODUCTION .................................................................................................... 7
2.2 COMPONENTS OF SCC......................................................................................... 8
2.2.1 SCC CONSTITUENT MATERIALS ......................................................................... 9
2.2.1.1 Type III Cement........................................................................................ 10
2.2.1.2 Air-entraining Admixtures........................................................................ 10
2.2.1.3 Supplementary Cementing Materials (SCMs) .......................................... 11
2.2.1.4 Viscosity Modifying Admixtures ............................................................. 13
2.3 VOLUMETRIC CHANGE..................................................................................... 13
2.3.1 DRYING SHRINKAGE ......................................................................................... 14
x
2.3.2 AUTOGENEOUS SHRINKAGE.............................................................................. 17
2.3.3 CREEP............................................................................................................... 18
2.3.3.1 The Creep Mechanism .............................................................................. 20
2.3.3.2 Variables Affecting Creep ........................................................................ 21
2.4 CREEP PREDICTION METHODS....................................................................... 24
2.4.1 ACI 209 CREEP PREDICTION METHOD ............................................................. 24
2.4.2 AASHTO 2007 CREEP PREDICTION METHOD.................................................. 27
2.4.3 CEB 90 CREEP PREDICTION METHOD............................................................... 28
2.4.4 GL 2000 CREEP PREDICTION METHOD............................................................. 31
2.4.5 B3 CREEP PREDICTION METHOD....................................................................... 34
2.5 PREVIOUS FINDINGS RELATED TO CREEP OF SCC.................................... 38
2.5.1 DESCRIPTION OF PREVIOUS STUDIES ................................................................ 38
2.5.1.1 Creep Evaluation by Raghavan et al. (2003) ............................................ 38
2.5.1.2 Study Conducted by Seng and Shima (2005) ........................................... 41
2.5.1.3 Creep Study by Collepardi et al. (2003) ................................................... 44
2.5.2 CONCLUSIONS FROM PREVIOUS STUDIES.......................................................... 46
CHAPTER 3: EXPERIMENTAL PLAN ......................................................................... 48
3.1 INTRODUCTION .................................................................................................. 48
3.2 EXPERIMENTAL PROGRAM ............................................................................. 48
3.2.1 REQUIREMENTS FOR SCC MIXTURES................................................................ 49
3.2.1.1 Fresh Properties ........................................................................................ 50
3.2.1.2 Hardened Properties.................................................................................. 50
3.2.2 SPECIMEN TYPES AND AGES AT LOADING ........................................................ 50
xi
3.3 MIXTURE PROPORTIONS.................................................................................. 53
3.4 TEST SPECIMEN IDENTIFICATION SYSTEM ................................................ 55
3.5 TEST METHODS................................................................................................... 57
3.5.1 BATCHING......................................................................................................... 57
3.5.1.1 Collection of Materials ............................................................................. 57
3.5.1.2 Moisture Corrections ................................................................................ 57
3.5.2 MIXING PROCEDURES....................................................................................... 58
3.5.2.1 Buttering the Mixer................................................................................... 58
3.5.2.2 Mixing Sequence ...................................................................................... 59
3.5.3 METHODS FOR TESTING FRESH CONCRETE....................................................... 61
3.5.3.1 Slump Flow............................................................................................... 61
3.5.3.2 Visual Stability Index (VSI) ..................................................................... 63
3.5.3.3 T-50........................................................................................................... 64
3.5.3.4 Air Content and Unit Weight.................................................................... 64
3.5.3.5 Fresh Concrete Temperature..................................................................... 65
3.5.4 SPECIMEN PREPARATION AND CURING ............................................................. 65
3.5.4.1 Specimen Preparation ............................................................................... 65
3.5.4.2 Curing Regimes ........................................................................................ 68
3.5.5 METHODS FOR TESTING HARDENED CONCRETE............................................... 70
3.5.5.1 Compressive Strength ............................................................................... 70
3.5.5.2 Drying Shrinkage...................................................................................... 71
3.5.6 CREEP TESTING................................................................................................. 74
3.5.6.1 Creep Frames ............................................................................................ 74
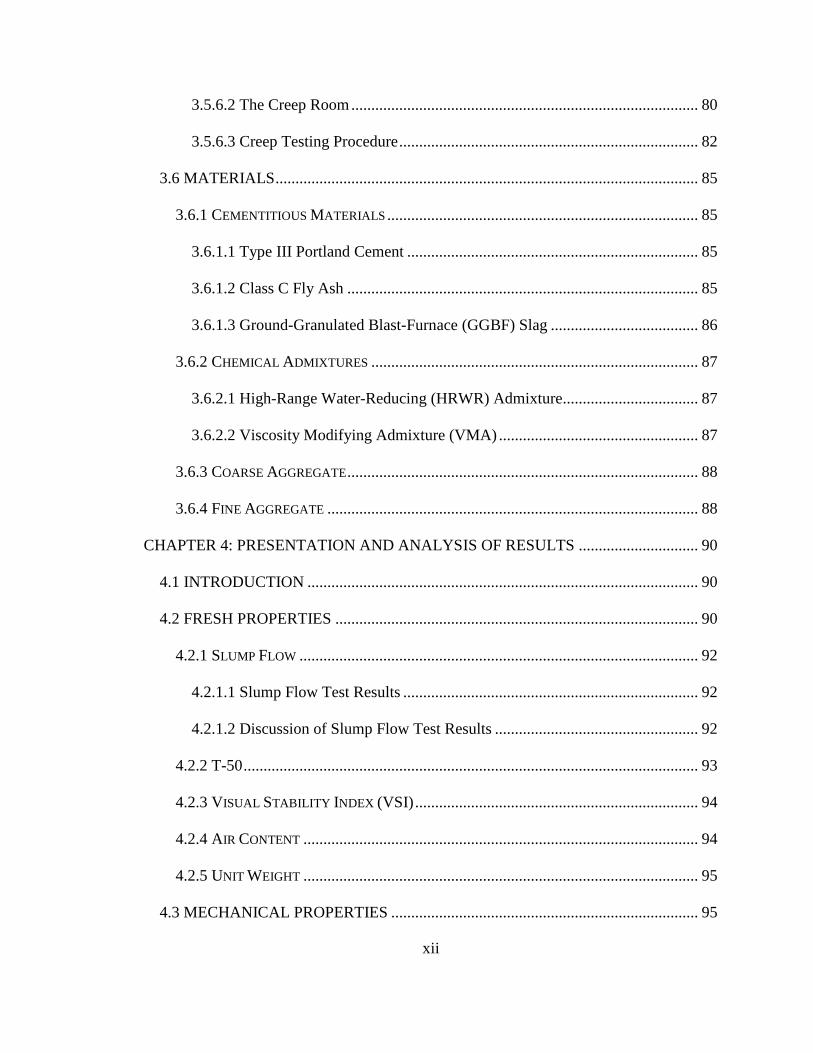
xii
3.5.6.2 The Creep Room....................................................................................... 80
3.5.6.3 Creep Testing Procedure........................................................................... 82
3.6 MATERIALS.......................................................................................................... 85
3.6.1 CEMENTITIOUS MATERIALS .............................................................................. 85
3.6.1.1 Type III Portland Cement ......................................................................... 85
3.6.1.2 Class C Fly Ash ........................................................................................ 85
3.6.1.3 Ground-Granulated Blast-Furnace (GGBF) Slag..................................... 86
3.6.2 CHEMICAL ADMIXTURES .................................................................................. 87
3.6.2.1 High-Range Water-Reducing (HRWR) Admixture.................................. 87
3.6.2.2 Viscosity Modifying Admixture (VMA) .................................................. 87
3.6.3 COARSE AGGREGATE........................................................................................ 88
3.6.4 FINE AGGREGATE............................................................................................. 88
CHAPTER 4: PRESENTATION AND ANALYSIS OF RESULTS .............................. 90
4.1 INTRODUCTION .................................................................................................. 90
4.2 FRESH PROPERTIES ........................................................................................... 90
4.2.1 SLUMP FLOW .................................................................................................... 92
4.2.1.1 Slump Flow Test Results .......................................................................... 92
4.2.1.2 Discussion of Slump Flow Test Results ................................................... 92
4.2.2 T-50.................................................................................................................. 93
4.2.3 VISUAL STABILITY INDEX (VSI)....................................................................... 94
4.2.4 AIR CONTENT ................................................................................................... 94
4.2.5 UNIT WEIGHT ................................................................................................... 95
4.3 MECHANICAL PROPERTIES .............................................................................95
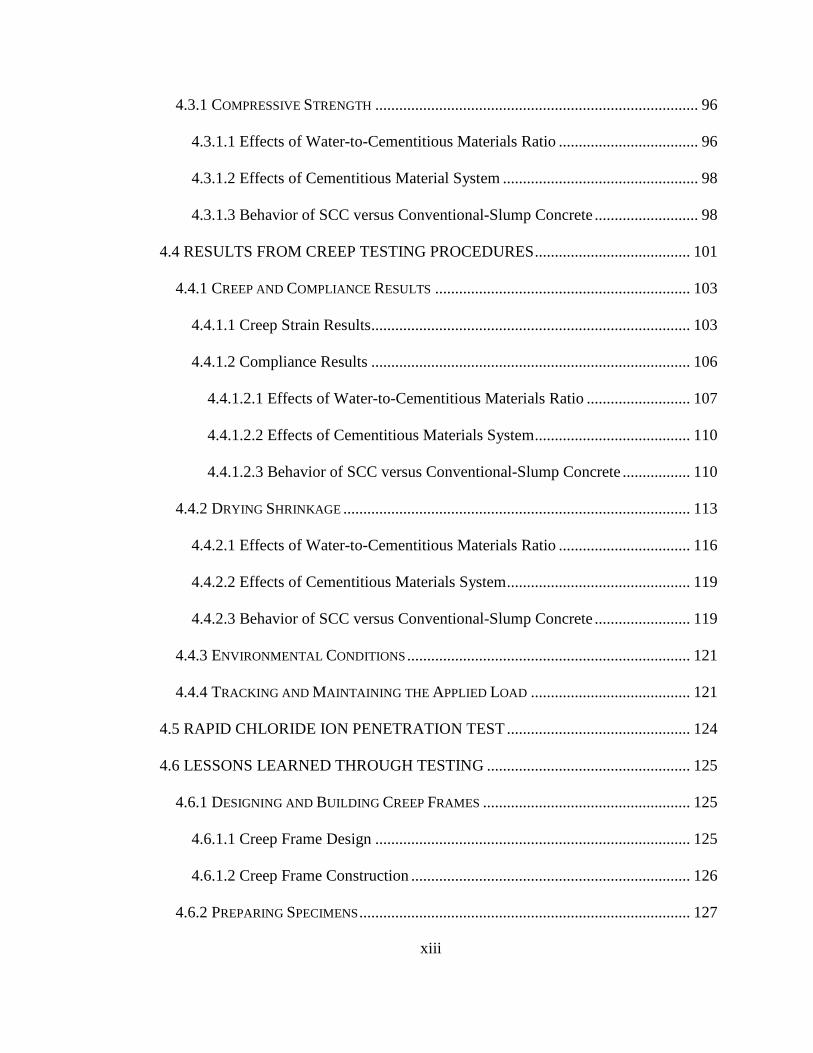
xiii
4.3.1 COMPRESSIVE STRENGTH ................................................................................. 96
4.3.1.1 Effects of Water-to-Cementitious Materials Ratio ................................... 96
4.3.1.2 Effects of Cementitious Material System ................................................. 98
4.3.1.3 Behavior of SCC versus Conventional-Slump Concrete .......................... 98
4.4 RESULTS FROM CREEP TESTING PROCEDURES....................................... 101
4.4.1 CREEP AND COMPLIANCE RESULTS................................................................ 103
4.4.1.1 Creep Strain Results................................................................................ 103
4.4.1.2 Compliance Results ................................................................................ 106
4.4.1.2.1 Effects of Water-to-Cementitious Materials Ratio .......................... 107
4.4.1.2.2 Effects of Cementitious Materials System....................................... 110
4.4.1.2.3 Behavior of SCC versus Conventional-Slump Concrete ................. 110
4.4.2 DRYING SHRINKAGE ....................................................................................... 113
4.4.2.1 Effects of Water-to-Cementitious Materials Ratio ................................. 116
4.4.2.2 Effects of Cementitious Materials System.............................................. 119
4.4.2.3 Behavior of SCC versus Conventional-Slump Concrete ........................ 119
4.4.3 ENVIRONMENTAL CONDITIONS....................................................................... 121
4.4.4 TRACKING AND MAINTAINING THE APPLIED LOAD ........................................ 121
4.5 RAPID CHLORIDE ION PENETRATION TEST.............................................. 124
4.6 LESSONS LEARNED THROUGH TESTING ................................................... 125
4.6.1 DESIGNING AND BUILDING CREEP FRAMES .................................................... 125
4.6.1.1 Creep Frame Design ............................................................................... 125
4.6.1.2 Creep Frame Construction ......................................................................126
4.6.2 PREPARING SPECIMENS................................................................................... 127
xiv
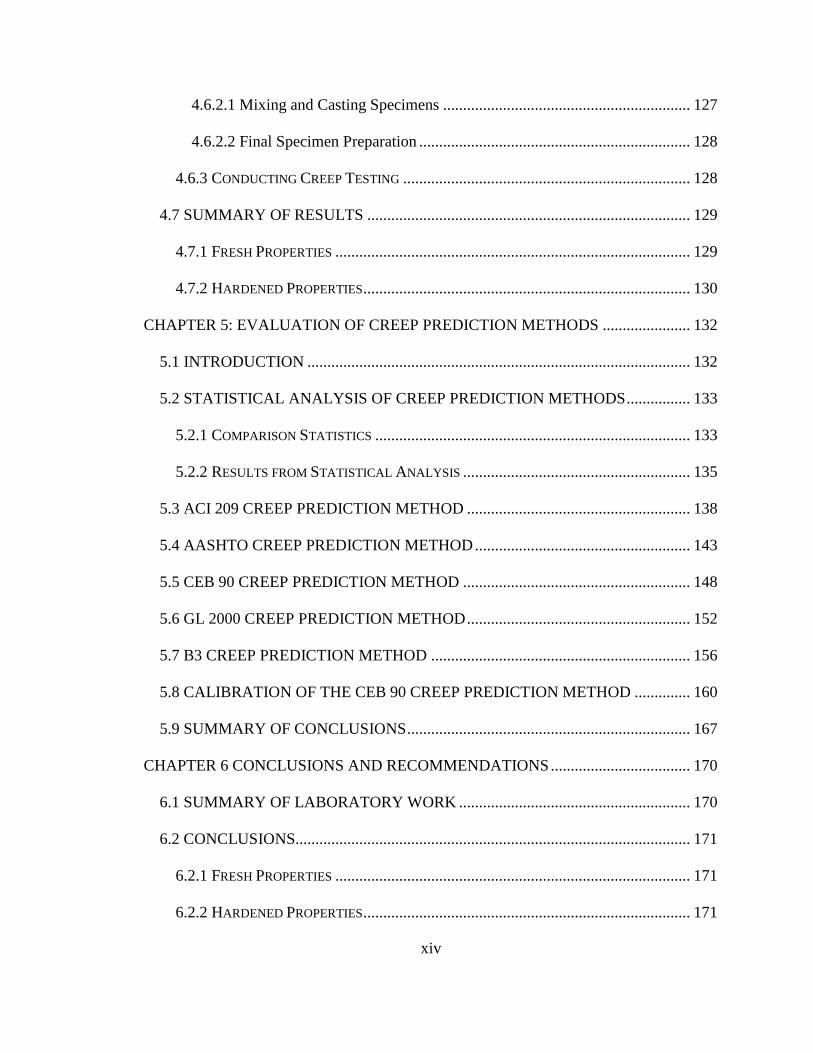
4.6.2.1 Mixing and Casting Specimens .............................................................. 127
4.6.2.2 Final Specimen Preparation ....................................................................128
4.6.3 CONDUCTING CREEP TESTING ........................................................................ 128
4.7 SUMMARY OF RESULTS ................................................................................. 129
4.7.1 FRESH PROPERTIES......................................................................................... 129
4.7.2 HARDENED PROPERTIES.................................................................................. 130
CHAPTER 5: EVALUATION OF CREEP PREDICTION METHODS ...................... 132
5.1 INTRODUCTION ................................................................................................ 132
5.2 STATISTICAL ANALYSIS OF CREEP PREDICTION METHODS................ 133
5.2.1 COMPARISON STATISTICS ............................................................................... 133
5.2.2 RESULTS FROM STATISTICAL ANALYSIS ......................................................... 135
5.3 ACI 209 CREEP PREDICTION METHOD ........................................................ 138
5.4 AASHTO CREEP PREDICTION METHOD...................................................... 143
5.5 CEB 90 CREEP PREDICTION METHOD ......................................................... 148
5.6 GL 2000 CREEP PREDICTION METHOD........................................................ 152
5.7 B3 CREEP PREDICTION METHOD ................................................................. 156
5.8 CALIBRATION OF THE CEB 90 CREEP PREDICTION METHOD .............. 160
5.9 SUMMARY OF CONCLUSIONS....................................................................... 167
CHAPTER 6 CONCLUSIONS AND RECOMMENDATIONS................................... 170
6.1 SUMMARY OF LABORATORY WORK .......................................................... 170
6.2 CONCLUSIONS................................................................................................... 171
6.2.1 FRESH PROPERTIES......................................................................................... 171
6.2.2 HARDENED PROPERTIES.................................................................................. 171

xv
6.2.3 CREEP PREDICTION METHODS........................................................................ 172
6.3 RECOMMENDATIONS FOR FUTURE RESEARCH....................................... 174
APPEDICES ....................................................................................................................183
APPENDIX A: RAW TEST DATA................................................................................184
A.1 COLLECTED TEST DATA..................................................................................184
xvi
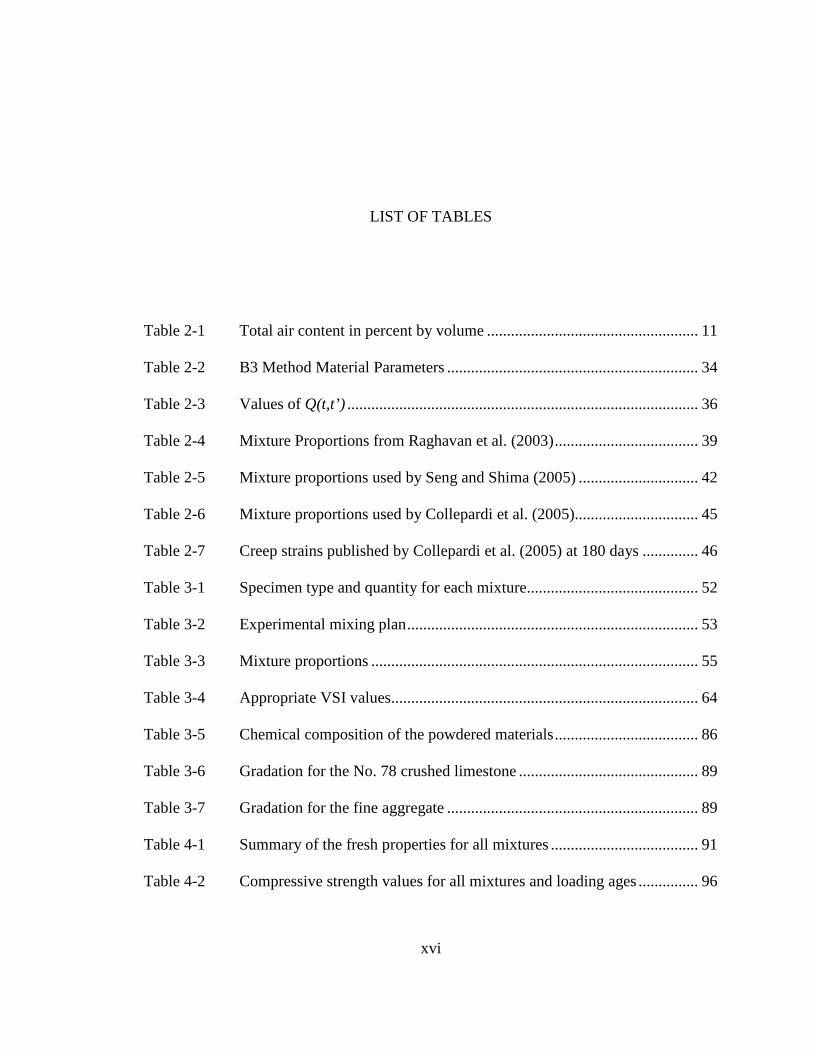
LIST OF TABLES
Table 2-1 Total air content in percent by volume ..................................................... 11
Table 2-2 B3 Method Material Parameters ............................................................... 34
Table 2-3 Values of Q(t,t’) ........................................................................................ 36
Table 2-4 Mixture Proportions from Raghavan et al. (2003).................................... 39
Table 2-5 Mixture proportions used by Seng and Shima (2005) .............................. 42
Table 2-6 Mixture proportions used by Collepardi et al. (2005)............................... 45
Table 2-7 Creep strains published by Collepardi et al. (2005) at 180 days .............. 46
Table 3-1 Specimen type and quantity for each mixture........................................... 52
Table 3-2 Experimental mixing plan......................................................................... 53
Table 3-3 Mixture proportions .................................................................................. 55
Table 3-4 Appropriate VSI values............................................................................. 64
Table 3-5 Chemical composition of the powdered materials.................................... 86
Table 3-6 Gradation for the No. 78 crushed limestone ............................................. 89
Table 3-7 Gradation for the fine aggregate ............................................................... 89
Table 4-1 Summary of the fresh properties for all mixtures ..................................... 91
Table 4-2 Compressive strength values for all mixtures and loading ages ............... 96
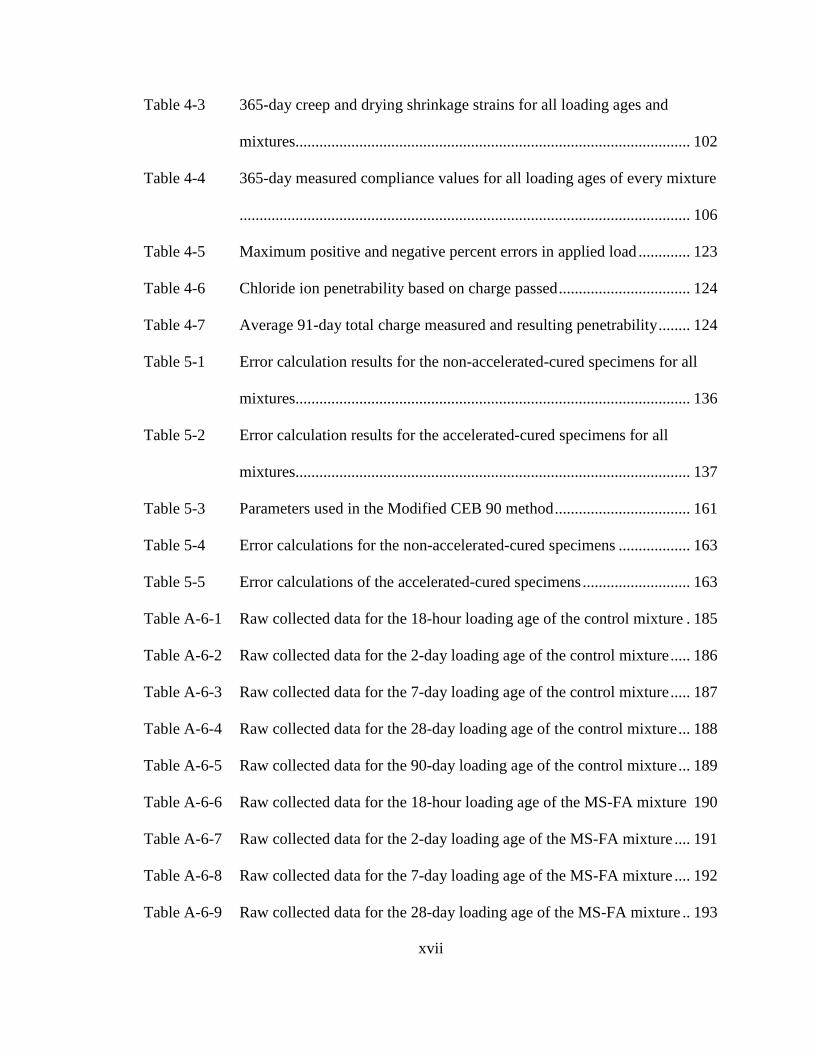
xvii
Table 4-3 365-day creep and drying shrinkage strains for all loading ages and
mixtures................................................................................................... 102
Table 4-4 365-day measured compliance values for all loading ages of every mixture
................................................................................................................. 106
Table 4-5 Maximum positive and negative percent errors in applied load ............. 123
Table 4-6 Chloride ion penetrability based on charge passed................................. 124
Table 4-7 Average 91-day total charge measured and resulting penetrability........ 124
Table 5-1 Error calculation results for the non-accelerated-cured specimens for all
mixtures................................................................................................... 136
Table 5-2 Error calculation results for the accelerated-cured specimens for all
mixtures................................................................................................... 137
Table 5-3 Parameters used in the Modified CEB 90 method.................................. 161
Table 5-4 Error calculations for the non-accelerated-cured specimens .................. 163
Table 5-5 Error calculations of the accelerated-cured specimens........................... 163
Table A- 6-1 Raw collected data for the 18-hour loading age of the control mixture . 185
Table A- 6-2 Raw collected data for the 2-day loading age of the control mixture..... 186
Table A- 6-3 Raw collected data for the 7-day loading age of the control mixture..... 187
Table A- 6-4 Raw collected data for the 28-day loading age of the control mixture... 188
Table A- 6-5 Raw collected data for the 90-day loading age of the control mixture... 189
Table A- 6-6 Raw collected data for the 18-hour loading age of the MS-FA mixture 190
Table A- 6-7 Raw collected data for the 2-day loading age of the MS-FA mixture .... 191
Table A- 6-8 Raw collected data for the 7-day loading age of the MS-FA mixture .... 192
Table A- 6-9 Raw collected data for the 28-day loading age of the MS-FA mixture .. 193
xviii
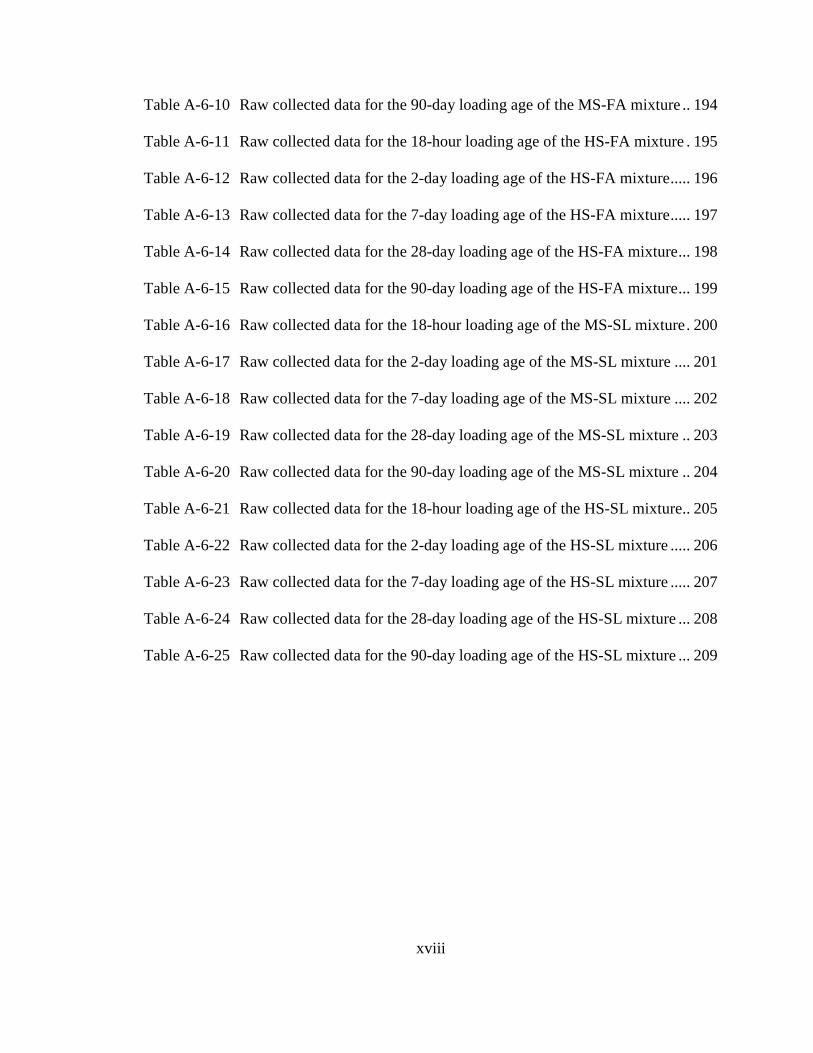
Table A- 6-10 Raw collected data for the 90-day loading age of the MS-FA mixture .. 194
Table A- 6-11 Raw collected data for the 18-hour loading age of the HS-FA mixture . 195
Table A- 6-12 Raw collected data for the 2-day loading age of the HS-FA mixture..... 196
Table A- 6-13 Raw collected data for the 7-day loading age of the HS-FA mixture..... 197
Table A- 6-14 Raw collected data for the 28-day loading age of the HS-FA mixture... 198
Table A- 6-15 Raw collected data for the 90-day loading age of the HS-FA mixture... 199
Table A- 6-16 Raw collected data for the 18-hour loading age of the MS-SL mixture. 200
Table A- 6-17 Raw collected data for the 2-day loading age of the MS-SL mixture .... 201
Table A- 6-18 Raw collected data for the 7-day loading age of the MS-SL mixture .... 202
Table A- 6-19 Raw collected data for the 28-day loading age of the MS-SL mixture .. 203
Table A- 6-20 Raw collected data for the 90-day loading age of the MS-SL mixture .. 204
Table A- 6-21 Raw collected data for the 18-hour loading age of the HS-SL mixture.. 205
Table A- 6-22 Raw collected data for the 2-day loading age of the HS-SL mixture ..... 206
Table A- 6-23 Raw collected data for the 7-day loading age of the HS-SL mixture ..... 207
Table A- 6-24 Raw collected data for the 28-day loading age of the HS-SL mixture ... 208
Table A- 6-25 Raw collected data for the 90-day loading age of the HS-SL mixture ... 209
xix
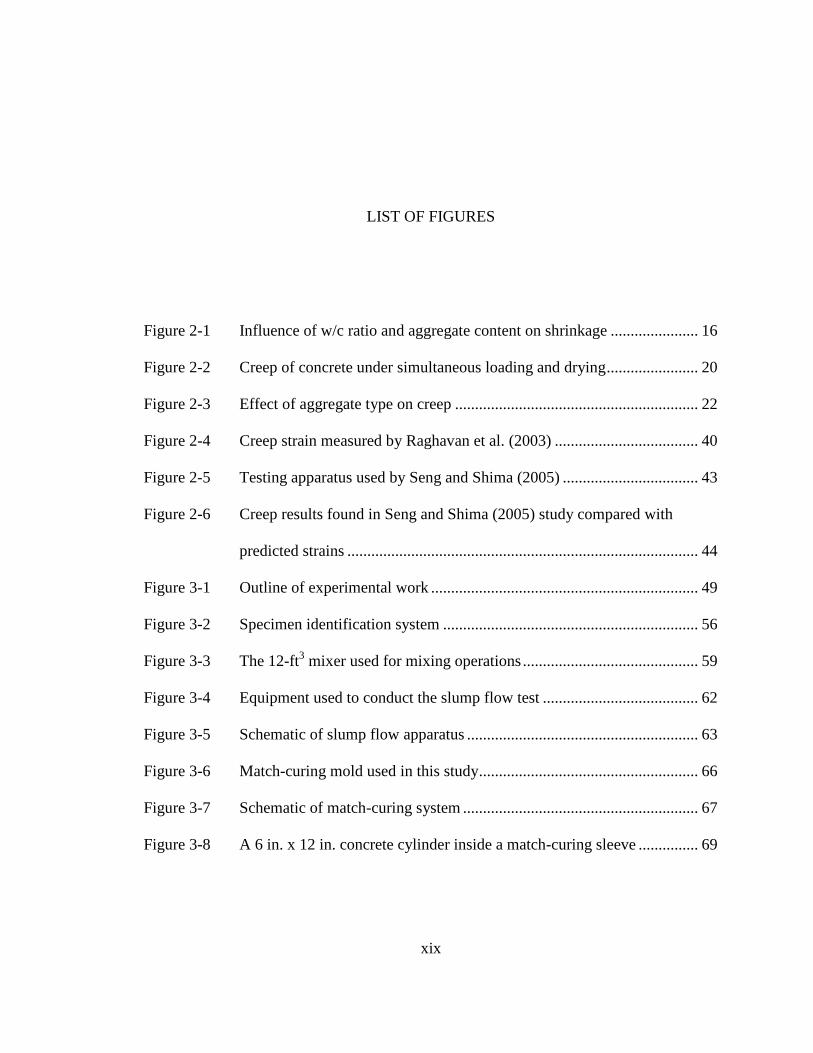
LIST OF FIGURES
Figure 2-1 Influence of w/c ratio and aggregate content on shrinkage ...................... 16
Figure 2-2 Creep of concrete under simultaneous loading and drying....................... 20
Figure 2-3 Effect of aggregate type on creep ............................................................. 22
Figure 2-4 Creep strain measured by Raghavan et al. (2003).................................... 40
Figure 2-5 Testing apparatus used by Seng and Shima (2005).................................. 43
Figure 2-6 Creep results found in Seng and Shima (2005) study compared with
predicted strains ........................................................................................ 44
Figure 3-1 Outline of experimental work ................................................................... 49
Figure 3-2 Specimen identification system ................................................................ 56
Figure 3-3 The 12-ft3 mixer used for mixing operations............................................ 59
Figure 3-4 Equipment used to conduct the slump flow test ....................................... 62
Figure 3-5 Schematic of slump flow apparatus .......................................................... 63
Figure 3-6 Match-curing mold used in this study....................................................... 66
Figure 3-7 Schematic of match-curing system ........................................................... 67
Figure 3-8 A 6 in. x 12 in. concrete cylinder inside a match-curing sleeve ............... 69
xx
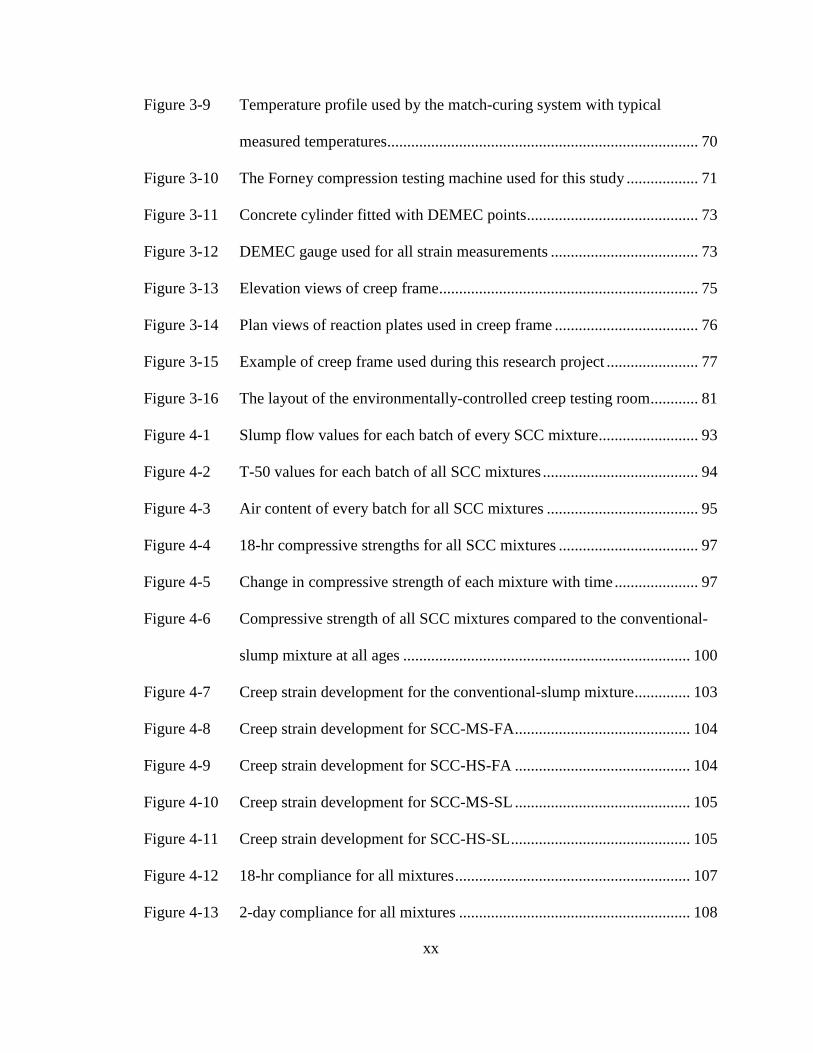
Figure 3-9 Temperature profile used by the match-curing system with typical
measured temperatures.............................................................................. 70
Figure 3-10 The Forney compression testing machine used for this study .................. 71
Figure 3-11 Concrete cylinder fitted with DEMEC points........................................... 73
Figure 3-12 DEMEC gauge used for all strain measurements ..................................... 73
Figure 3-13 Elevation views of creep frame................................................................. 75
Figure 3-14 Plan views of reaction plates used in creep frame .................................... 76
Figure 3-15 Example of creep frame used during this research project ....................... 77
Figure 3-16 The layout of the environmentally-controlled creep testing room............ 81
Figure 4-1 Slump flow values for each batch of every SCC mixture......................... 93
Figure 4-2 T-50 values for each batch of all SCC mixtures....................................... 94
Figure 4-3 Air content of every batch for all SCC mixtures...................................... 95
Figure 4-4 18-hr compressive strengths for all SCC mixtures ................................... 97
Figure 4-5 Change in compressive strength of each mixture with time..................... 97
Figure 4-6 Compressive strength of all SCC mixtures compared to the conventional-
slump mixture at all ages ........................................................................ 100
Figure 4-7 Creep strain development for the conventional-slump mixture.............. 103
Figure 4-8 Creep strain development for SCC-MS-FA............................................ 104
Figure 4-9 Creep strain development for SCC-HS-FA ............................................ 104
Figure 4-10 Creep strain development for SCC-MS-SL ............................................ 105
Figure 4-11 Creep strain development for SCC-HS-SL............................................. 105
Figure 4-12 18-hr compliance for all mixtures........................................................... 107
Figure 4-13 2-day compliance for all mixtures .......................................................... 108

xxi
Figure 4-14 7-day compliance for all mixtures .......................................................... 108
Figure 4-15 28-day compliance for all mixtures ........................................................ 109
Figure 4-16 90-day compliance for all mixtures ........................................................ 109
Figure 4-17 365-day compliance values for all SCC mixtures and the conventional-
slump mixture .........................................................................................112
Figure 4-18 Drying shrinkage strain development for the conventional-slump mixture
................................................................................................................. 113
Figure 4-19 Drying shrinkage strain development for the SCC-MS-FA mixture...... 114
Figure 4-20 Drying shrinkage strain development for the SCC-HS-FA mixture....... 114
Figure 4-21 Drying shrinkage strain curve for the SCC-MS-SL mixture .................. 115
Figure 4-22 Drying shrinkage strain curve for the SCC-HS-SL mixture................... 115
Figure 4-23 18-hr drying shrinkage strains for all SCC mixtures .............................. 116
Figure 4-24 2-day drying shrinkage strains for all SCC mixtures.............................. 117
Figure 4-25 7-day drying shrinkage strains for all SCC mixtures.............................. 117
Figure 4-26 28-day drying shrinkage strains for all SCC mixtures............................ 118
Figure 4-27 90-day drying shrinkage strains for all SCC mixtures............................ 118
Figure 4-28 365-day drying shrinkage strains for all SCC mixtures and the
conventional-slump mixture ................................................................... 120
Figure 4-29 The applied load on the 18-hour specimen of the control mixture ......... 122
Figure 5-1 Measured versus estimated creep strain for the conventional-slump
mixture using the ACI 209 procedure..................................................... 140
Figure 5-2 Measured versus estimated creep strain for the MS-FA mixture using the
ACI 209 procedure.................................................................................. 141
xxii
Figure 5-3 Measured versus estimated creep strain for the HS-FA mixture using the
ACI 209 procedure.................................................................................. 141
Figure 5-4 Measured versus estimated creep strain for the MS-SL mixture using the
ACI 209 procedure.................................................................................. 142
Figure 5-5 Measured versus estimated creep strain for the HS-SL mixture using the
ACI 209 procedure.................................................................................. 142
Figure 5-6 Measured versus estimated creep strain for the conventional-slump
mixture using the AASHTO 2007 procedure ......................................... 145
Figure 5-7 Measured versus estimated creep strain for the MS-FA mixture using the
AASHTO 2007 procedure ...................................................................... 146
Figure 5-8 Measured versus estimated creep strain for the HS-FA mixture using the
AASHTO 2007 procedure ...................................................................... 146
Figure 5-9 Measured versus estimated creep strain for the MS-SL mixture using the
AASHTO 2007 procedure ...................................................................... 147
Figure 5-10 Measured versus estimated creep strain for the HS-SL mixture using the
AASHTO 2007 procedure ...................................................................... 147
Figure 5-11 Measured versus estimated creep strain for the conventional-slump
mixture using the CEB 90 procedure...................................................... 150
Figure 5-12 Measured versus estimated creep strain for the MS-FA mixture using the
CEB 90 procedure................................................................................... 150
Figure 5-13 Measured versus estimated creep strain for the HS-FA mixture using the
CEB 90 procedure................................................................................... 151
xxiii
Figure 5-14 Measured versus estimated creep strain for the MS-SL mixture using the
CEB 90 procedure................................................................................... 151
Figure 5-15 Measured versus estimated creep strain for the HS-SL mixture using the
CEB 90 procedure................................................................................... 152
Figure 5-16 Measured versus estimated creep strain for the conventional-slump
mixture using the GL 2000 procedure .................................................... 154
Figure 5-17 Measured versus estimated creep strain for the MS-FA mixture using the
GL 2000 procedure ................................................................................. 154
Figure 5-18 Measured versus estimated creep strain for the HS-FA mixture using the
GL 2000 procedure ................................................................................. 155
Figure 5-19 Measured versus estimated creep strain for the MS-SL mixture using the
GL 2000 procedure ................................................................................. 155
Figure 5-20 Measured versus estimated creep strain for the HS-SL mixture using the
GL 2000 procedure ................................................................................. 156
Figure 5-21 Measured versus estimated creep strain for the conventional-slump
mixture using the B3 procedure.............................................................. 158
Figure 5-22 Measured versus estimated creep strain for the MS-FA mixture using the
B3 procedure........................................................................................... 158
Figure 5-23 Measured versus estimated creep strain for the HS-FA mixture using the
B3 procedure........................................................................................... 159
Figure 5-24 Measured versus estimated creep strain for the MS-SL mixture using the
B3 procedure........................................................................................... 159
xxiv
Figure 5-25 Measured versus estimated creep strain for the HS-SL mixture using the
B3 procedure........................................................................................... 160
Figure 5-26 Measured versus estimated creep strain for the conventional-slump
mixture using the Modified CEB 90 method.......................................... 165
Figure 5-27 Measured versus estimated creep strain for the MS-FA mixture using the
Modified CEB 90 method....................................................................... 165
Figure 5-28 Measured versus estimated creep strain for the HS-FA mixture using the
Modified CEB 90 method....................................................................... 166
Figure 5-29 Measured versus estimated creep strain for the MS-SL mixture using the
Modified CEB 90 method....................................................................... 166
Figure 5-30 Measured versus estimated creep strain for the HS-SL mixture using the
Modified CEB 90 method....................................................................... 167
1
CHAPTER 1
INTRODUCTION
1.1 BACKGROUND
Concrete is a material used in construction applications throughout the world. When
properly placed and cured, it exhibits excellent compressive-force-resisting
characteristics and engineers rely on it to perform in a myriad of situations; however, if
proper consolidation is not provided, its strength and durability could be questionable. To
help alleviate these concerns and provide a more uniform, well consolidated end product
on a consistent basis, Japanese researchers in the early 1980’s created a concrete mixture
that deformed under it own weight, thus filling around and encapsulating reinforcing steel
(Okamura and Ouchi 1999).
The Japanese researchers at Kochi University were lead by Hajime Okamura and
acted to lessen the strain in Japan brought on by the shortage of skilled labor (Okamura
and Ouchi 1999). Okamura’s creation was termed self-consolidating concrete (SCC) and
exhibited high flowability without experiencing the segregation issues found in
conventional-slump concrete mixtures (Khayat 1999). To achieve these properties, SCC
relies on a higher fine aggregate content than conventional-slump concrete, along with a
smaller-sized coarse aggregate. Additionally, large doses of high-range water-reducing
(HRWR) admixtures must be employed in conjunction with increased volumes of

2
powdered materials. The inclusion of the proper quantities of these materials allows SCC
to achieve high flowability while maintaining cohesiveness (Khayat, Hu, and Monty
1999).
The ability of SCC to act in the manner described above makes the material
especially attractive to the precast, prestressed concrete industry, which traditionally
constructs narrow members that are highly congested. However, the industry has been
slow to adopt this high-performance concrete because many governing agencies and
specification-writing bodies have been slow to provide guidelines for its use.
Additionally, because of the limited use of SCC in this application, there is a lack of
long-term performance data available for evaluation. Groups like the Precast/Prestressed
Concrete Institute (PCI) and the National Cooperative Highway Research Program
(NCHRP) have, or are currently working to provide, such guidelines in an effort to make
SCC more accessible. Additionally, many state departments of transportation are
interested in implementing SCC for the construction of prestressed concrete girders.
This fact is true in the state of Alabama, where the Alabama Department of
Transportation (ALDOT) is actively researching the implementation of SCC for use in
prestressed bridge girder applications. Prior use has been restricted due to a lack of
standardization of testing and placement techniques; however, recent American Society
for Testing and Materials (ASTM) guidelines have been created to address these issues,
and similar specifications are being produced to further fulfill these needs. This fact,
coupled with the data produced through additional research efforts, is helping to increase
the acceptance and routine use of SCC.

3
1.2 RESEARCH OBJECTIVES
This research effort is part of a larger research project sponsored by the Alabama
Department of Transportation (ALDOT) and is aimed at furthering the knowledge of the
behavior of SCC designed for use in prestressed bridge girder applications. Previous
phases of this effort have covered the development and testing of 21 SCC mixtures and
two conventional-slump mixtures with varying water-to-cementitious materials ratios
(w/cm) and sand-aggregate (s/agg) ratios. Thorough testing and evaluation has reduced
the number of suitable concrete mixtures down to four SCC mixtures and one
conventional-slump mixture.
This thesis outlines the testing and analysis of the creep behavior of these final five
mixtures to provide better understanding of the creep response of SCC. In order to
accomplish this objective, five levels of concrete maturity, or loading ages, were chosen
to provide a full picture of the behavior of each mixture. The primary objectives
associated with this study include
• Compare the creep exhibited by SCC to that of conventional-slump concrete
typically used in prestressed applications,
• Compare the creep exhibited by SCC mixtures consisting of a cement
replacement of Class C Fly Ash with that of SCC mixtures having a cement
replacement of Ground-Granulated Blast-Furnace (GGBF) Slag,
• Evaluate the effect of the water-to-cementitious materials ratio (w/cm), and thus
concrete strength, on the amount of creep experienced, and
4
• Compare the creep of the SCC mixtures to the estimated values produced by the
following creep prediction methods:
• ACI 209 (ACI Committee 209 1997)
• AASHTO (2007)
• CEB 90 (CEB 1990)
• GL 2000 (Gardner and Lockman 2001), and
• B3 (Bazant and Baweja 2000).
1.3 RESEARCH SCOPE
As stated in Section 1.2, this study was conducted to determine the creep performance of
four SCC mixtures and one conventional-slump mixture. Each of the four SCC mixtures
utilized supplementary cementing materials (SCMs) and can be grouped into two
categories. The first category is comprised of two SCC mixtures (one moderate-strength
and one high-strength) which utilized a cement replacement of Class C Fly Ash. The
second is also comprised of a moderate- and high-strength mixture; however, this
category used a cement replacement of Ground Granulated Blast-Furnace (GGBF) Slag.
The cementitious material portion of the conventional-slump mixture was comprised
entirely of Type III portland cement, which was the cement type used in all five mixtures.
It was determined that the researchers conducting investigation needed to address the
manner in which each of the SCC mixtures behaved relative to the conventional-slump
mixture and the manner in which SCC mixtures of various strength levels creep. To
accommodate these objectives, researchers involved in the study looked at each mixture
at five loading ages, which included: 18 hours, 2 days, 7 days, 28 days, and 90 days. All
5
specimens were non-accelerated-cured for 7 days, or until it was time for the application
of load, whichever came first. The only exception to this was made with regard to the 18-
hour specimens. They were match-cured at controlled, elevated temperatures in a similar
fashion to the method used by the prestressing industry in the Southeastern Unites States.
Once the appropriate curing regime had completed, the specimens were loaded to 40
percent of the ultimate strength that was determined immediately prior to load
application. Strain readings were then taken at specific intervals for a duration of 365
days, and the data were analyzed to determine the creep behavior for each loading age of
each mixture. Once these data were available, a comparison was made to compare the
creep behavior of each SCC mixture relative to the conventional-slump mixture and to
the other SCC mixtures of similar strengths. Additionally, the data gathered were
compared to the estimated values produced using the following five creep prediction
methods: ACI 209, AASHTO 2007, CEB 90, GL 2000, and B3.
1.4 ORGANIZATION OF THESIS
A critical review of relevant literature is presented in Chapter 2 of this report. This
chapter includes sections on: an introduction to SCC along with a discussion of
components of SCC, volumetric changes in concrete, creep prediction methods, and
previous studies of creep associated with SCC.
The experimental plan utilized during the course of the research effort is outlined in
Chapter 3, which includes information regarding the preparation and curing of
specimens, along with a description of the type and quantities of materials used.
Additionally, the test setup used for this study is presented in this chapter. This

6
description includes detailed information on the dimensions and materials used to
construct the creep frames, and also includes a description of the climate-controlled room
constructed to contain them.
The data that were gathered over the course of this project and the subsequent
analysis of the data is provided in Chapter 4. Here the creep response generated from the
gathered data is presented, along with the conclusions that were formed from the data.
A description of the data with regards to the five creep prediction methods that were
chosen for evaluation is given in Chapter 5. In addition, the accuracy of each method is
reported with regards to estimating the creep values of SCC. Further conclusions are also
presented here on the performance of each method.
General conclusions and recommendations are provided in Chapter 6, along with a
summary of the laboratory work performed during this study.

7
CHAPTER 2
LITERATURE REVIEW
2.1 INTRODUCTION
Self-Consolidating Concrete (SCC) owes its origins to a skilled labor shortage in early
1980’s Japan. This deficiency led to a decrease in the durability of the structures being
built throughout the country and was the subject of much concern (Okamura and Ouchi
1999). In 1988, a professor at the University of Tokyo, Dr. Hajime Okamura, developed a
solution for this problem by creating a type of concrete that would deform under its own
weight, eliminating the need for the application of external vibration to insure a durable
and aesthetically pleasing concrete structure (Okamura and Ouchi 1999). SCC’s
deformability brought with it additional benefits that greatly improved all construction
processes involving its use. Most notable are reductions in both the overall construction
time and in the noise commonly associated with the vibratory consolidation of reinforced
concrete (Khayat and Daczko 2003).
While deformability is the most prominent difference between SCC and conventional
concrete, several other requirements must be met to truly classify the material as self-
consolidating. In fact, a report co-authored by Khayat and Daczko (2003) states that four
such requirements must be met:

8
1) High deformability or ability to flow around reinforcement and into crevices
without the use of external vibration.
2) The deformability must be retainable throughout the duration of transport and
placement.
3) The mixture must be highly stable and resistant to segregation throughout its
entire fresh life cycle.
4) The bleeding of free water should be minimized.
Meeting these goals often proves difficult, and compromises must be made during the
design of each mixture to ensure the proper fresh and hardened properties for each job are
obtained (Khayat and Daczko 2003). In fact, the concessions made during this process
illustrate yet another facet of the difference between a conventional and self-
consolidating mixture.
2.2 COMPONENTS OF SCC
In order to meet the requirements listed above, the designer of an SCC mixture needs to
decide on a strategy to properly proportion the constituents. Domone (2000) says these
mixture attributes may be attained by: limiting coarse aggregate volumes, lowering
water-powder ratios, and using a superplasticizer.
Limiting the coarse aggregate content helps to reduce the internal particle friction
within a mixture. Thus, the mixture is able to flow around obstacles and through
reinforcing steel (Domone 2000; Khayat et al. 1999). Additionally, when the coarse
aggregate content is limited, a subsequent increase in paste volume results. This increase
magnifies the mixture’s flowing ability and allows it to flow around reinforcing steel and

9
into crevices without producing blockages (Domone 2000). As a result, a more durable
end product is produced, which is one of the main reasons for choosing to use SCC.
While fluidity and filling ability are integral to the success of any SCC mixture, these
two characteristics can be detrimental if not handled correctly. Providing fluidity through
an increase in water content can lead to segregation issues and a reduction in desirable
hardened properties (Tangtermsirikul and Khayat 2000). To prevent this from happening,
it is important to use a low water-powder ratio, which translates into less free water and a
consequent reduction of bleeding. These characteristics in turn, will lead to higher static
and dynamic stability of the mixture, allowing it to be transported and placed without
concern (Assaad et al. 2004).
While a reduction in the water-powder ratio is good for mixture stability, it also leads
to a reduction in workability, and precautions must be taken to provide a good finished
product. The use of a superplasticizer, also known as high-range water reducer (HRWR),
a chemical admixture aimed at increasing flowability without reducing stability, helps to
alleviate this concern. HRWRs work to disperse the fine particles in a mixture, providing
fluidity without the use of additional water (Tangtermsirikul and Khayat 2000). This
dispersion proves to be especially advantageous because water alone will not provide the
particle distance needed for proper friction reduction, and as previously stated, excess
water can lead to segregation and bleeding issues (Tangtermsirikul and Khayat 2000).
2.2.1 SCC CONSTITUENT MATERIALS
While the basic structure of an SCC mixture is discussed above, it should be noted that
each mixture can be tailored to fit the needs of most any job. This means that various

10
additional materials may be added to the design to fulfill job-specific requirements such
as: environmental concerns, availability of supplementary cementing materials (SCMs),
use of local materials, and increased viscosity requirements. The following sections
outline the constituent materials used for this research project in order to achieve the
desired fresh and hardened properties.
2.2.1.1 Type III Cement
The five types of portland cement ASTM C 150 (2006) recognizes are designated Type I
through Type V, each varying in fineness and composition. Type III cement has high
early-strength characteristics and is thus conducive for use in the precast, presstressed
concrete industry. These high early-strengths are primarily due to the high fineness of the
material. This means a large amount of surface area comes into contact with water,
producing rapid hydration (Mindess et al. 2003).
2.2.1.2 Air-entraining Admixtures
Like conventional concrete mixtures, SCC is susceptible to frost-and-deicing salt-
related failure issues and requires an elevated air content for prolonged life spans in ice-
prone environments. To ensure proper air content, an air-entraining admixture is often
proportioned into the mix design. However, this addition can lead to a reduction in
strength and must be accounted for during the mixture design process. Table 2-1, which
was taken from the PCI Design Handbook (2004), details the proper air content needed
for particular aggregate sizes and environmental conditions. It should be noted that all
values in Table 2-1 are permitted to be reduced by 1% for all mixtures having a
compressive strength in excess of 5,000 psi (PCI 2004).
11
Table 2-1: Total air content in percent by volume (PCI 2004)
Severe Exposure
Moderate Exposure
Less than 3/8 9.0% 7.0%3/8 7.5% 6.9%1/2 7.0% 5.5%3/4 6.0% 5.0%1 6.0% 5.0%
1-1/2 5.5% 4.5%
Total air content, %Nominal maximum aggregate size, in.
2.2.1.3 Supplementary Cementing Materials (SCMs)
Type III portland cement is among the most expensive cementitious materials currently
used in concrete production, requiring large amounts of energy and raw materials to
produce. When one considers that an increased volume of cementitious materials is
required as the mixture’s aggregate content decreases, it becomes clear that a cheaper
cementitious material would greatly reduce the cost associated with SCC production
(Khayat 1999). Moreover, as the cement level rises, an increase in mixture temperature
follows, leading to undesirable effects.
To combat these factors and still raise the level of cementitious materials, SCMs are
used, most commonly: fly ash, ground-granulated blast-furnace (GGBF) slag, and
limestone filler. Each helps to enhance flowability while providing cohesiveness to the
mixture (Khayat 1999). Two of the more commonly used SCMs are fly ash and GGBF
slag. These two materials bring additional benefits because they are waste materials from
other industrial processes. They allow the SCC designer to lower production costs while
reducing SCC’s impact on the environment.
12
Fly ash is “the inorganic, noncombustible residue of powdered coal after burning in
power plants” and is the most widely used SCM (Mindess et al. 2003). It can be classified
into two classes: Class C and Class F, the latter of which is mainly considered to be a
pozzolanic material.
Concrete made with class C fly ash exhibits more rapid strength-gaining
characteristics than that made with Class F fly ash and is better suited for applications
associated with precast, presstressed concrete construction. It is produced during the
combustion of lignitic coals, which are predominately found in the western portions of
the U.S., while Class F fly ash is found in the eastern portion of the U.S. and is formed
when bituminous and sub-bituminous coals are burnt (Mindess et al. 2003).
GGBF slag is defined as “the nonmetallic product, consisting essentially of silicates
and aluminosilicates of calcium and of other bases that is developed in a molten condition
simultaneously with iron in a blast furnace” (ACI Committee 116 2000). It is not
considered a pozzolanic material. Rather, it is a cementitious material comprised of the
same oxides that make up portland cement, e.g. lime, silica, and alumina, with the
difference being exhibited in the proportions of the constituents (Neville 1996). The
inclusion of GGBF slag into a mixture will provide greater workability and improved
durability over a mixture without GGBF slag, while reducing dependence on costly
portland cement (ACI Committee 233 2000; Neville 1996).
While limestone filler was not used during the course of this research project, it should
be noted that it is a popular mineral additive throughout the world. Limestone is a
hydraulic material that reacts well with portland cement. For this reason, ENV 197-
1:1992 permits it for use in concentrations of up to 35 percent, where other fillers are

13
only allowed in concentrations of 5 percent (Neville 1996). Using this material helps to
increase workability while providing cohesiveness and preventing bleeding (Khayat
1999).
2.2.1.4 Viscosity Modifying Admixtures
Viscosity modifying admixtures (VMA) work to improve static and dynamic stability
within a SCC mixture. Static stability is the resistance of a mixture to bleeding and
segregating once cast into place, while dynamic stability is the mixture’s resistance to
segregation and blocking while being transported and placed (Assaad et al. 2004). It
should also be noted that VMA in small dosages works to improve robustness in SCC
mixtures thus decreasing sensitivity to changes in material properties and environmental
conditions (Khayat 1999).
Khayat (1999) states that “mixtures containing VMA exhibit shear-thinning, a
behavior whereby the apparent viscosity decreases with the increase in shear rate.” This
decrease allows the mixture to deform during placement and then to regain viscosity after
placement, when the shear rate diminishes. Having these attributes allows a mixture
greater workability while reducing segregation, bleeding, and surface settlement after
being cast (Khayat 1999).
2.3 VOLUMETRIC CHANGE
Volume changes in concrete specimens are an intrinsic characteristic of the material itself
and can be attributed to several different mechanisms occurring simultaneously within
the specimen of interest. While the processes ultimately leading to volumetric change are
complex, it is widely accepted that three main components comprise the vast majority of

14
volumetric change: drying shrinkage, autogeneous shrinkage, and basic creep (Bazant
2001).
It is easy to imagine that each of the mechanisms listed above occurs for different
reasons. In fact, they each owe their existence to various combinations of mixture
proportions, environmental conditions, geometric properties, and stress conditions. This
section, which is organized according to the three volumetric change components, details
these factors.
2.3.1 DRYING SHRINKAGE
Neville (1996) defines drying shrinkage as a decrease in specimen volume due to the
“withdrawal of water from concrete.” It is important to take this into account when
designing a mixture because it can lead to “cracking or warping of elements of the
structure due to restraints present during shrinkage” (Mindess et al. 2003).
According to Bazant (2001), drying shrinkage occurs due to three mechanisms acting
simultaneously within the hardened specimen: capillary tension, solid surface tension,
and a withdrawal of absorbed water. From a design standpoint these three mechanisms
can be minimized through limiting the total water content and paste volume, where paste
volume is the “binder (cement and fillers), the water, the air, and the fine particles of
sand” (Chopin et al. 2003).
An increase in total water content results in a higher water-cement ratio (w/c) and
greater workability of a mixture. However, this will lead to more evaporable water in a
mixture and thus lead to higher shrinkage strains (Neville 1996). In fact, research has
shown shrinkage to be directly proportional to the w/c when it falls between 0.2 and 0.6,

15
while higher w/c show no appreciable shrinkage as the additional water is removed
(Neville 1996).
To further clarify the importance paste volume plays in drying shrinkage, additional
explanation is required. To this end, consider the following: as the cement content of a
mixture is increased while holding the w/c constant, a subsequent increase in shrinkage
occurs (Neville 1996). This can be attributed to the increased volume of hydrated cement
paste, which can be as much as ten times more deformable than the aggregate constituent
of a mixture (Chopin et al. 2003). Conversely, if the cement content were increased while
holding the water content steady, shrinkage would show no increase because the higher
cement content would allow for a stronger paste (Neville 1996). Thus the paste would
have a greater ability to resist the forces caused by shrinkage.
As mentioned above, aggregate is stiffer than hydrated cement paste and thus plays a
role in the resistance of shrinkage. In fact, Neville (1996) states that aggregate type and
stiffness are “the most important influence” with regards to shrinkage resistance. Figure
2-1 illustrates how an increase in total aggregate content works to reduce shrinkage.
16
Figure 2-1: Influence of w/c ratio and aggregate content on shrinkage (Neville 1996)
It should also be noted that the curing regime used to mature a concrete specimen
affects the amount of shrinkage that occurs (Neville 1996). Prolonging moist curing
allows a greater amount of cement paste to hydrate prior to drying, thus reducing the
concrete specimen’s susceptibility to shrinkage (Neville 1996).
When the drying shrinkage of SCC is compared to that of conventional concrete,
intuition would suggest that SCC will exhibit higher shrinkage values. This reasoning can
be attributed to the higher paste content required by SCC to attain the fluidity necessary
to be classified as self-consolidating. Chopin et al. (2003) found shrinkage in SCC to be
upwards of 20 percent higher than the shrinkage found in their conventional mixture. It

17
should also be noted that the conventional concrete mixture used in that research had a
high gravel/sand ratio, which will also lead to a large amount of shrinkage.
In contrast to the findings in Chopin et al. (2003), Schindler et al. (2006) found that
SCC mixtures exhibited drying shrinkage values on the same order of magnitude as
conventional-slump concrete. This held true for all mixtures investigated, even as the
sand-aggregate (S/Agg) ratio changed from 0.38 to 0.46. These findings led the
researchers in that study to conclude that SCC performs in a manner similar to
conventional-slump concrete with regards to drying shrinkage.
2.3.2 AUTOGENEOUS SHRINKAGE
Autogeneous shrinkage is a phenomenon that occurs in concrete in which a decrease in
volume takes place without a change in mass or temperature (Lee et al. 2006). It differs
from drying shrinkage in that it occurs due to water consumption brought on by the
hydration process. As the hydration process continues in a hardened concrete specimen,
self-desiccation occurs, consuming available water and causing a subsequent decrease in
volume (Pierard et al. 2005).
Autogeneous shrinkage increases as the w/c decreases, but can vary according to the
type of cementitious material present (Pierard et al. 2005). Portland cement gains strength
rapidly as compared to other cementitious materials, due in part to its high speed of
hydration, which is a function of the material’s fineness. Consequently, the majority of
autogeneous shrinkage associated with portland cement is complete within the first three
days (Pierard et al. 2005). Ground granulated blast-furnace (GGBF) slag exhibits a much
more retarded development of autogeneous shrinkage. In fact, it is not uncommon to see

18
swelling of a specimen over the first few days, followed by a decrease in volume as the
specimen continues to age (Pierard et al. 2005). Mixtures utilizing this cementitious
material tend to undergo the majority of their shrinkage at later ages.
Knowing that autogeneous shrinkage is directly related to cement content and thus
paste content, it can be easily seen that an increase in paste volume may result in an
increase in this type of shrinkage. That being said, it should also be easy to see that SCC
mixtures are especially susceptible to autogeneous shrinkage due to their dependence on
high paste content for fluidity.
2.3.3 CREEP
D’Ambrosia et al. (2005) define creep as “the time-dependent viscoelastic response to
stress generated from externally applied loads”. Its importance in the design of precast,
prestressed concrete structures is paramount, as creep results in partial loss of prestress
force, which can be detrimental to a structure’s functionality if the loss is underestimated.
It is a complex phenomenon dependent on many of the factors that influence shrinkage
and some additional parameters.
Creep and shrinkage act together to account for the total time-dependent increase in
strain occurring in loaded concrete specimens (Neville 1996; Mindess et al. 2003). This is
evident considering most concrete is drying under load and increases in creep strain have
been measured under such conditions (Mindess et al. 2003). To this end, terminology has
been developed to take this into account. For instance, total time-dependent volumetric
change can be broken down into three categories: free shrinkage, basic creep, and drying
creep (Neville 1996; Mindess et al. 2003).

19
Free shrinkage, also known as drying shrinkage, was discussed in detail in Section
2.3.1. Basic creep is the time-dependent increase in strain due to the applied load without
drying. However, the sum of these two fails to account for the total time-dependent
deformation a loaded concrete specimen undergoes. To account for this, a drying creep
term is introduced (Mindess et al. 2003). Figure 2-2 clearly illustrates how the sum of the
three components combines to account for the total deformation. In this figure, the
following notation is used: εsh = drying shrinkage strain, εbc = basic creep strain, εdc =
drying creep strain, εCT = total creep strain, εtot = total strain.
It should also be noted that in spite of the validity of the mechanisms discussed
above, common practice does not account for the individual effects (Mindess et al. 2003).
The reasoning behind this spawns from a proliferation of available data which considers
creep and shrinkage additive (Neville 1996).
20
Figure 2-2: Creep of concrete under simultaneous loading and drying
(Mindess et al. 2003)
2.3.3.1 The Creep Mechanism
As mention in Section 2.3.3, creep is a complex phenomenon, which is likely not fully
understood. However, the most widely accepted view involves shearing forces acting on
individual particles causing them to slip past each other (Mindess et al. 2003). The
amount of slip is highly dependent on the attractive forces binding the particles together.
For instance, if the particles are chemically bonded, no slip will be able to occur.
However, if the particles are held together by van der Waals’ forces, slip is possible.

21
Bound water within the concrete works to weaken the bond between particles, allowing
slip to occur (Mindess et al. 2003).
While particle slip is a widely accepted mechanism of creep, it is not the only way
creep can occur. According to Mindess et al. (2003) the application of external force
works to push bound water out of micropores within the hardened paste structure. The
water is moved from micropores to capillary pores where the stress levels are much
lower. As this occurs, the concrete specimen undergoes a noticeable change in volume
(Mindess et al. 2003).
Some of the water being moved is able to work its way to the surface and evaporate,
which is a form of drying creep. However, since the total amount of water being
redistributed is a small portion of the total bound water, this movement can occur with no
external loss of water. Therefore, creep can occur in fully saturated specimens, which is
referred to as basic creep (Mindess et al. 2003).
2.3.3.2 Variables Affecting Creep
Due to the overwhelmingly complex nature of creep itself, many factors influence the
total amount of creep a specimen experiences. According to Neville (1996) it is the
hydrated cement paste which actually experiences creep, while the aggregate structure
serves to restrain or prevent creep from happening. Therefore, the most important factors
affecting the amount of creep are the stiffness of the chosen aggregate and its content
within the mixture (Neville 1996 Mindess et al. 2003). Figure 2-3 illustrates how
different aggregate types affect total creep. In this figure, it can be seen that sandstone
22
allows the most creep of the four aggregate types. Then, moving down the right vertical
axis, gravel, granite, and limestone each exhibit decreasing amounts of creep.
Figure 2-3: Effect of aggregate type on creep (Mindess et al. 2003)
While aggregate is the most important factor affecting creep, total paste content is
also of large concern. As previously stated, the paste portion of the mixture is what
actually experiences creep. Therefore, the higher the paste content, the higher the creep;
however, this is by no means a linear relationship (Neville 1996).
In a similar fashion, creep is dependent on the w/c of a concrete mixture. As the w/c
increases, an associated increase in creep will occur. This is due in part to an increase in
bound water, which can be displaced as described in Section 2.3.3.1, causing a
volumetric change in the concrete specimen. A change in w/c could also signify a change

23
in cement content, which will affect strength and thus the amount of creep (Mindess et al.
2003). If the cement content were to increase, then the strength would increase. This
would lead to less creep because the higher strength concrete would be better able to
resist the creep forces (Mindess et al. 2003).
Concrete strength is directly related to total creep in that the higher the compressive
strength of a mixture, the lower the measured deformation. Curing conditions play a large
role in maturing concrete, and proper curing increases the compressive strength to levels
better suited for resisting creep. The longer a specimen is allowed to cure, the more
hydrated cement exists, and the higher the compressive strength (Mindess et al. 2003).
This makes it extremely important to properly cure specimens in order to reduce creep.
Other factors that influence concrete strength consequently play a role in the amount
of creep observed. For instance, the composition of the chosen cement can play a large
role. Type I cement gains strength slower than Type III cement and consequently
experiences more creep at early ages (Mindess et al. 2003). Likewise, the use of chemical
admixtures such as superplasticizers can increase creep. However, it should be noted that
strength gains achieved by the low w/c ratios resulting from superplasticizers can offset
the undesirable effects of increased creep (Neville 1996; Mindess et al. 2003).
Ambient conditions such as elevated temperature and low relative humidity will also
increase creep. While experiencing elevated temperature, a specimen will undergo an
increased rate of creep; however, the net result should be less overall creep due to the
increased concrete maturity brought on by the elevated temperatures (Mindess et al.
2003). A reduction in relative humidity works to increase drying creep as more internal
moisture is pulled away from the specimen (Neville 1996; Mindess et al. 2003).
24
Another large contributing influence on creep is the applied stress level within the
specimen of interest. It is widely accepted that the amount of creep witnessed is
approximately proportional to the applied stress (Neville 1996; Mindess et al. 2003).
However, this is only true for stress levels below 40% to 60% of the strength at loading
(Neville 1996). Above these stress levels, microcracking begins to occur and the stress-
strain relationship becomes increasingly nonlinear.
2.4 CREEP PREDICTION METHODS
The following sections outline the procedures for five commonly used creep prediction
methods and provide the reader with a terse explanation of how each works.
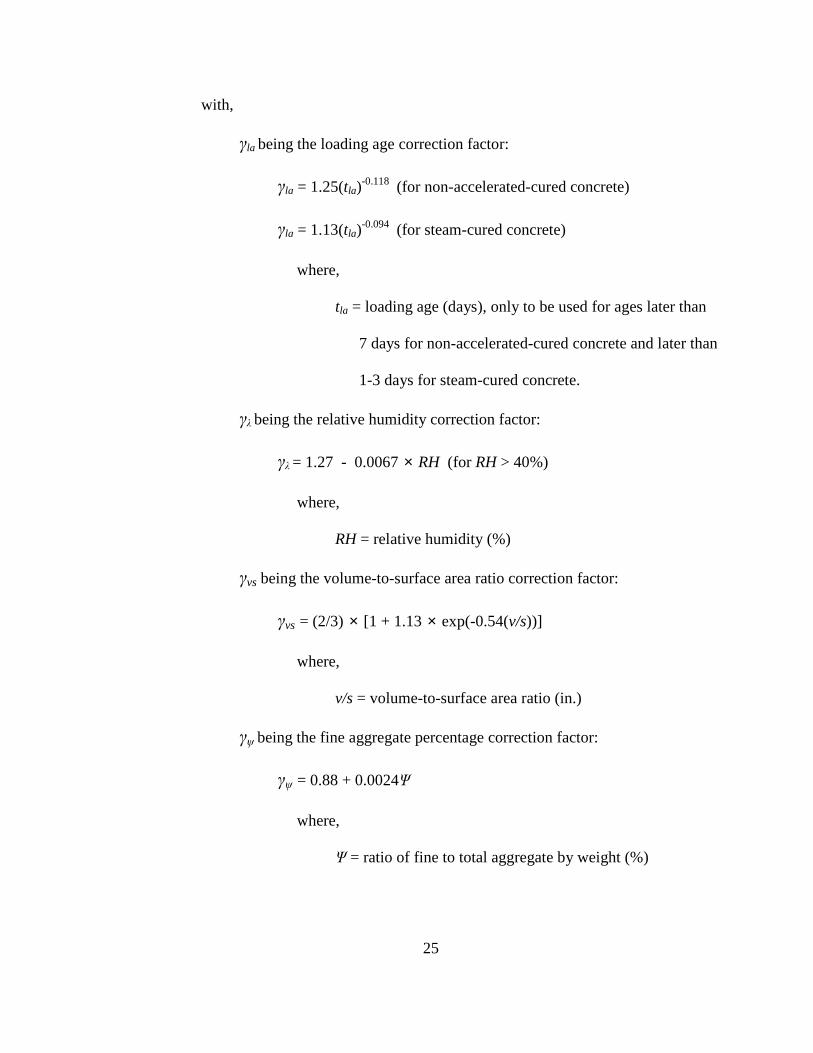
2.4.1 ACI 209 CREEP PREDICTION METHOD
The creep prediction method set forth by ACI Committee 209 (1997) uses an ultimate
creep coefficient that may be adjusted to account for various environmental conditions
and mixture-specific properties. In addition to the ultimate creep coefficient, this method
uses a time-rate function to account for the growth in creep over time (ACI Committee
209 1997).
The ultimate creep coefficient, which is defined as the ratio of creep strain to initial
strain resulting from the application of load, is determined using the following equation:
)(35.2 asvslau γγγγγγυ ψλ ×××××=
where,
uυ = ultimate creep coefficient
25
with,
γla being the loading age correction factor:
γla = 1.25(tla)-0.118 (for non-accelerated-cured concrete)
γla = 1.13(tla)-0.094 (for steam-cured concrete)
where,
tla = loading age (days), only to be used for ages later than
7 days for non-accelerated-cured concrete and later than
1-3 days for steam-cured concrete.
γλ being the relative humidity correction factor:
γλ = 1.27 - 0.0067 × RH (for RH > 40%)
where,
RH = relative humidity (%)
γvs being the volume-to-surface area ratio correction factor:
γvs = (2/3) × [1 + 1.13 × exp(-0.54(v/s))]
where,
v/s = volume-to-surface area ratio (in.)
γψ being the fine aggregate percentage correction factor:
γψ = 0.88 + 0.0024Ψ
where,
Ψ = ratio of fine to total aggregate by weight (%)
26
γs being the slump correction factor:
γs = 0.82 + 0.067s
where,
s = observed slump (in.)
γa being the air content correction factor:
γa = 0.46 + 0.09a ≥ 1.0
where,
a = air content (%)
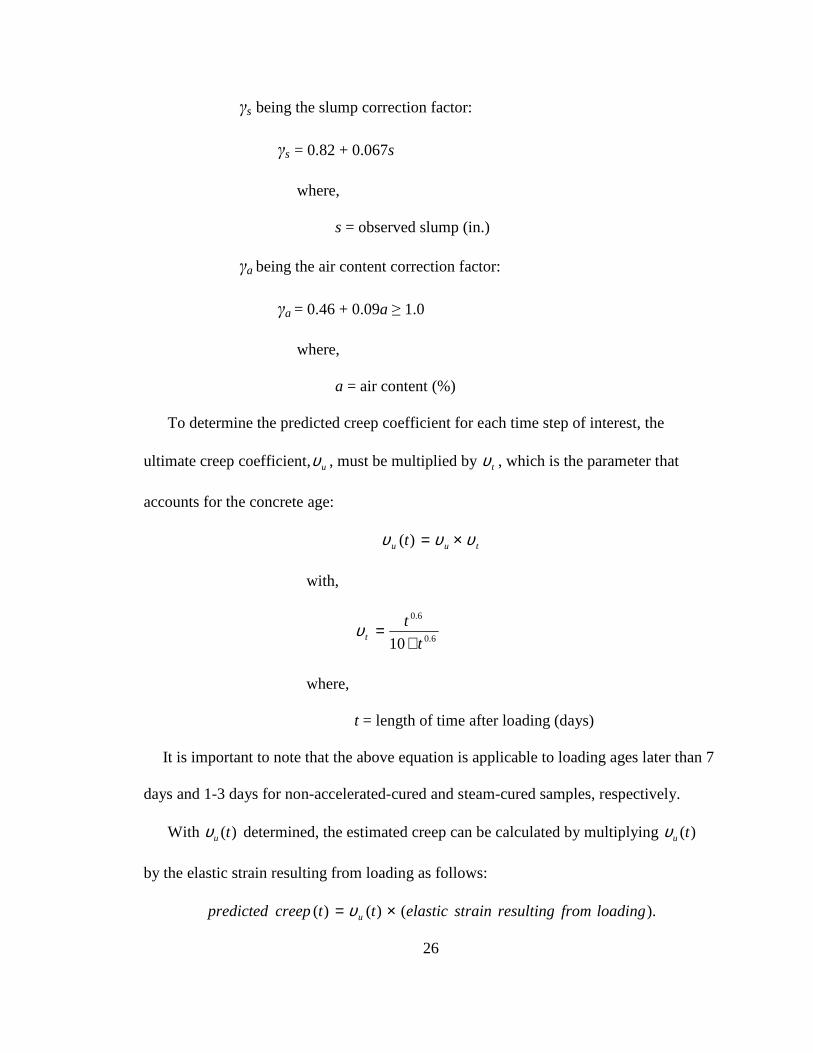
To determine the predicted creep coefficient for each time step of interest, the
ultimate creep coefficient,uυ , must be multiplied by tυ , which is the parameter that
accounts for the concrete age:
tuu t υυυ ×=)(
with,
6.0
6.0
10 t
tt +
=υ
where,
t = length of time after loading (days)
It is important to note that the above equation is applicable to loading ages later than 7
days and 1-3 days for non-accelerated-cured and steam-cured samples, respectively.
With )(tuυ determined, the estimated creep can be calculated by multiplying )(tuυ
by the elastic strain resulting from loading as follows:
).()()( loadingfromresultingstrainelasticttcreeppredicted u ×= υ

27
2.4.2 AASHTO 2007 CREEP PREDICTION METHOD
The AASHTO 2007 method is much like the ACI 209 method previously discussed, in
that it too uses an ultimate creep coefficient. It is based on the results of the research
described in NCHRP Report 496 (2003), which was sponsored by the National
Cooperative Highway Research Program (NCHRP). This report was created in an effort
to develop guidelines for predicting prestress loss in high-strength concrete girders.
AASHTO 2007 allows the user to take into account factors such as the relative humidity
surrounding the specimen of interest, the volume-to-surface area ratio, concrete strength,
and the development of strength with time (AASHTO 2007).
To determine the creep coefficient the following equation is given, along with several
modifiers to account for various environmental and mixture specific factors:
118.09.1),( −×××××= itdfhcsi tkkkkttψ
where,
ks being the factor accounting for the effect of the volume-to-surface area
ratio component:
ks = 1.45 – 0.13(v/s) ≥ 1.0
khc being the humidity factor for creep:
khc = 1.56 – 0.008H
where,
H = relative humidity (%)
kf being the factor for the effect of concrete strength:
cif f
k'1
5
+=
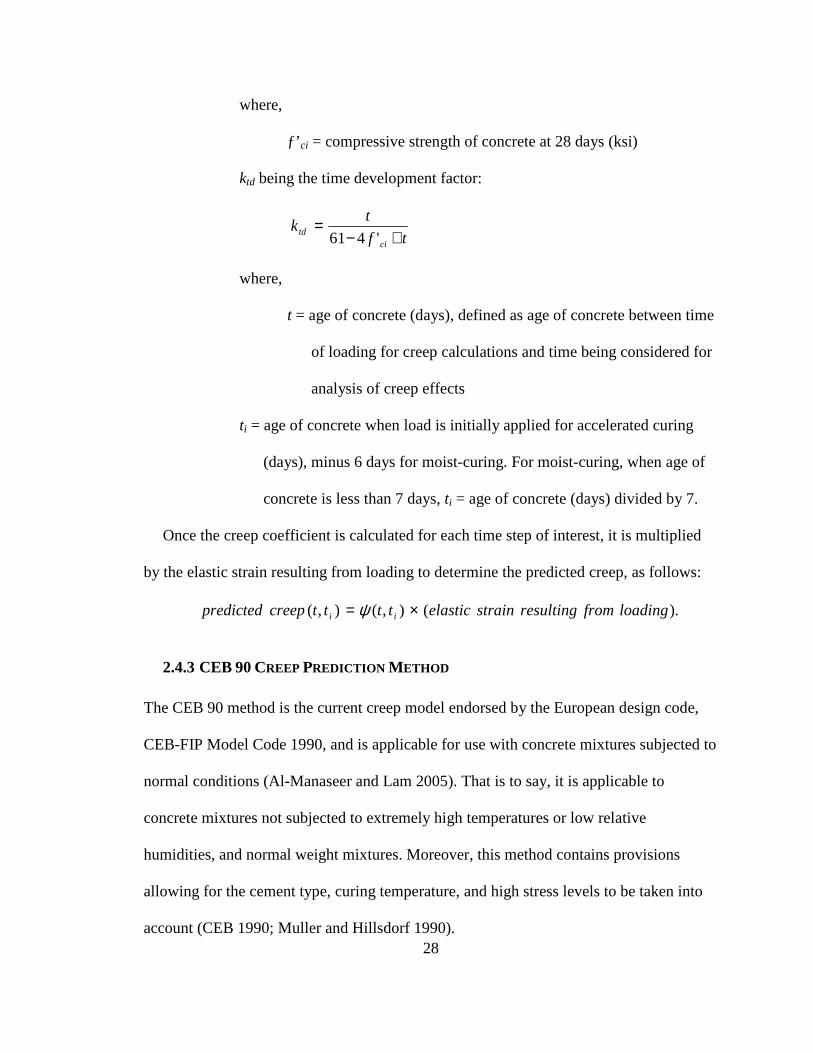
28
where,
ƒ’ci = compressive strength of concrete at 28 days (ksi)
ktd being the time development factor:
tf
tk
citd +−
='461
where,
t = age of concrete (days), defined as age of concrete between time
of loading for creep calculations and time being considered for
analysis of creep effects
ti = age of concrete when load is initially applied for accelerated curing
(days), minus 6 days for moist-curing. For moist-curing, when age of
concrete is less than 7 days, ti = age of concrete (days) divided by 7.
Once the creep coefficient is calculated for each time step of interest, it is multiplied
by the elastic strain resulting from loading to determine the predicted creep, as follows:
).(),(),( loadingfromresultingstrainelasticttttcreeppredicted ii ×= ψ
2.4.3 CEB 90 CREEP PREDICTION METHOD
The CEB 90 method is the current creep model endorsed by the European design code,
CEB-FIP Model Code 1990, and is applicable for use with concrete mixtures subjected to
normal conditions (Al-Manaseer and Lam 2005). That is to say, it is applicable to
concrete mixtures not subjected to extremely high temperatures or low relative
humidities, and normal weight mixtures. Moreover, this method contains provisions
allowing for the cement type, curing temperature, and high stress levels to be taken into
account (CEB 1990; Muller and Hillsdorf 1990).
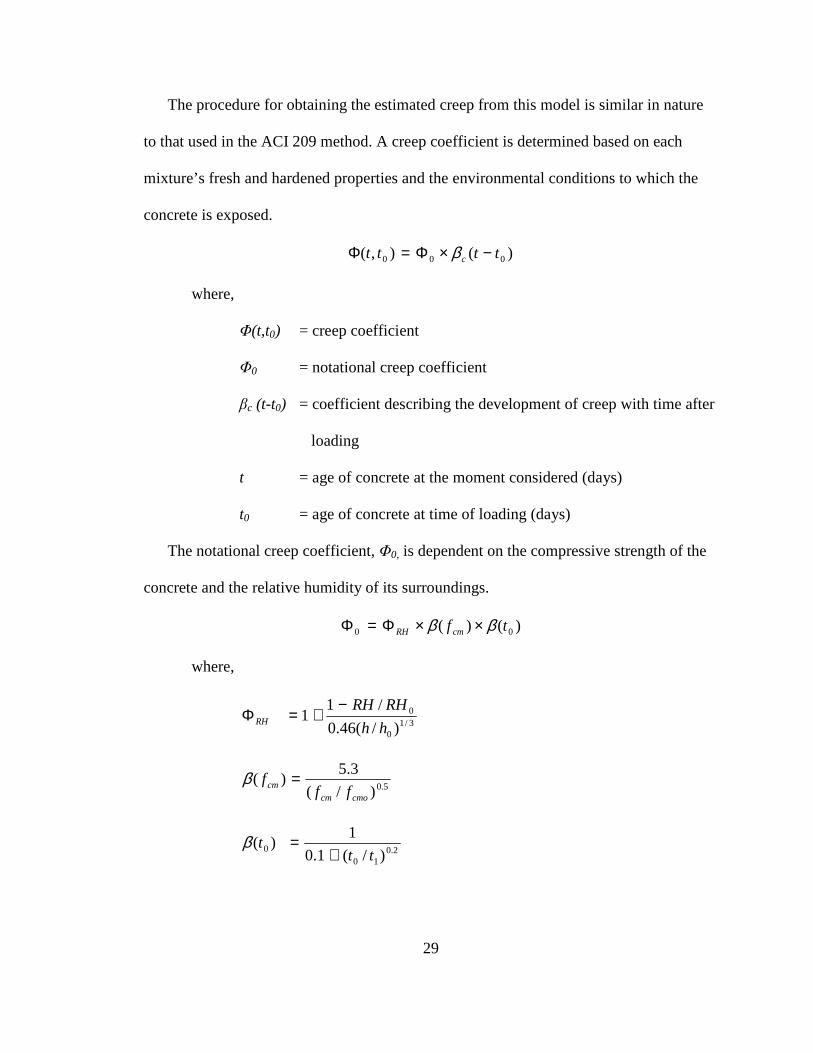
29
The procedure for obtaining the estimated creep from this model is similar in nature
to that used in the ACI 209 method. A creep coefficient is determined based on each
mixture’s fresh and hardened properties and the environmental conditions to which the
concrete is exposed.
)(),( 000 tttt c −×Φ=Φ β
where,
Φ(t,t0) = creep coefficient
Φ0 = notational creep coefficient
βc (t-t0) = coefficient describing the development of creep with time after
loading
t = age of concrete at the moment considered (days)
t0 = age of concrete at time of loading (days)
The notational creep coefficient, Φ0, is dependent on the compressive strength of the
concrete and the relative humidity of its surroundings.
)()( 00 tf cmRH ββ ××Φ=Φ
where,
3/10
0
)/(46.0
/11
hh
RHRHRH
−+=Φ
5.0)/(
3.5)(
cmocmcm
fff =β
2.010
0 )/(1.0
1)(
ttt
+=β

30
where,
h = 2Ac/u (mm)
fcm = mean compressive strength of concrete at 28 days (MPa)
fcmo = 10 MPa
RH = relative humidity of the ambient environment (%)
RH0 = 100%
Ac = cross-sectional area (mm2)
u = perimeter of the member in contact with the atmosphere (mm)
h0 = 100 mm
t1 = 1 day
The manner in which the creep develops with time is accounted for in the following
equation:
3.0
10
100 /)(
/)()(
−+−
=−ttt
ttttt
Hc β
β
where,
15002502.111500
18
0
≤+
+=
h
h
RH
RHHβ
After the creep coefficient has been calculated, it can be multiplied by the elastic
strain resulting from the applied load to determine the estimated creep at each time step,
as follows:
).(),(),( 00 loadingfromresultingstrainelasticttttcreeppredicted ×Φ=
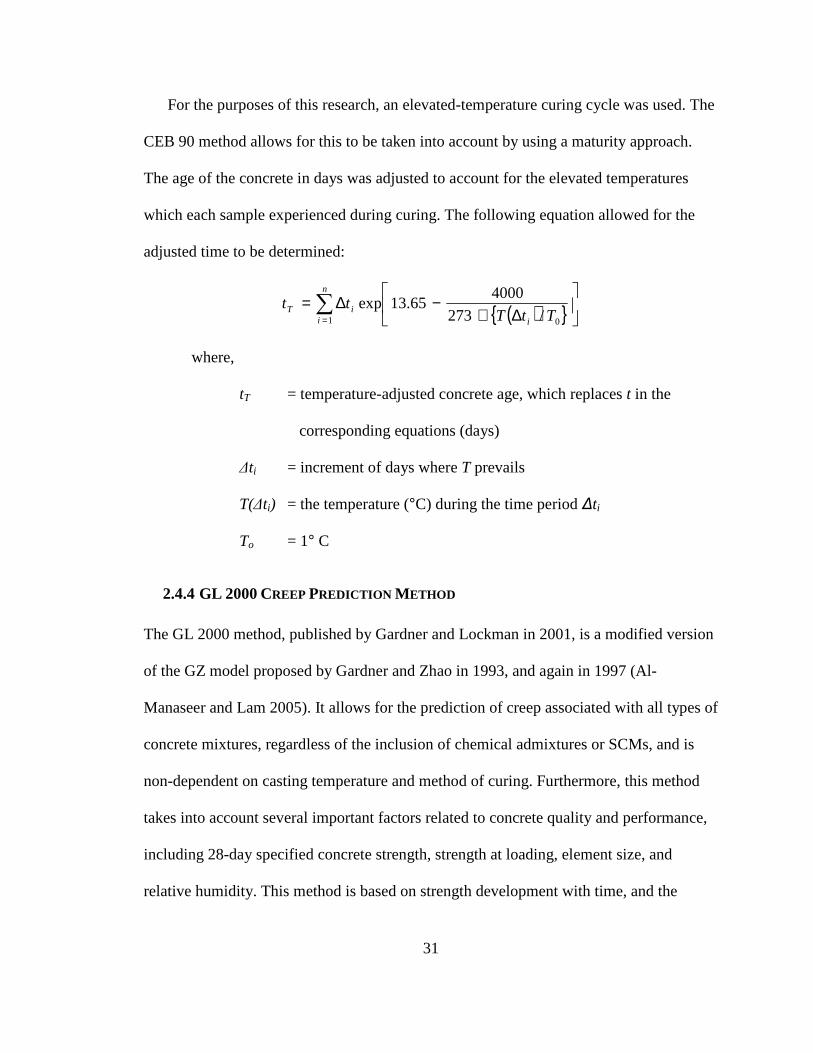
31
For the purposes of this research, an elevated-temperature curing cycle was used. The
CEB 90 method allows for this to be taken into account by using a maturity approach.
The age of the concrete in days was adjusted to account for the elevated temperatures
which each sample experienced during curing. The following equation allowed for the
adjusted time to be determined:
( ){ }∑=
∆+−∆=
n
i iiT TtT
tt1 0/273
400065.13exp
where,
tT = temperature-adjusted concrete age, which replaces t in the
corresponding equations (days)
∆ti = increment of days where T prevails
T(∆ti) = the temperature (°C) during the time period ∆ti
To = 1° C
2.4.4 GL 2000 CREEP PREDICTION METHOD
The GL 2000 method, published by Gardner and Lockman in 2001, is a modified version
of the GZ model proposed by Gardner and Zhao in 1993, and again in 1997 (Al-
Manaseer and Lam 2005). It allows for the prediction of creep associated with all types of
concrete mixtures, regardless of the inclusion of chemical admixtures or SCMs, and is
non-dependent on casting temperature and method of curing. Furthermore, this method
takes into account several important factors related to concrete quality and performance,
including 28-day specified concrete strength, strength at loading, element size, and
relative humidity. This method is based on strength development with time, and the
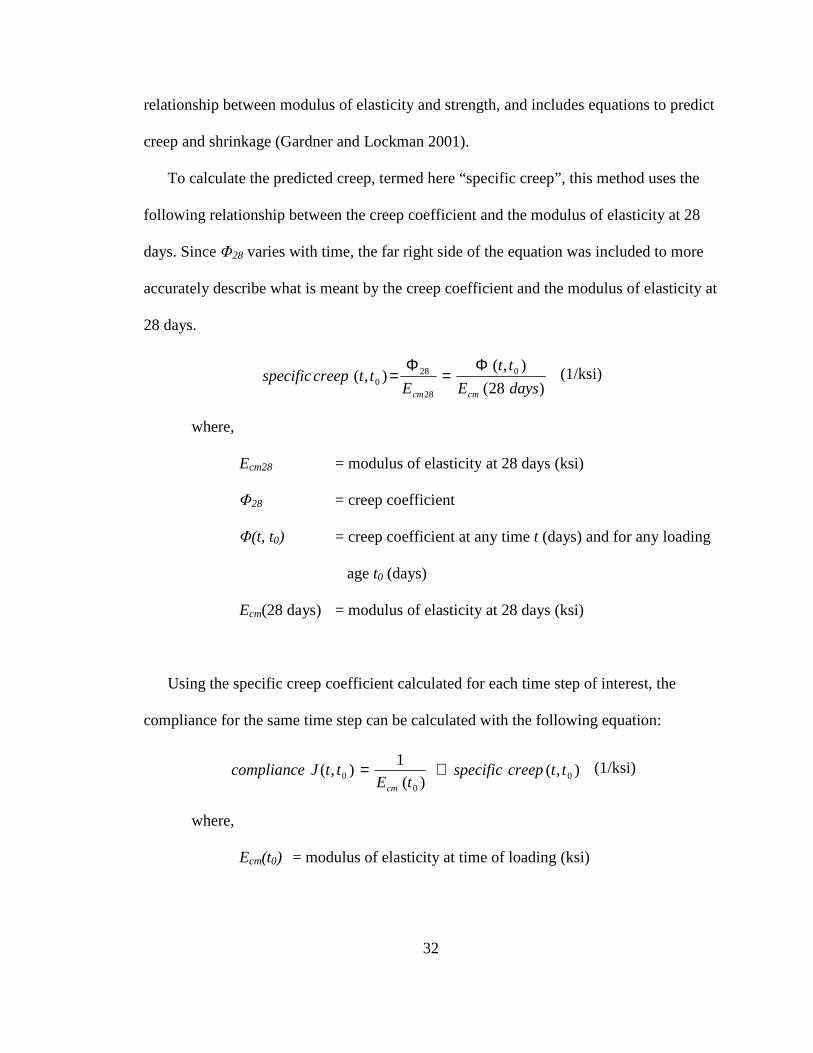
32
relationship between modulus of elasticity and strength, and includes equations to predict
creep and shrinkage (Gardner and Lockman 2001).
To calculate the predicted creep, termed here “specific creep”, this method uses the
following relationship between the creep coefficient and the modulus of elasticity at 28
days. Since Φ28 varies with time, the far right side of the equation was included to more
accurately describe what is meant by the creep coefficient and the modulus of elasticity at
28 days.
)28(
),(),( 0
28
280 daysE
tt
Ettcreepspecific
cmcm
Φ=
Φ= (1/ksi)
where,
Ecm28 = modulus of elasticity at 28 days (ksi)
Φ28 = creep coefficient
Φ(t, t0) = creep coefficient at any time t (days) and for any loading
age t0 (days)
Ecm(28 days) = modulus of elasticity at 28 days (ksi)
Using the specific creep coefficient calculated for each time step of interest, the
compliance for the same time step can be calculated with the following equation:
),()(
1),( 0
00 ttcreepspecific
tEttJcompliance
cm
+= (1/ksi)
where,
Ecm(t0) = modulus of elasticity at time of loading (ksi)
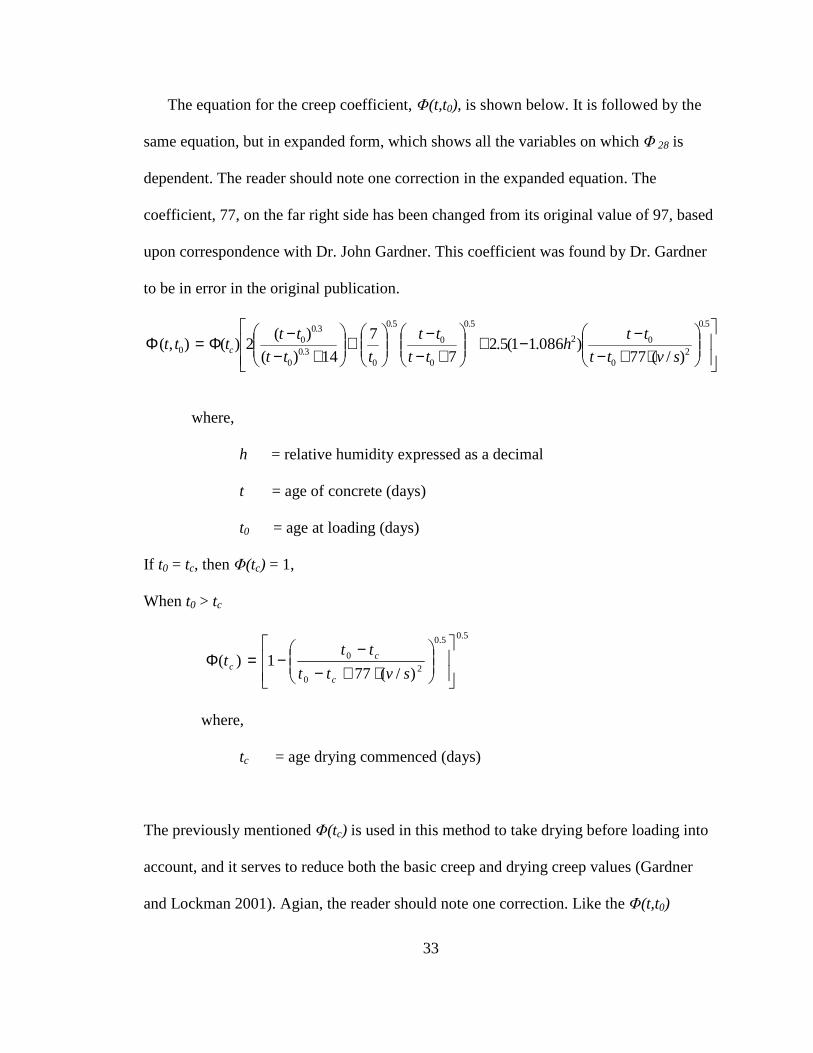
33
The equation for the creep coefficient, Φ(t,t0), is shown below. It is followed by the
same equation, but in expanded form, which shows all the variables on which Φ 28 is
dependent. The reader should note one correction in the expanded equation. The
coefficient, 77, on the far right side has been changed from its original value of 97, based
upon correspondence with Dr. John Gardner. This coefficient was found by Dr. Gardner
to be in error in the original publication.
⋅+−−−+
+−−
+
+−−Φ=Φ
5.0
20
02
5.0
0
0
5.0
03.0
0
3.00
0 )/(77)086.11(5.2
7
7
14)(
)(2)(),(
svtt
tth
tt
tt
ttt
ttttt c
where,
h = relative humidity expressed as a decimal
t = age of concrete (days)
t0 = age at loading (days)
If t0 = tc, then Φ(tc) = 1,
When t0 > tc
5.05.0
20
0
)/(771)(
⋅+−−
−=Φsvtt
ttt
c
cc
where,
tc = age drying commenced (days)
The previously mentioned Φ(tc) is used in this method to take drying before loading into
account, and it serves to reduce both the basic creep and drying creep values (Gardner
and Lockman 2001). Agian, the reader should note one correction. Like the Φ(t,t0)
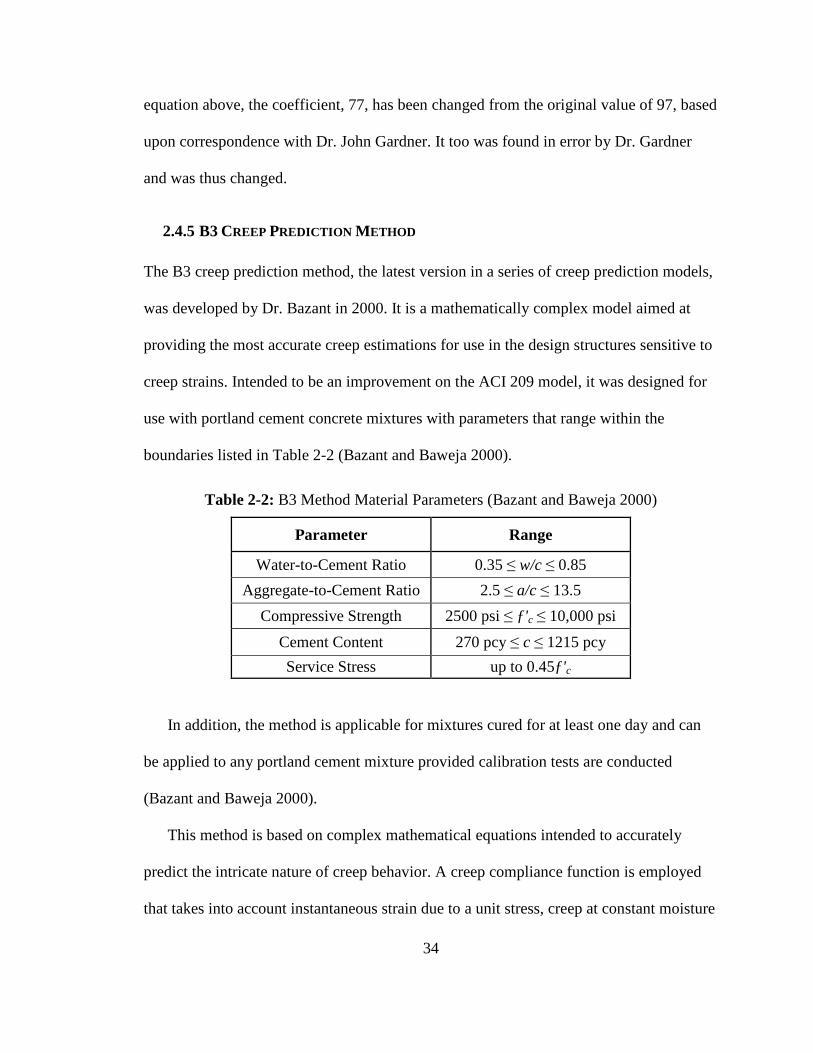
34
equation above, the coefficient, 77, has been changed from the original value of 97, based
upon correspondence with Dr. John Gardner. It too was found in error by Dr. Gardner
and was thus changed.
2.4.5 B3 CREEP PREDICTION METHOD
The B3 creep prediction method, the latest version in a series of creep prediction models,
was developed by Dr. Bazant in 2000. It is a mathematically complex model aimed at
providing the most accurate creep estimations for use in the design structures sensitive to
creep strains. Intended to be an improvement on the ACI 209 model, it was designed for
use with portland cement concrete mixtures with parameters that range within the
boundaries listed in Table 2-2 (Bazant and Baweja 2000).
Table 2-2: B3 Method Material Parameters (Bazant and Baweja 2000)
Parameter Range
Water-to-Cement Ratio 0.35 ≤ w/c ≤ 0.85
Aggregate-to-Cement Ratio 2.5 ≤ a/c ≤ 13.5
Compressive Strength 2500 psi ≤ ƒ'c ≤ 10,000 psi
Cement Content 270 pcy ≤ c ≤ 1215 pcy
Service Stress up to 0.45ƒ'c
In addition, the method is applicable for mixtures cured for at least one day and can
be applied to any portland cement mixture provided calibration tests are conducted
(Bazant and Baweja 2000).
This method is based on complex mathematical equations intended to accurately
predict the intricate nature of creep behavior. A creep compliance function is employed
that takes into account instantaneous strain due to a unit stress, creep at constant moisture

35
content with no moisture migration throughout the specimen, and creep due to drying
(Bazant and Baweja 2000). The following equation shows the compliance function which
brings the various components together to describe creep behavior:
),',()',()',( 001 tttCttCqttJ d++= (1x10⁻⁶ psi)
where,
1q = instantaneous strain due to unit stress (1x10⁻⁶/psi)
)',(0 ttC = compliance function describing basic creep (1x10⁻⁶/psi)
),',( 0tttCd = compliance function describing simultaneous drying
(1x10⁻⁶/psi)
t = time step of interest (days)
t’ = loading age (days)
t0 = age when drying commenced (days)
The basic creep component of the creep compliance equation is a time-rate function
that can be tailored according to mixture-specific properties. The equation below details
this computation:
[ ]
+−++='
ln)'(1ln)',()',( 4320 t
tqttqttQqttC n (1x10⁻⁶/psi)
where,
2q 9.0'1.451 −= cfc (1x10⁻⁶/psi)
)',( ttQ = coefficient given in Table 2-3 (unitless)
3q 24)/(29.0 qcw= (1x10⁻⁶/psi)
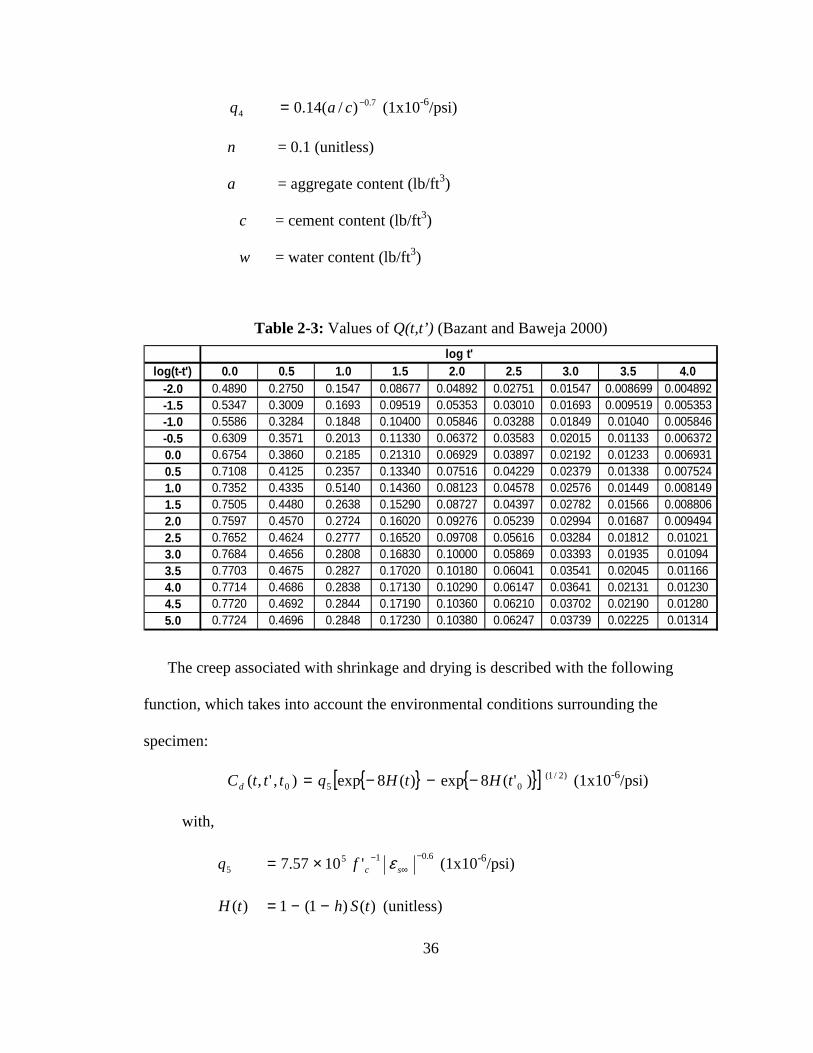
36
4q 7.0)/(14.0 −= ca (1x10⁻⁶/psi)
n = 0.1 (unitless)
a = aggregate content (lb/ft3)
c = cement content (lb/ft3)
w = water content (lb/ft3)
Table 2-3: Values of Q(t,t’) (Bazant and Baweja 2000)
log(t-t') 0.0 0.5 1.0 1.5 2.0 2.5 3.0 3.5 4.0-2.0 0.4890 0.2750 0.1547 0.08677 0.04892 0.02751 0.01547 0.008699 0.004892-1.5 0.5347 0.3009 0.1693 0.09519 0.05353 0.03010 0.01693 0.009519 0.005353-1.0 0.5586 0.3284 0.1848 0.10400 0.05846 0.03288 0.01849 0.01040 0.005846-0.5 0.6309 0.3571 0.2013 0.11330 0.06372 0.03583 0.02015 0.01133 0.0063720.0 0.6754 0.3860 0.2185 0.21310 0.06929 0.03897 0.02192 0.01233 0.0069310.5 0.7108 0.4125 0.2357 0.13340 0.07516 0.04229 0.02379 0.01338 0.0075241.0 0.7352 0.4335 0.5140 0.14360 0.08123 0.04578 0.02576 0.01449 0.0081491.5 0.7505 0.4480 0.2638 0.15290 0.08727 0.04397 0.02782 0.01566 0.0088062.0 0.7597 0.4570 0.2724 0.16020 0.09276 0.05239 0.02994 0.01687 0.0094942.5 0.7652 0.4624 0.2777 0.16520 0.09708 0.05616 0.03284 0.01812 0.010213.0 0.7684 0.4656 0.2808 0.16830 0.10000 0.05869 0.03393 0.01935 0.010943.5 0.7703 0.4675 0.2827 0.17020 0.10180 0.06041 0.03541 0.02045 0.011664.0 0.7714 0.4686 0.2838 0.17130 0.10290 0.06147 0.03641 0.02131 0.012304.5 0.7720 0.4692 0.2844 0.17190 0.10360 0.06210 0.03702 0.02190 0.012805.0 0.7724 0.4696 0.2848 0.17230 0.10380 0.06247 0.03739 0.02225 0.01314
log t'
The creep associated with shrinkage and drying is described with the following
function, which takes into account the environmental conditions surrounding the
specimen:
{ } { }[ ] )2/1(050 )'(8exp)(8exp),',( tHtHqtttCd −−−= (1x10⁻⁶/psi)
with,
6.0155 '1057.7
−∞
−×= scfq ε (1x10⁻⁶/psi)
)()1(1)( tShtH −−= (unitless)
37
0)',',(otherwise,'),'max(' 0000 =≥= tttCttifttt d ; 0't is the time at
which drying and loading first act simultaneously (days)
where,
[ ] )in./in.10x1(270'26 628.01.221
−−∞ +−= cs fωααε
=h relative humidity (unitless)
sh
tttS
τ0tanh)(
−= (unitless)
2)( Dkk stsh =τ (days)
cement III Typefor 1.1
cement II Typefor 0.85
cement I Typefor 1.0
1α (unitless)
humidity 100%at or in water curingfor 1.0
airin curing normalor sealedfor 1.2
cured-steamfor 0.75
2α (unitless)
=ω water content (lb/ft3)
)/('8.190 24/108.00 indaysftk ct
−−=
cube afor 1.55
sphere afor 1.30
prism square infinitean for 1.25
cylinder infinitean for 1.15
slab infinitean for00.1
sk (unitless)
=D 2V/S (in)
)(in area surfacespecimen
)(in olumespecimen v 2
3
==
S
V
38
Once the compliance is calculated, it is possible to determine the associated creep
strain by multiplying the compliance value by the stress resulting from loading and
subtracting out the initial elastic strain.
)'()]'()',([ )',( ttttJttcreeppredicted εσ −×= (in./in.)
where,
psi)(loadin from resulting stress )'( gt =σ
(in./in.)strain elastic initial )'( =tε
2.5 PREVIOUS FINDINGS RELATED TO CREEP OF SCC
Limited studies have been conducted in recent years to investigate the behavior creep of
SCC compared to that of conventional-slump concrete. This section is dedicated to
outlining three of these studies, including their experimental procedures and results. A
summary is located at the end of this section to serve as an overview of these results.
2.5.1 DESCRIPTION OF PREVIOUS STUDIES
Recent studies in which creep of SCC has been investigated include those conducted by
Raghavan et al. (2003) in India, Seng and Shima (2005) at Kochi University of
Technology in Japan, and Collepardi et al. (2005) at Enco in Ponzano Veneto, Italy. The
details of each study will be described in this section, along with the results and
conclusions presented by each.
2.5.1.1 Creep Evaluation by Raghavan et al. (2003)
The study conducted by Raghavan et al. (2003) in India involved a comparison of the
mechanical properties of an SCC mixture with those of a conventional concrete mixture.
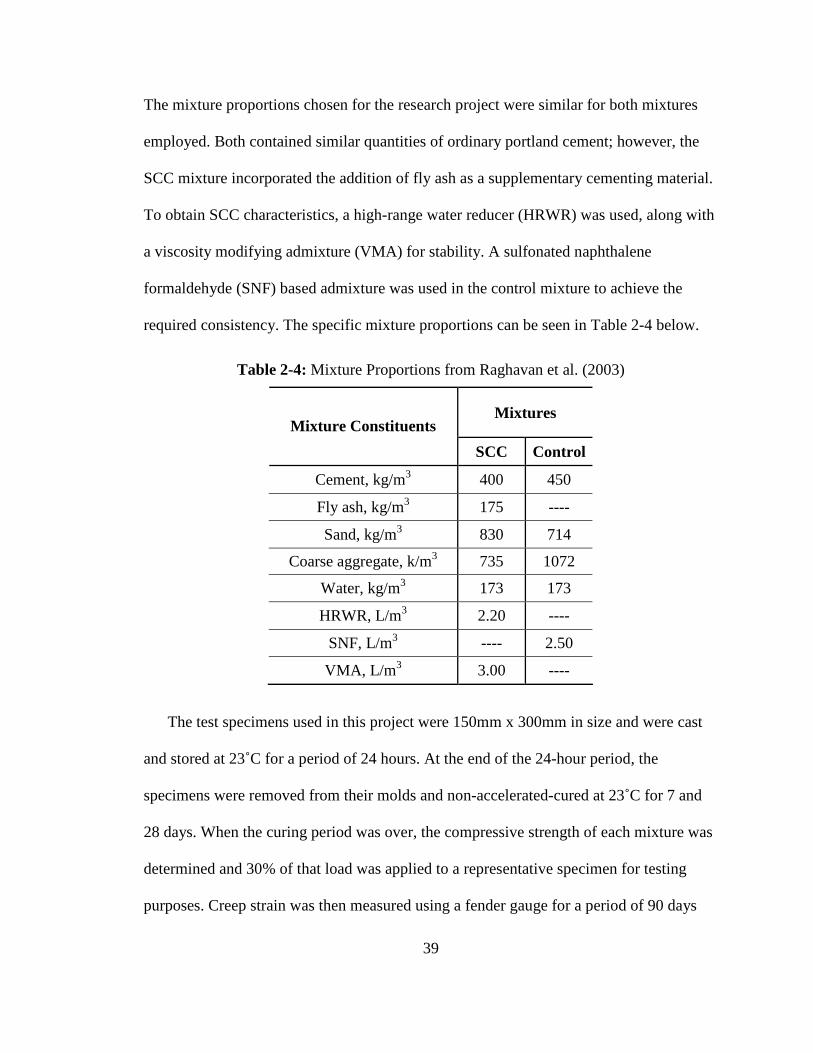
39
The mixture proportions chosen for the research project were similar for both mixtures
employed. Both contained similar quantities of ordinary portland cement; however, the
SCC mixture incorporated the addition of fly ash as a supplementary cementing material.
To obtain SCC characteristics, a high-range water reducer (HRWR) was used, along with
a viscosity modifying admixture (VMA) for stability. A sulfonated naphthalene
formaldehyde (SNF) based admixture was used in the control mixture to achieve the
required consistency. The specific mixture proportions can be seen in Table 2-4 below.
Table 2-4: Mixture Proportions from Raghavan et al. (2003)
Mixtures Mixture Constituents
SCC Control
Cement, kg/m3 400 450
Fly ash, kg/m3 175 ----
Sand, kg/m3 830 714
Coarse aggregate, k/m3 735 1072
Water, kg/m3 173 173
HRWR, L/m3 2.20 ----
SNF, L/m3 ---- 2.50
VMA, L/m 3 3.00 ----
The test specimens used in this project were 150mm x 300mm in size and were cast
and stored at 23˚C for a period of 24 hours. At the end of the 24-hour period, the
specimens were removed from their molds and non-accelerated-cured at 23˚C for 7 and
28 days. When the curing period was over, the compressive strength of each mixture was
determined and 30% of that load was applied to a representative specimen for testing
purposes. Creep strain was then measured using a fender gauge for a period of 90 days
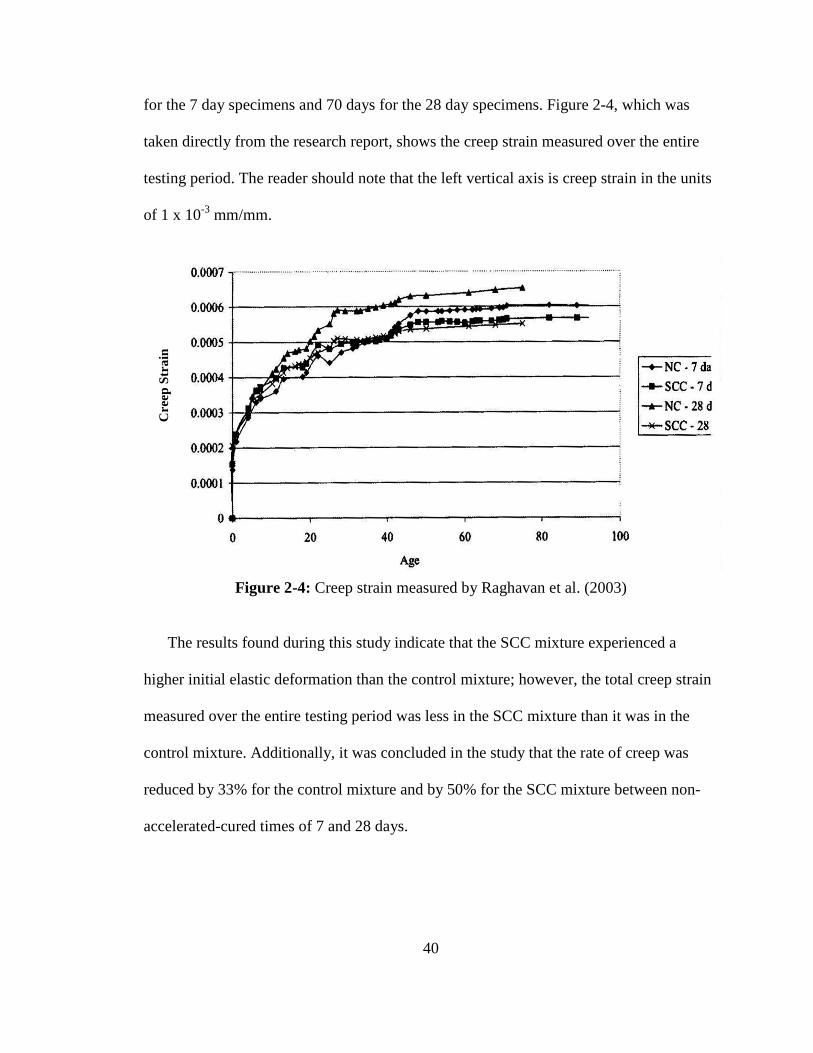
40
for the 7 day specimens and 70 days for the 28 day specimens. Figure 2-4, which was
taken directly from the research report, shows the creep strain measured over the entire
testing period. The reader should note that the left vertical axis is creep strain in the units
of 1 x 10⁻³ mm/mm.
Figure 2-4: Creep strain measured by Raghavan et al. (2003)
The results found during this study indicate that the SCC mixture experienced a
higher initial elastic deformation than the control mixture; however, the total creep strain
measured over the entire testing period was less in the SCC mixture than it was in the
control mixture. Additionally, it was concluded in the study that the rate of creep was
reduced by 33% for the control mixture and by 50% for the SCC mixture between non-
accelerated-cured times of 7 and 28 days.
Cre
ep S
trai
n

41
2.5.1.2 Study Conducted by Seng and Shima (2005)
Seng and Shima (2005) at Kochi University in Japan investigated the creep behavior of
SCC compared to that of conventional concrete. To do this, three SCC mixtures were
evaluated against a control mixture, which was designed to perform in a conventional
manner. Each SCC mixture had varying amounts of constituent materials including
ordinary portland cement, crushed stone, sand, and limestone filler. The mixture design
process began by creating a conventional mixture having a compressive strength of 55
MPa. The three SCC mixtures were designed by increasing the powder content while
using different limestone filler contents, which was done to reduce the coarse aggregate
content. SCC characteristics were achieved in the SCC mixtures by using a
superplasticizer. The mixture proportions for each of the four mixtures are listed in Table
2-5.
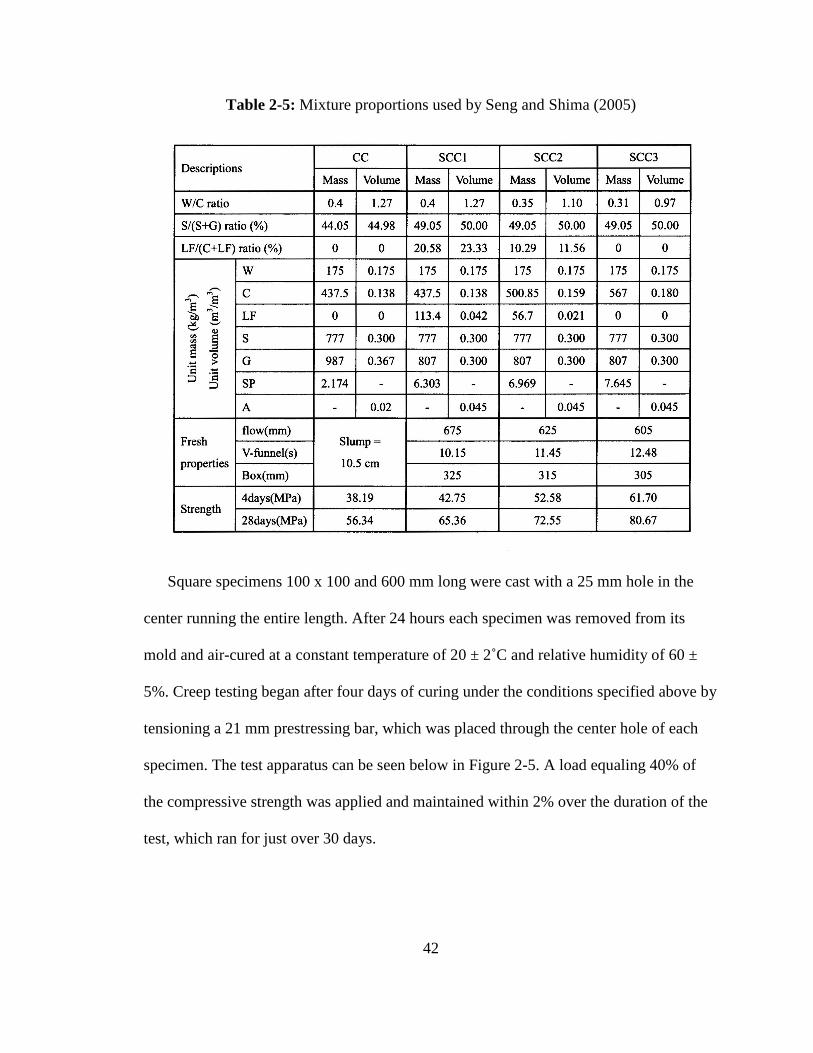
42
Table 2-5: Mixture proportions used by Seng and Shima (2005)
Square specimens 100 x 100 and 600 mm long were cast with a 25 mm hole in the
center running the entire length. After 24 hours each specimen was removed from its
mold and air-cured at a constant temperature of 20 ± 2˚C and relative humidity of 60 ±
5%. Creep testing began after four days of curing under the conditions specified above by
tensioning a 21 mm prestressing bar, which was placed through the center hole of each
specimen. The test apparatus can be seen below in Figure 2-5. A load equaling 40% of
the compressive strength was applied and maintained within 2% over the duration of the
test, which ran for just over 30 days.
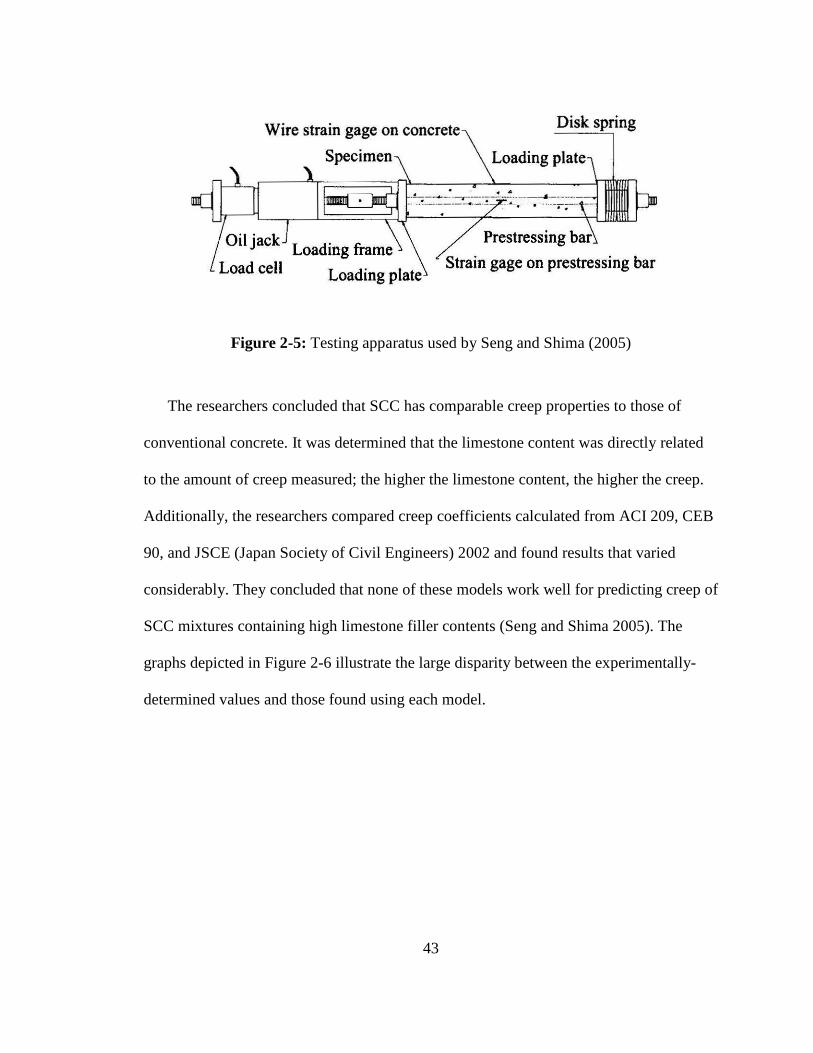
43
Figure 2-5: Testing apparatus used by Seng and Shima (2005)
The researchers concluded that SCC has comparable creep properties to those of
conventional concrete. It was determined that the limestone content was directly related
to the amount of creep measured; the higher the limestone content, the higher the creep.
Additionally, the researchers compared creep coefficients calculated from ACI 209, CEB
90, and JSCE (Japan Society of Civil Engineers) 2002 and found results that varied
considerably. They concluded that none of these models work well for predicting creep of
SCC mixtures containing high limestone filler contents (Seng and Shima 2005). The
graphs depicted in Figure 2-6 illustrate the large disparity between the experimentally-
determined values and those found using each model.
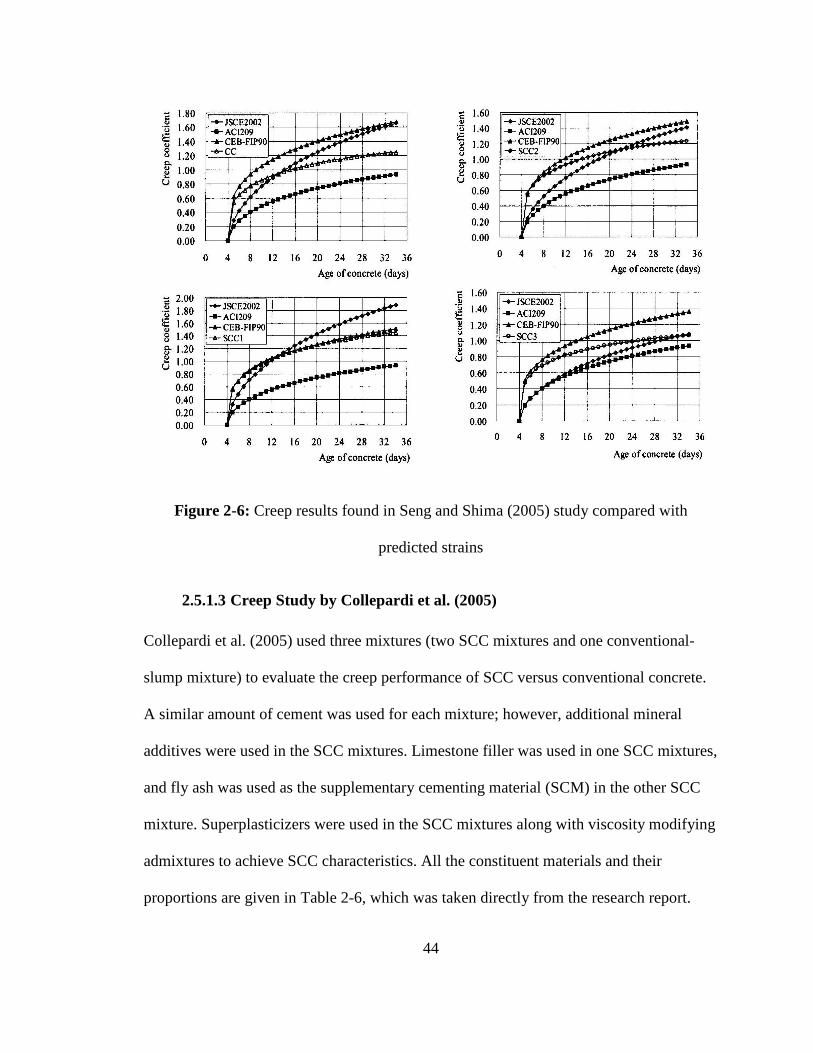
44
Figure 2-6: Creep results found in Seng and Shima (2005) study compared with
predicted strains
2.5.1.3 Creep Study by Collepardi et al. (2005)
Collepardi et al. (2005) used three mixtures (two SCC mixtures and one conventional-
slump mixture) to evaluate the creep performance of SCC versus conventional concrete.
A similar amount of cement was used for each mixture; however, additional mineral
additives were used in the SCC mixtures. Limestone filler was used in one SCC mixtures,
and fly ash was used as the supplementary cementing material (SCM) in the other SCC
mixture. Superplasticizers were used in the SCC mixtures along with viscosity modifying
admixtures to achieve SCC characteristics. All the constituent materials and their
proportions are given in Table 2-6, which was taken directly from the research report.
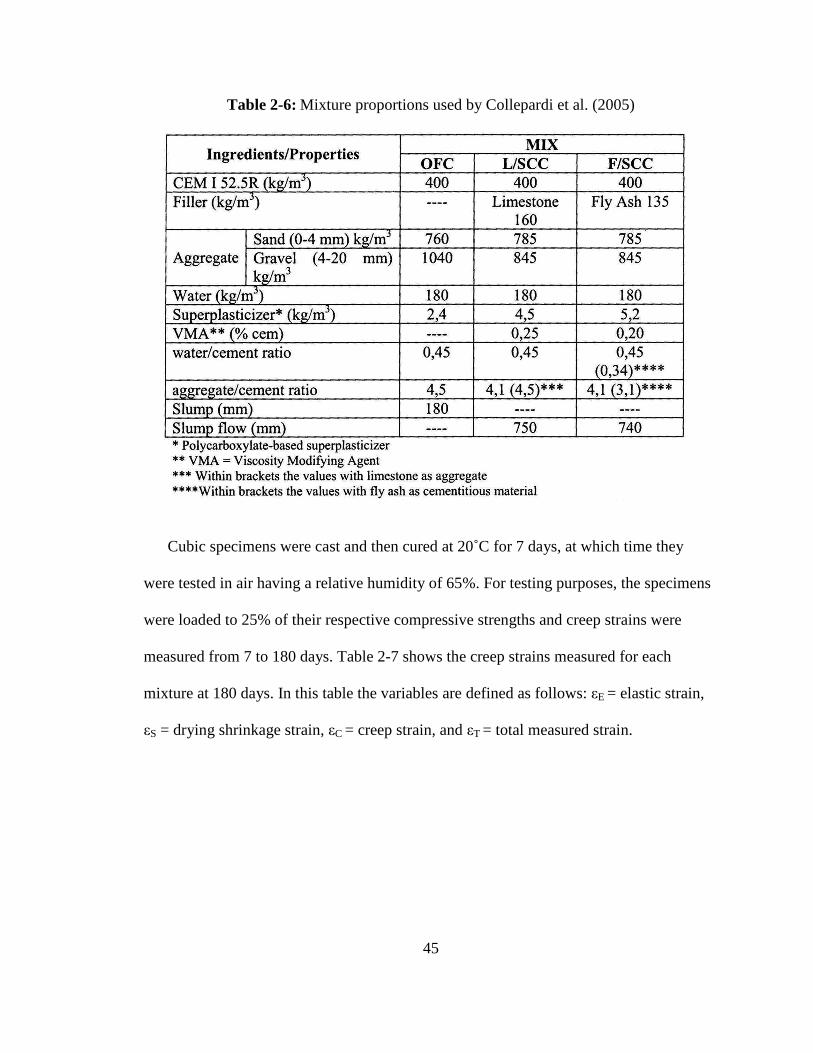
45
Table 2-6: Mixture proportions used by Collepardi et al. (2005)
Cubic specimens were cast and then cured at 20˚C for 7 days, at which time they
were tested in air having a relative humidity of 65%. For testing purposes, the specimens
were loaded to 25% of their respective compressive strengths and creep strains were
measured from 7 to 180 days. Table 2-7 shows the creep strains measured for each
mixture at 180 days. In this table the variables are defined as follows: εE = elastic strain,
εS = drying shrinkage strain, εC = creep strain, and εT = total measured strain.
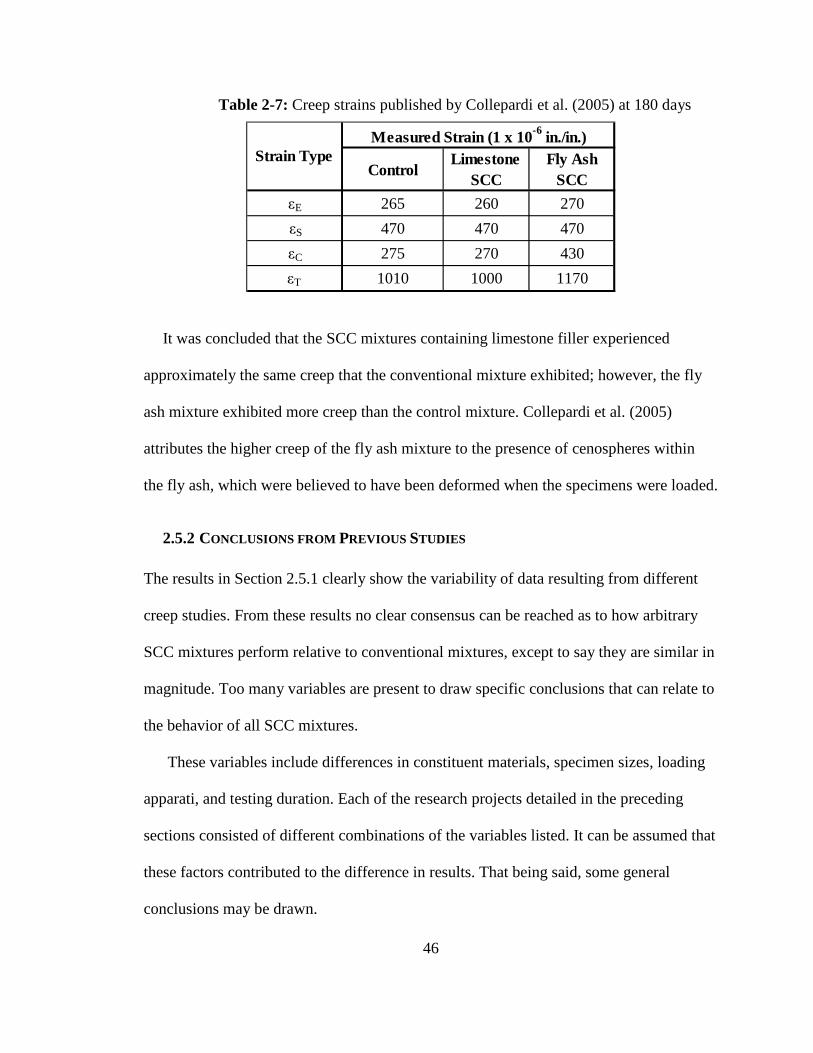
46
Table 2-7: Creep strains published by Collepardi et al. (2005) at 180 days
ControlLimestone
SCCFly Ash
SCC
εE 265 260 270
εS 470 470 470
εC 275 270 430
εT 1010 1000 1170
Measured Strain (1 x 10⁻⁶ in./in.)Strain Type
It was concluded that the SCC mixtures containing limestone filler experienced
approximately the same creep that the conventional mixture exhibited; however, the fly
ash mixture exhibited more creep than the control mixture. Collepardi et al. (2005)
attributes the higher creep of the fly ash mixture to the presence of cenospheres within
the fly ash, which were believed to have been deformed when the specimens were loaded.
2.5.2 CONCLUSIONS FROM PREVIOUS STUDIES
The results in Section 2.5.1 clearly show the variability of data resulting from different
creep studies. From these results no clear consensus can be reached as to how arbitrary
SCC mixtures perform relative to conventional mixtures, except to say they are similar in
magnitude. Too many variables are present to draw specific conclusions that can relate to
the behavior of all SCC mixtures.
These variables include differences in constituent materials, specimen sizes, loading
apparati, and testing duration. Each of the research projects detailed in the preceding
sections consisted of different combinations of the variables listed. It can be assumed that
these factors contributed to the difference in results. That being said, some general
conclusions may be drawn.

47
For instance, each group of researchers reported similarities in magnitude with respect
to creep in conventional concrete and that found in SCC. It can therefore be concluded
that SCC performs similarly to conventional concrete while providing improvements in
labor costs and durability. Only further testing under uniform conditions will yield data
that can be compared to form universal conclusions.
48
CHAPTER 3
EXPERIMENTAL PLAN
3.1 INTRODUCTION
One of the primary objectives of this study was to gain increased knowledge of SCC by
studying its creep characteristics in comparison to that of conventional-slump concrete.
As stated in Section 1.2, this was accomplished by selecting five concrete mixtures from
a list of 21, which were created in an earlier phase of this research effort. This chapter
details the procedures used to achieve all of the objectives of this study, including the one
listed above. Here the reader will find information regarding the experimental program,
mixture proportions, test setup, and raw materials.
3.2 EXPERIMENTAL PROGRAM
The experimental program used during this study was comprised of two main phases. The
first was the specimen preparation phase, which involved all mixing, casting, and curing
procedures. The second was the creep testing phase, during which all creep data were
collected. As the first phase was completed for a mixture, phase two began. These phases
are illustrated in Figure 3-1.
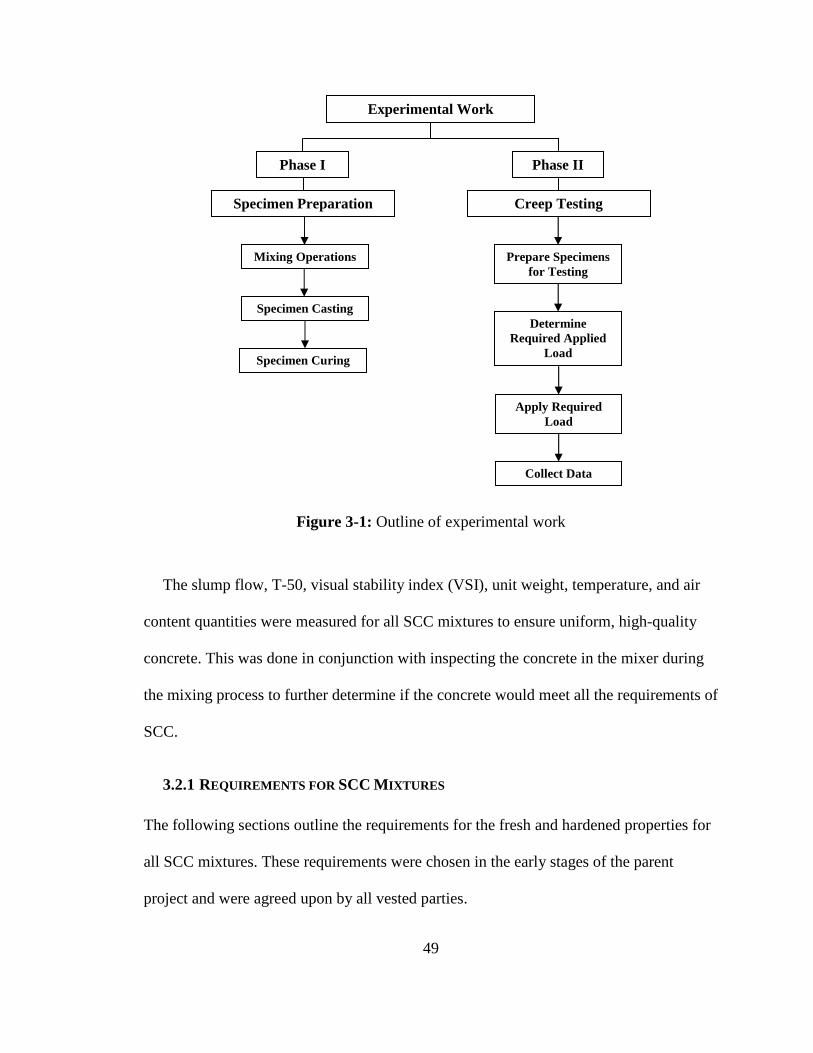
49
Figure 3-1: Outline of experimental work
The slump flow, T-50, visual stability index (VSI), unit weight, temperature, and air
content quantities were measured for all SCC mixtures to ensure uniform, high-quality
concrete. This was done in conjunction with inspecting the concrete in the mixer during
the mixing process to further determine if the concrete would meet all the requirements of
SCC.
3.2.1 REQUIREMENTS FOR SCC M IXTURES
The following sections outline the requirements for the fresh and hardened properties for
all SCC mixtures. These requirements were chosen in the early stages of the parent
project and were agreed upon by all vested parties.
Experimental Work
Phase I Phase II
Specimen Preparation Creep Testing
Mixing Operations
Specimen Casting
Specimen Curing
Prepare Specimens for Testing
Determine Required Applied
Load
Apply Required Load
Collect Data
50
3.2.1.1 Fresh Properties
The slump flow range for this study was specified to be 27 in. ± 3 in. to allow good
filling ability and to take into account variations in materials and weather conditions. The
VSI value exhibited by each mixture was required to be below 2.0. At this VSI rating,
concrete begins to show signs of segregation as a noticeable layer of mortar is present on
the surface of the concrete while in the mixer, and a mortar halo is present around the
patty. Additionally, the air content range was chosen to be below 6%. If a mixture did not
meet all the specified requirements, it was discarded and remixed. The T-50, temperature,
and unit weight measurements were recorded but had no bearing on the approval of each
mix.
3.2.1.2 Hardened Properties
The compressive strength at release (ƒ’ci) for all SCC mixtures was specified to be
between 5,000 and 9,000 psi (34 to 62 MPa) because the average ƒ’ci value used by the
prestressing industry in Alabama is 6,500 psi (45 MPa). A strength in this range was
required of all specimens that were cured using elevated temperatures over a duration of
18 hours.
3.2.2 SPECIMEN TYPES AND AGES AT LOADING
In order to gain a more thorough understanding of the nature of the creep behavior
exhibited by each mixture, five different levels of maturity, termed “loading ages”, were
investigated. These loading ages included: 18 hours, 2 days, 7 days, 28 days, and 90 days.
While more information about these loading ages and the characteristics that differentiate
them is provided in Section 3.4.4, it should be noted that the 18-hour specimens were put

51
through an accelerated curing process. The specimens for the other loading ages were
simply non-accelerated-cured.
As explained in Section 2.3, multiple mechanisms are responsible for volumetric
changes in concrete specimens. However, for the purposes of this research effort, three
main components were considered to be the key factors: drying shrinkage, autogeneous
shrinkage, and creep.
Accurately measuring the creep exhibited by each mixture required that all of these
mechanisms be tracked and recorded. To do this, both a creep and a shrinkage specimen
were utilized for each mixture at each loading age, and both were cast in the form of 6 in.
x 12 in. cylinders. The creep specimens were placed in the creep frame and loaded at a
constant stress. They deformed due to elastic response, creep, drying shrinkage, and the
effects of autogeneous shrinkage. In contrast, the shrinkage specimen had no externally
applied load and deformed only due to drying and autogeneous shrinkage. Table 3-1
illustrates the number and type of specimens that were mixed for every loading age of
every mixture. Two additional things should be noted about this table. The first pertains
to the organization of the table, in which the appropriate curing method is noted for each
loading age. Secondly, a Strength specimen was a specimen used to determine the
ultimate strength of the test specimens immediately prior to load application.
52
Table 3-1: Specimen type and quantity for each mixture
Specimen Type
Cur
ing
Met
hod
Loading Age Creep
Specimen Shrinkage Specimen
Strength Specimen
Acc
eler
ated
18-hr 2 3 2
2-day 2 3 2
7-day 2 3 2
28-day 2 * 2
Non
-acc
eler
ated
90-day 2 * 2
Column Totals 10 9 10
Specimen Total 29
Note: * Indicates that shrinkage specimens are shared with the 7-day
shrinkage specimens
In addition to test specimens, ASTM C 512 requires plugs to be used above and below
the creep testing specimens while they are in the creep frames. This helps to ensure an
even stress distribution across the actual creep testing specimen. For this study, 25 - 6 in.
x 12 in. concrete cylinders (one cylinder for each frame) were cut in half and capped
similarly to the test specimens. They were cast using the high-strength slag mixture
which was tested during this study and allowed to cure for at least 28 days before being
put into service. The choice of the high-strength slag mixture was made because when
properly cured, the plugs would have an ultimate strength that exceeded any test
specimen.
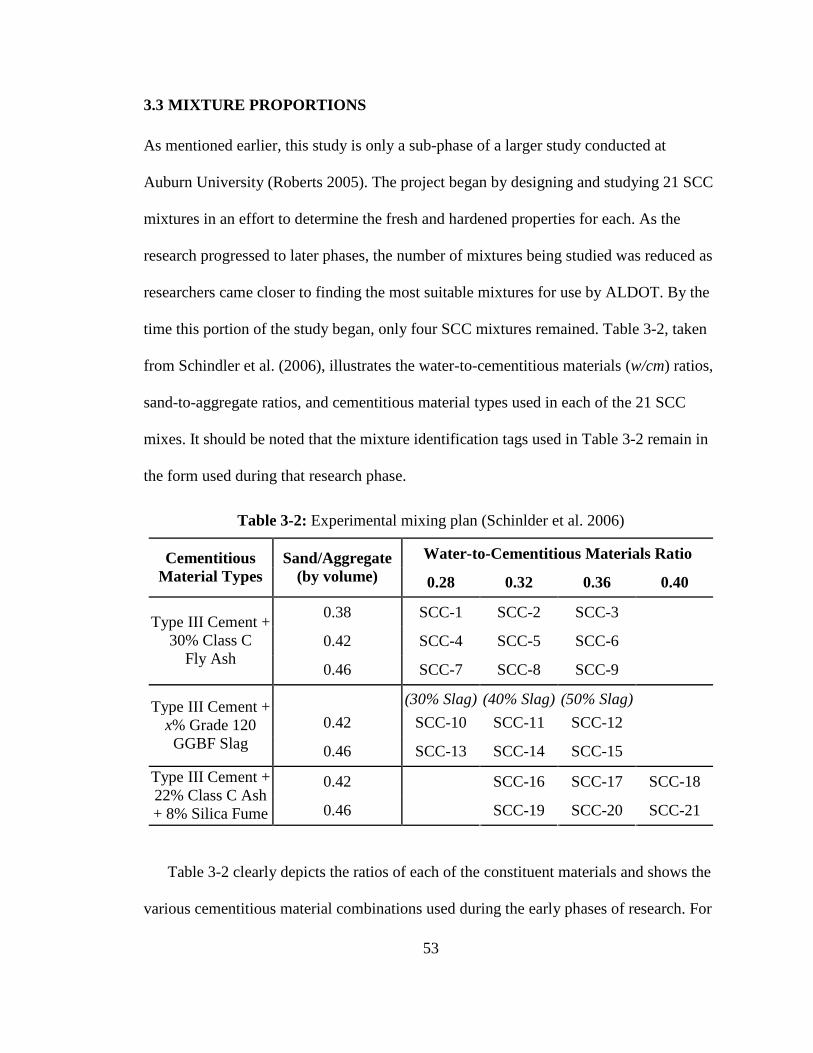
53
3.3 MIXTURE PROPORTIONS
As mentioned earlier, this study is only a sub-phase of a larger study conducted at
Auburn University (Roberts 2005). The project began by designing and studying 21 SCC
mixtures in an effort to determine the fresh and hardened properties for each. As the
research progressed to later phases, the number of mixtures being studied was reduced as
researchers came closer to finding the most suitable mixtures for use by ALDOT. By the
time this portion of the study began, only four SCC mixtures remained. Table 3-2, taken
from Schindler et al. (2006), illustrates the water-to-cementitious materials (w/cm) ratios,
sand-to-aggregate ratios, and cementitious material types used in each of the 21 SCC
mixes. It should be noted that the mixture identification tags used in Table 3-2 remain in
the form used during that research phase.
Table 3-2: Experimental mixing plan (Schinlder et al. 2006)
Water-to-Cementitious Materials Ratio Cementitious Material Types
Sand/Aggregate (by volume) 0.28 0.32 0.36 0.40
0.38 SCC-1 SCC-2 SCC-3
0.42 SCC-4 SCC-5 SCC-6 Type III Cement +
30% Class C Fly Ash
0.46 SCC-7 SCC-8 SCC-9
(30% Slag) (40% Slag) (50% Slag)
0.42 SCC-10 SCC-11 SCC-12 Type III Cement +
x% Grade 120 GGBF Slag 0.46 SCC-13 SCC-14 SCC-15
0.42 SCC-16 SCC-17 SCC-18 Type III Cement + 22% Class C Ash + 8% Silica Fume 0.46 SCC-19 SCC-20 SCC-21
Table 3-2 clearly depicts the ratios of each of the constituent materials and shows the
various cementitious material combinations used during the early phases of research. For
54
the current phase of the study, mixtures SCC-7, SCC-9, SCC-13, and SCC-15 were used.
SCC-7 and SCC-9, which correspond to SCC-HS-FA and SCC-MS-FA respectively in
this thesis, consist of a 30% cement replacement of Class C fly ash and have a sand-to-
aggregate ratio of 0.46. However, both mixtures have differing w/cm of 0.28 and 0.36,
respectively. SCC-13 and SCC-15, corresponding to SCC-HS-SL and SCC-MS-SL
respectively, consist of differing percentages of a Grade 120 GGBF Slag cement
replacement. SCC-13 has a 30% cement replacement, while SCC-15 has a 50%
replacement. Both share the same sand-to-aggregate ratio of 0.46; however, like their fly
ash counterparts, each has its own w/cm, which are 0.28 and 0.36, respectively. In
addition to the four SCC mixtures, a conventional-slump mixture similar to one found in
use by the prestressing industry in the state of Alabama was used as the control for the
study.
It should be noted that the w/cm of the conventional-slump mixture is higher than the
w/cm for both the SCC-MS-SL and SCC-MS-FA mixtures. This was done to provide 18
hour release strengths for the SCC-MS-SL and SCC-MS-FA mixtures that were
equivalent in magnitude to that of the conventional-slump mixture.
The proportions for each mixture are listed in Table 3-3. The table includes the
proportioning of the water, cementitious materials, aggregates, and chemical admixtures.
A full description of each of the raw materials used is given in Section 3.5. One
additional note should be made about the mixture constituent materials and proportions.
Due to knowledge gained during preliminary mixing, the air-entraining admixture was
withheld from the constituent list for the final mixtures, in an effort to provide
uniformity, with regard to air content, across all batches of the same mixture.
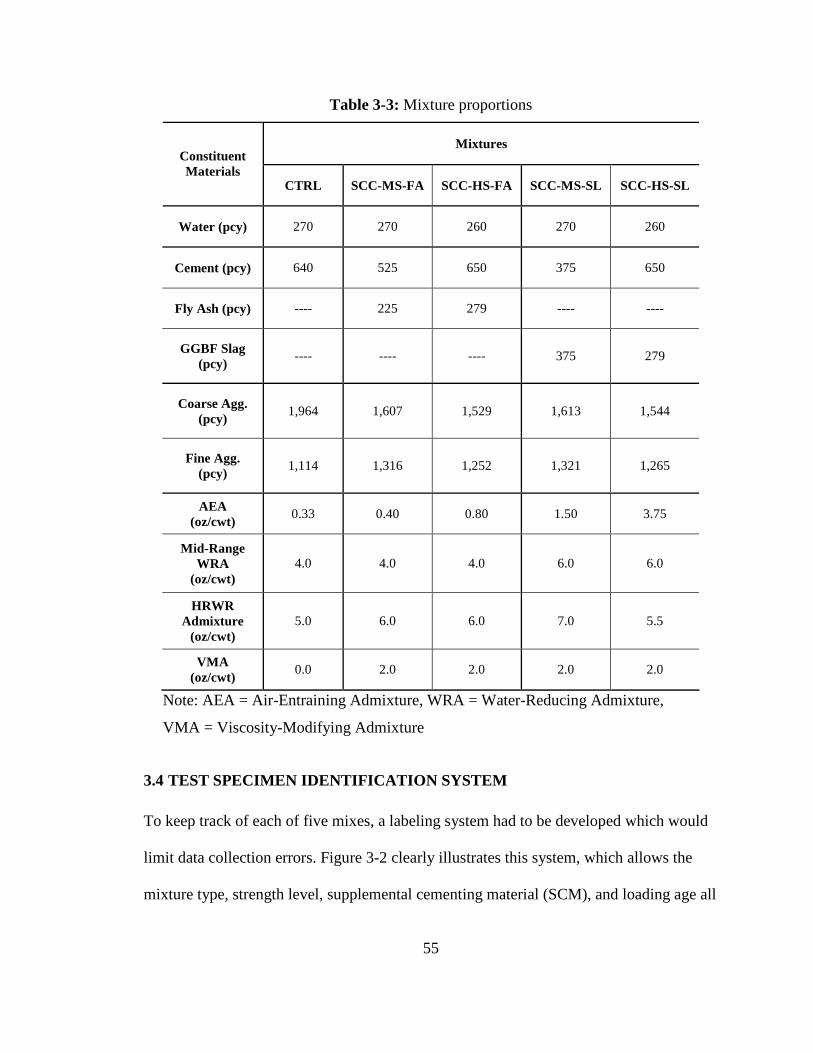
55
Table 3-3: Mixture proportions
Mixtures Constituent Materials
CTRL SCC-MS-FA SCC-HS-FA SCC-MS-SL SCC-HS-SL
Water (pcy) 270 270 260 270 260
Cement (pcy) 640 525 650 375 650
Fly Ash (pcy) ---- 225 279 ---- ----
GGBF Slag (pcy)
---- ---- ---- 375 279
Coarse Agg. (pcy)
1,964 1,607 1,529 1,613 1,544
Fine Agg. (pcy)
1,114 1,316 1,252 1,321 1,265
AEA (oz/cwt)
0.33 0.40 0.80 1.50 3.75
Mid-Range WRA
(oz/cwt) 4.0 4.0 4.0 6.0 6.0
HRWR Admixture
(oz/cwt) 5.0 6.0 6.0 7.0 5.5
VMA (oz/cwt)
0.0 2.0 2.0 2.0 2.0
Note: AEA = Air-Entraining Admixture, WRA = Water-Reducing Admixture,
VMA = Viscosity-Modifying Admixture
3.4 TEST SPECIMEN IDENTIFICATION SYSTEM
To keep track of each of five mixes, a labeling system had to be developed which would
limit data collection errors. Figure 3-2 clearly illustrates this system, which allows the
mixture type, strength level, supplemental cementing material (SCM), and loading age all
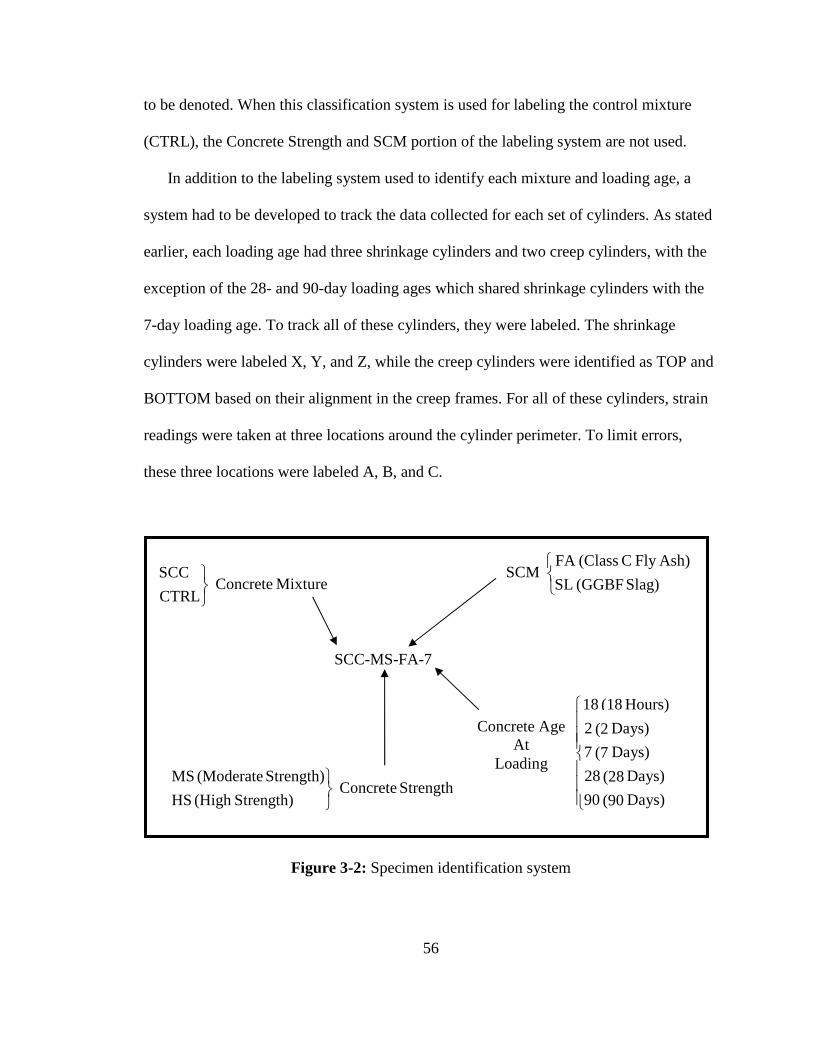
56
to be denoted. When this classification system is used for labeling the control mixture
(CTRL), the Concrete Strength and SCM portion of the labeling system are not used.
In addition to the labeling system used to identify each mixture and loading age, a
system had to be developed to track the data collected for each set of cylinders. As stated
earlier, each loading age had three shrinkage cylinders and two creep cylinders, with the
exception of the 28- and 90-day loading ages which shared shrinkage cylinders with the
7-day loading age. To track all of these cylinders, they were labeled. The shrinkage
cylinders were labeled X, Y, and Z, while the creep cylinders were identified as TOP and
BOTTOM based on their alignment in the creep frames. For all of these cylinders, strain
readings were taken at three locations around the cylinder perimeter. To limit errors,
these three locations were labeled A, B, and C.
Figure 3-2: Specimen identification system
SCC-MS-FA-7
Mixture Concrete CTRL
SCC
Strength Concrete Strength)(High HS
Strength) (Moderate MS
Days) (90 90
Days) (28
Slag) (GGBF SL
Ash)Fly C (ClassFA SCM
28
Days) (7 7
Days) (2 2
Hours) (18 18
Concrete Age At
Loading

57
3.5 TEST METHODS
This section outlines the test procedures used to conduct this research project. The
information found here includes a description of the batching, mixing, curing, and testing
procedures.
3.5.1 BATCHING
In preparation for mixing, all the necessary raw materials for each mixture were gathered
in the proper quantities. This section details those actions.
3.5.1.1 Collection of Materials
Both the fine and coarse aggregates used in each mixture were stockpiled at Twin City
Concrete, a ready-mix plant located in Auburn, AL. As these materials were needed, they
were gathered in manageable quantities and brought to Auburn University’s Structural
Research Laboratory and stored in 55-gallon drums, where they remained sealed until
needed.
Prior to final batching, all materials were initially batched into five-gallon buckets and
were sealed to prevent moisture loss. They remained there until moisture corrections
were performed and the correct batch weights were finalized.
3.5.1.2 Moisture Corrections
Immediately prior to mixing, moisture corrections were performed on the coarse and fine
aggregates for each mixture. To do this, all of the five-gallon buckets containing coarse
aggregate were mixed together to aid in achieving a more homogeneous moisture
distribution. This process was repeated with the fine aggregate. After homogenizing each
58
aggregate, pans were weighed to determine the mass of each pan. This value was
subtracted out later to accurately determine the mass of the moisture each constituent lost.
With the aggregates homogenized and the pan masses determined, samples were taken
from each material and weighed to determine the initial mass of each. Having recorded
each mass, the pans containing each sample were placed on a hot plate and dried. As the
drying progressed, masses were periodically checked until no appreciable decrease was
noticed; the mass at this time was then taken to be the dry mass of each aggregate. These
values were used to determine the final batch weights of the water, as well as of the fine
and coarse aggregate.
3.5.2 M IXING PROCEDURES
After batching the required raw materials, mixing was begun. Several procedures were
followed to accomplish the task and to ensure a consistent end product.
3.5.2.1 Buttering the Mixer
Before the raw materials were placed into the mixer, a buttering mixture was placed into
the drum to coat the inside to help prevent clumping of component materials around the
mixer’s paddles. Each buttering mixture was comprised of two pounds of Type III
portland cement and two pounds of fine aggregate. The mixer was then turned on and
water was added until the mixture became fluid. The mixer continued to run until every
surface inside was coated properly. With this procedure complete, the excess buttering
mixture was discarded and the mixing process continued. The 12 ft3 mixer used in this
research project is pictured in Figure 3-3 below.
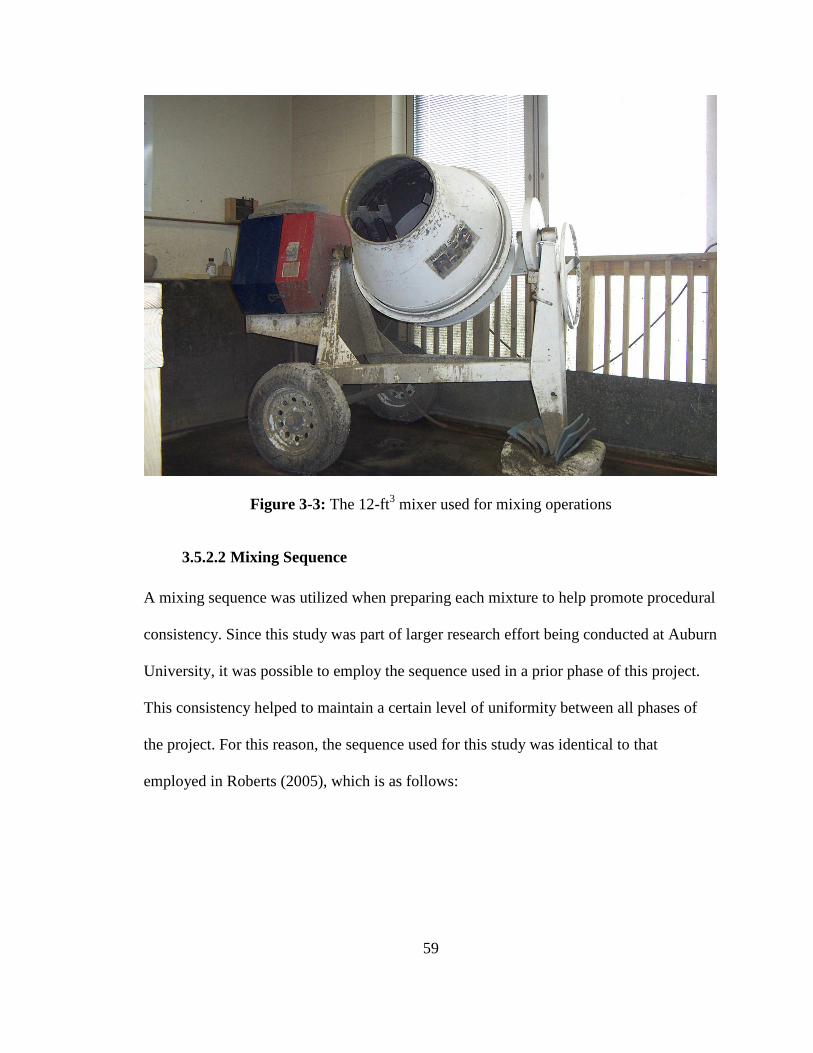
59
Figure 3-3: The 12-ft3 mixer used for mixing operations
3.5.2.2 Mixing Sequence
A mixing sequence was utilized when preparing each mixture to help promote procedural
consistency. Since this study was part of larger research effort being conducted at Auburn
University, it was possible to employ the sequence used in a prior phase of this project.
This consistency helped to maintain a certain level of uniformity between all phases of
the project. For this reason, the sequence used for this study was identical to that
employed in Roberts (2005), which is as follows:

60
1. Add 80% of mixing water.
2. Add all the coarse and fine aggregates by alternating the five-gallon
buckets containing each material.
3. Mix for one minute.
4. While mixing, add any air-entraining admixtures to the aggregates.
5. Stop mixing.
6. Add all powdered materials.
7. Add all remaining mixing water.
8. Cover the opening of the mixer.
9. Mix concrete for five minutes.
10. While mixing, add VMA if necessary.
11. While mixing, add water reducing admixtures if necessary.
12. Stop mixing and allow to rest for three minutes.
13. Run mixer for three minutes.
14. Stop mixer. Test the slump flow, VSI, and T-50. If the slump flow is
too low, add more HRWR admixture. Run the mixer for one minute
and test again. Continue the process until target slump flow is reached.
15. Once the desired slump flow has been achieved, perform the
remaining fresh concrete QC tests: air, temperature, and unit weight.
16. Return all unused concrete to mixer and mix for one minute.
17. Make all specimens for testing hardened properties.
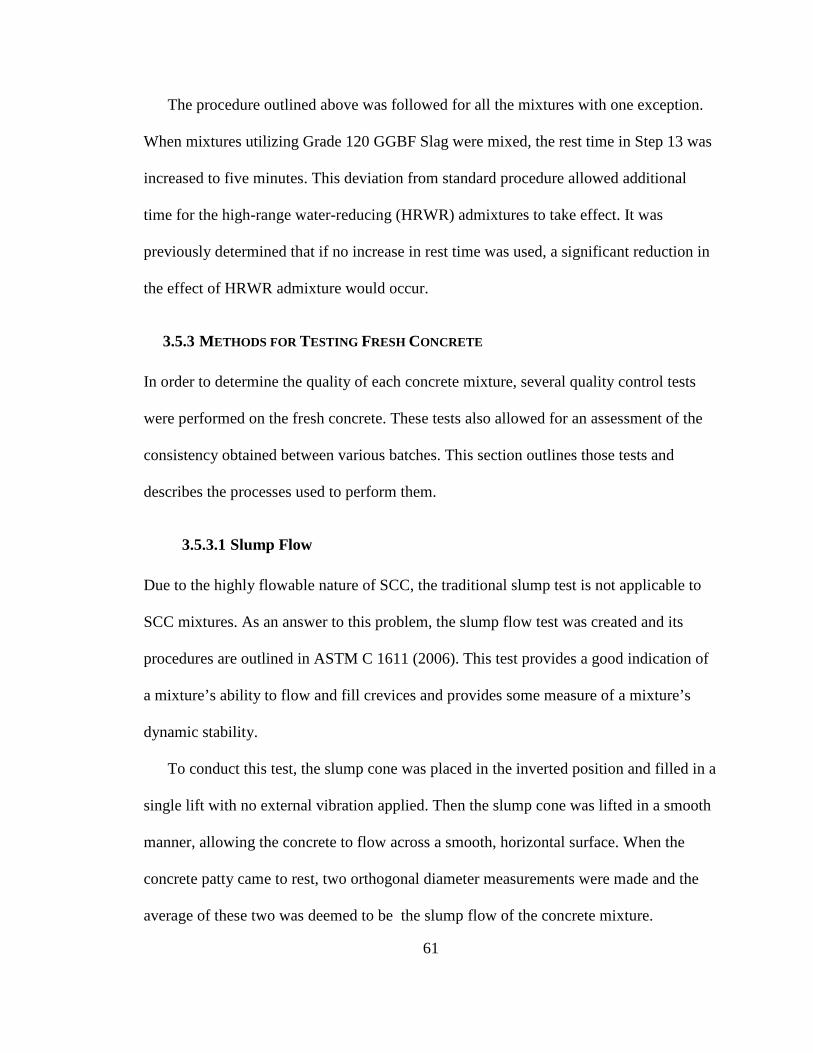
61
The procedure outlined above was followed for all the mixtures with one exception.
When mixtures utilizing Grade 120 GGBF Slag were mixed, the rest time in Step 13 was
increased to five minutes. This deviation from standard procedure allowed additional
time for the high-range water-reducing (HRWR) admixtures to take effect. It was
previously determined that if no increase in rest time was used, a significant reduction in
the effect of HRWR admixture would occur.
3.5.3 METHODS FOR TESTING FRESH CONCRETE
In order to determine the quality of each concrete mixture, several quality control tests
were performed on the fresh concrete. These tests also allowed for an assessment of the
consistency obtained between various batches. This section outlines those tests and
describes the processes used to perform them.
3.5.3.1 Slump Flow
Due to the highly flowable nature of SCC, the traditional slump test is not applicable to
SCC mixtures. As an answer to this problem, the slump flow test was created and its
procedures are outlined in ASTM C 1611 (2006). This test provides a good indication of
a mixture’s ability to flow and fill crevices and provides some measure of a mixture’s
dynamic stability.
To conduct this test, the slump cone was placed in the inverted position and filled in a
single lift with no external vibration applied. Then the slump cone was lifted in a smooth
manner, allowing the concrete to flow across a smooth, horizontal surface. When the
concrete patty came to rest, two orthogonal diameter measurements were made and the
average of these two was deemed to be the slump flow of the concrete mixture.
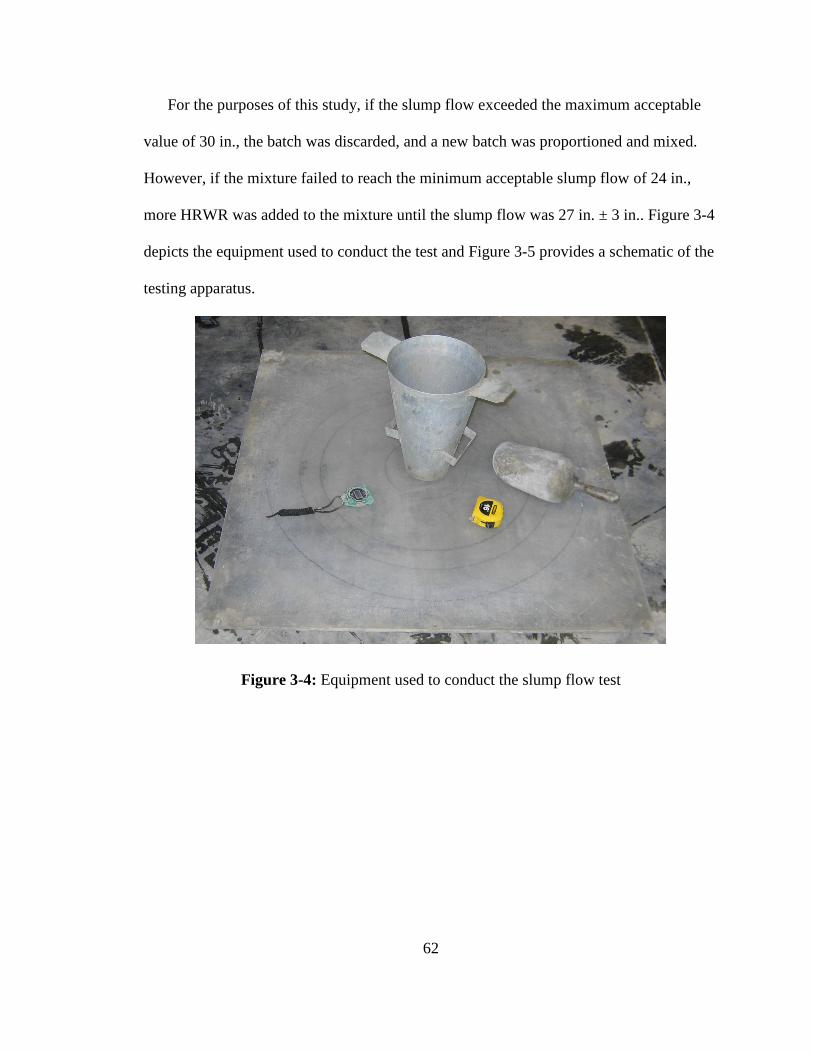
62
For the purposes of this study, if the slump flow exceeded the maximum acceptable
value of 30 in., the batch was discarded, and a new batch was proportioned and mixed.
However, if the mixture failed to reach the minimum acceptable slump flow of 24 in.,
more HRWR was added to the mixture until the slump flow was 27 in. ± 3 in.. Figure 3-4
depicts the equipment used to conduct the test and Figure 3-5 provides a schematic of the
testing apparatus.
Figure 3-4: Equipment used to conduct the slump flow test
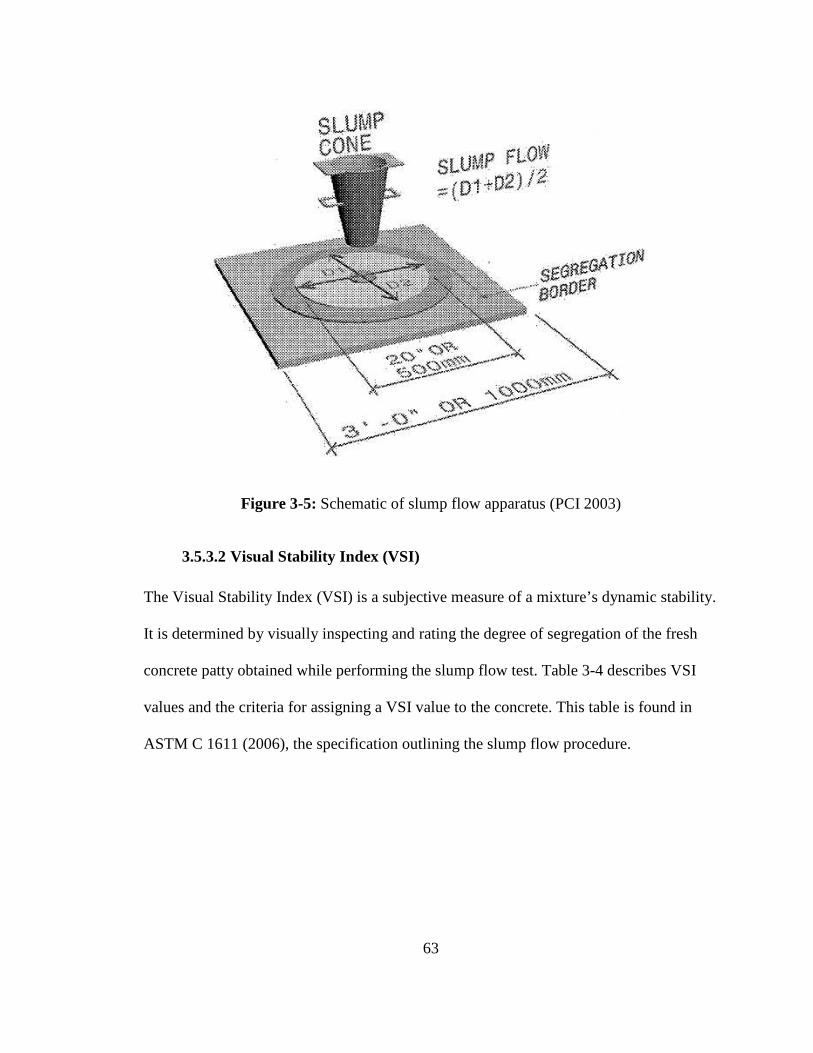
63
Figure 3-5: Schematic of slump flow apparatus (PCI 2003)
3.5.3.2 Visual Stability Index (VSI)
The Visual Stability Index (VSI) is a subjective measure of a mixture’s dynamic stability.
It is determined by visually inspecting and rating the degree of segregation of the fresh
concrete patty obtained while performing the slump flow test. Table 3-4 describes VSI
values and the criteria for assigning a VSI value to the concrete. This table is found in
ASTM C 1611 (2006), the specification outlining the slump flow procedure.
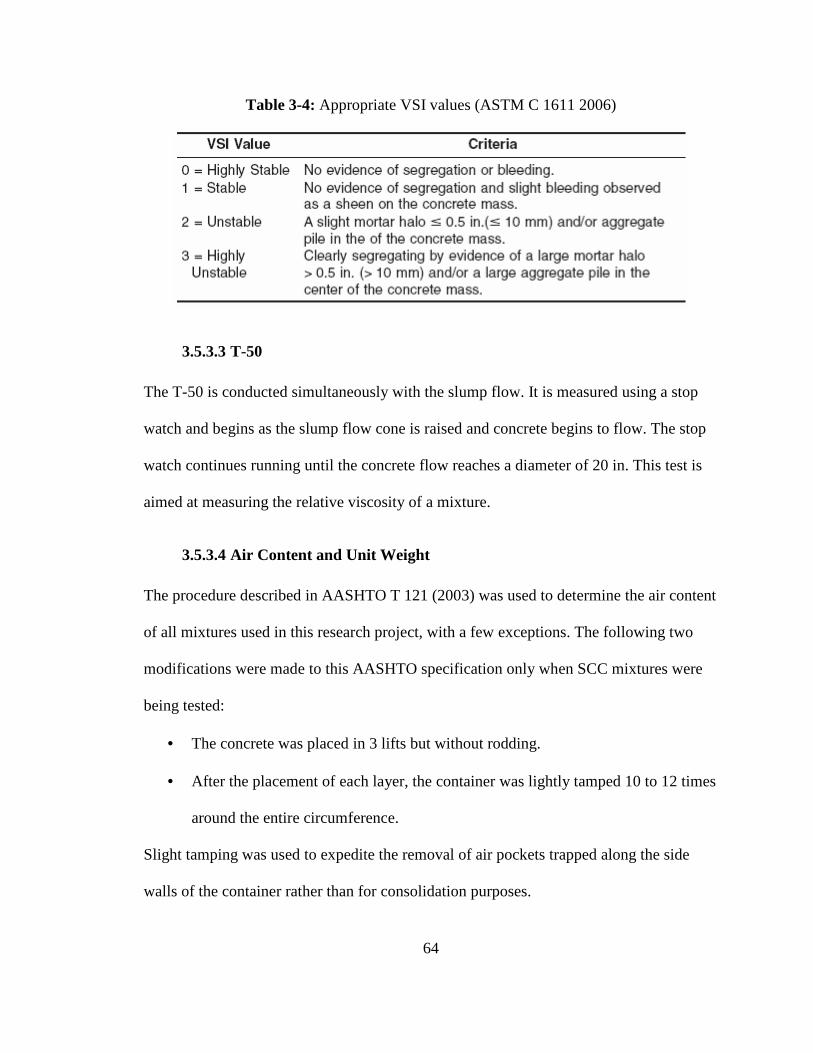
64
Table 3-4: Appropriate VSI values (ASTM C 1611 2006)
3.5.3.3 T-50
The T-50 is conducted simultaneously with the slump flow. It is measured using a stop
watch and begins as the slump flow cone is raised and concrete begins to flow. The stop
watch continues running until the concrete flow reaches a diameter of 20 in. This test is
aimed at measuring the relative viscosity of a mixture.
3.5.3.4 Air Content and Unit Weight
The procedure described in AASHTO T 121 (2003) was used to determine the air content
of all mixtures used in this research project, with a few exceptions. The following two
modifications were made to this AASHTO specification only when SCC mixtures were
being tested:
• The concrete was placed in 3 lifts but without rodding.
• After the placement of each layer, the container was lightly tamped 10 to 12 times
around the entire circumference.
Slight tamping was used to expedite the removal of air pockets trapped along the side
walls of the container rather than for consolidation purposes.
65
The range of air content values chosen for this study was 3% to 6%, as specified by
ALDOT at the time the first phases of this project started. Mixtures not meeting the
requisite air content requirements were discarded and remixed.
3.5.3.5 Fresh Concrete Temperature
Fresh concrete temperatures were taken in accordance with the procedure outlined by
AASHTO T 309 (2003) in an effort to record the environmental conditions in which
mixing took place.
3.5.4 SPECIMEN PREPARATION AND CURING
This study required the preparation of 29 - 6 in. x 12 in. molds for each mixture to be
used for creep testing purposes, as well as 2 - 4 in. x 8 in. match cure molds and 2 - 4 in.
x 8 in. cylinder molds. All the specimens mentioned above were prepared in accordance
with AASHTO T 126 (2003); however, when SCC mixtures were being cast, a few
modifications to the procedures were made. The sections that follow outline the changes
made.
3.5.4.1 Specimen Preparation
AASHTO T 126 (2003) specifications were followed precisely except when dealing with
SCC mixtures. The following modifications were made:
• All 6 in. x 12 in. cylinder molds were cast using 3 lifts without rodding.
• After each lift was placed, each cylinder was tamped lightly 10 to 12 times to help
remove entrapped air pockets along the sides of the cylinder mold.
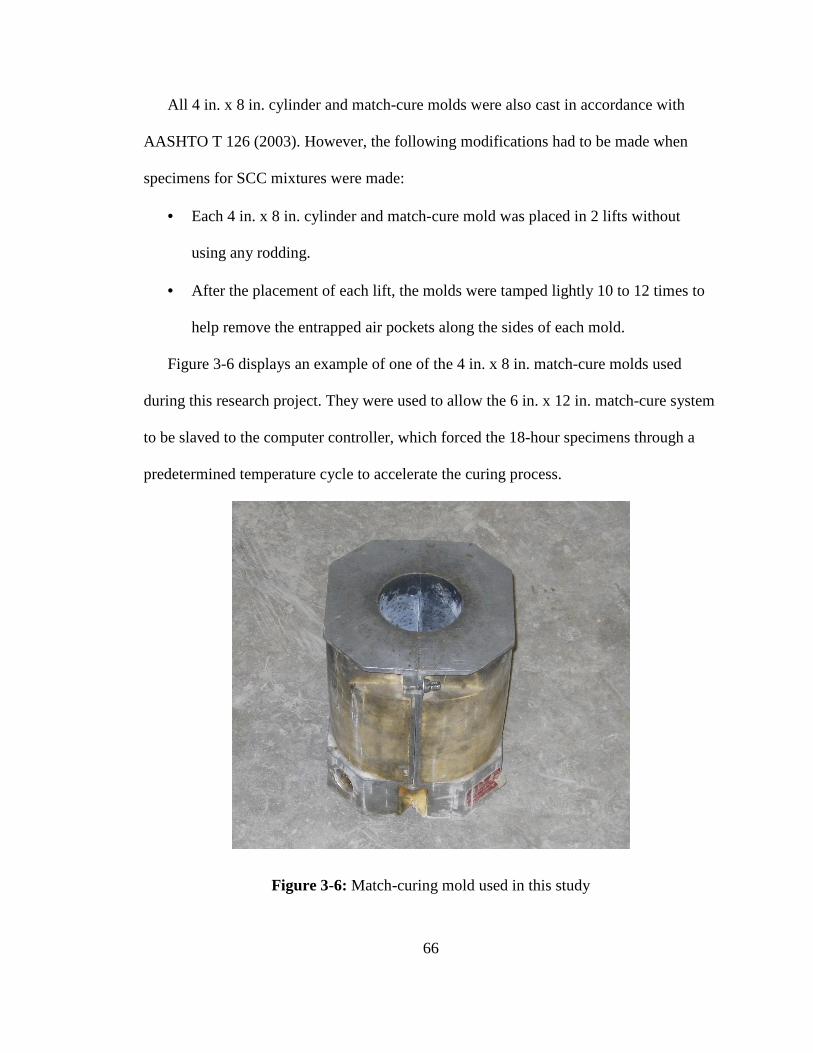
66
All 4 in. x 8 in. cylinder and match-cure molds were also cast in accordance with
AASHTO T 126 (2003). However, the following modifications had to be made when
specimens for SCC mixtures were made:
• Each 4 in. x 8 in. cylinder and match-cure mold was placed in 2 lifts without
using any rodding.
• After the placement of each lift, the molds were tamped lightly 10 to 12 times to
help remove the entrapped air pockets along the sides of each mold.
Figure 3-6 displays an example of one of the 4 in. x 8 in. match-cure molds used
during this research project. They were used to allow the 6 in. x 12 in. match-cure system
to be slaved to the computer controller, which forced the 18-hour specimens through a
predetermined temperature cycle to accelerate the curing process.
Figure 3-6: Match-curing mold used in this study
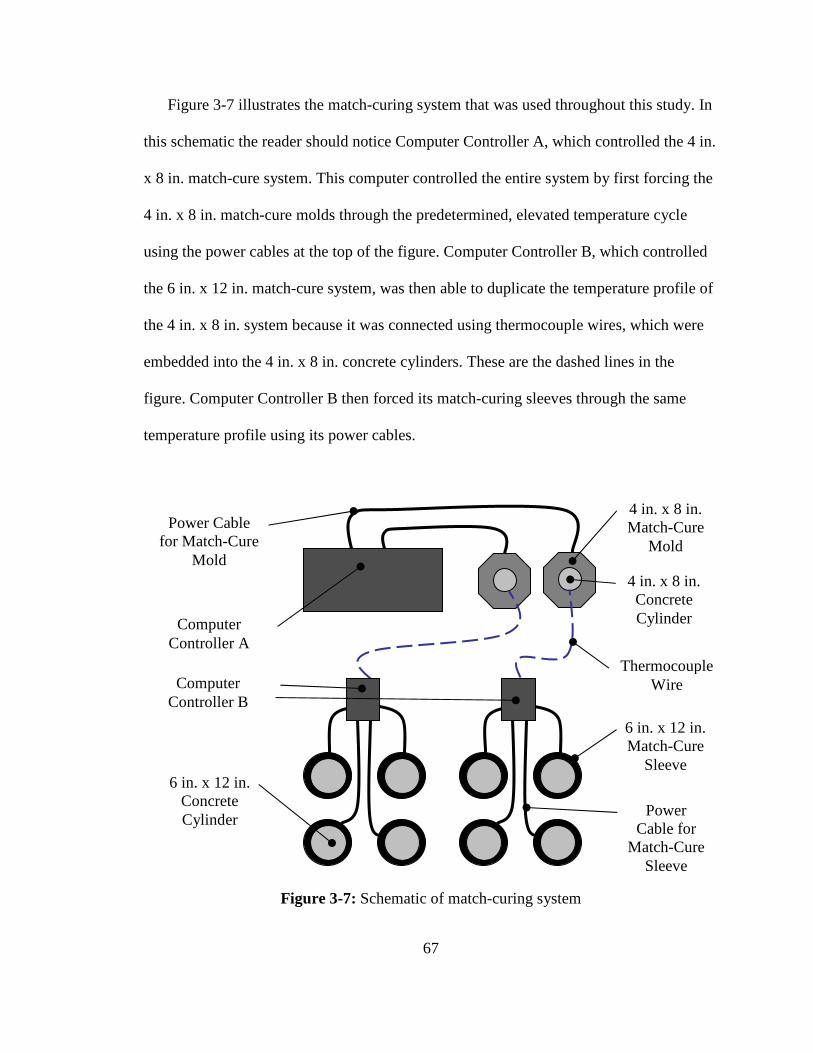
67
Figure 3-7 illustrates the match-curing system that was used throughout this study. In
this schematic the reader should notice Computer Controller A, which controlled the 4 in.
x 8 in. match-cure system. This computer controlled the entire system by first forcing the
4 in. x 8 in. match-cure molds through the predetermined, elevated temperature cycle
using the power cables at the top of the figure. Computer Controller B, which controlled
the 6 in. x 12 in. match-cure system, was then able to duplicate the temperature profile of
the 4 in. x 8 in. system because it was connected using thermocouple wires, which were
embedded into the 4 in. x 8 in. concrete cylinders. These are the dashed lines in the
figure. Computer Controller B then forced its match-curing sleeves through the same
temperature profile using its power cables.
Figure 3-7: Schematic of match-curing system
Power Cable for
Match-Cure Sleeve
Computer Controller A
Power Cable for Match-Cure
Mold 4 in. x 8 in. Concrete Cylinder
4 in. x 8 in. Match-Cure
Mold
Thermocouple Wire
6 in. x 12 in. Concrete Cylinder
6 in. x 12 in. Match-Cure
Sleeve
Computer Controller B
68
3.5.4.2 Curing Regimes
This study required two types of curing regimes to be employed. The first involved a
traditional moist-curing process which was governed by AASHTO T 126 (2003). The
second was a heat-curing process that utilized a match-curing system to force each
match-cured specimen through an elevated temperature cycle aimed at accelerating the
maturity gain of the concrete.
The specimens which would undergo moist-curing were cast in their molds and
sealed in accordance with the AASHTO T 126 (2003) guidelines. They were allowed to
cure for 24 hours in a climate-controlled laboratory environment before being stripped
and placed into a moist-curing room to mature for the required amount of time. The 2-day
specimens then were non-accelerated-cured for 24 hours before being loaded. The 7-, 28-
, and 90-day specimens were non-accelerated-cured for 7 days or until load application,
whichever came first. After the prescribed amount of moist-curing time had passed, each
specimen was removed from the curing room and placed into a climate-controlled room
having a relative humidity of 50% ± 10%. Here the drying process began and creep
testing was conducted.
The specimens chosen for match-curing were sealed, placed in the match-curing
system, and forced through an elevated temperature cycle similar to that typically used in
the prestressing industry in the Southeastern Unites States. Figure 3-8 shows a 6 in. x 12
in. cylinder in the match-curing sleeve. Eight cylinders were cured at a time by the
system, which was slaved to the computer controller in the manner described in Section
3.4.4.1. When the system was activated, it followed the temperature profile in Figure 3-9
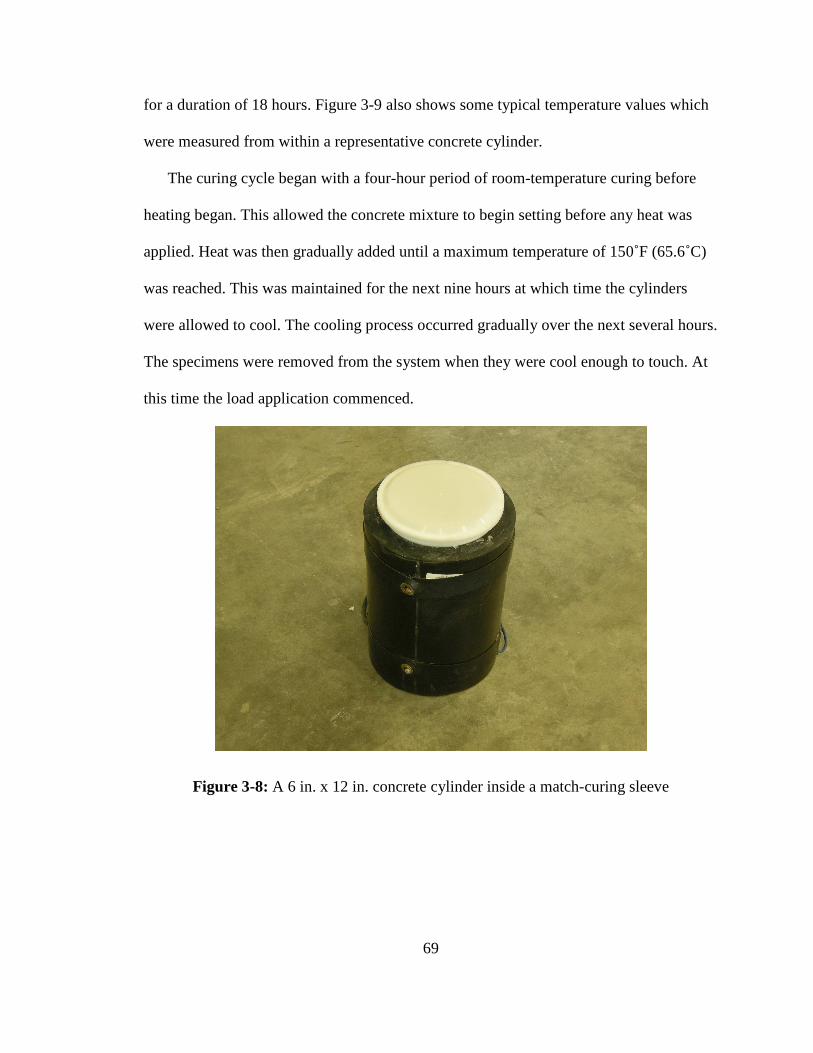
69
for a duration of 18 hours. Figure 3-9 also shows some typical temperature values which
were measured from within a representative concrete cylinder.
The curing cycle began with a four-hour period of room-temperature curing before
heating began. This allowed the concrete mixture to begin setting before any heat was
applied. Heat was then gradually added until a maximum temperature of 150˚F (65.6˚C)
was reached. This was maintained for the next nine hours at which time the cylinders
were allowed to cool. The cooling process occurred gradually over the next several hours.
The specimens were removed from the system when they were cool enough to touch. At
this time the load application commenced.
Figure 3-8: A 6 in. x 12 in. concrete cylinder inside a match-curing sleeve
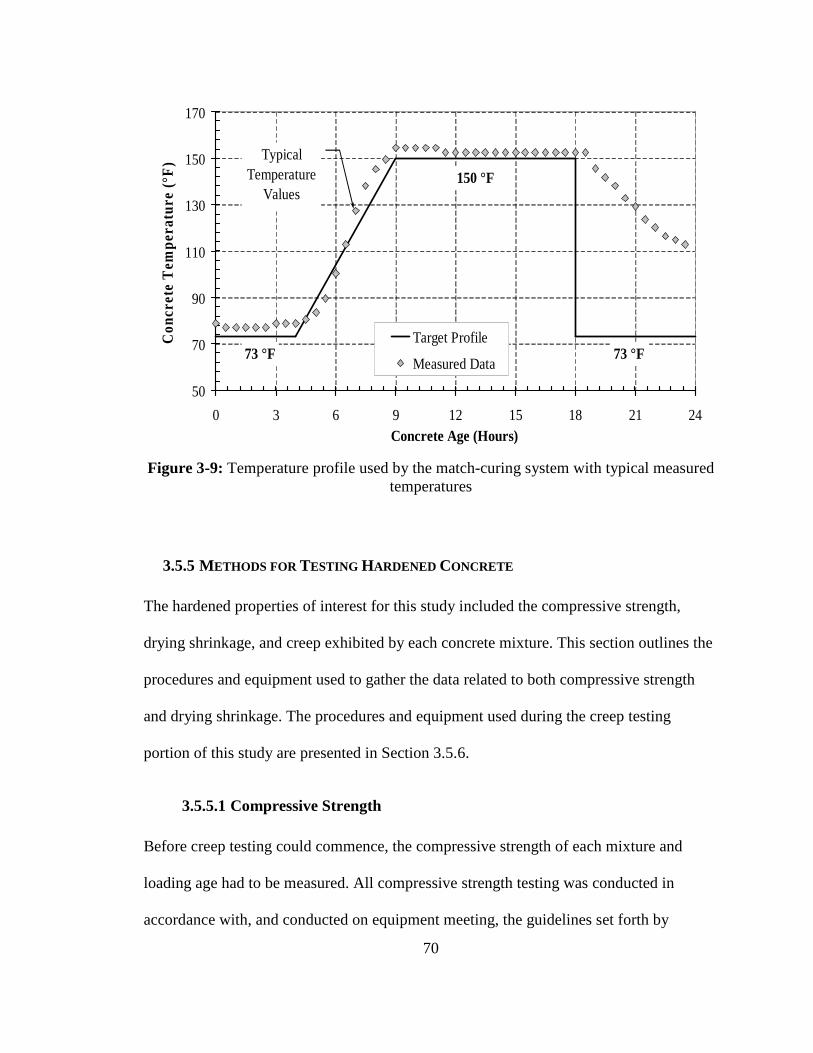
70
50
70
90
110
130
150
170
0 3 6 9 12 15 18 21 24Concrete Age (Hours)
Con
cret
e T
empe
ratu
re (
°F)
Target Profile
Measured Data73 °F
150 °F
73 °F
Typical Temperature
Values
Figure 3-9: Temperature profile used by the match-curing system with typical measured temperatures
3.5.5 METHODS FOR TESTING HARDENED CONCRETE
The hardened properties of interest for this study included the compressive strength,
drying shrinkage, and creep exhibited by each concrete mixture. This section outlines the
procedures and equipment used to gather the data related to both compressive strength
and drying shrinkage. The procedures and equipment used during the creep testing
portion of this study are presented in Section 3.5.6.
3.5.5.1 Compressive Strength
Before creep testing could commence, the compressive strength of each mixture and
loading age had to be measured. All compressive strength testing was conducted in
accordance with, and conducted on equipment meeting, the guidelines set forth by
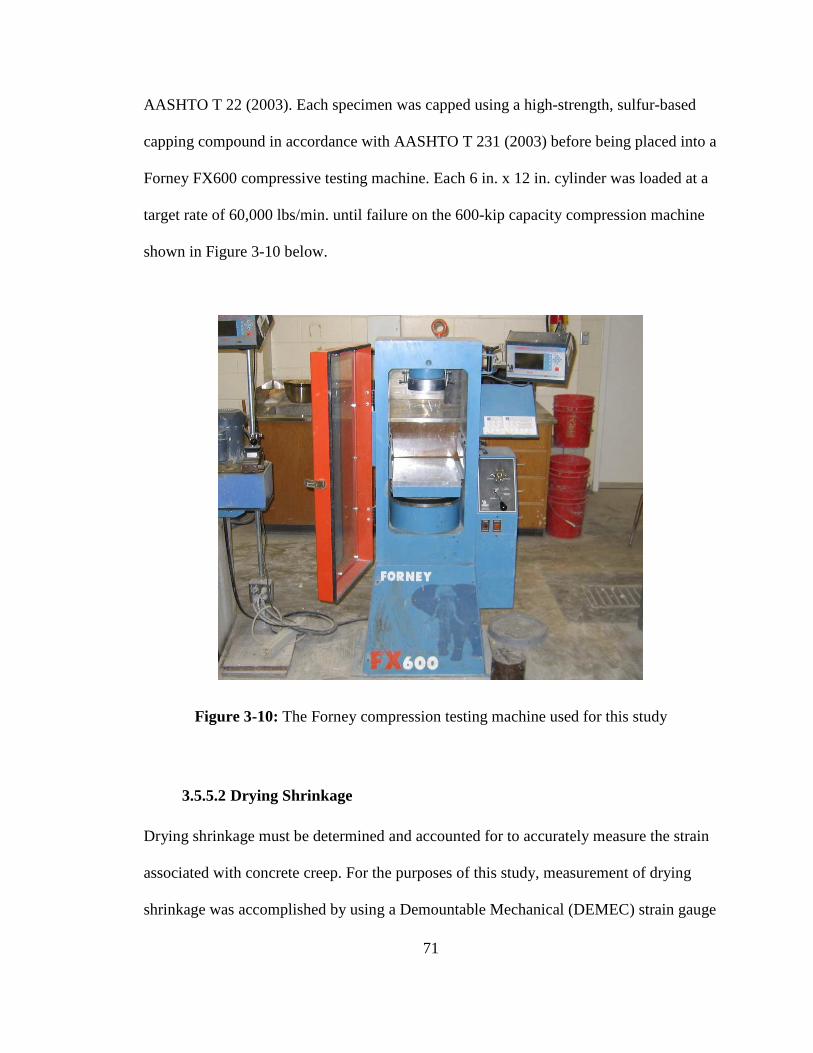
71
AASHTO T 22 (2003). Each specimen was capped using a high-strength, sulfur-based
capping compound in accordance with AASHTO T 231 (2003) before being placed into a
Forney FX600 compressive testing machine. Each 6 in. x 12 in. cylinder was loaded at a
target rate of 60,000 lbs/min. until failure on the 600-kip capacity compression machine
shown in Figure 3-10 below.
Figure 3-10: The Forney compression testing machine used for this study
3.5.5.2 Drying Shrinkage
Drying shrinkage must be determined and accounted for to accurately measure the strain
associated with concrete creep. For the purposes of this study, measurement of drying
shrinkage was accomplished by using a Demountable Mechanical (DEMEC) strain gauge

72
with DEMEC points to measure the shrinkage of a 6 in. x 12 in. concrete cylinder.
Figures 3-11 and 3-12 show both the DEMEC points and DEMEC gauge, respectively.
This type of test specimen and gauge were chosen because they were identical to those
used in the creep testing portion of the study.
Drying shrinkage readings were taken at the time intervals specified in ASTM C 512
(2006), which is the specification that governs creep testing. These intervals included
readings taken before the application of load onto the creep test specimens, immediately
after load application, 2 to 6 hours after applying load, then once a day for the first week,
once a week for the first month, and then every month for a full year. This schedule is
detailed more thoroughly in Section 3.5.6.3. The procedures and equipment used for
gathering the shrinkage data were identical to those used for gathering the creep strain
data. This consistency was employed in an effort to establish uniformity across the study
and to limit data gathering error.
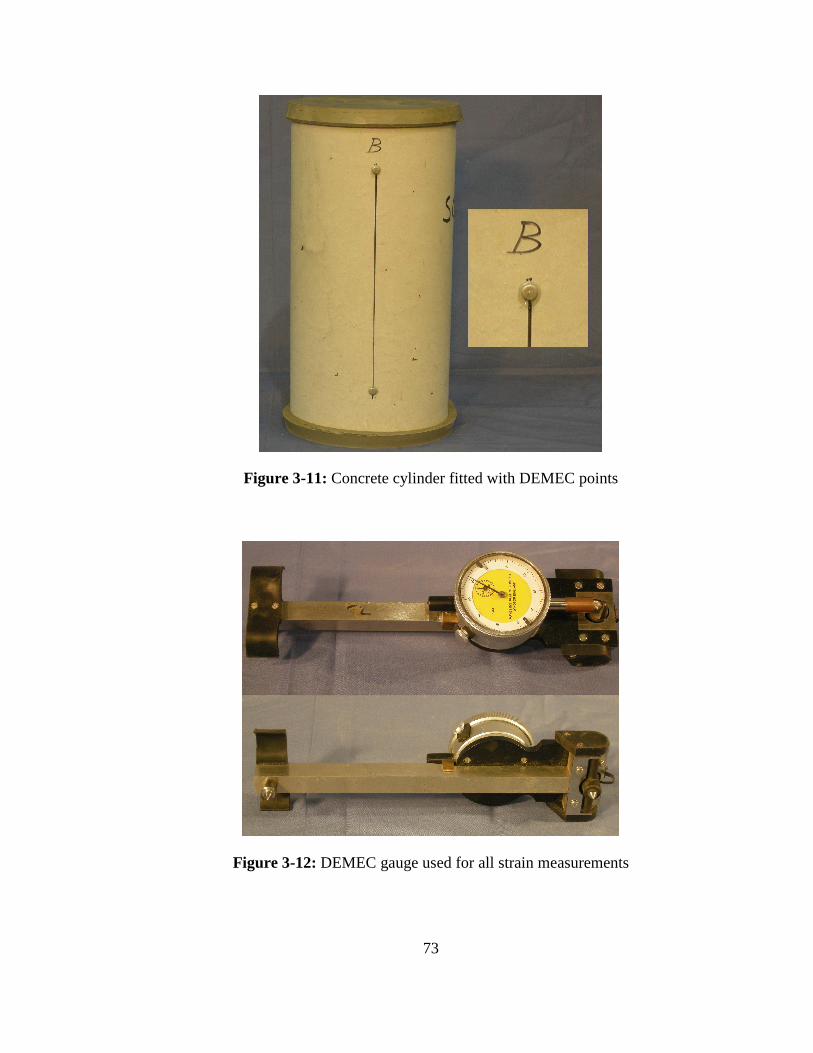
73
Figure 3-11: Concrete cylinder fitted with DEMEC points
Figure 3-12: DEMEC gauge used for all strain measurements
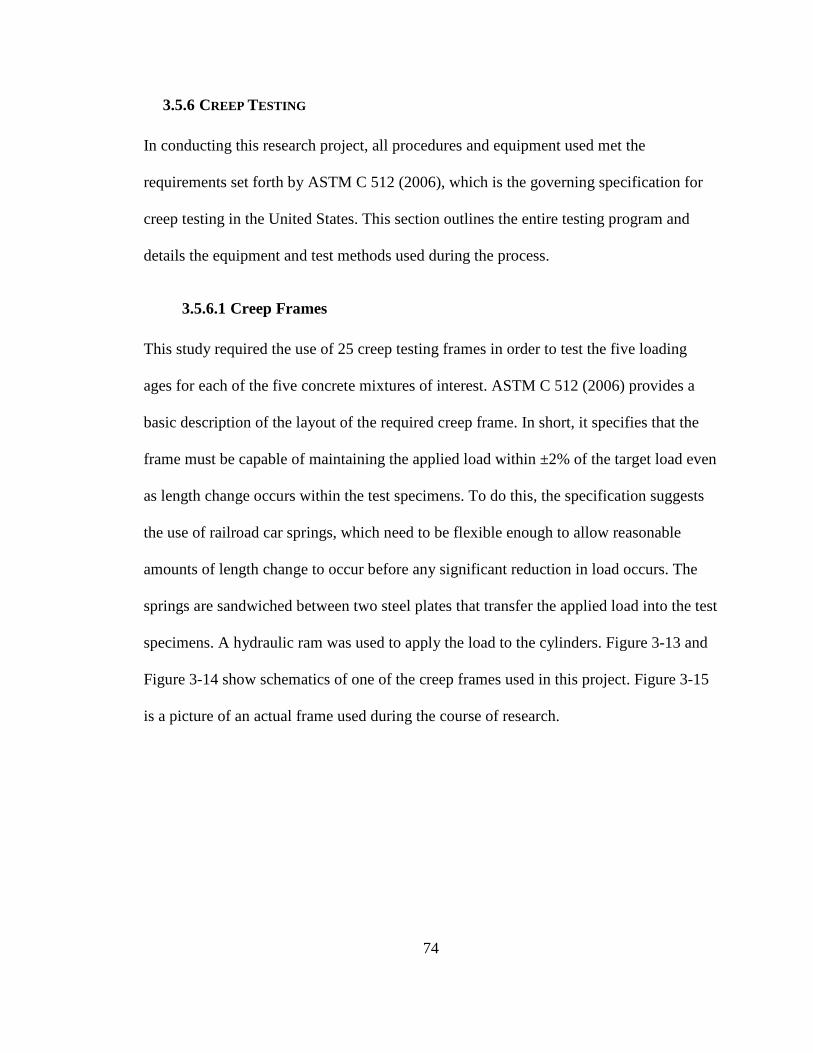
74
3.5.6 CREEP TESTING
In conducting this research project, all procedures and equipment used met the
requirements set forth by ASTM C 512 (2006), which is the governing specification for
creep testing in the United States. This section outlines the entire testing program and
details the equipment and test methods used during the process.
3.5.6.1 Creep Frames
This study required the use of 25 creep testing frames in order to test the five loading
ages for each of the five concrete mixtures of interest. ASTM C 512 (2006) provides a
basic description of the layout of the required creep frame. In short, it specifies that the
frame must be capable of maintaining the applied load within ±2% of the target load even
as length change occurs within the test specimens. To do this, the specification suggests
the use of railroad car springs, which need to be flexible enough to allow reasonable
amounts of length change to occur before any significant reduction in load occurs. The
springs are sandwiched between two steel plates that transfer the applied load into the test
specimens. A hydraulic ram was used to apply the load to the cylinders. Figure 3-13 and
Figure 3-14 show schematics of one of the creep frames used in this project. Figure 3-15
is a picture of an actual frame used during the course of research.
75
Figure 3-13: Elevation views of creep frame
36 in.
2.75 in.
2.75 in.
2.75 in.
2.75 in.
15 in.
12 in.
8 in.
8 in.
90 in.
Hydraulic Jacking Ram
Load Cell
Upper Floating Reaction Plate
Concrete Test Cylinders
Lower Floating Reaction Plate
Lower Static Reaction Plate
Upper Static Reaction Plate
Front View Side View
Elevation View
Strain Gauges
Strain Gauges

76
Figure 3-14: Plan views of reaction plates used in creep frame
15.33 in.
14.167 in.
20 in.
17.5 in.
Plan View
Upper Reaction Plate
Lower Reaction Plate
Front View
Concrete Plug
Steel Base Plate
Spherical head
Steel Base Plate
Spherical head
Steel Rod
Railroad Car Springs
Casters
Elevation View
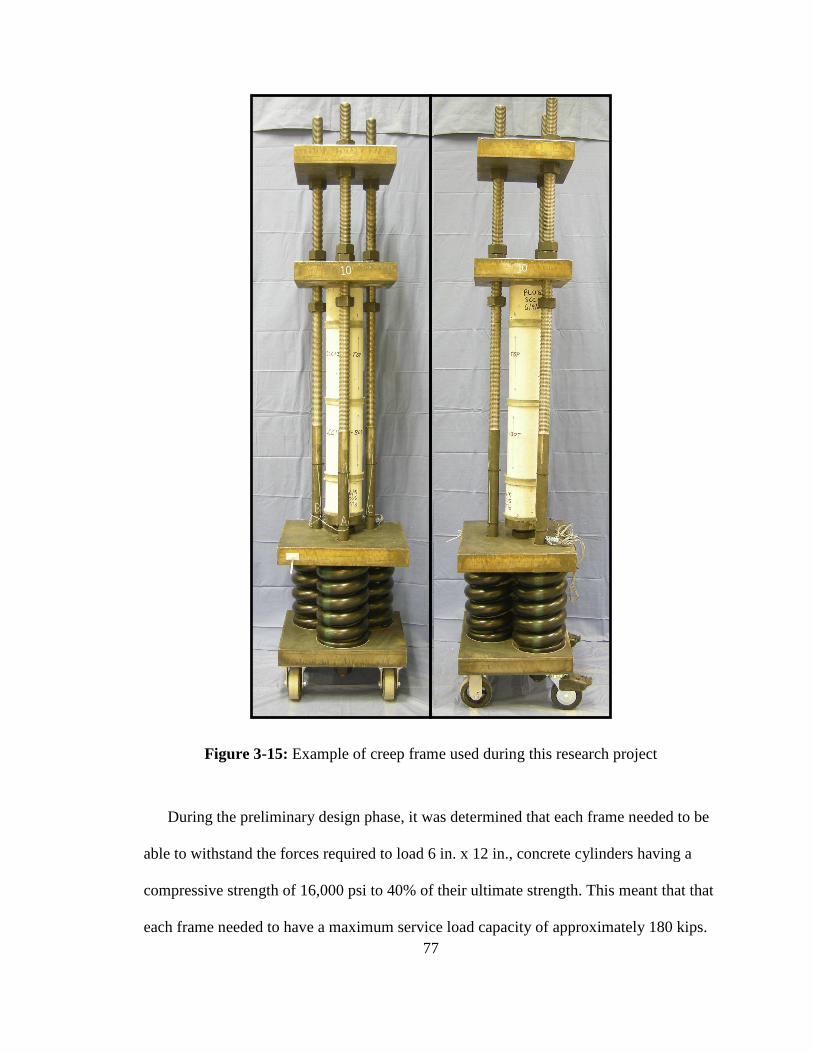
77
Figure 3-15: Example of creep frame used during this research project
During the preliminary design phase, it was determined that each frame needed to be
able to withstand the forces required to load 6 in. x 12 in., concrete cylinders having a
compressive strength of 16,000 psi to 40% of their ultimate strength. This meant that that
each frame needed to have a maximum service load capacity of approximately 180 kips.

78
All forces were considered to be dead loads because they were controllable and constant
once the force was applied. This allowed for the use of a dead load factor of 1.4 to be
used in determining the maximum required service load capacity.
Based on the load requirements established through the initial analysis, it was
determined that 2¾ in.-thick Grade 50 steel plates were required. Their use would prevent
excessive deflections under service loads and would allow for the most accurate creep
strain measurements to be collected. As can be seen in Figure 3-13, four plates were
needed. To assist with alignment during loading, 6 in. diameter scribe marks were etched
into the underside of the upper floating reaction plate. This aided in aligning the cylinders
into the required vertical position and minimized eccentricities associated with
misalignment issues.
On the top side of the lower floating reaction plate a threaded hole was created to
allow the proper alignment of a spherical head, which would again help reduce the
chances of incurring eccentrically loaded specimens. To help align the springs, 3 - 8½ in.
diameter scribe marks were engraved on the underside of the lower floating reaction
plate. These can be seen in Figure 3-14, along with the positions of the steel restraining
rods.
From Figure 3-14 it can be seen that three rods with nuts were used to hold the
applied load once the jacking mechanism was released. Each rod needed to be able to
safely hold 60 kips of force while experiencing minimal relaxation. This was
accomplished by using 1¾ in. diameter steel rods which had a yield stress of 65 ksi and
an ultimate stress of 80 ksi. Every rod was designed to be 90 in. in length and was
threaded along the first 10 in. of the lower end of the bar and along the first 50 in. of the
79
top portion. This allowed for 1¾ in. Grade 8, heavy-duty hex nuts to be threaded onto the
rods to hold the plates in the proper locations. Each frame required eight of these nuts,
which were made from C 1045 steel having a minimum Rockwell hardness of C24 and a
minimum ultimate tensile stress of 150 ksi. The nuts were machined reasonably well;
however, due to tolerance issues, approximately 2% of the applied load was lost when the
hydraulic ram was released, leaving the nuts to resist the applied force. This required the
target load to be over applied by 2% to compensate for the seating action.
While the plates and rods acted to hold the applied loads once the hydraulic jack was
removed, it was the springs that continued to apply the load even as the cylinders
deformed under the compressive forces. Every frame required three of these springs, each
of which had a spring constant of 25,000 lbs/in. They were designed and constructed
specifically for Auburn University and this research project by Duer/Carolina Coil, Inc.
of Reidville, SC. Each spring was made from ASTM-A-304, Grade 220 steel and was 15
in. in height and had an 8½ in. in outer diameter. These springs were highly flexible in
comparison to previous springs used for this application, allowing for greater length
change to occur in the test specimens before a 2% reduction in the total load occurred.
To help monitor the load, strain gauges were applied to the unthreaded portion of
each bar at a distance of no less that two bar diameters away from the end of the threads.
This location allowed the stress distribution in each bar to spread fully across the cross
section and provided the most accurate strain reading possible. After the strain gauges
were installed, each frame was calibrated to determine that the gauges were working
properly. This calibration consisted of three loading runs in which each frame was loaded
to 120 kips, taking strain measurements at 20 kip intervals along the way. After all three
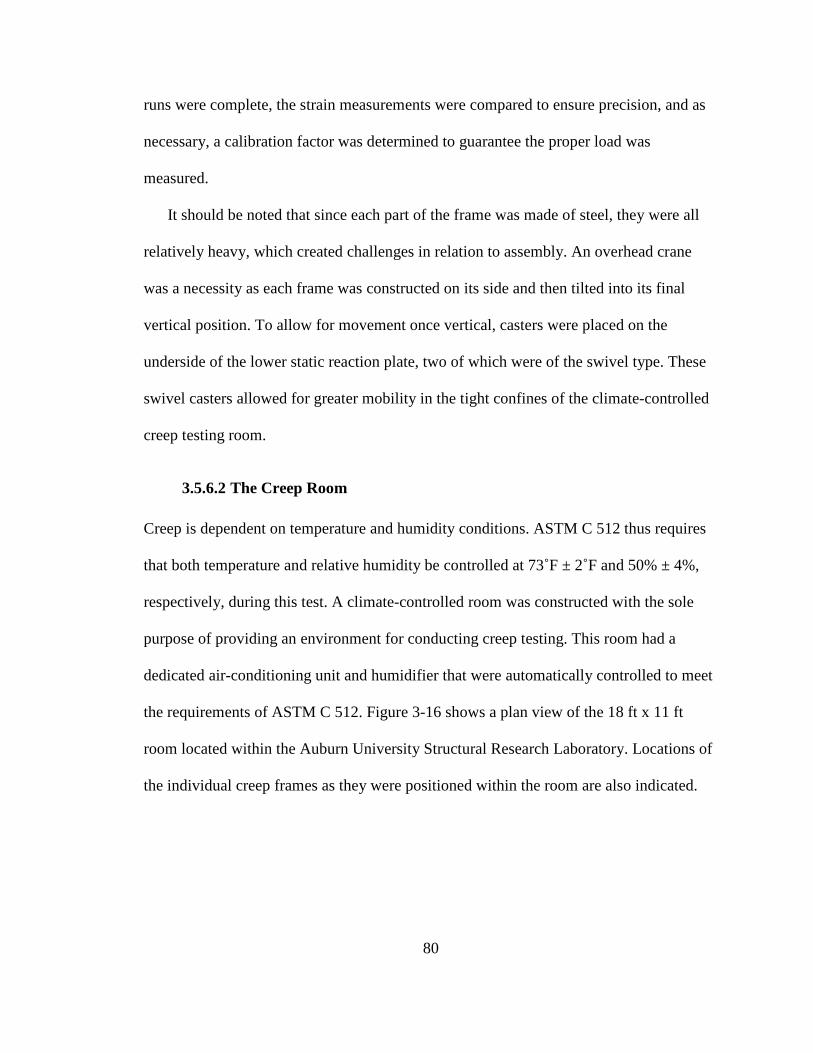
80
runs were complete, the strain measurements were compared to ensure precision, and as
necessary, a calibration factor was determined to guarantee the proper load was
measured.
It should be noted that since each part of the frame was made of steel, they were all
relatively heavy, which created challenges in relation to assembly. An overhead crane
was a necessity as each frame was constructed on its side and then tilted into its final
vertical position. To allow for movement once vertical, casters were placed on the
underside of the lower static reaction plate, two of which were of the swivel type. These
swivel casters allowed for greater mobility in the tight confines of the climate-controlled
creep testing room.
3.5.6.2 The Creep Room
Creep is dependent on temperature and humidity conditions. ASTM C 512 thus requires
that both temperature and relative humidity be controlled at 73˚F ± 2˚F and 50% ± 4%,
respectively, during this test. A climate-controlled room was constructed with the sole
purpose of providing an environment for conducting creep testing. This room had a
dedicated air-conditioning unit and humidifier that were automatically controlled to meet
the requirements of ASTM C 512. Figure 3-16 shows a plan view of the 18 ft x 11 ft
room located within the Auburn University Structural Research Laboratory. Locations of
the individual creep frames as they were positioned within the room are also indicated.
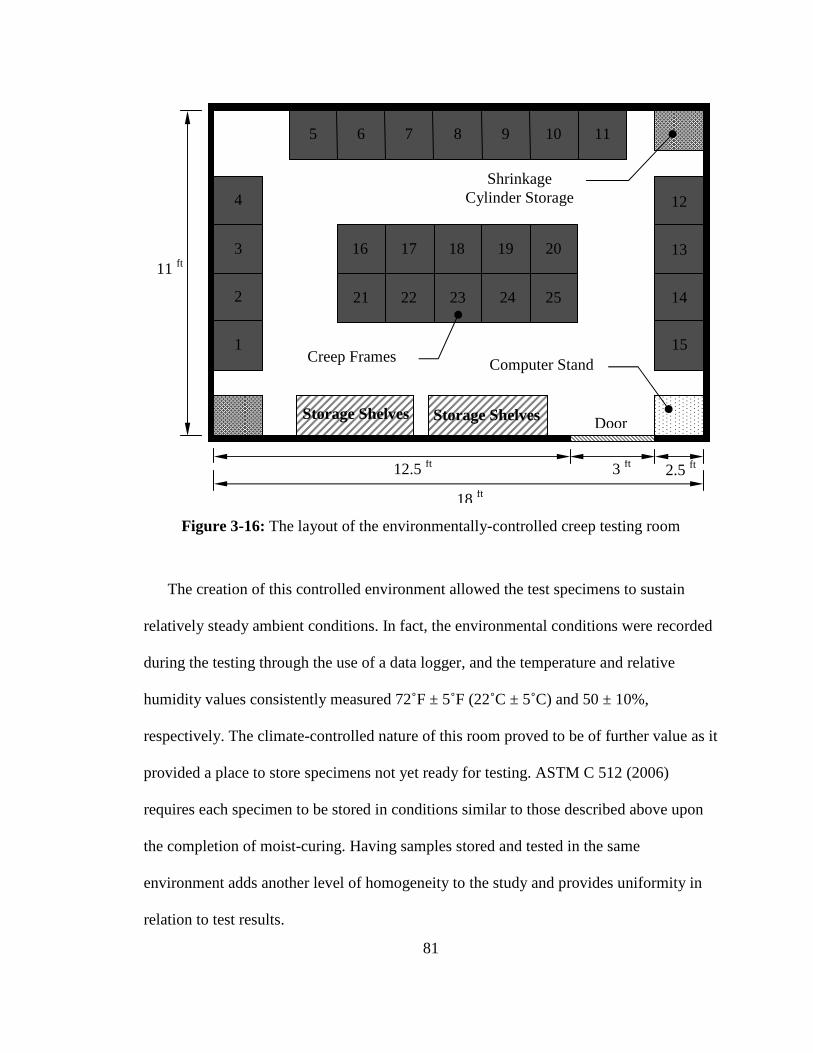
81
Figure 3-16: The layout of the environmentally-controlled creep testing room
The creation of this controlled environment allowed the test specimens to sustain
relatively steady ambient conditions. In fact, the environmental conditions were recorded
during the testing through the use of a data logger, and the temperature and relative
humidity values consistently measured 72˚F ± 5˚F (22˚C ± 5˚C) and 50 ± 10%,
respectively. The climate-controlled nature of this room proved to be of further value as it
provided a place to store specimens not yet ready for testing. ASTM C 512 (2006)
requires each specimen to be stored in conditions similar to those described above upon
the completion of moist-curing. Having samples stored and tested in the same
environment adds another level of homogeneity to the study and provides uniformity in
relation to test results.
Storage Shelves Storage Shelves
12.5 ft 3 ft 2.5 ft
18 ft
11 ft
Computer Stand
Shrinkage Cylinder Storage
Creep Frames
Door
1
2
3
4
21 22 23 24 25
16 17 18 19 20
5 6 7 8 9 10 11
12
13
14
15

82
3.5.6.3 Creep Testing Procedure
After the appropriate curing regime for each set of specimens was complete, all
specimens were loaded in uniaxial constant compression. All creep testing procedures for
this research project were conducted in as uniform a manner as possible, and as
previously stated, in accordance with the specifications set forth by ASTM C 512 (2006).
An outline of the procedure used throughout the creep testing program is presented
below.
1. Remove creep, shrinkage, and strength specimens from curing
conditions.
2. Sulfur-cap each specimen in accordance with AASHTO T 231 (2003)
and allow caps to harden.
3. While cap is hardening, apply DEMEC points at 120-degree intervals
around the perimeter of each creep and shrinkage test cylinder. Allow
epoxy to fully harden before taking first reading.
4. Determine the ultimate compressive strength of two specimens.
5. Determine the best cylinder alignment to limit eccentricities.
6. Insert the test cylinders into the appropriate creep frame using the
alignment determined in Step 5. The test cylinders should align with
the scribe mark on the bottom of the upper floating reaction plate.
7. Lower the upper floating reaction plate onto the test cylinders.
8. Record initial strain measurements for test cylinders and drying
shrinkage cylinders.

83
9. Position the hydraulic jacking mechanism on the top side of the upper
floating reaction plate.
10. Position the load cell on top of the jacking mechanism and plumb the
entire setup.
11. Attach the load cell and strain gauge wiring to the strain gauge
indicator.
12. Begin slowly applying 40% of the ultimate compressive strength
found in Step 4.
13. Continue slowly applying load until 102% of the desired load is
reached.
14. Lock the load into place by hand-tightening all nuts on the top side of
the upper floating reaction plate.
15. Gently retract the jacking mechanism.
16. Check the resulting specimen load by using the strains obtained from
the steel bars to ensure it is within ±2% of desired value. Reapply load
as necessary.
17. Record concrete strain measurements resulting from load application
and corresponding drying shrinkage strain as soon as possible after
initial loading.
After this procedure was completed, strain readings were taken using the DEMEC
strain reading gauge depicted in Figure 3-12, and were read in accordance with the time
intervals required by ASTM C 512 (2006). These intervals included readings at 2 to 6

84
hours after loading, once a day for the first week, then once a week until the completion
of the first month, and then once a month for the remainder of the testing period, which
was one year for this project. The 2 to 6 hour reading was taken as close to the 2-hours-
after-loading mark as possible. This was also true for all other readings. They were taken
as close to their required time as possible, in an effort to provide uniform results.
As testing progressed and creep strain measurements were taken, ASTM C 512
(2006) required the applied load remain within ±2% of the original load. To track
changes in load, strain gauges were applied to all three bars of each frame. Using a strain
indicator, bar strain readings were taken immediately prior to all creep strain readings.
The measured bar strain was compared to initial bar strains taken prior to loading and the
percent change in load was calculated. If the applied load was outside of the specified
range, load was added as necessary, and then the creep strain measurements were taken.
In an effort to isolate the strain associated solely with creep, ASTM C 512 (2006)
requires corresponding drying shrinkage strain readings to be taken. The readings were
recorded at the same time intervals as the creep strain readings and were taken
immediately following the creep measurements. As previously mentioned, 6 in. x 12 in.
cylinders were chosen for the drying shrinkage specimens because they are identical to
the creep specimens. The method used to measure the strain on these specimens was
identical to that used for the creep specimens.

85
3.6 MATERIALS
Over the course of this research project, numerous raw materials were used to produce
the five concrete mixtures. This section outlines the specific details of each of these raw
materials.
3.6.1 CEMENTITIOUS MATERIALS
Three cementitious materials were used over the course of this study, including: Type III
portland cement, Class C fly ash, and Grade 120 GGBF Slag. The incorporation of all of
these cementitious materials allowed for the determination of the effect each has on creep
of SCC. Two SCC mixtures were comprised of a combination of Type III portland
cement and Class C fly ash. The remaining two SCC mixtures consisted of a combination
of Type III portland cement and Grade 120 GGBF Slag.
3.6.1.1 Type III Portland Cement
The Type III portland cement used for this research project was manufactured in
Demopolis, Alabama by Cemex. It was utilized because it is consistent with the materials
used by the prestressing industry, which prefers it over other types of cement because of
the high early-age strengths it provides. The chemical composition of the cement used for
this study can be found in Table 3-5.
3.6.1.2 Class C Fly Ash
The Holcim (US), Inc. plant in Quinton, Alabama provided the Class C fly ash used for
this project. It was chosen because it provides a more rapid strength gain than Class F fly
ash, which is preferred by the prestressing industry. A more detailed description of Class
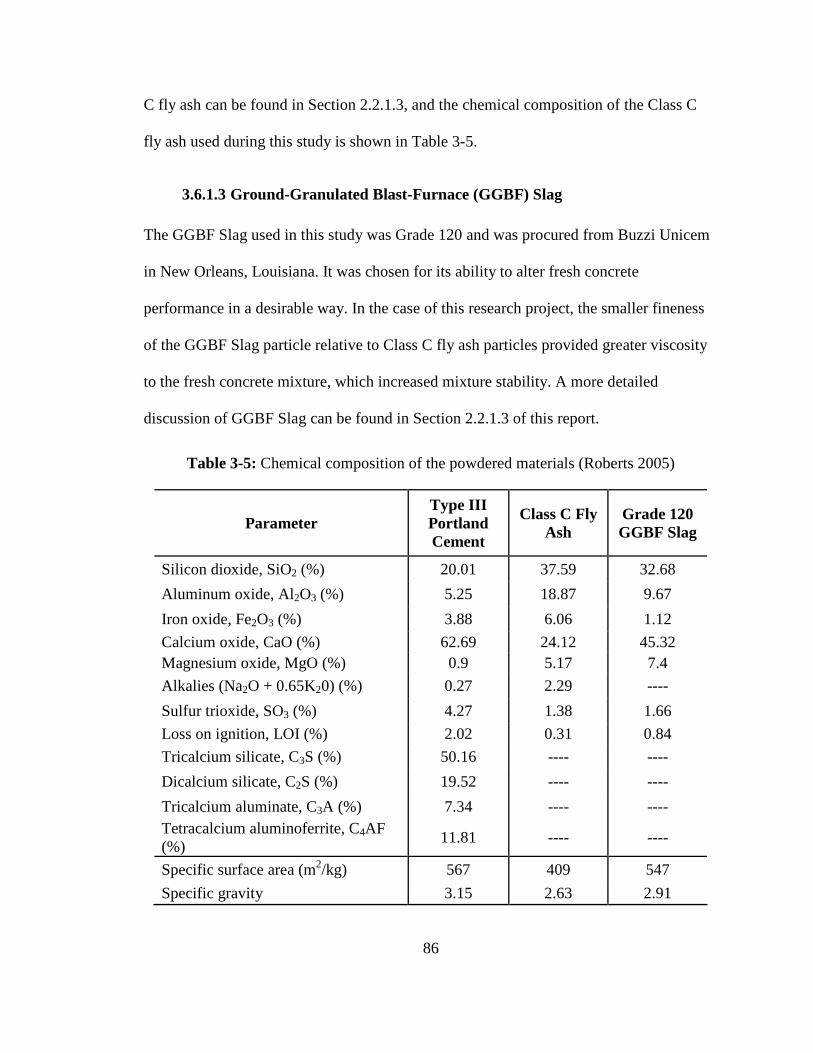
86
C fly ash can be found in Section 2.2.1.3, and the chemical composition of the Class C
fly ash used during this study is shown in Table 3-5.
3.6.1.3 Ground-Granulated Blast-Furnace (GGBF) Slag
The GGBF Slag used in this study was Grade 120 and was procured from Buzzi Unicem
in New Orleans, Louisiana. It was chosen for its ability to alter fresh concrete
performance in a desirable way. In the case of this research project, the smaller fineness
of the GGBF Slag particle relative to Class C fly ash particles provided greater viscosity
to the fresh concrete mixture, which increased mixture stability. A more detailed
discussion of GGBF Slag can be found in Section 2.2.1.3 of this report.
Table 3-5: Chemical composition of the powdered materials (Roberts 2005)
Parameter Type III Portland Cement
Class C Fly Ash
Grade 120 GGBF Slag
Silicon dioxide, SiO2 (%) 20.01 37.59 32.68
Aluminum oxide, Al2O3 (%) 5.25 18.87 9.67
Iron oxide, Fe2O3 (%) 3.88 6.06 1.12
Calcium oxide, CaO (%) 62.69 24.12 45.32 Magnesium oxide, MgO (%) 0.9 5.17 7.4
Alkalies (Na2O + 0.65K20) (%) 0.27 2.29 ----
Sulfur trioxide, SO3 (%) 4.27 1.38 1.66
Loss on ignition, LOI (%) 2.02 0.31 0.84
Tricalcium silicate, C3S (%) 50.16 ---- ----
Dicalcium silicate, C2S (%) 19.52 ---- ----
Tricalcium aluminate, C3A (%) 7.34 ---- ---- Tetracalcium aluminoferrite, C4AF (%)
11.81 ---- ----
Specific surface area (m2/kg) 567 409 547
Specific gravity 3.15 2.63 2.91
87
3.6.2 CHEMICAL ADMIXTURES
The three chemical admixtures used in the concrete mixtures for this research project are
discussed in this section. The three admixtures include two types of water-reducing
admixtures and a viscosity-modifying admixture. Their use allowed the desired fresh and
hardened properties to be reached.
3.6.2.1 High-Range Water-Reducing (HRWR) Admixture
Glenium 3400 and Polyheed 1025 were used in this study to fulfill the roles of the
HRWR admixtures, which make SCC possible. They both are based on polycarboxylate
chemistry and were obtained from BASF Construction Chemicals, LLC. The Glenium
3400 admixture provides a greater water-reducing ability than the Polyheed 1025, which
is more generally referred to as a mid-range water-reducer. However, both were used
during this study to obtain the desired filling ability. More details on the behavior of
HRWR admixtures is presented in Section 2.2.
3.6.2.2 Viscosity Modifying Admixture (VMA)
A VMA called Rheomac VMA 362 was used to help reduce each SCC mixture’s
sensitivity to fluctuations in free water content. It was obtained from BASF Construction
Chemicals, LLC, which provided the HRWR admixture mentioned in the previous
section. Section 2.2.1.4 gives a more in-depth description of the effects and usages of
VMA.
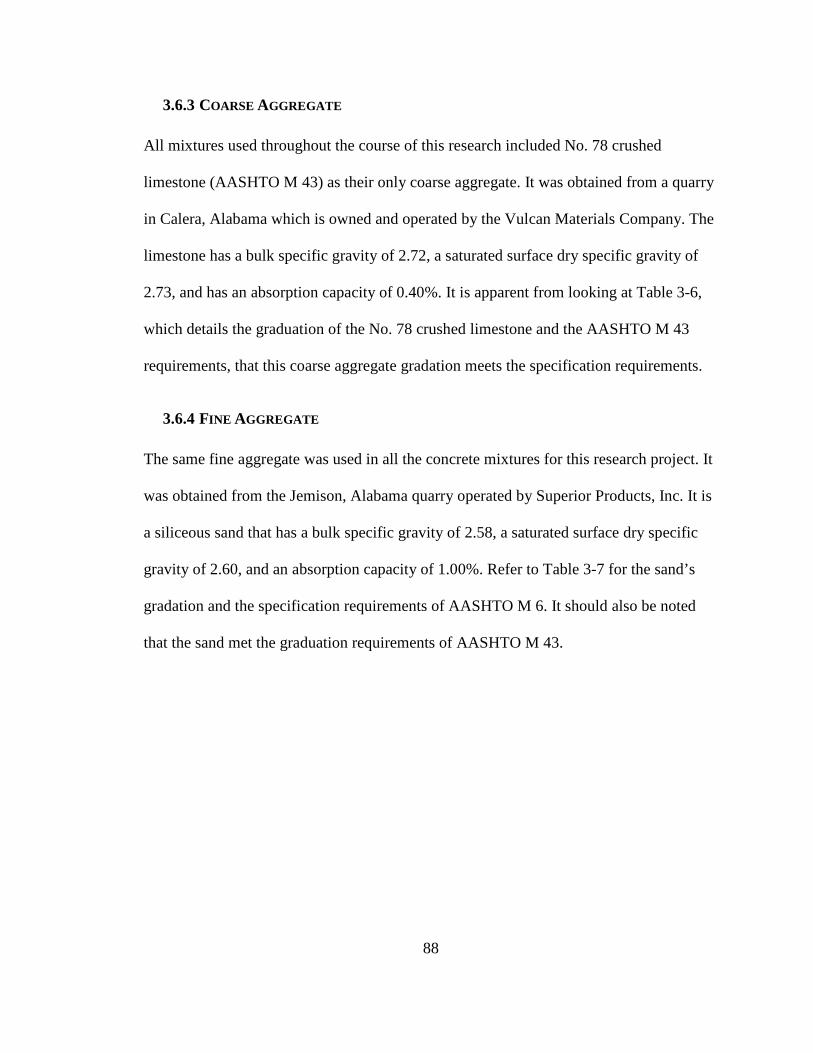
88
3.6.3 COARSE AGGREGATE
All mixtures used throughout the course of this research included No. 78 crushed
limestone (AASHTO M 43) as their only coarse aggregate. It was obtained from a quarry
in Calera, Alabama which is owned and operated by the Vulcan Materials Company. The
limestone has a bulk specific gravity of 2.72, a saturated surface dry specific gravity of
2.73, and has an absorption capacity of 0.40%. It is apparent from looking at Table 3-6,
which details the graduation of the No. 78 crushed limestone and the AASHTO M 43
requirements, that this coarse aggregate gradation meets the specification requirements.
3.6.4 FINE AGGREGATE
The same fine aggregate was used in all the concrete mixtures for this research project. It
was obtained from the Jemison, Alabama quarry operated by Superior Products, Inc. It is
a siliceous sand that has a bulk specific gravity of 2.58, a saturated surface dry specific
gravity of 2.60, and an absorption capacity of 1.00%. Refer to Table 3-7 for the sand’s
gradation and the specification requirements of AASHTO M 6. It should also be noted
that the sand met the graduation requirements of AASHTO M 43.
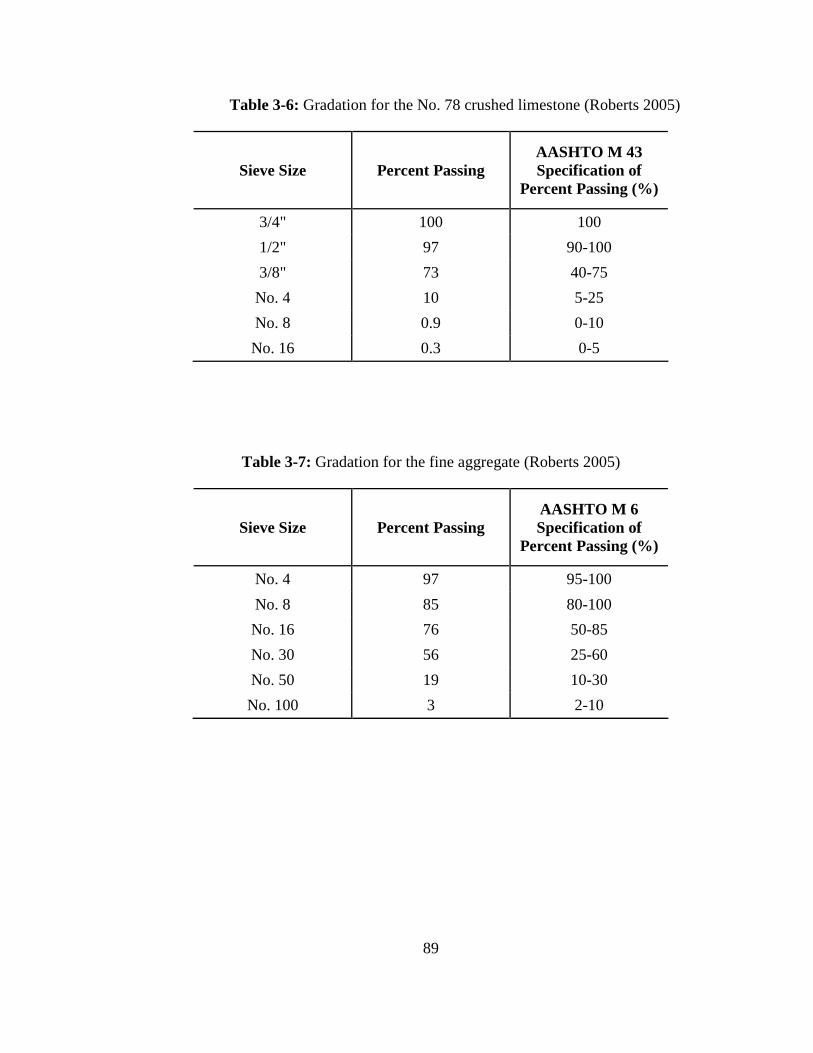
89
Table 3-6: Gradation for the No. 78 crushed limestone (Roberts 2005)
Sieve Size Percent Passing AASHTO M 43 Specification of
Percent Passing (%)
3/4" 100 100
1/2" 97 90-100
3/8" 73 40-75
No. 4 10 5-25
No. 8 0.9 0-10
No. 16 0.3 0-5
Table 3-7: Gradation for the fine aggregate (Roberts 2005)
Sieve Size Percent Passing AASHTO M 6 Specification of
Percent Passing (%)
No. 4 97 95-100
No. 8 85 80-100
No. 16 76 50-85
No. 30 56 25-60
No. 50 19 10-30
No. 100 3 2-10
90
CHAPTER 4
PRESENTATION AND ANALYSIS OF RESULTS
4.1 INTRODUCTION
The fresh and hardened properties collected from mixing and testing four SCC mixtures
and one conventional-slump concrete mixture are presented in this chapter. Fresh
properties can be found in Section 4.2, while mechanical properties and creep results can
be found in Sections 4.3 and 4.4, respectively. Additionally, suggestions derived from
experience gained relative to ASTM C 512 creep testing procedures are detailed in
Section 4.5. Information is included on lessons learned though designing and
constructing the creep frames, as well as information regarding loading specimens and
collecting data over the course of 365 days.
4.2 FRESH PROPERTIES
The results from the fresh property testing of all SCC mixtures and the conventional-
slump mixture are presented in Table 4-1. It should be noted that the total number of
specimens required from each mixture made it necessary to prepare 8.75 ft3 of concrete
for each mixture; however, the mixer used for this research project only had a 5.5 ft3
useful service volume. Therefore, each mixture had to be prepared in at least two batches.
Additionally, in some cases, three batches were used when some batches had to be
repeated. For these reasons, Table 4-1 lists multiple batches for each mixture.
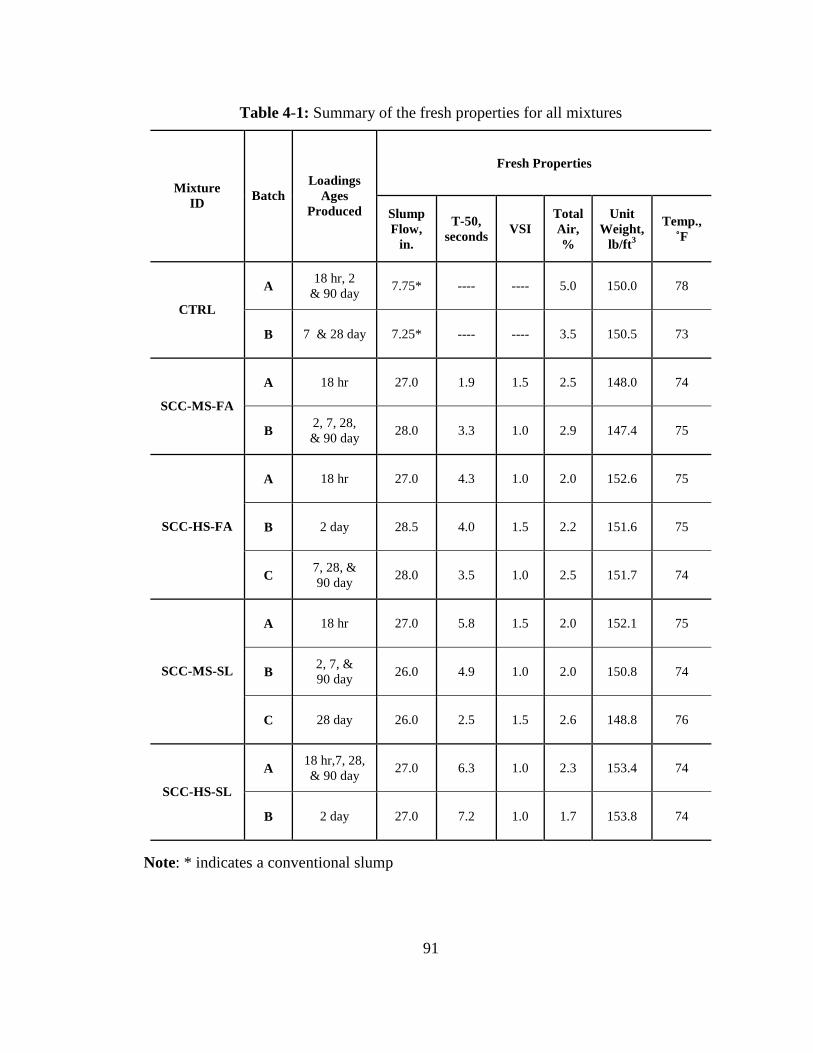
91
Table 4-1: Summary of the fresh properties for all mixtures
Fresh Properties
Mixture ID
Batch Loadings
Ages Produced Slump
Flow, in.
T-50, seconds
VSI Total Air, %
Unit Weight,
lb/ft 3
Temp., ˚F
A 18 hr, 2
& 90 day 7.75* ---- ---- 5.0 150.0 78
CTRL
B 7 & 28 day 7.25* ---- ---- 3.5 150.5 73
A 18 hr 27.0 1.9 1.5 2.5 148.0 74
SCC-MS-FA
B 2, 7, 28, & 90 day
28.0 3.3 1.0 2.9 147.4 75
A 18 hr 27.0 4.3 1.0 2.0 152.6 75
B 2 day 28.5 4.0 1.5 2.2 151.6 75 SCC-HS-FA
C 7, 28, & 90 day
28.0 3.5 1.0 2.5 151.7 74
A 18 hr 27.0 5.8 1.5 2.0 152.1 75
B 2, 7, & 90 day
26.0 4.9 1.0 2.0 150.8 74 SCC-MS-SL
C 28 day 26.0 2.5 1.5 2.6 148.8 76
A 18 hr,7, 28, & 90 day
27.0 6.3 1.0 2.3 153.4 74
SCC-HS-SL
B 2 day 27.0 7.2 1.0 1.7 153.8 74
Note: * indicates a conventional slump

92
4.2.1 SLUMP FLOW
The values collected from performing the slump flow test for each SCC mixture are
presented in this section. A brief discussion follows the presentation of results.
4.2.1.1 Slump Flow Test Results
The slump flow values collected from testing fresh properties of each of the SCC
mixtures all fell within the acceptable range (27 ± 3 inches) chosen in earlier phases of
this study. In fact, after approximately 15 minutes of mixing, all slump flow values
ranged from 26.0 to 28.5 in. (660 to 724 mm). Figure 4-1 depicts the slump flow values
for each batch of all SCC mixtures.
4.2.1.2 Discussion of Slump Flow Test Results
As previously stated, all slump flow values fell within the specified range chosen in
earlier phases of this research effort. This conformance illustrated that each SCC mixture
was highly flowable and that the flowability was easily attained. Additionally, no trends
were noticed between changes in slump flow characteristics relative to changes in water-
to-cementitious materials (w/cm) ratios. Thus it can be reasoned that changes in the w/cm
have little bearing on slump flow values if the mixtures are properly proportioned to
account for this change.
A slight difference (< 4%) in the slump flow values was noticed between the fly ash
and the slag mixtures. However, such a small difference is negligible and could be caused
by a number of external variables which have no relation to the SCMs. Therefore it is
reasoned that varying these two SCMs has no significant effect on the slump flow values.
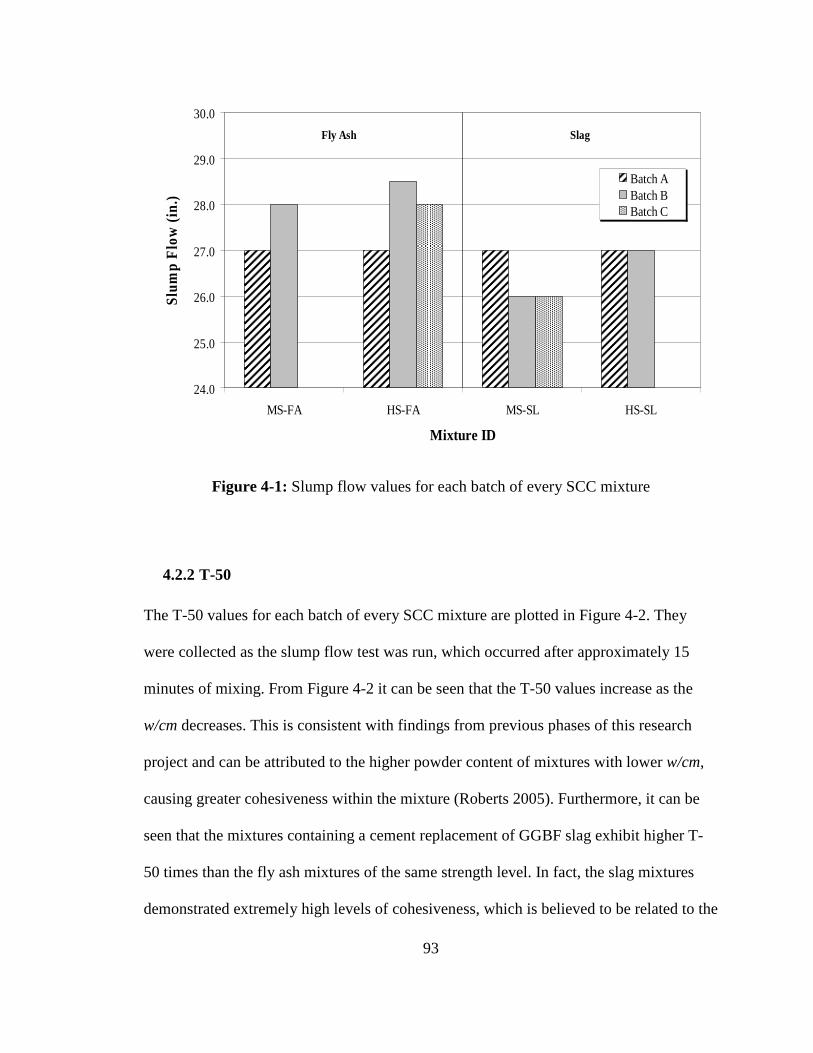
93
24.0
25.0
26.0
27.0
28.0
29.0
30.0
MS-FA HS-FA MS-SL HS-SL
Mixture ID
Slu
mp
Flo
w (
in.)
Batch ABatch BBatch C
Fly Ash Slag
Figure 4-1: Slump flow values for each batch of every SCC mixture
4.2.2 T-50
The T-50 values for each batch of every SCC mixture are plotted in Figure 4-2. They
were collected as the slump flow test was run, which occurred after approximately 15
minutes of mixing. From Figure 4-2 it can be seen that the T-50 values increase as the
w/cm decreases. This is consistent with findings from previous phases of this research
project and can be attributed to the higher powder content of mixtures with lower w/cm,
causing greater cohesiveness within the mixture (Roberts 2005). Furthermore, it can be
seen that the mixtures containing a cement replacement of GGBF slag exhibit higher T-
50 times than the fly ash mixtures of the same strength level. In fact, the slag mixtures
demonstrated extremely high levels of cohesiveness, which is believed to be related to the
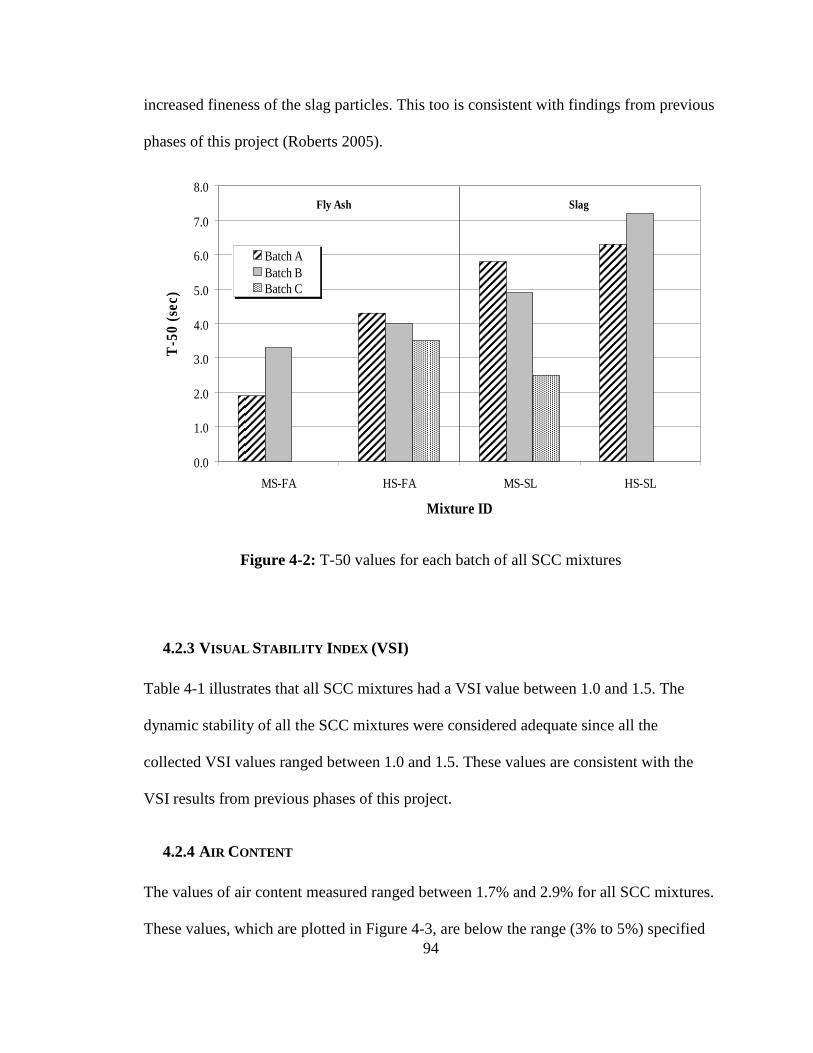
94
increased fineness of the slag particles. This too is consistent with findings from previous
phases of this project (Roberts 2005).
0.0
1.0
2.0
3.0
4.0
5.0
6.0
7.0
8.0
MS-FA HS-FA MS-SL HS-SL
Mixture ID
T-5
0 (s
ec)
Batch ABatch BBatch C
Fly Ash Slag
Figure 4-2: T-50 values for each batch of all SCC mixtures
4.2.3 VISUAL STABILITY INDEX (VSI)
Table 4-1 illustrates that all SCC mixtures had a VSI value between 1.0 and 1.5. The
dynamic stability of all the SCC mixtures were considered adequate since all the
collected VSI values ranged between 1.0 and 1.5. These values are consistent with the
VSI results from previous phases of this project.
4.2.4 AIR CONTENT
The values of air content measured ranged between 1.7% and 2.9% for all SCC mixtures.
These values, which are plotted in Figure 4-3, are below the range (3% to 5%) specified
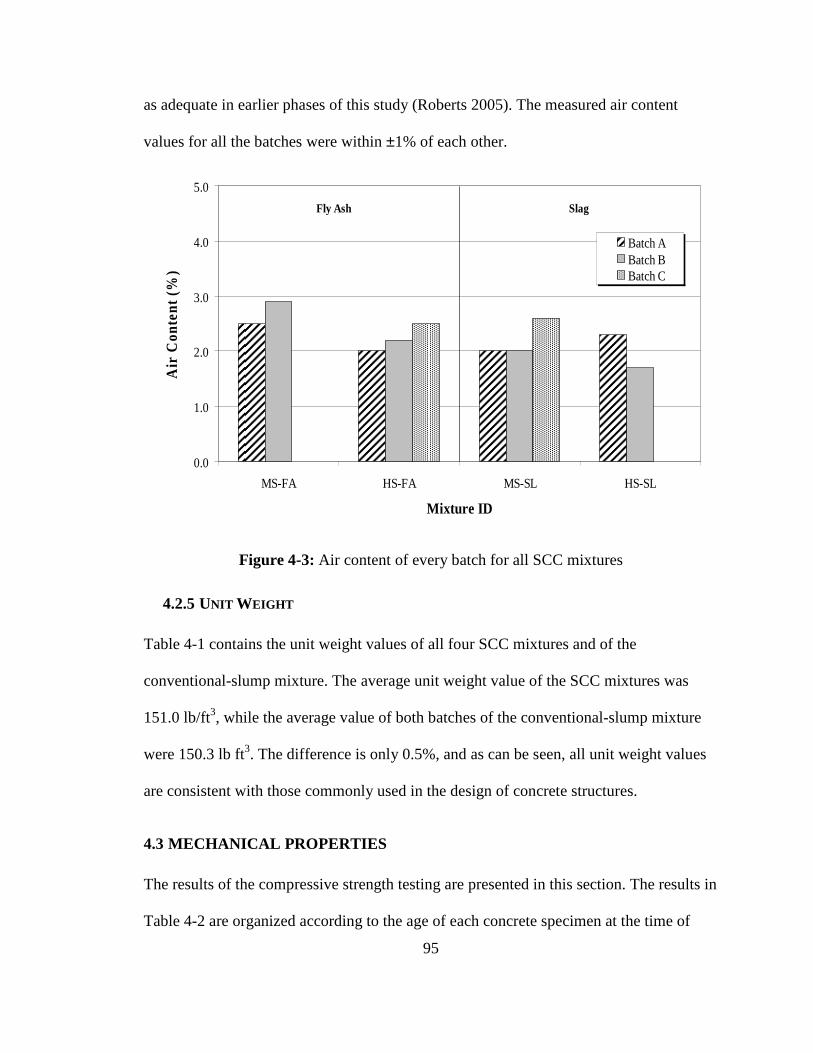
95
as adequate in earlier phases of this study (Roberts 2005). The measured air content
values for all the batches were within ±1% of each other.
0.0
1.0
2.0
3.0
4.0
5.0
MS-FA HS-FA MS-SL HS-SL
Mixture ID
Air
Con
tent
(%
)
Batch ABatch BBatch C
Fly Ash Slag
Figure 4-3: Air content of every batch for all SCC mixtures
4.2.5 UNIT WEIGHT
Table 4-1 contains the unit weight values of all four SCC mixtures and of the
conventional-slump mixture. The average unit weight value of the SCC mixtures was
151.0 lb/ft3, while the average value of both batches of the conventional-slump mixture
were 150.3 lb ft3. The difference is only 0.5%, and as can be seen, all unit weight values
are consistent with those commonly used in the design of concrete structures.
4.3 MECHANICAL PROPERTIES
The results of the compressive strength testing are presented in this section. The results in
Table 4-2 are organized according to the age of each concrete specimen at the time of
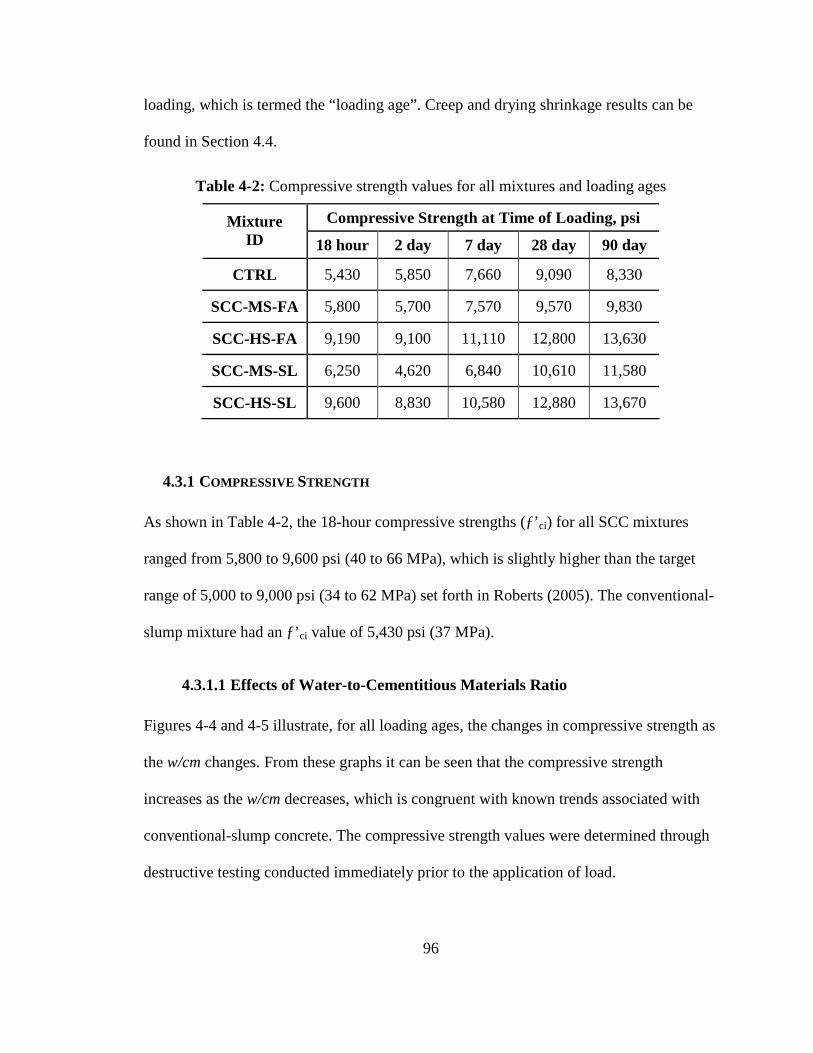
96
loading, which is termed the “loading age”. Creep and drying shrinkage results can be
found in Section 4.4.
Table 4-2: Compressive strength values for all mixtures and loading ages
Compressive Strength at Time of Loading, psi Mixture ID 18 hour 2 day 7 day 28 day 90 day
CTRL 5,430 5,850 7,660 9,090 8,330
SCC-MS-FA 5,800 5,700 7,570 9,570 9,830
SCC-HS-FA 9,190 9,100 11,110 12,800 13,630
SCC-MS-SL 6,250 4,620 6,840 10,610 11,580
SCC-HS-SL 9,600 8,830 10,580 12,880 13,670
4.3.1 COMPRESSIVE STRENGTH
As shown in Table 4-2, the 18-hour compressive strengths (ƒ’ ci) for all SCC mixtures
ranged from 5,800 to 9,600 psi (40 to 66 MPa), which is slightly higher than the target
range of 5,000 to 9,000 psi (34 to 62 MPa) set forth in Roberts (2005). The conventional-
slump mixture had an ƒ’ci value of 5,430 psi (37 MPa).
4.3.1.1 Effects of Water-to-Cementitious Materials Ratio
Figures 4-4 and 4-5 illustrate, for all loading ages, the changes in compressive strength as
the w/cm changes. From these graphs it can be seen that the compressive strength
increases as the w/cm decreases, which is congruent with known trends associated with
conventional-slump concrete. The compressive strength values were determined through
destructive testing conducted immediately prior to the application of load.
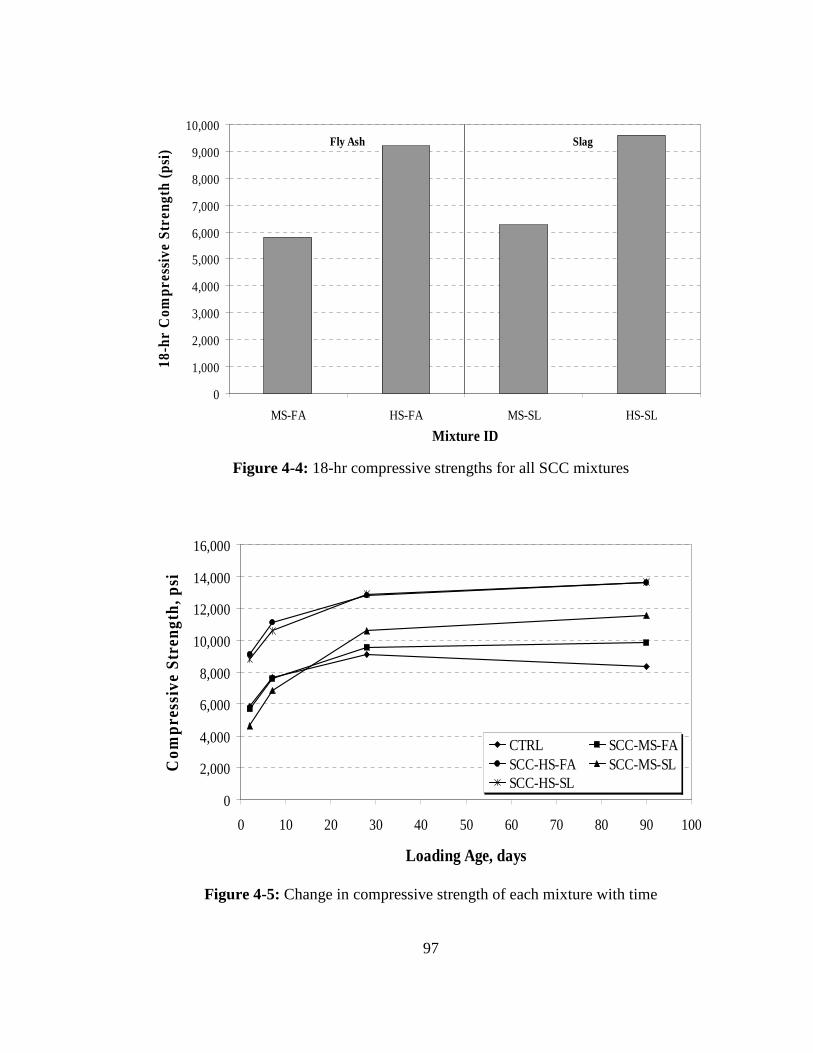
97
0
1,000
2,000
3,000
4,000
5,000
6,000
7,000
8,000
9,000
10,000
MS-FA HS-FA MS-SL HS-SL
Mixture ID
18-h
r C
ompr
essi
ve S
tren
gth
(psi
) Fly Ash Slag
Figure 4-4: 18-hr compressive strengths for all SCC mixtures
0
2,000
4,000
6,000
8,000
10,000
12,000
14,000
16,000
0 10 20 30 40 50 60 70 80 90 100
Loading Age, days
Com
pres
sive
Str
engt
h, p
si
CTRL SCC-MS-FASCC-HS-FA SCC-MS-SLSCC-HS-SL
Figure 4-5: Change in compressive strength of each mixture with time
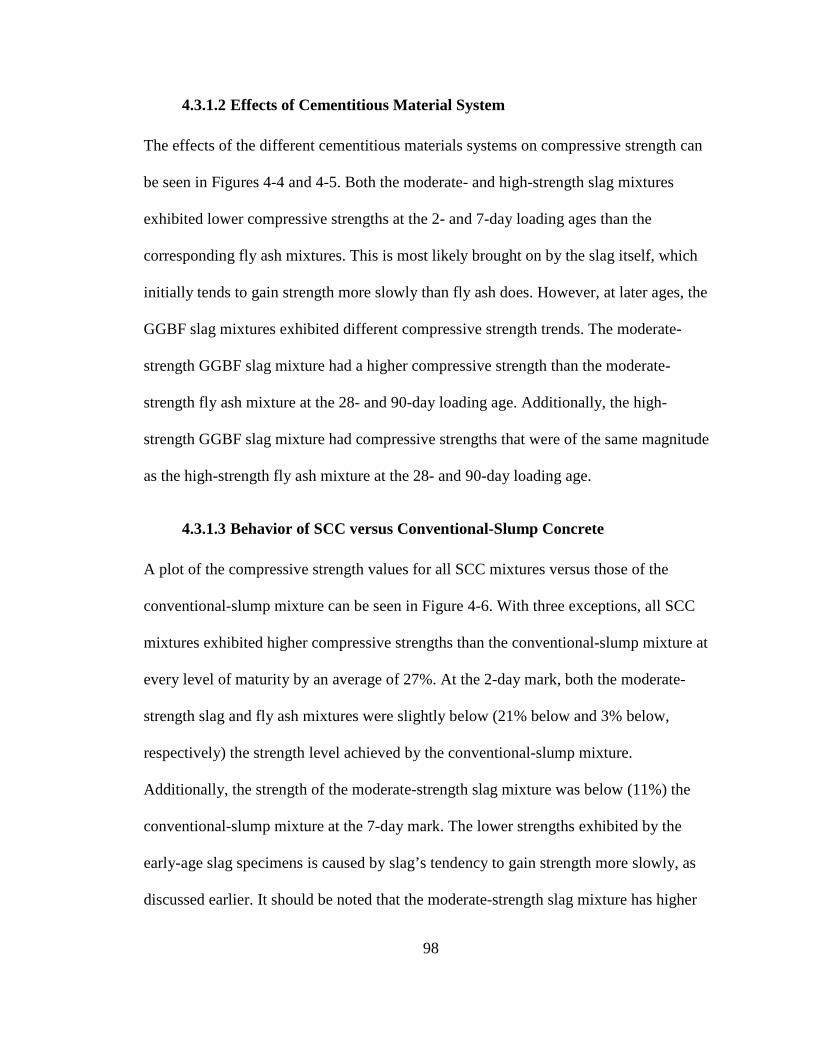
98
4.3.1.2 Effects of Cementitious Material System
The effects of the different cementitious materials systems on compressive strength can
be seen in Figures 4-4 and 4-5. Both the moderate- and high-strength slag mixtures
exhibited lower compressive strengths at the 2- and 7-day loading ages than the
corresponding fly ash mixtures. This is most likely brought on by the slag itself, which
initially tends to gain strength more slowly than fly ash does. However, at later ages, the
GGBF slag mixtures exhibited different compressive strength trends. The moderate-
strength GGBF slag mixture had a higher compressive strength than the moderate-
strength fly ash mixture at the 28- and 90-day loading age. Additionally, the high-
strength GGBF slag mixture had compressive strengths that were of the same magnitude
as the high-strength fly ash mixture at the 28- and 90-day loading age.
4.3.1.3 Behavior of SCC versus Conventional-Slump Concrete
A plot of the compressive strength values for all SCC mixtures versus those of the
conventional-slump mixture can be seen in Figure 4-6. With three exceptions, all SCC
mixtures exhibited higher compressive strengths than the conventional-slump mixture at
every level of maturity by an average of 27%. At the 2-day mark, both the moderate-
strength slag and fly ash mixtures were slightly below (21% below and 3% below,
respectively) the strength level achieved by the conventional-slump mixture.
Additionally, the strength of the moderate-strength slag mixture was below (11%) the
conventional-slump mixture at the 7-day mark. The lower strengths exhibited by the
early-age slag specimens is caused by slag’s tendency to gain strength more slowly, as
discussed earlier. It should be noted that the moderate-strength slag mixture has higher

99
strengths than the conventional-slump mixture at later ages. As for the moderate-strength
fly ash mixture, it displayed compressive strengths which were very similar to the
conventional-slump mixture at both the 2- and 7-day loading, but had slightly higher
compressive strengths at the 28-.and 90-day loading ages.
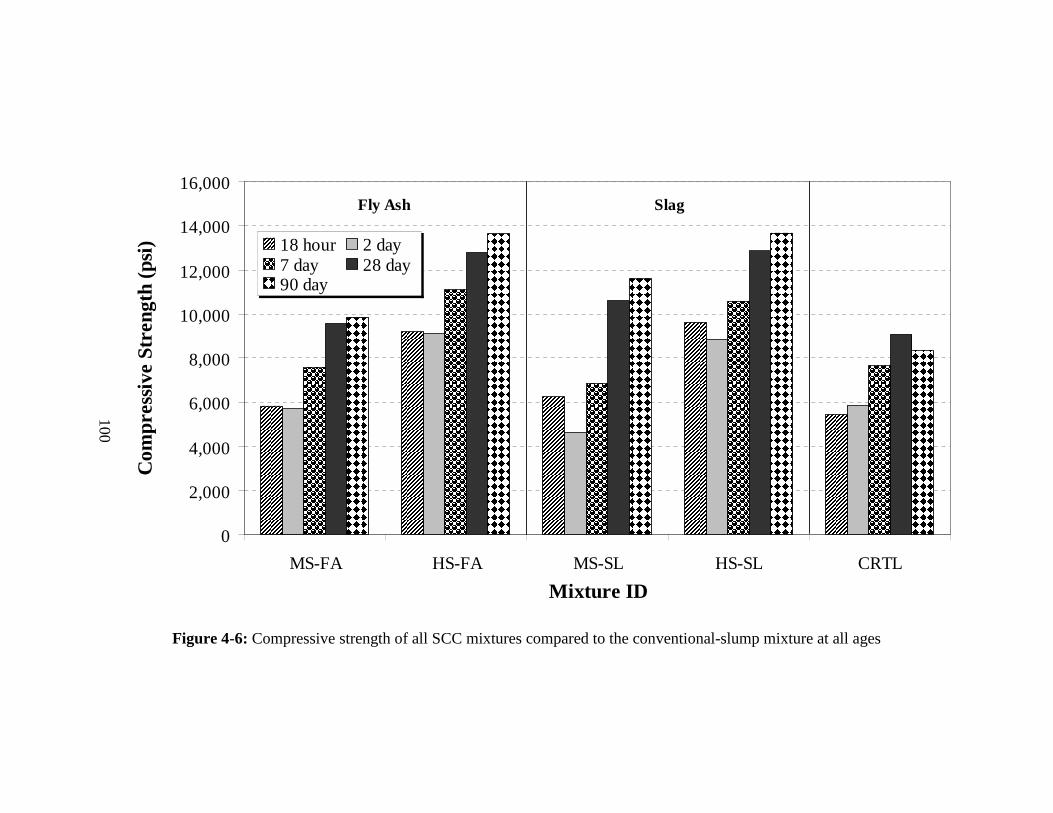
100
0
2,000
4,000
6,000
8,000
10,000
12,000
14,000
16,000
MS-FA HS-FA MS-SL HS-SL CRTL
Mixture ID
Com
pres
sive
Str
engt
h (p
si)
18 hour 2 day7 day 28 day90 day
Fly Ash Slag
Figure 4-6: Compressive strength of all SCC mixtures compared to the conventional-slump mixture at all ages

101
4.4 RESULTS FROM CREEP TESTING
The results from creep testing are presented in the section. Creep results, drying
shrinkage results, data on the environmental conditions in which creep testing was
performed, and data obtained while tracking the applied load are included. Table 4-3
contains the 365-day creep and drying shrinkage strain results for each loading age of the
concrete mixtures investigated in this study.
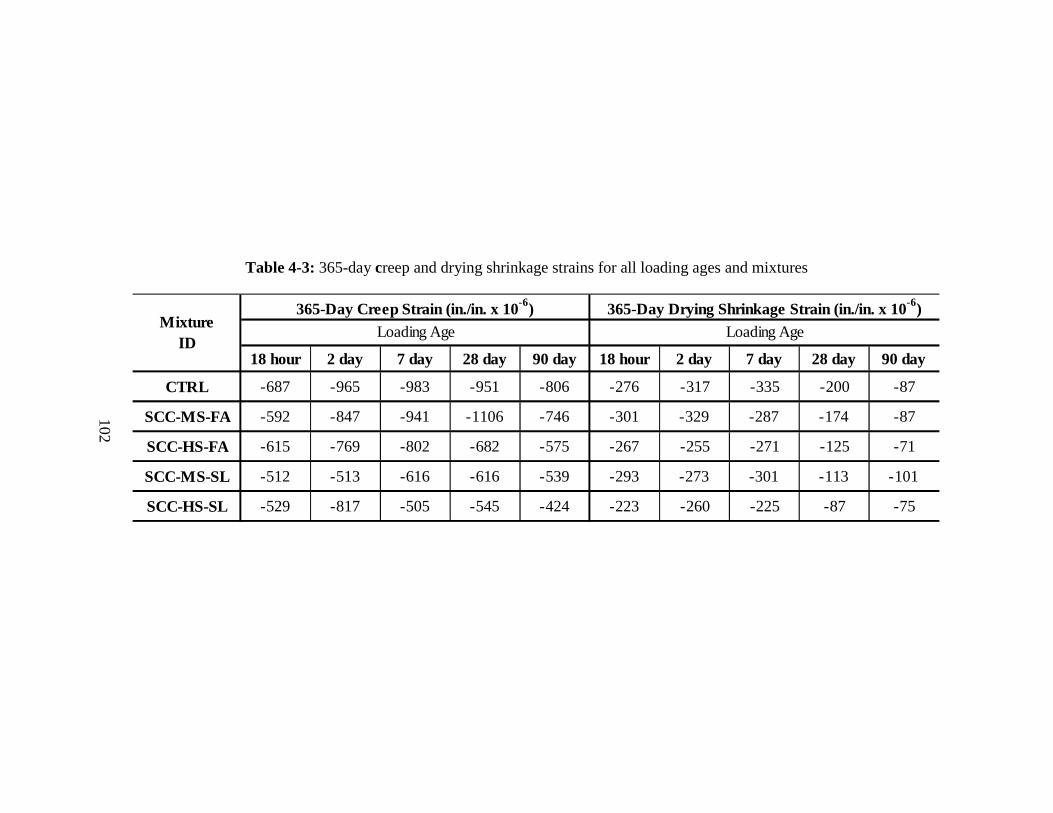
102
Table 4-3: 365-day creep and drying shrinkage strains for all loading ages and mixtures
18 hour 2 day 7 day 28 day 90 day 18 hour 2 day 7 day 28 day 90 day
CTRL -687 -965 -983 -951 -806 -276 -317 -335 -200 -87
SCC-MS-FA -592 -847 -941 -1106 -746 -301 -329 -287 -174 -87
SCC-HS-FA -615 -769 -802 -682 -575 -267 -255 -271 -125 -71
SCC-MS-SL -512 -513 -616 -616 -539 -293 -273 -301 -113 -101
SCC-HS-SL -529 -817 -505 -545 -424 -223 -260 -225 -87 -75
MixtureID
Loading AgeLoading Age
365-Day Creep Strain (in./in. x 10-6) 365-Day Drying Shrinkage Strain (in./in. x 10-6)
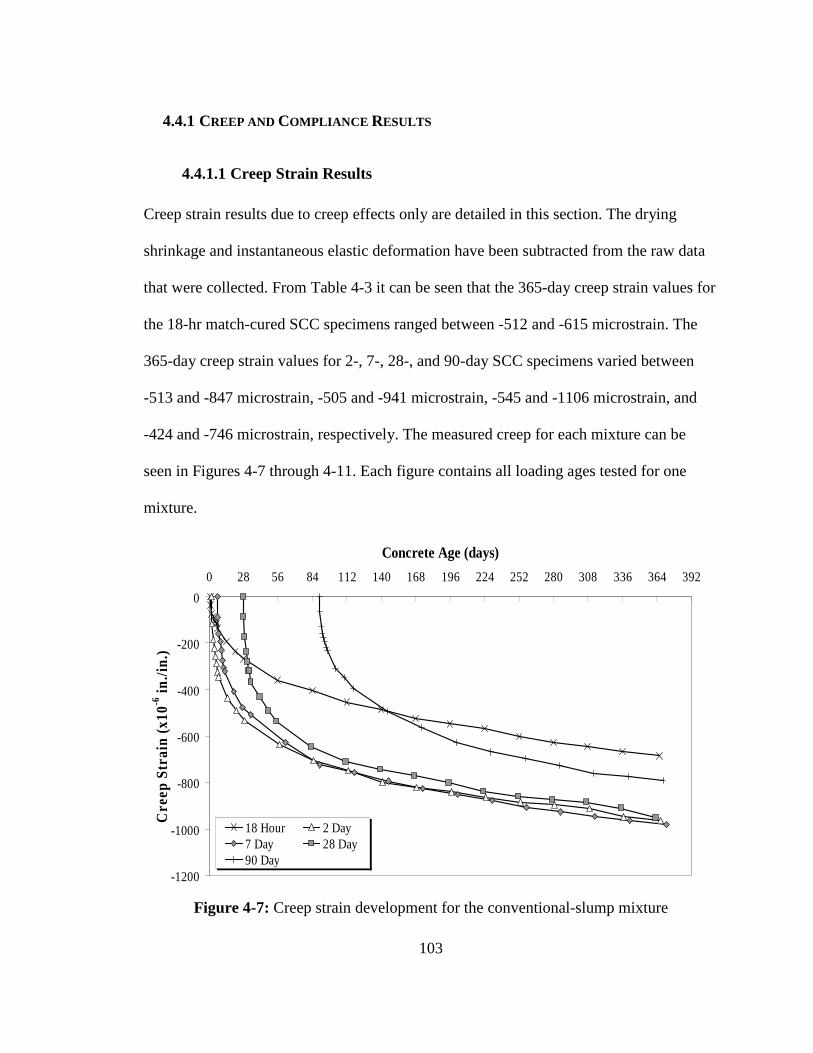
103
4.4.1 CREEP AND COMPLIANCE RESULTS
4.4.1.1 Creep Strain Results
Creep strain results due to creep effects only are detailed in this section. The drying
shrinkage and instantaneous elastic deformation have been subtracted from the raw data
that were collected. From Table 4-3 it can be seen that the 365-day creep strain values for
the 18-hr match-cured SCC specimens ranged between -512 and -615 microstrain. The
365-day creep strain values for 2-, 7-, 28-, and 90-day SCC specimens varied between
-513 and -847 microstrain, -505 and -941 microstrain, -545 and -1106 microstrain, and
-424 and -746 microstrain, respectively. The measured creep for each mixture can be
seen in Figures 4-7 through 4-11. Each figure contains all loading ages tested for one
mixture.
-1200
-1000
-800
-600
-400
-200
0
0 28 56 84 112 140 168 196 224 252 280 308 336 364 392
Concrete Age (days)
Cre
ep S
trai
n (x
10-6
in./i
n.)
18 Hour 2 Day7 Day 28 Day90 Day
Figure 4-7: Creep strain development for the conventional-slump mixture
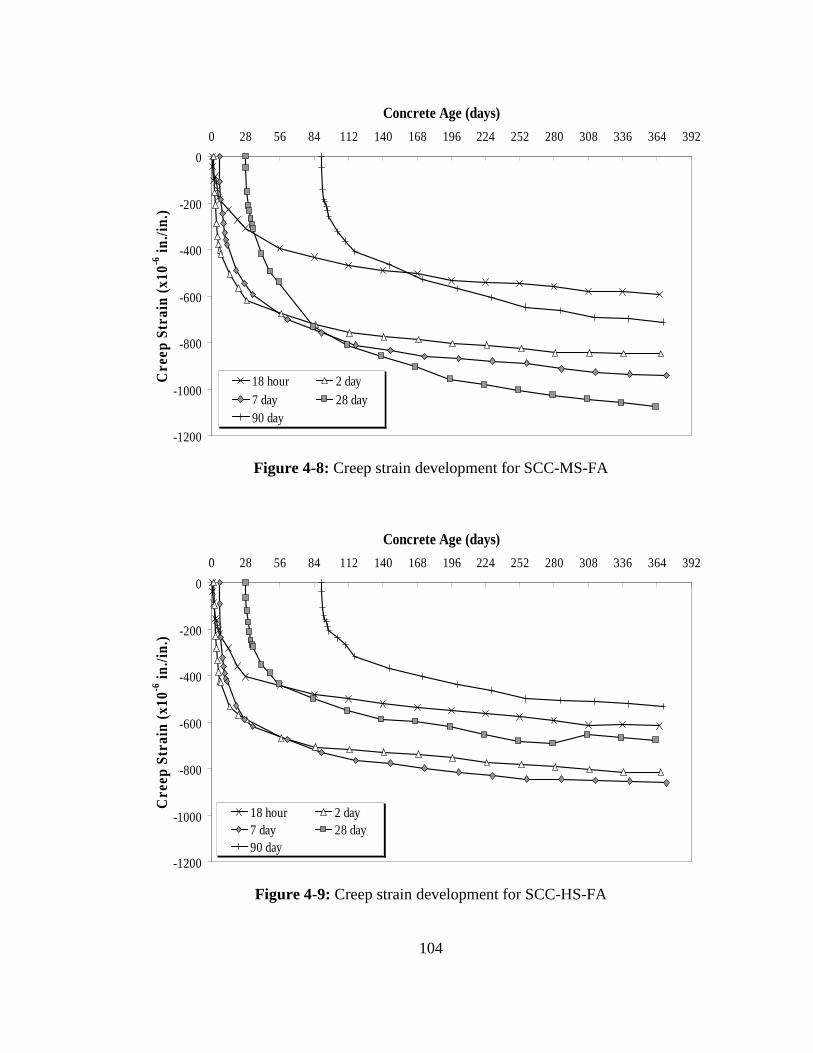
104
-1200
-1000
-800
-600
-400
-200
0
0 28 56 84 112 140 168 196 224 252 280 308 336 364 392
Concrete Age (days)
Cre
ep S
trai
n (x
10-6
in./i
n.)
18 hour 2 day7 day 28 day90 day
Figure 4-8: Creep strain development for SCC-MS-FA
-1200
-1000
-800
-600
-400
-200
0
0 28 56 84 112 140 168 196 224 252 280 308 336 364 392
Concrete Age (days)
Cre
ep S
trai
n (x
10-6
in./i
n.)
18 hour 2 day7 day 28 day90 day
Figure 4-9: Creep strain development for SCC-HS-FA
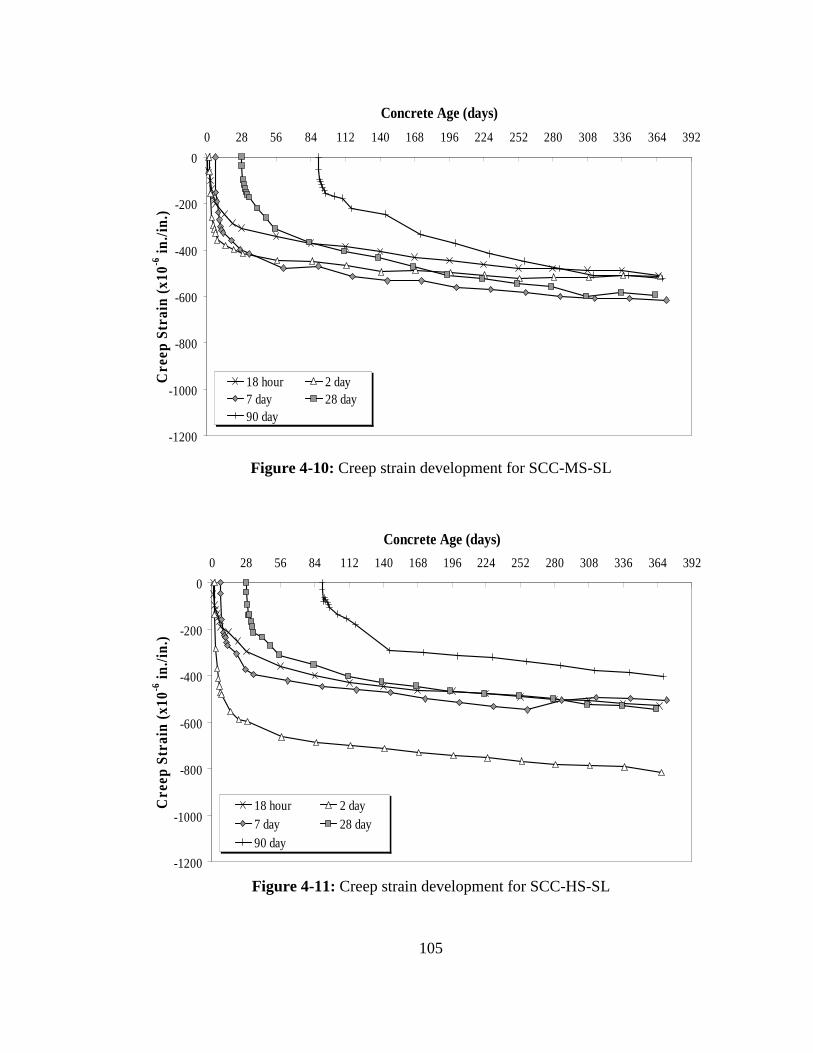
105
-1200
-1000
-800
-600
-400
-200
0
0 28 56 84 112 140 168 196 224 252 280 308 336 364 392
Concrete Age (days)
Cre
ep S
trai
n (x
10-6
in./i
n.)
18 hour 2 day7 day 28 day90 day
Figure 4-10: Creep strain development for SCC-MS-SL
-1200
-1000
-800
-600
-400
-200
0
0 28 56 84 112 140 168 196 224 252 280 308 336 364 392
Concrete Age (days)
Cre
ep S
trai
n (x
10-6
in./i
n.)
18 hour 2 day7 day 28 day90 day
Figure 4-11: Creep strain development for SCC-HS-SL
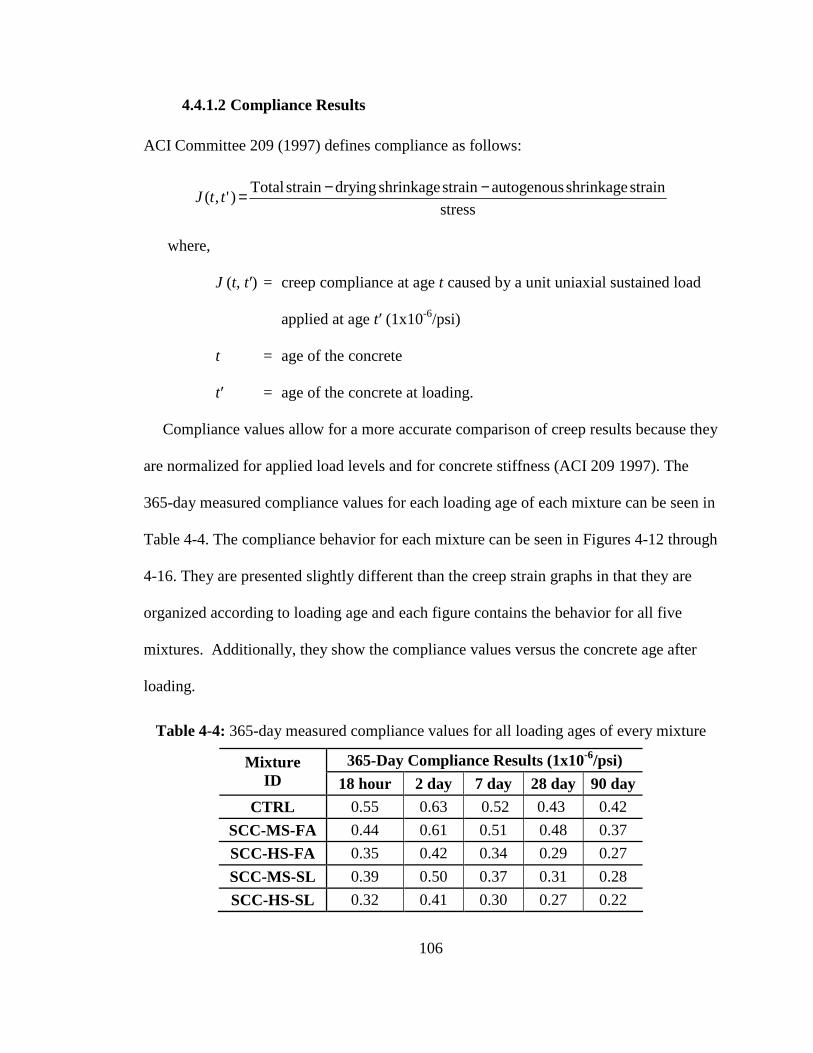
106
4.4.1.2 Compliance Results
ACI Committee 209 (1997) defines compliance as follows:
stress
strainshrinkageautogenousstrainshrinkagedryingstrainTotal)',(
−−=ttJ
where,
J (t, t′) = creep compliance at age t caused by a unit uniaxial sustained load
applied at age t′ (1x10⁻⁶/psi)
t = age of the concrete
t′ = age of the concrete at loading.
Compliance values allow for a more accurate comparison of creep results because they
are normalized for applied load levels and for concrete stiffness (ACI 209 1997). The
365-day measured compliance values for each loading age of each mixture can be seen in
Table 4-4. The compliance behavior for each mixture can be seen in Figures 4-12 through
4-16. They are presented slightly different than the creep strain graphs in that they are
organized according to loading age and each figure contains the behavior for all five
mixtures. Additionally, they show the compliance values versus the concrete age after
loading.
Table 4-4: 365-day measured compliance values for all loading ages of every mixture
365-Day Compliance Results (1x10⁻⁶/psi) Mixture ID 18 hour 2 day 7 day 28 day 90 day
CTRL 0.55 0.63 0.52 0.43 0.42
SCC-MS-FA 0.44 0.61 0.51 0.48 0.37
SCC-HS-FA 0.35 0.42 0.34 0.29 0.27
SCC-MS-SL 0.39 0.50 0.37 0.31 0.28
SCC-HS-SL 0.32 0.41 0.30 0.27 0.22
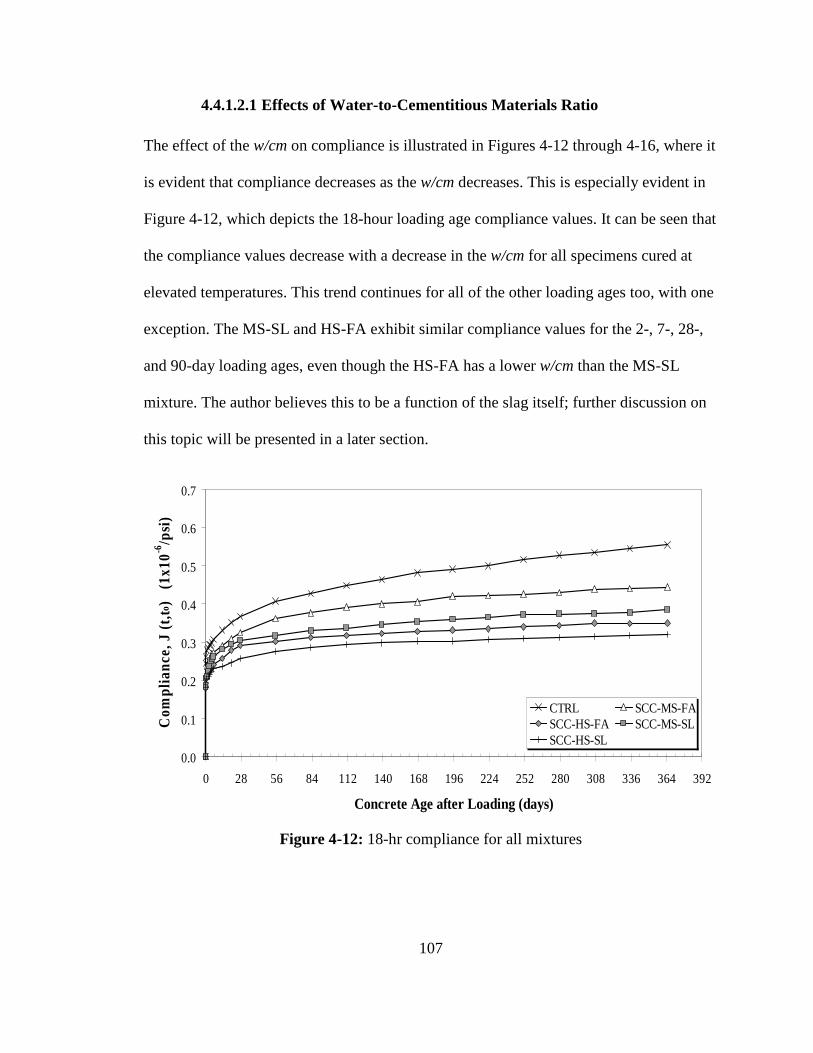
107
4.4.1.2.1 Effects of Water-to-Cementitious Materials Ratio
The effect of the w/cm on compliance is illustrated in Figures 4-12 through 4-16, where it
is evident that compliance decreases as the w/cm decreases. This is especially evident in
Figure 4-12, which depicts the 18-hour loading age compliance values. It can be seen that
the compliance values decrease with a decrease in the w/cm for all specimens cured at
elevated temperatures. This trend continues for all of the other loading ages too, with one
exception. The MS-SL and HS-FA exhibit similar compliance values for the 2-, 7-, 28-,
and 90-day loading ages, even though the HS-FA has a lower w/cm than the MS-SL
mixture. The author believes this to be a function of the slag itself; further discussion on
this topic will be presented in a later section.
0.0
0.1
0.2
0.3
0.4
0.5
0.6
0.7
0 28 56 84 112 140 168 196 224 252 280 308 336 364 392
Concrete Age after Loading (days)
Com
plia
nce,
J (
t,to )
(1
x10-6
/psi
)
CTRL SCC-MS-FASCC-HS-FA SCC-MS-SLSCC-HS-SL
Figure 4-12: 18-hr compliance for all mixtures
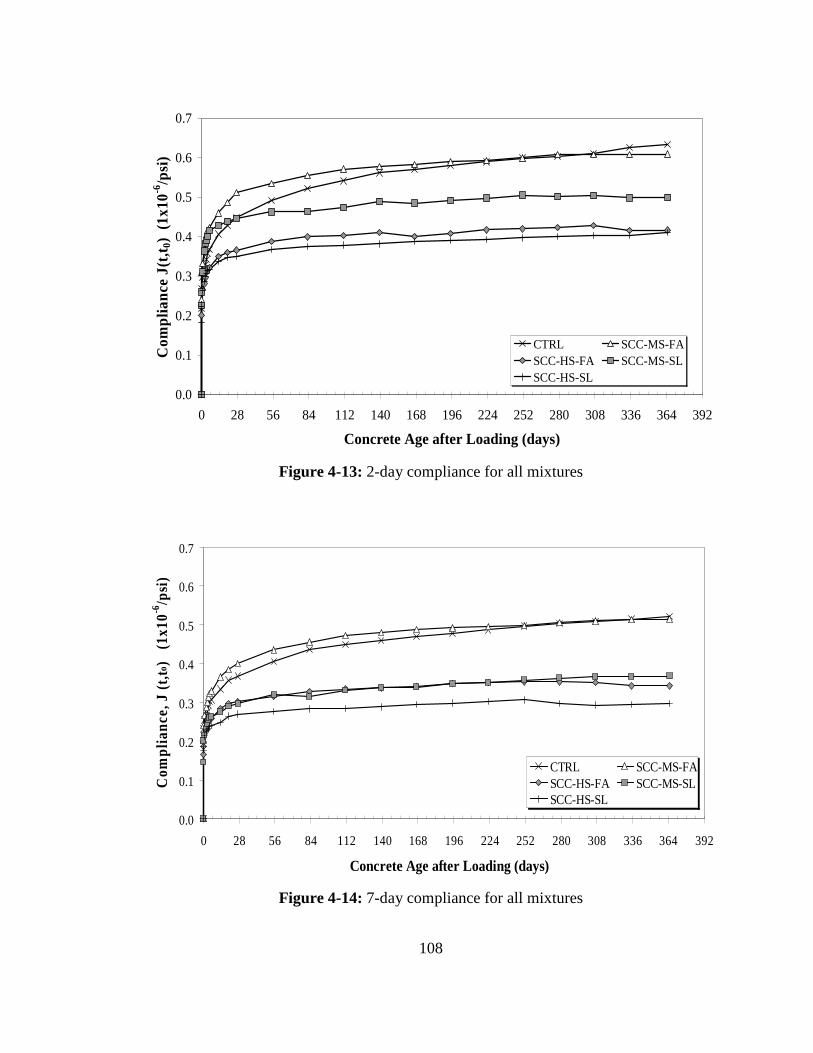
108
0.0
0.1
0.2
0.3
0.4
0.5
0.6
0.7
0 28 56 84 112 140 168 196 224 252 280 308 336 364 392
Concrete Age after Loading (days)
Com
plia
nce
J(t,t
0) (
1x10
-6/p
si)
CTRL SCC-MS-FASCC-HS-FA SCC-MS-SLSCC-HS-SL
Figure 4-13: 2-day compliance for all mixtures
0.0
0.1
0.2
0.3
0.4
0.5
0.6
0.7
0 28 56 84 112 140 168 196 224 252 280 308 336 364 392
Concrete Age after Loading (days)
Com
plia
nce,
J (
t,to )
(1
x10-6
/psi
)
CTRL SCC-MS-FASCC-HS-FA SCC-MS-SLSCC-HS-SL
Figure 4-14: 7-day compliance for all mixtures
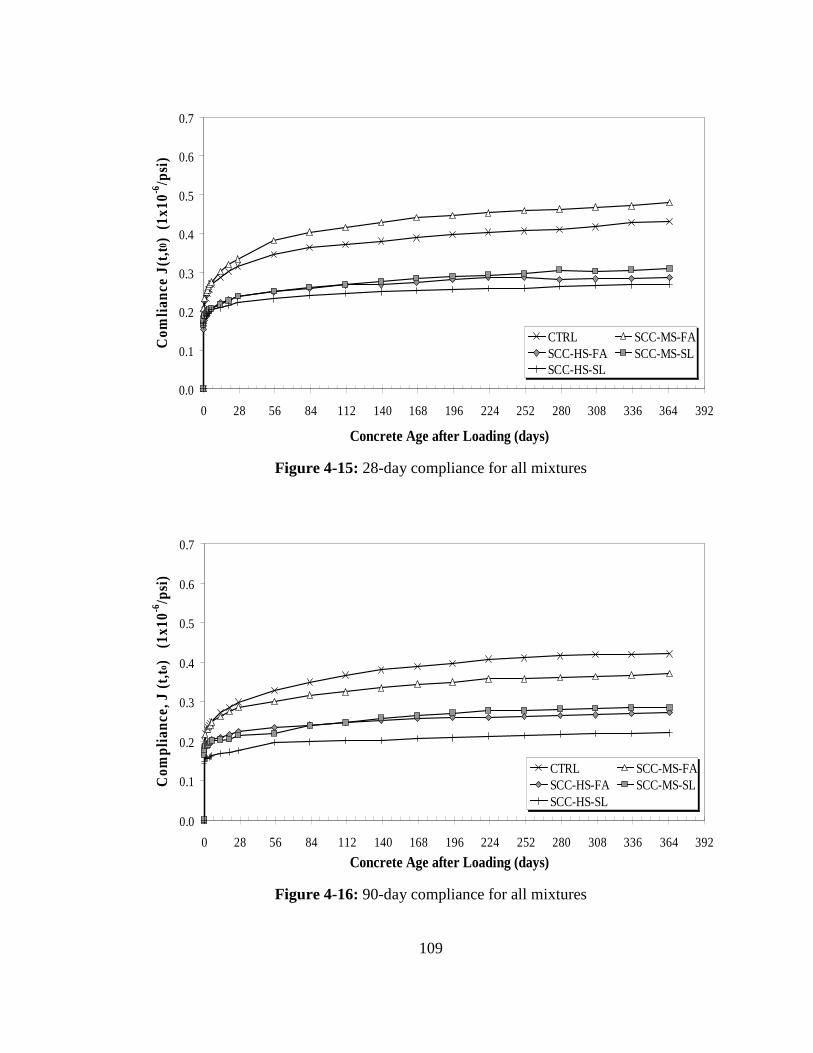
109
0.0
0.1
0.2
0.3
0.4
0.5
0.6
0.7
0 28 56 84 112 140 168 196 224 252 280 308 336 364 392
Concrete Age after Loading (days)
Com
lianc
e J(
t,t0 )
(1x
10-6
/psi
)
CTRL SCC-MS-FASCC-HS-FA SCC-MS-SLSCC-HS-SL
Figure 4-15: 28-day compliance for all mixtures
0.0
0.1
0.2
0.3
0.4
0.5
0.6
0.7
0 28 56 84 112 140 168 196 224 252 280 308 336 364 392
Concrete Age after Loading (days)
Com
plia
nce,
J (
t,to )
(1
x10-6
/psi
)
CTRL SCC-MS-FASCC-HS-FA SCC-MS-SLSCC-HS-SL
Figure 4-16: 90-day compliance for all mixtures
110
4.4.1.2.2 Effects of Cementitious Materials System
The effects different cementitious materials systems have on the compliance values can
be evaluated from the results shown in Figures 4-12 through 4-16. On the whole, the
compliance values associated with the slag mixtures are lower than those measured for
the fly ash mixtures when only mixtures of similar strengths are compared.
The most surprising trend that was noted related to the moderate-strength slag mixture.
This mixture exhibited far lower compliance values (on average, 31% lower) than its
contemporary in the fly ash category. Furthermore, as previously stated, the moderate-
strength slag mixture exhibited similar compliance values to the high-strength fly ash
mixture at the 7-, 28-, and 90-day loading ages. The reasoning behind this trend is
believed to be related to the dense micropore structure and low permeability commonly
associated with concrete comprised of a cement replacement of GGBF slag.
4.4.1.2.3 Behavior of SCC versus Conventional-Slump Concrete
Figure 4-17 shows the compliance results of all loading ages for all SCC mixtures
relative to the compliance results of the conventional-slump mixture. For the 18-hour
loading age (i.e. the accelerated curing condition), the compliance values of all the SCC
mixtures are less than the conventional-slump mixture. The compliance values for all
loading ages shown are also less for the moderate-strength GGBF slag mixture, and for
both high-strength SCC mixtures as compared to the corresponding control mixture
compliance values. At loading ages of 28 and 90 days, the 365-day compliance is
approximately 18% greater and 13% less, respectively, for Mixture SCC-MS-FA than for
the control mixture. These differences are not very large. Thus, for practical purposes,

111
the creep behavior is similar for the moderate-strength fly ash SCC and conventional-
slump concrete.
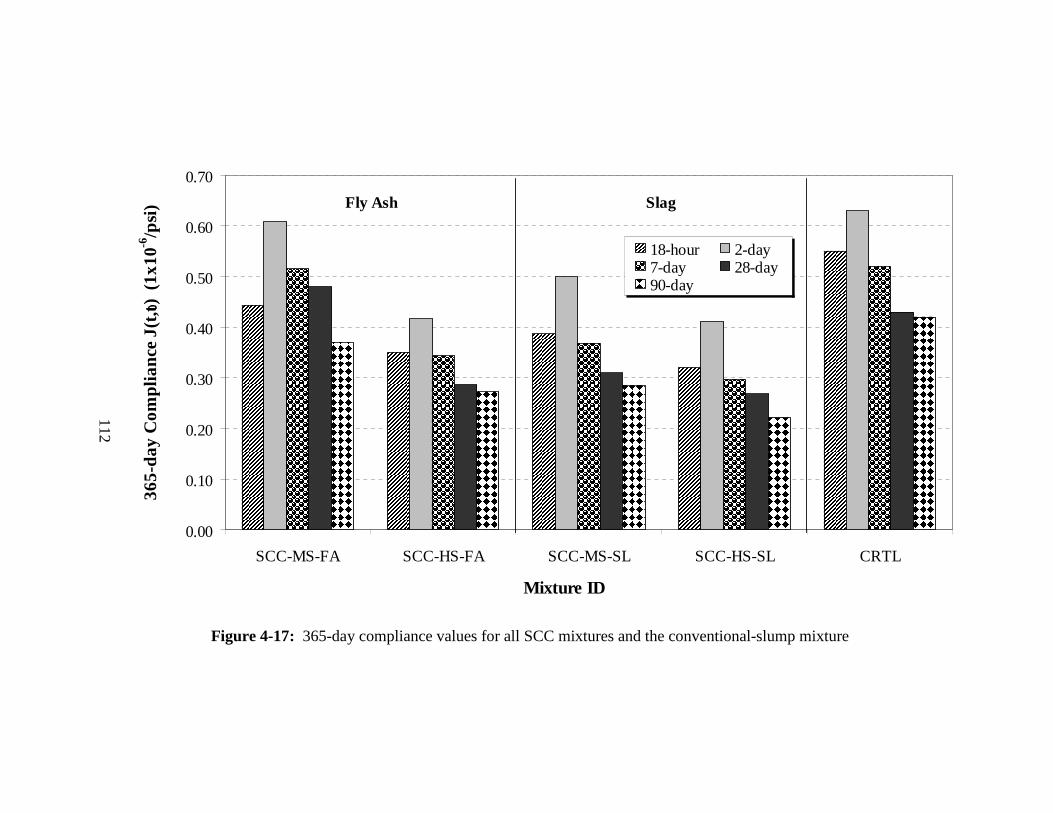
112
0.00
0.10
0.20
0.30
0.40
0.50
0.60
0.70
SCC-MS-FA SCC-HS-FA SCC-MS-SL SCC-HS-SL CRTL
Mixture ID
36
5-d
ay
Co
mpl
ianc
e J(
t,t 0) (
1x1
0-6/p
si)
18-hour 2-day7-day 28-day90-day
Fly Ash Slag
Figure 4-17: 365-day compliance values for all SCC mixtures and the conventional-slump mixture
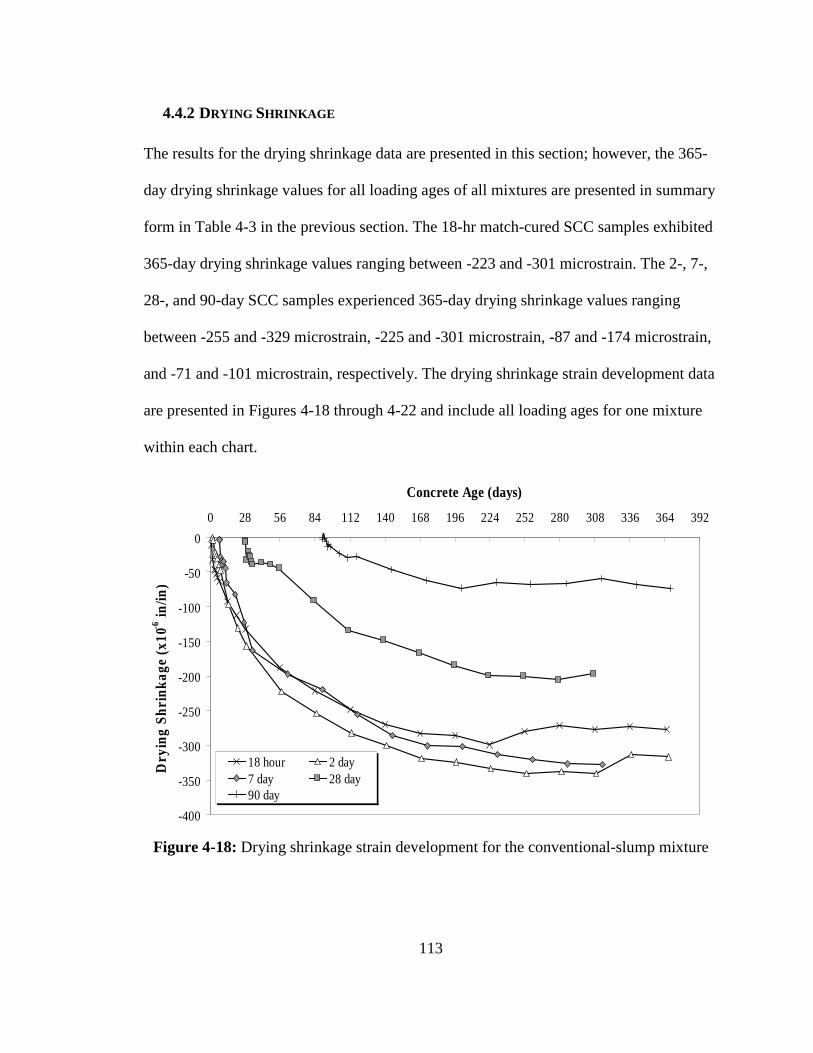
113
4.4.2 DRYING SHRINKAGE
The results for the drying shrinkage data are presented in this section; however, the 365-
day drying shrinkage values for all loading ages of all mixtures are presented in summary
form in Table 4-3 in the previous section. The 18-hr match-cured SCC samples exhibited
365-day drying shrinkage values ranging between -223 and -301 microstrain. The 2-, 7-,
28-, and 90-day SCC samples experienced 365-day drying shrinkage values ranging
between -255 and -329 microstrain, -225 and -301 microstrain, -87 and -174 microstrain,
and -71 and -101 microstrain, respectively. The drying shrinkage strain development data
are presented in Figures 4-18 through 4-22 and include all loading ages for one mixture
within each chart.
-400
-350
-300
-250
-200
-150
-100
-50
0
0 28 56 84 112 140 168 196 224 252 280 308 336 364 392
Concrete Age (days)
Dry
ing
Shr
inka
ge (
x10-6
in/in
)
18 hour 2 day7 day 28 day90 day
Figure 4-18: Drying shrinkage strain development for the conventional-slump mixture
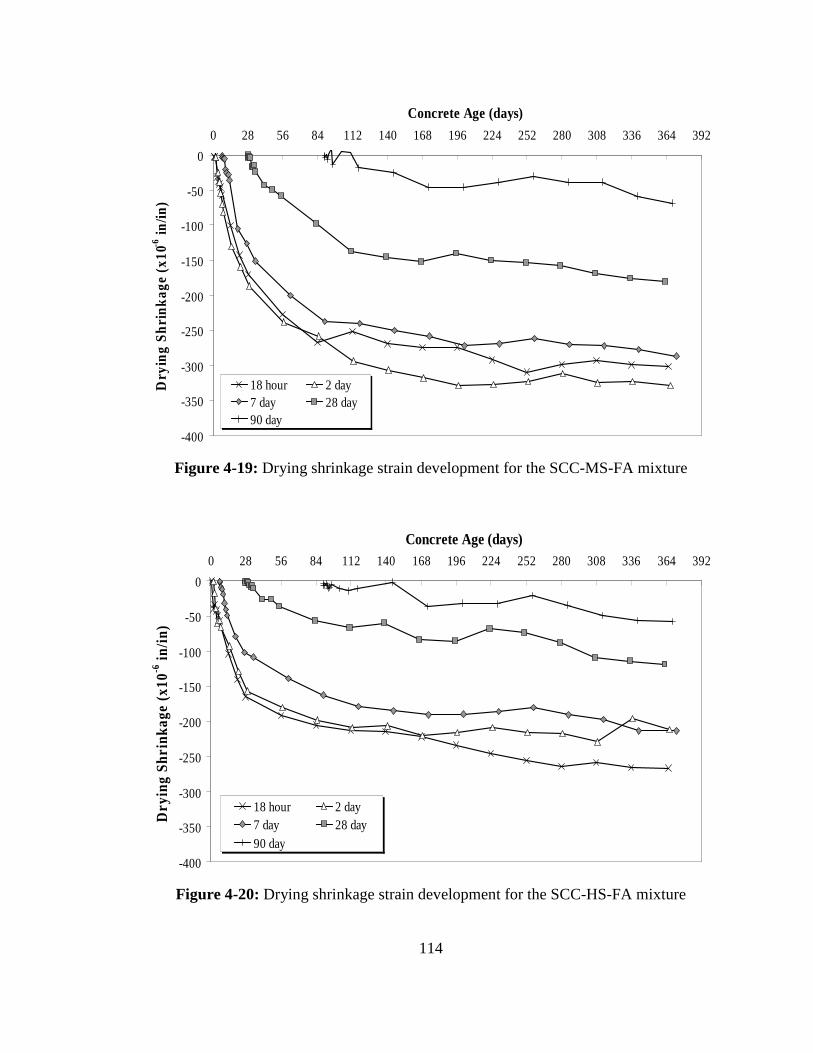
114
-400
-350
-300
-250
-200
-150
-100
-50
0
0 28 56 84 112 140 168 196 224 252 280 308 336 364 392
Concrete Age (days)
Dry
ing
Shr
inka
ge (
x10-6
in/in
)
18 hour 2 day7 day 28 day90 day
Figure 4-19: Drying shrinkage strain development for the SCC-MS-FA mixture
-400
-350
-300
-250
-200
-150
-100
-50
0
0 28 56 84 112 140 168 196 224 252 280 308 336 364 392
Concrete Age (days)
Dry
ing
Shr
inka
ge (
x10-6
in/in
)
18 hour 2 day7 day 28 day90 day
Figure 4-20: Drying shrinkage strain development for the SCC-HS-FA mixture
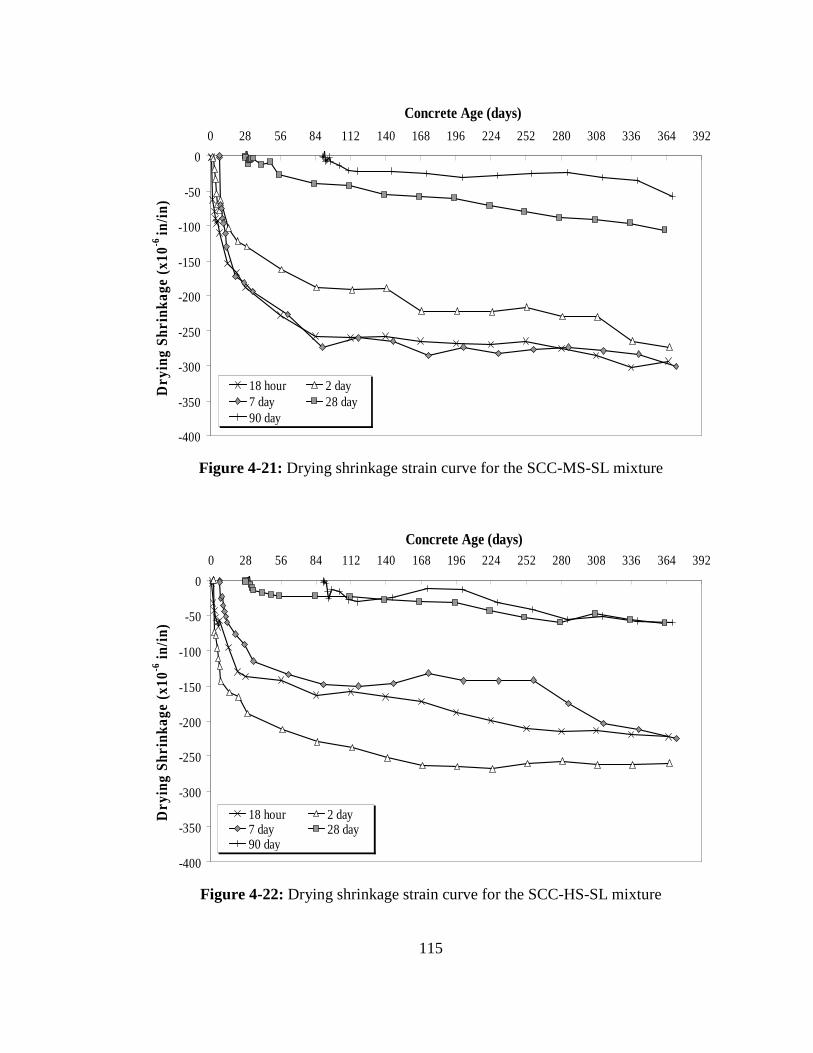
115
-400
-350
-300
-250
-200
-150
-100
-50
0
0 28 56 84 112 140 168 196 224 252 280 308 336 364 392
Concrete Age (days)
Dry
ing
Shr
inka
ge (
x10-6
in/in
)
18 hour 2 day7 day 28 day90 day
Figure 4-21: Drying shrinkage strain curve for the SCC-MS-SL mixture
-400
-350
-300
-250
-200
-150
-100
-50
0
0 28 56 84 112 140 168 196 224 252 280 308 336 364 392
Concrete Age (days)
Dry
ing
Shr
inka
ge (
x10-6
in/in
)
18 hour 2 day7 day 28 day90 day
Figure 4-22: Drying shrinkage strain curve for the SCC-HS-SL mixture
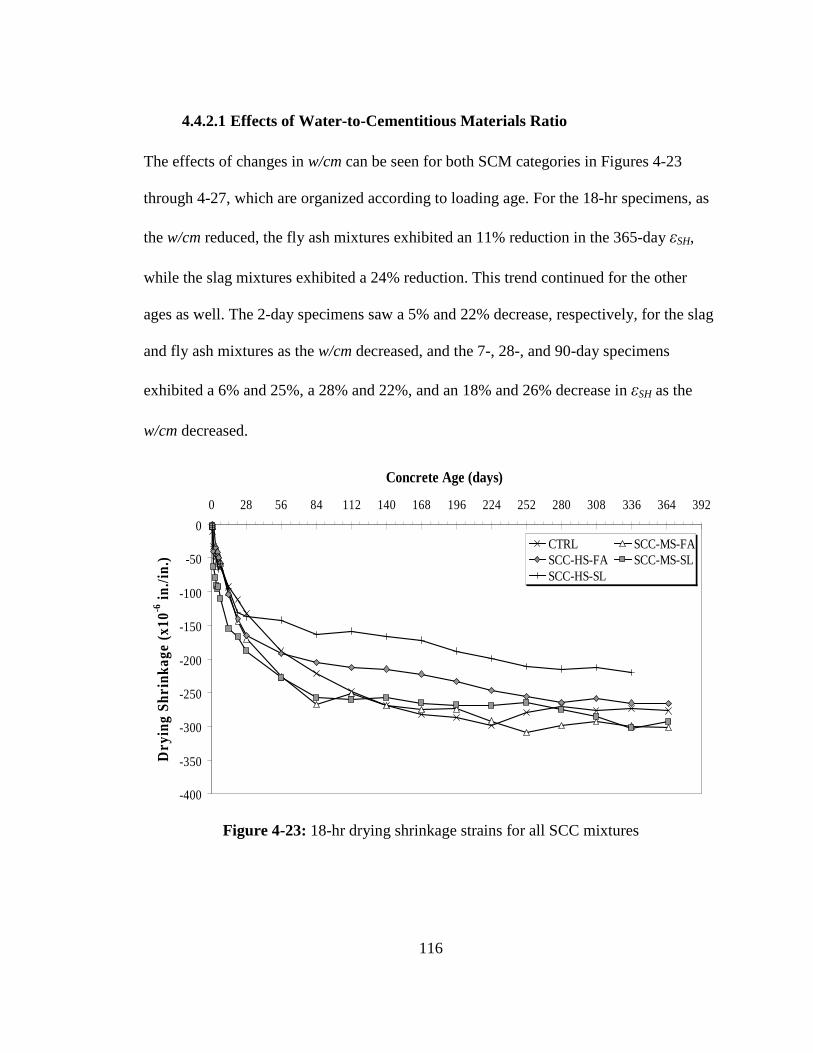
116
4.4.2.1 Effects of Water-to-Cementitious Materials Ratio
The effects of changes in w/cm can be seen for both SCM categories in Figures 4-23
through 4-27, which are organized according to loading age. For the 18-hr specimens, as
the w/cm reduced, the fly ash mixtures exhibited an 11% reduction in the 365-day εSH,
while the slag mixtures exhibited a 24% reduction. This trend continued for the other
ages as well. The 2-day specimens saw a 5% and 22% decrease, respectively, for the slag
and fly ash mixtures as the w/cm decreased, and the 7-, 28-, and 90-day specimens
exhibited a 6% and 25%, a 28% and 22%, and an 18% and 26% decrease in εSH as the
w/cm decreased.
-400
-350
-300
-250
-200
-150
-100
-50
0
0 28 56 84 112 140 168 196 224 252 280 308 336 364 392
Concrete Age (days)
Dry
ing
Shr
inka
ge (
x10-6
in./i
n.)
CTRL SCC-MS-FASCC-HS-FA SCC-MS-SLSCC-HS-SL
Figure 4-23: 18-hr drying shrinkage strains for all SCC mixtures
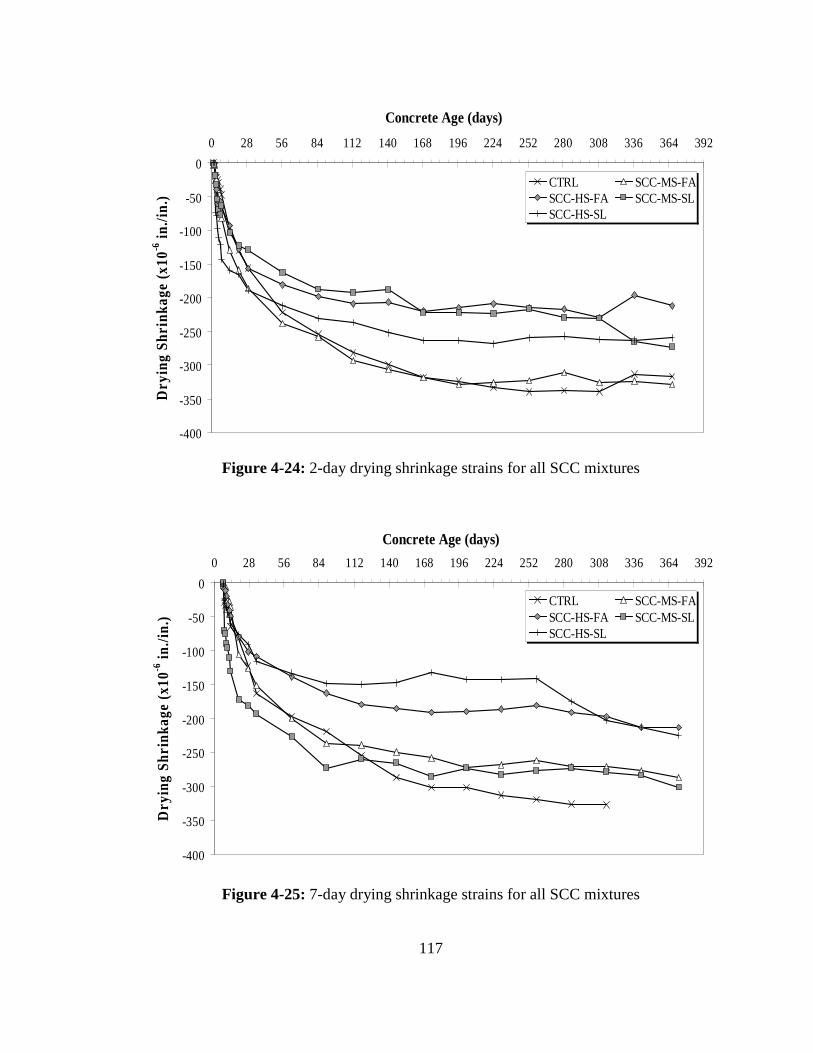
117
-400
-350
-300
-250
-200
-150
-100
-50
0
0 28 56 84 112 140 168 196 224 252 280 308 336 364 392
Concrete Age (days)
Dry
ing
Shr
inka
ge (
x10-6
in./i
n.)
CTRL SCC-MS-FASCC-HS-FA SCC-MS-SLSCC-HS-SL
Figure 4-24: 2-day drying shrinkage strains for all SCC mixtures
-400
-350
-300
-250
-200
-150
-100
-50
0
0 28 56 84 112 140 168 196 224 252 280 308 336 364 392
Concrete Age (days)
Dry
ing
Shr
inka
ge (
x10-6
in./i
n.)
CTRL SCC-MS-FASCC-HS-FA SCC-MS-SLSCC-HS-SL
Figure 4-25: 7-day drying shrinkage strains for all SCC mixtures
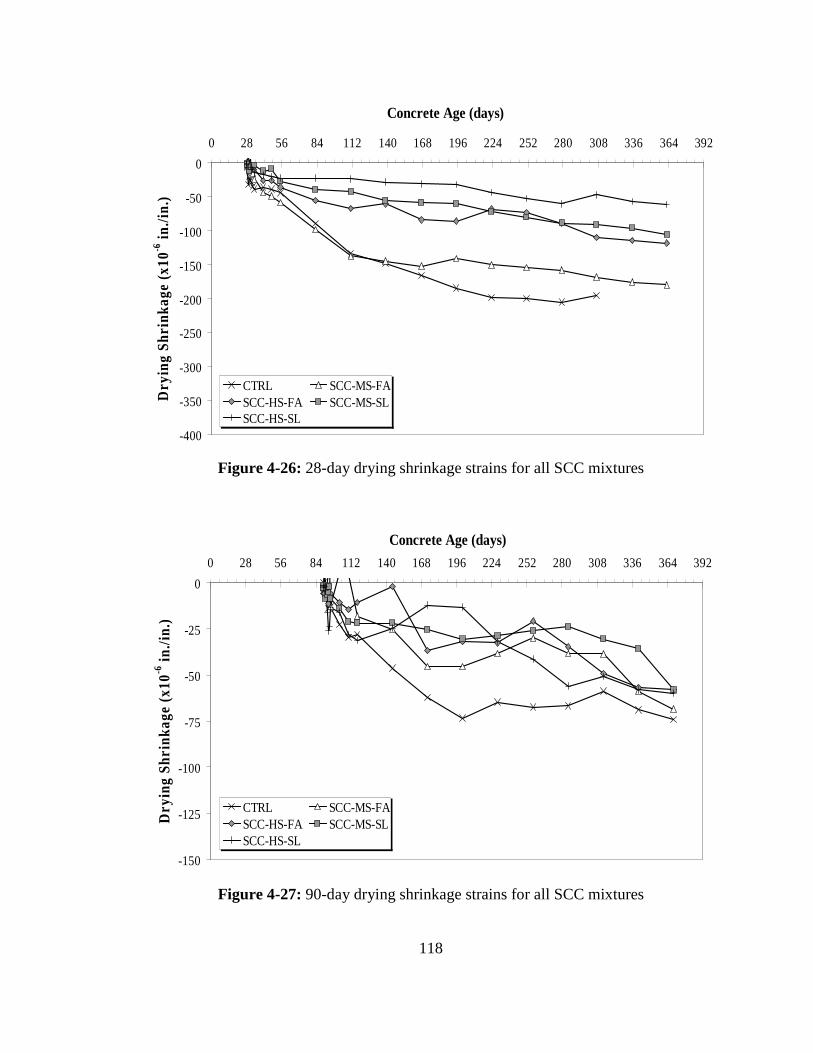
118
-400
-350
-300
-250
-200
-150
-100
-50
0
0 28 56 84 112 140 168 196 224 252 280 308 336 364 392
Concrete Age (days)
Dry
ing
Shr
inka
ge (
x10-6
in./i
n.)
CTRL SCC-MS-FASCC-HS-FA SCC-MS-SLSCC-HS-SL
Figure 4-26: 28-day drying shrinkage strains for all SCC mixtures
-150
-125
-100
-75
-50
-25
0
0 28 56 84 112 140 168 196 224 252 280 308 336 364 392
Concrete Age (days)
Dry
ing
Shr
inka
ge (
x10-6
in./i
n.)
CTRL SCC-MS-FASCC-HS-FA SCC-MS-SLSCC-HS-SL
Figure 4-27: 90-day drying shrinkage strains for all SCC mixtures

119
4.4.2.2 Effects of Cementitious Materials System
The effects both slag and fly ash had on εSH can be seen in Figures 4-23 through 4-27,
which are arranged according to the loading age of the test specimens. From those
figures, no definitive trend can be seen that occurs over all loading ages. On average,
there is less than an 8% difference in εSH between the fly ash and slag mixtures at all
loading ages. The only outlier is in the 28-day specimens of SCC-HS-SL, where the 365-
day drying shrinkage strain value is -87 microstrain. Aside from this data point, all other
specimens exhibited εSH values within 10% of each other. It can thus be concluded that
no appreciable difference in drying shrinkage exists between the SCC mixture containing
slag and the one containing fly ash.
4.4.2.3 Behavior of SCC versus Conventional-Slump Concrete
The analysis that follows is illustrated in Figure 4-28, which shows the 365-day drying
shrinkage strain values for all loading ages of all SCC mixtures against those of the
conventional-slump mixture. No obvious trends present themselves here either, except
one. All SCC mixtures share comparable drying shrinkage traits with the conventional-
slump mixture. For this reason, it is believed that members constructed from the SCC
mixtures tested in this study should behave similarly to those built using conventional-
slump concrete, with no abnormally large drying shrinkage strains expected.
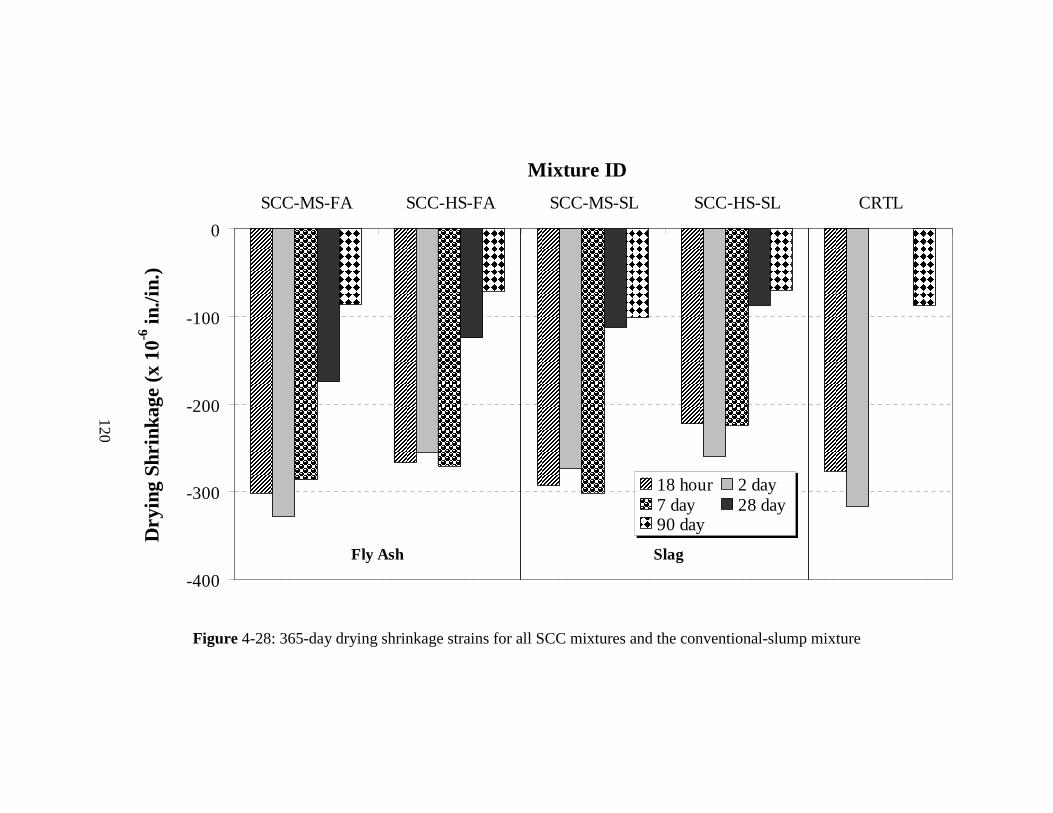
120
-400
-300
-200
-100
0
SCC-MS-FA SCC-HS-FA SCC-MS-SL SCC-HS-SL CRTL
Mixture IDD
ryin
g S
hrin
kage
(x
10-6 in
./in.
)
18 hour 2 day7 day 28 day90 day
Fly Ash Slag
Figure 4-28: 365-day drying shrinkage strains for all SCC mixtures and the conventional-slump mixture
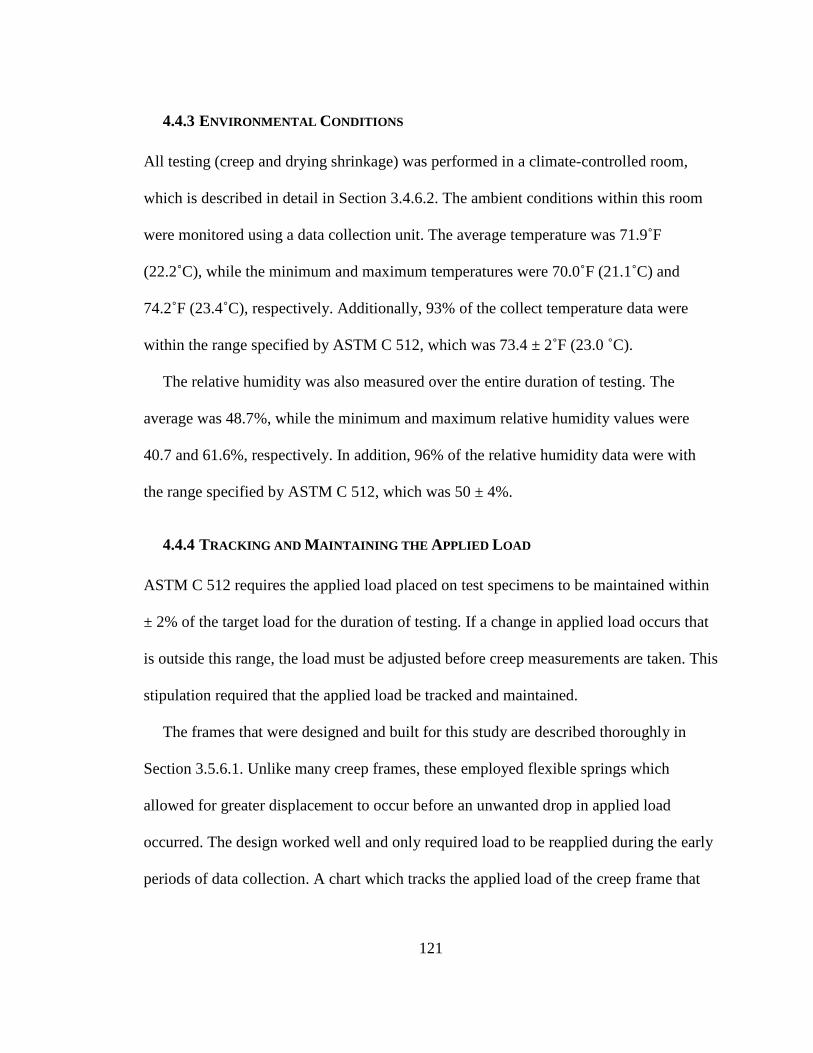
121
4.4.3 ENVIRONMENTAL CONDITIONS
All testing (creep and drying shrinkage) was performed in a climate-controlled room,
which is described in detail in Section 3.4.6.2. The ambient conditions within this room
were monitored using a data collection unit. The average temperature was 71.9˚F
(22.2˚C), while the minimum and maximum temperatures were 70.0˚F (21.1˚C) and
74.2˚F (23.4˚C), respectively. Additionally, 93% of the collect temperature data were
within the range specified by ASTM C 512, which was 73.4 ± 2˚F (23.0 ˚C).
The relative humidity was also measured over the entire duration of testing. The
average was 48.7%, while the minimum and maximum relative humidity values were
40.7 and 61.6%, respectively. In addition, 96% of the relative humidity data were with
the range specified by ASTM C 512, which was 50 ± 4%.
4.4.4 TRACKING AND MAINTAINING THE APPLIED LOAD
ASTM C 512 requires the applied load placed on test specimens to be maintained within
± 2% of the target load for the duration of testing. If a change in applied load occurs that
is outside this range, the load must be adjusted before creep measurements are taken. This
stipulation required that the applied load be tracked and maintained.
The frames that were designed and built for this study are described thoroughly in
Section 3.5.6.1. Unlike many creep frames, these employed flexible springs which
allowed for greater displacement to occur before an unwanted drop in applied load
occurred. The design worked well and only required load to be reapplied during the early
periods of data collection. A chart which tracks the applied load of the creep frame that

122
contained the 18-hour specimen of the control mixture is shown in Figure 4-29. One of
these charts was created for each of the 25 frames used during testing.
As stated above, all creep frames were maintained within ± 2%, except one. The frame
containing the 90-day test specimen for SCC-HS-FA was allowed to exceed the specified
range because cracks were noticed on the specimens themselves. To avoid increasing
crack widths, it was decided that the applied load would be allowed to decrease. The
largest difference recorded for the concrete specimens was -4.69%.
55
56
57
58
59
60
61
62
63
64
65
1 10 100 1000Time (Days)
App
lied
Loa
d (k
ips)
±2% ErrorTarget LoadMeasured Load
Figure 4-29: The applied load on the 18-hour specimen of the control mixture
Table 4-5 contains the maximum positive and negative percent error values for all 25
mixtures. From this table, it can be seen that all mixtures stayed within the ± 2% applied
load range specified in ASTM C 512, except for the one SCC-HS-FA case noted above.
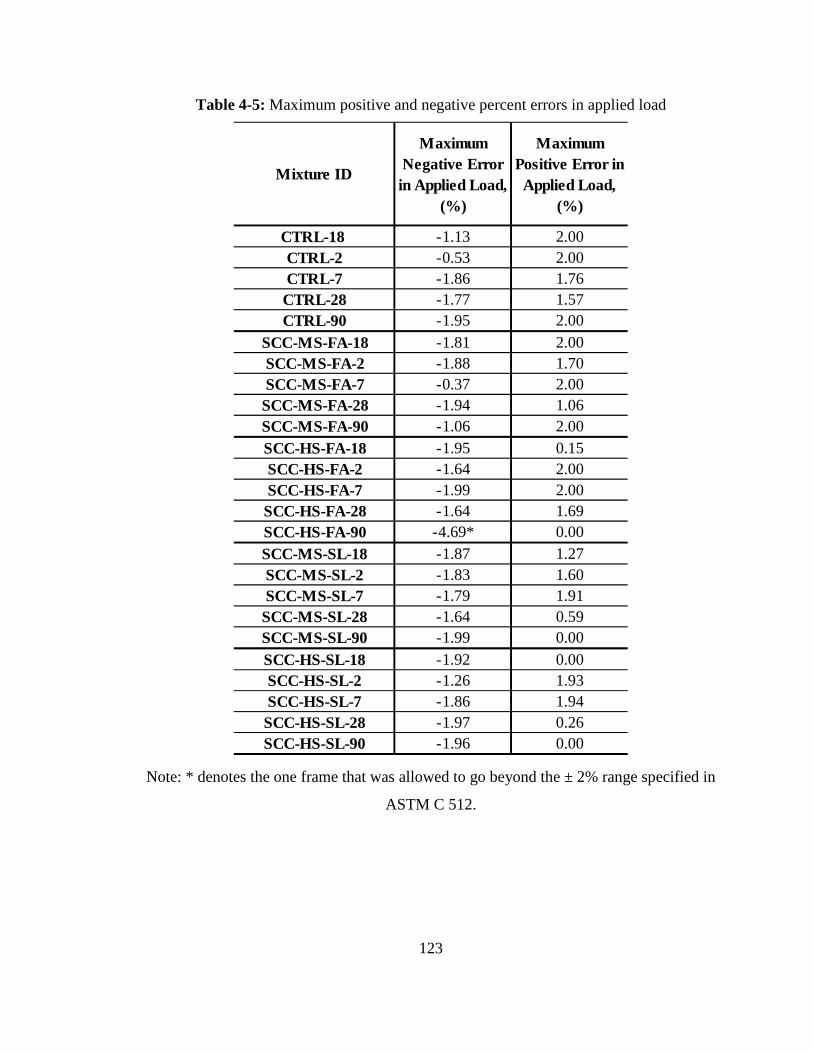
123
Table 4-5: Maximum positive and negative percent errors in applied load
Mixture ID
Maximum Negative Error in Applied Load,
(%)
Maximum Positive Error in Applied Load,
(%)
CTRL-18 -1.13 2.00CTRL-2 -0.53 2.00CTRL-7 -1.86 1.76CTRL-28 -1.77 1.57CTRL-90 -1.95 2.00
SCC-MS-FA-18 -1.81 2.00SCC-MS-FA-2 -1.88 1.70SCC-MS-FA-7 -0.37 2.00SCC-MS-FA-28 -1.94 1.06SCC-MS-FA-90 -1.06 2.00SCC-HS-FA-18 -1.95 0.15SCC-HS-FA-2 -1.64 2.00SCC-HS-FA-7 -1.99 2.00SCC-HS-FA-28 -1.64 1.69SCC-HS-FA-90 -4.69* 0.00SCC-MS-SL-18 -1.87 1.27SCC-MS-SL-2 -1.83 1.60SCC-MS-SL-7 -1.79 1.91SCC-MS-SL-28 -1.64 0.59SCC-MS-SL-90 -1.99 0.00
SCC-HS-SL-18 -1.92 0.00SCC-HS-SL-2 -1.26 1.93SCC-HS-SL-7 -1.86 1.94SCC-HS-SL-28 -1.97 0.26SCC-HS-SL-90 -1.96 0.00
Note: * denotes the one frame that was allowed to go beyond the ± 2% range specified in
ASTM C 512.
124
4.5 RAPID CHLORIDE ION PENETRATION TEST
To determine the resistance of each concrete mixture to the rapid penetration of chloride
ions, tests were conducted in accordance with ASTM C 1202 (2005). Table 4-6, which
indicates the chloride ion penetration of concrete based on the charge passed, was taken
directly from ASTM C 1202 (2005). It indicates the penetrability of concrete based on
the range of measured charge. Table 4-7 shows the average values that were measured for
each mixture in this study. There it may be seen that all of the SCC mixtures registered
average charges that were in the very low range. Even the conventional-slump mixture
registered an average value that was low.
Table 4-6: Chloride ion penetrability based on charge passed (ASTM C 1202 2005)
Charge Passed (coulombs) Chloride Ion Penetrability>4,000 High2,000-4,000 Moderate1,000-2,000 Low100-1,000 Very Low<100 Negligible
Table 4-7: Average 91-day total charge measured and resulting penetrability
Mixture IDAverage Total
Charge, coulombsChloride Ion Penetrability
CTRL 1866 LowSCC-MS-FA 530 Very LowSCC-HS-FA 224 Very LowSCC-MA-SL 558 Very LowSCC-HS-SL 503 Very Low

125
4.6 LESSONS LEARNED THROUGH TESTING
This section details experienced gained over the course of performing the tests outlined in
ASTM C 512. Here the reader will find information regarding lessons learned while
designing and building the creep frames, preparing the test specimens, and conducting
creep testing.
4.6.1 DESIGNING AND BUILDING CREEP FRAMES
This section outlines lessons learned through the design-build process of this study.
4.6.1.1 Creep Frame Design
For the most part, the creep frames that were designed for this study performed very well,
and the material choices were well thought-out. One portion of the frame design that
worked quite well was the spring assembly. As stated earlier in this report, the springs
allowed relatively large displacements to occur before requiring the reapplication of
applied load. In fact, the only time load needed to be reapplied was in the early phases of
testing when relatively large amounts of creep occurred. Beyond the one month time
point, no frame needed to have load reapplied.
In contrast to the superb performance of the springs, the caster arrangement was less
satisfactory; however, it should be noted that the casters themselves were a good idea.
They just needed to be rearranged to allow for greater mobility in tight areas. The two
swivel casters, which were the only casters that were able to turn and promote mobility,
were placed on the wrong side of the lower static reaction plate. In their present location,
they were unable to swivel a full 360 degrees due to interference with two of the steel
bars that protruded through the plate and restricted rotation. For future frame designs it
126
would be best if the swivel casters were placed on the side of the lower static reaction
plate that contains only one protruding steel bar.
The addition of more alignment marks would also be a design improvement. These
marks were used to help align the springs on the lower static reaction plate and the test
specimens onto the upper floating reaction plate; however, they would also be helpful in
other locations. For instance, alignment marks should be placed on top of the upper
floating reaction plate to help align the bottom of the jacking mechanism and on the
underside of the upper static reaction plate to help align the jack vertically. Both of these
improvements would help to further limit the possibilities of having eccentrically loaded
specimens.
4.6.1.2 Creep Frame Construction
The construction process became easier as more frames were built and more knowledge
was gained in the area. It became clear after building one or two frames that the easiest
way to construct these frames was in the horizontal position due to the heavy nature of all
the pieces.
The process began by attaching all casters to the lower static reaction plate and then
locking the swivel casters so they were inline with the non-rotating casters. At this point,
the steel rods were inserted into the lower static reaction plate and nuts were tightened
down on the top and bottom of the plate to secure the rod firmly to the plate. Next the
springs were slid into place. With the springs in place, the lower floating reaction plate
was aligned on the steel rods and slid into place. Then all the necessary nuts were
threaded on to the rods and the upper floating reaction plate was moved into place. This
127
process was repeated for the upper static reaction plate. When all plates were in place, the
frame was lifted upright using an overhead gantry-crane. With the frame in the upright
position, the strain gauges were installed and were coated with a protective coating.
After completing the construction process, each frame was load tested to determine the
accuracy of the strain measuring instrumentation. This process entailed loading test
specimens into the frames and applying load up to 120 kips and then releasing the load.
This was done three times and the measured load was recorded at 20 kips intervals on
each run and checked against the known applied load. After the completion of the final
run, a calibration factor was assigned to the frame in order to improve the accuracy of the
applied load measurement. When this was complete, the frame was ready for service.
4.6.2 PREPARING SPECIMENS
Many lessons were learned while preparing the test specimens for testing. This section
outlines that experience and includes information on casting and final specimen
preparation.
4.6.2.1 Mixing and Casting Specimens
During the mixing and casting phase of this study, it was determined that batch size was
critical. Too large of a batch required extra time to homogenize the mixture constituents.
This reduced the time available for fresh properties testing and actual casting. Therefore,
as previously stated, it was decided that no batch be larger that 5.5 ft3. This meant that
multiple batches were mixed, which was not the ideal condition, but the quality of the
finished specimens greatly improved by following this guideline.
128
Furthermore, as was previously stated, the air-entraining admixture (AEA) was left out
of the final mixtures. This was decided upon after preliminary mixing revealed erratic air-
content values between different batches of the same mixture. By leaving the AEA out,
this problem was circumvented and all batches were much more uniform.
4.6.2.2 Final Specimen Preparation
After curing was complete, all specimens were capped with a sulfur-based compound.
This compound needed to harden properly before any load was applied. For this reason,
all specimens were capped before attaching the Demountable Mechanical (DEMEC)
points. This allowed all specimens extra time to harden before any testing took place.
This also proved to be a more efficient use of time.
After the proper amount of time was allowed for hardening, the strength specimens
were tested and the ultimate strength of the test specimens determined. At this point, the
creep test specimens were loaded into the frames and the load was applied.
4.6.3 CONDUCTING CREEP TESTING
ASTM C 512 is not a test that is run with any great regularity. For this reason, there is a
certain level of uncertainty involved; however, after going through the process several
times, many of the “kinks” were worked out and the best procedure was determined. This
section outlines lessons learned regarding this test procedure.
The first lesson learned was with regard to data collection. This test requires that many
data points be collected, which makes collecting and properly tracking all of the
information very important. The use of good data collection methods and information

129
storage is paramount. Furthermore, the timely gathering of this information is of great
importance because there are so many times at which it must be collected.
The second lesson learned pertains to specimen alignment, which is crucial when
performing creep testing. If eccentricities are allowed, erratic strain measurements will
ensue. For this reason, properly determining the best alignment of the test specimens is of
the utmost importance. During this study, specimens were stacked on a level surface, in
their test configuration, prior to being placed into the creep frame. A level was then
placed on top of the upper concrete plug and the specimens were rotated until the best
alignment was found. In this case, that meant a level reading was observed all along the
top of the upper concrete plug.
Alignment also is important within the frames. For this reason, it is crucial that the
specimens be in good alignment with the frame itself. Otherwise, the possibility of
eccentricity increases. This is where the alignment marks mentioned in Sections 3.4.6.1
and 4.5.1.1 come into play. These marks make this process easier and the alignment more
uniform for all frames. In addition to these alignment tools, other tools would also be
beneficial. For instance, a jig to help align the test cylinders properly amongst themselves
and the creep frame would greatly help to efficiently achieve proper alignment.
4.7 SUMMARY OF RESULTS
4.7.1 FRESH PROPERTIES
From this research, the following conclusions can be drawn about the fresh properties of
SCC:

130
• For a given SCM, as the w/cm decreases, the T-50 time increases, which
indicates that the viscosity increases with a decrease in w/cm.
• GGBF slag mixtures exhibited larger T-50 times than fly ash mixtures
proportioned to provide similar 18-hour strengths.
4.7.2 HARDENED PROPERTIES
From this research, the following conclusions can be drawn about the hardened properties
of SCC:
• Mixtures containing GGBF slag gained compressive strength at a slower
rate than those containing a cement replacement of Class C fly ash.
• When curing is accelerated and the load is applied at 18 hours, the creep
of all the SCC mixtures is less than the creep of the conventional-slump
mixture.
• Since the accelerated curing condition simulates plant conditions,
excessive creep in not expected for full-scale members constructed with
these SCC mixtures.
• All SCC mixtures cured under elevated or standard laboratory temperature
exhibited creep values similar to, or less than, that of the conventional-
slump concrete mixture.
• When curing is not accelerated, the creep behavior of the moderate-
strength fly ash SCC and the conventional-slump mixture is similar.
• The high-strength mixtures had the highest paste content, but exhibited
less creep than any of the moderate-strength mixtures. This is attributed to

131
the increased strength and decreased permeability of the hydrated cement
paste of these low-w/cm mixtures.
• At a fixed w/cm, SCC mixtures made with GGBF slag creep less than
those made with fly ash, regardless of the age at loading.
• All SCC mixtures exhibited lower drying shrinkage as the w/cm
decreased.
• All SCC mixtures exhibited drying shrinkage strains that were similar in
magnitude to the conventional-slump mixture. For this reason, full-scale
members constructed with SCC are not expected to experience excessive
drying shrinkage.

132
CHAPTER 5
EVALUATION OF CREEP PREDICTION METHODS
5.1 INTRODUCTION
As previously stated, one of the main objectives of this study was to evaluate the five
creep prediction methods detailed in Section 2.4 in order to determine their effectiveness
in estimating creep of SCC. This was accomplished by comparing the measured creep
strain (εCR) from each mixture with the εCR estimated by the following methods:
• ACI 209 (ACI Committee 209 1997)
• AASHTO (2007)
• CEB 90 (CEB 1990)
• GL 2000 (Gardner and Lockman 2001), and
• B3 (Bazant and Baweja 2000).
The results from that analysis are presented in this chapter and it is organized
according to creep prediction methods. The first section of this chapter provides an
overview of the statistical methods used to calculate the error associated with each
prediction method. A discussion of the accuracy of each method follows in later sections
and a summary of all conclusions is located at the end of the chapter. Furthermore, the
method found to give the most accurate prediction is calibrated to improve estimations of
the creep response for the concrete mixtures used in this study.

133
5.2 STATISTICAL ANALYSIS OF CREEP PREDICTION METHODS
Once all the creep data were collected and the prediction analysis was performed, a
statistical comparison of the results of all the methods was performed to determine which
method provides the most accurate results. The accuracy of all methods was determined
by evaluating the percent error, absolute average error, and the absolute average percent
error.
5.2.1 COMPARISON STATISTICS
To calculate the percent error, the measured creep strain was subtracted from the
estimated creep strain. This difference was divided by the measured creep strain, and the
resulting value was multiplied by 100. This calculation can be seen in the equation that
follows:
100ˆ
% ×
−=y
yyError
where,
strain. creep measured
and strain, creep predictedˆ
=
=
y
y
The acceptable error range for the creep prediction methods evaluated in this study
was chosen to be ± 20%. This was based on literature published by Gardner and
Lockman (2001), which stated that predictions for “shrinkage within 15% would be
excellent, and a prediction within 20% would be adequate.” Since creep strain is obtained

134
after subtracting measured shrinkage strains form the total strain, creep prediction within
20% of the measured values should be considered to be excellent.
The absolute average error is not a true statistical value; however, it does provide a
single parameter by which the estimated creep strain may be compared to the measured
value. A report co-authored by Carino and Tank (1992) provides the following equation,
which was used to calculate the absolute average error:
n
yyAAE ∑ −
=ˆ
where,
AAE = absolute average error, and
n = number of creep strain values in a data set.
The absolute average percent error provides another single-parameter comparison tool
to evaluate the accuracy of the predicted creep strain to the measured value. The
following equation was used to determine the absolute average percent error:
n
y
yy
EAA∑ ×
−
=100
ˆ
%
where,
AA%E = absolute average percent error.

135
5.2.2 RESULTS FROM STATISTICAL ANALYSIS
Using the error calculations described above, results from each of the prediction methods
was compared to the others to evaluate their performance. Tables 5-1 and 5-2 show all of
the error values for the non-accelerated-cured and accelerated-cured specimens,
respectively. Each table is broken into three areas, each of which contains the results
from one of the error calculation types. At the bottom of areas two and three is a section
that summarizes which method performed the best for each of the mixtures. This
summary is not shown for area one, which is the area showing the maximum positive and
negative percent error results; however, the maximum positive and negative error values
are listed. Positive error means the predicted creep strain value was larger than the
measured value and negative error means the predicted value was less than the measured
value.
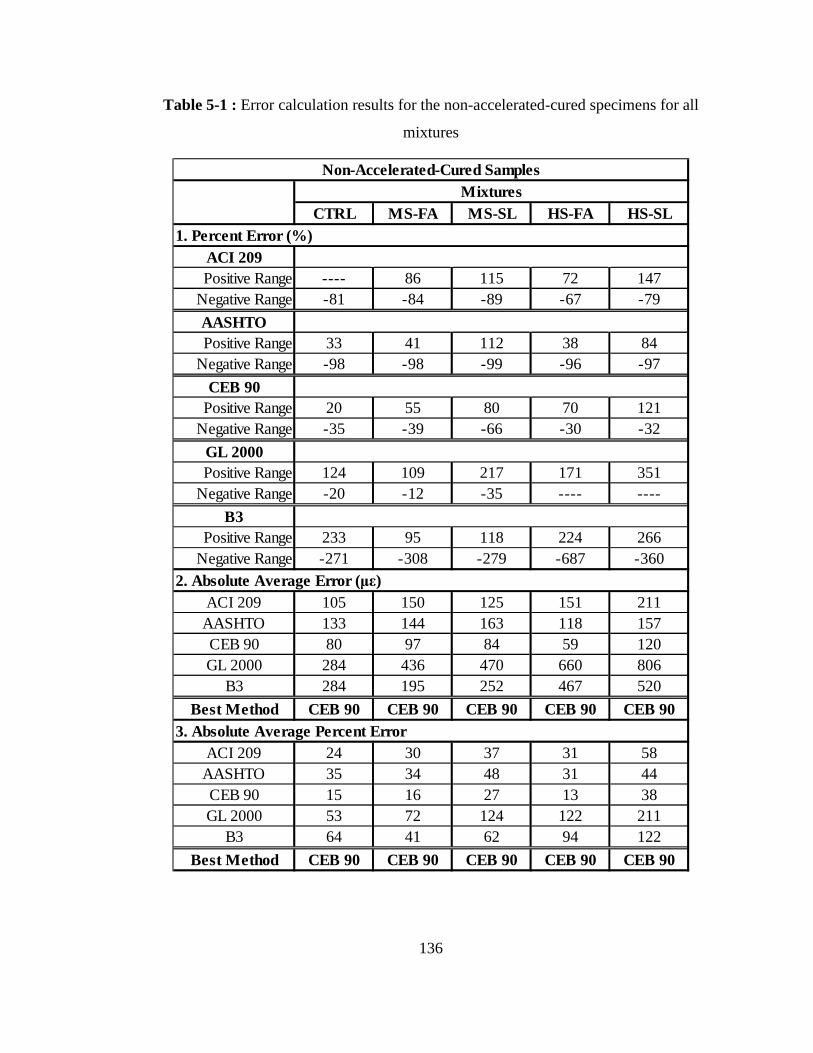
136
Table 5-1 : Error calculation results for the non-accelerated-cured specimens for all
mixtures
CTRL MS-FA MS-SL HS-FA HS-SL
---- 86 115 72 147-81 -84 -89 -67 -79
33 41 112 38 84-98 -98 -99 -96 -97
20 55 80 70 121-35 -39 -66 -30 -32
124 109 217 171 351-20 -12 -35 ---- ----
233 95 118 224 266-271 -308 -279 -687 -360
105 150 125 151 211133 144 163 118 15780 97 84 59 120284 436 470 660 806284 195 252 467 520
CEB 90 CEB 90 CEB 90 CEB 90 CEB 90
24 30 37 31 5835 34 48 31 4415 16 27 13 3853 72 124 122 21164 41 62 94 122
CEB 90 CEB 90 CEB 90 CEB 90 CEB 90
Non-Accelerated-Cured SamplesMixtures
1. Percent Error (%)ACI 209Positive Range
Negative Range
AASHTOPositive Range
Negative Range
CEB 90Positive Range
Negative Range
GL 2000Positive Range
Negative Range
B3Positive Range
Negative Range2. Absolute Average Error (µε)
ACI 209AASHTOCEB 90GL 2000
B3
Best Method3. Absolute Average Percent Error
ACI 209AASHTOCEB 90
Best Method
GL 2000B3
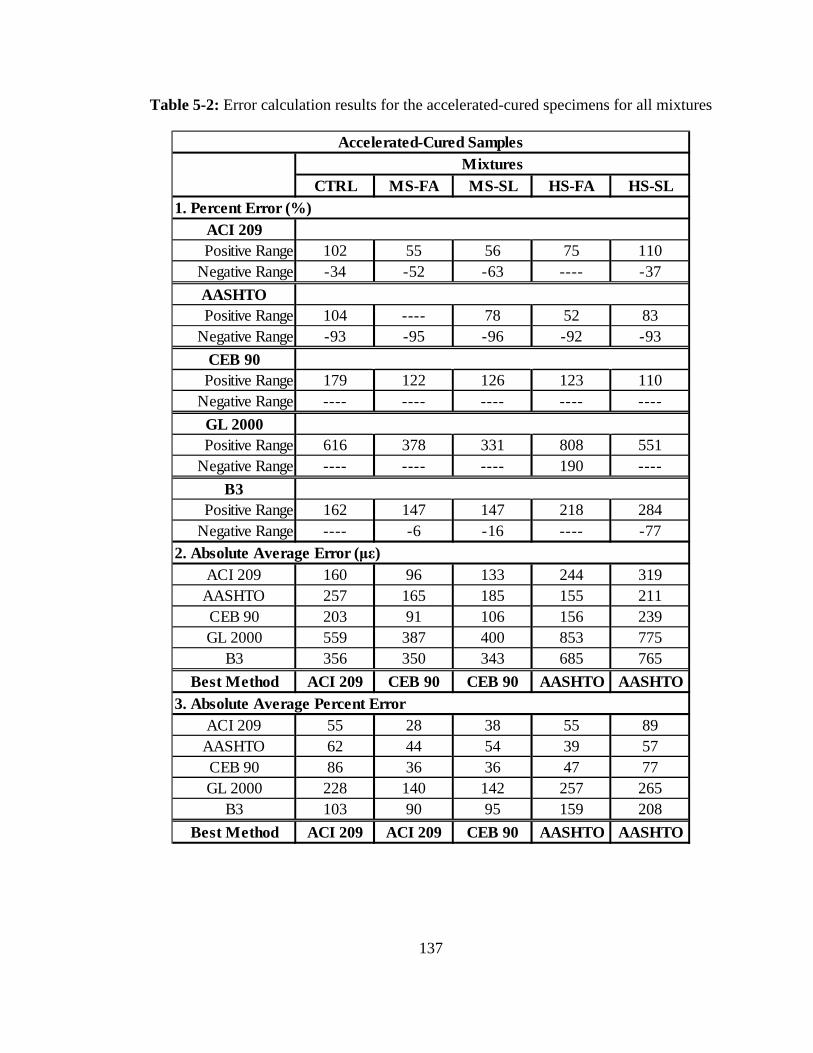
137
Table 5-2: Error calculation results for the accelerated-cured specimens for all mixtures
CTRL MS-FA MS-SL HS-FA HS-SL
102 55 56 75 110-34 -52 -63 ---- -37
104 ---- 78 52 83-93 -95 -96 -92 -93
179 122 126 123 110---- ---- ---- ---- ----
616 378 331 808 551---- ---- ---- 190 ----
162 147 147 218 284---- -6 -16 ---- -77
160 96 133 244 319257 165 185 155 211203 91 106 156 239559 387 400 853 775356 350 343 685 765
ACI 209 CEB 90 CEB 90 AASHTO AASHTO
55 28 38 55 8962 44 54 39 5786 36 36 47 77228 140 142 257 265103 90 95 159 208
ACI 209 ACI 209 CEB 90 AASHTO AASHTO
Accelerated-Cured SamplesMixtures
1. Percent Error (%)ACI 209Positive Range
Negative Range
AASHTOPositive Range
Negative Range
CEB 90Positive Range
Negative Range
GL 2000Positive Range
Negative Range
B3Positive Range
Negative Range2. Absolute Average Error (µε)
ACI 209AASHTOCEB 90GL 2000
B3
Best Method3. Absolute Average Percent Error
ACI 209AASHTOCEB 90
Best Method
GL 2000B3
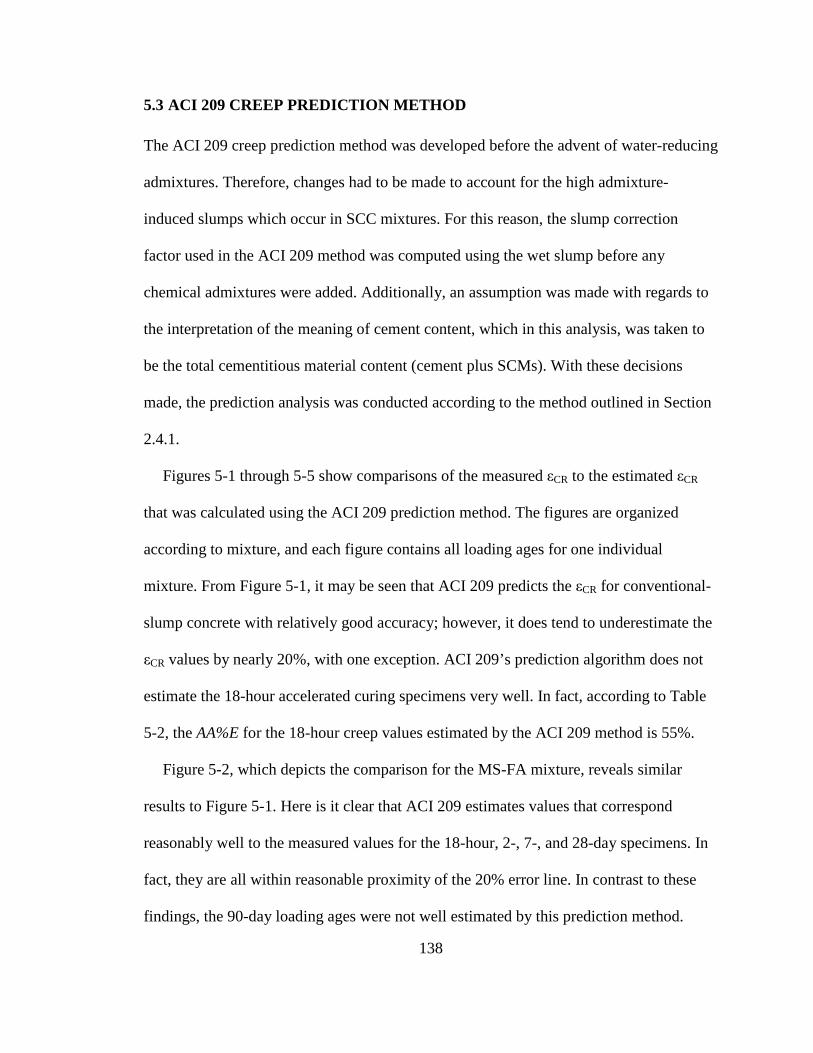
138
5.3 ACI 209 CREEP PREDICTION METHOD
The ACI 209 creep prediction method was developed before the advent of water-reducing
admixtures. Therefore, changes had to be made to account for the high admixture-
induced slumps which occur in SCC mixtures. For this reason, the slump correction
factor used in the ACI 209 method was computed using the wet slump before any
chemical admixtures were added. Additionally, an assumption was made with regards to
the interpretation of the meaning of cement content, which in this analysis, was taken to
be the total cementitious material content (cement plus SCMs). With these decisions
made, the prediction analysis was conducted according to the method outlined in Section
2.4.1.
Figures 5-1 through 5-5 show comparisons of the measured εCR to the estimated εCR
that was calculated using the ACI 209 prediction method. The figures are organized
according to mixture, and each figure contains all loading ages for one individual
mixture. From Figure 5-1, it may be seen that ACI 209 predicts the εCR for conventional-
slump concrete with relatively good accuracy; however, it does tend to underestimate the
εCR values by nearly 20%, with one exception. ACI 209’s prediction algorithm does not
estimate the 18-hour accelerated curing specimens very well. In fact, according to Table
5-2, the AA%E for the 18-hour creep values estimated by the ACI 209 method is 55%.
Figure 5-2, which depicts the comparison for the MS-FA mixture, reveals similar
results to Figure 5-1. Here is it clear that ACI 209 estimates values that correspond
reasonably well to the measured values for the 18-hour, 2-, 7-, and 28-day specimens. In
fact, they are all within reasonable proximity of the 20% error line. In contrast to these
findings, the 90-day loading ages were not well estimated by this prediction method.
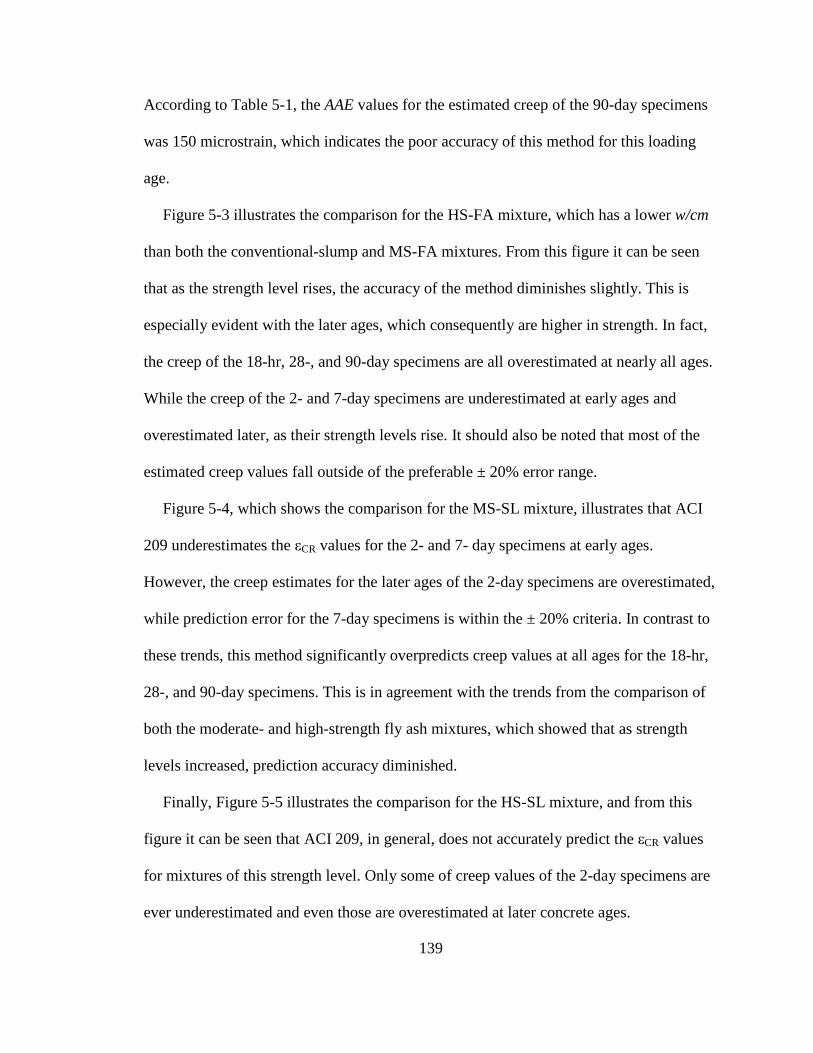
139
According to Table 5-1, the AAE values for the estimated creep of the 90-day specimens
was 150 microstrain, which indicates the poor accuracy of this method for this loading
age.
Figure 5-3 illustrates the comparison for the HS-FA mixture, which has a lower w/cm
than both the conventional-slump and MS-FA mixtures. From this figure it can be seen
that as the strength level rises, the accuracy of the method diminishes slightly. This is
especially evident with the later ages, which consequently are higher in strength. In fact,
the creep of the 18-hr, 28-, and 90-day specimens are all overestimated at nearly all ages.
While the creep of the 2- and 7-day specimens are underestimated at early ages and
overestimated later, as their strength levels rise. It should also be noted that most of the
estimated creep values fall outside of the preferable ± 20% error range.
Figure 5-4, which shows the comparison for the MS-SL mixture, illustrates that ACI
209 underestimates the εCR values for the 2- and 7- day specimens at early ages.
However, the creep estimates for the later ages of the 2-day specimens are overestimated,
while prediction error for the 7-day specimens is within the ± 20% criteria. In contrast to
these trends, this method significantly overpredicts creep values at all ages for the 18-hr,
28-, and 90-day specimens. This is in agreement with the trends from the comparison of
both the moderate- and high-strength fly ash mixtures, which showed that as strength
levels increased, prediction accuracy diminished.
Finally, Figure 5-5 illustrates the comparison for the HS-SL mixture, and from this
figure it can be seen that ACI 209, in general, does not accurately predict the εCR values
for mixtures of this strength level. Only some of creep values of the 2-day specimens are
ever underestimated and even those are overestimated at later concrete ages.
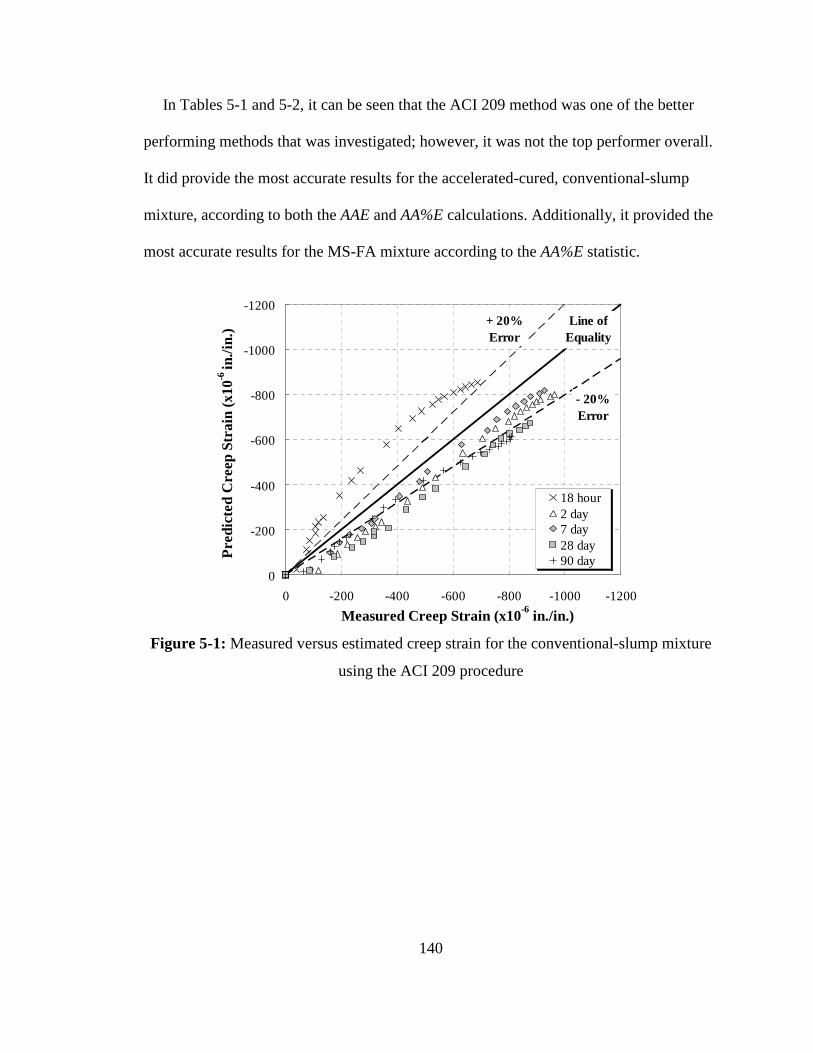
140
In Tables 5-1 and 5-2, it can be seen that the ACI 209 method was one of the better
performing methods that was investigated; however, it was not the top performer overall.
It did provide the most accurate results for the accelerated-cured, conventional-slump
mixture, according to both the AAE and AA%E calculations. Additionally, it provided the
most accurate results for the MS-FA mixture according to the AA%E statistic.
-1200
-1000
-800
-600
-400
-200
0
-1200-1000-800-600-400-2000
Measured Creep Strain (x10-6 in./in.)
Pre
dict
ed C
reep
Str
ain
(x10
-6 in
./in.
)
18 hour2 day7 day28 day90 day
+ 20% Error
- 20% Error
Line of Equality
Figure 5-1: Measured versus estimated creep strain for the conventional-slump mixture
using the ACI 209 procedure
141
-1500
-1200
-900
-600
-300
0
-1500-1200-900-600-3000
Measured Creep Strain (x10-6 in./in.)
Pre
dict
ed C
reep
Str
ain
(x10
-6 in
./in.
)
18 hour2 day7 day28 day90 day
+ 20% Error
- 20% Error
Line of Equality
Figure 5-2: Measured versus estimated creep strain for the MS-FA mixture using the
ACI 209 procedure
-1500
-1200
-900
-600
-300
0
-1500-1200-900-600-3000
Measured Creep Strain (x10-6 in./in.)
Pre
dict
ed C
reep
Str
ain
(x10
-6 in
./in.
)
18 hour2 day7 day28 day90 day
+ 20% Error
- 20% Error
Line of Equality
Figure 5-3: Measured versus estimated creep strain for the HS-FA mixture using the ACI
209 procedure
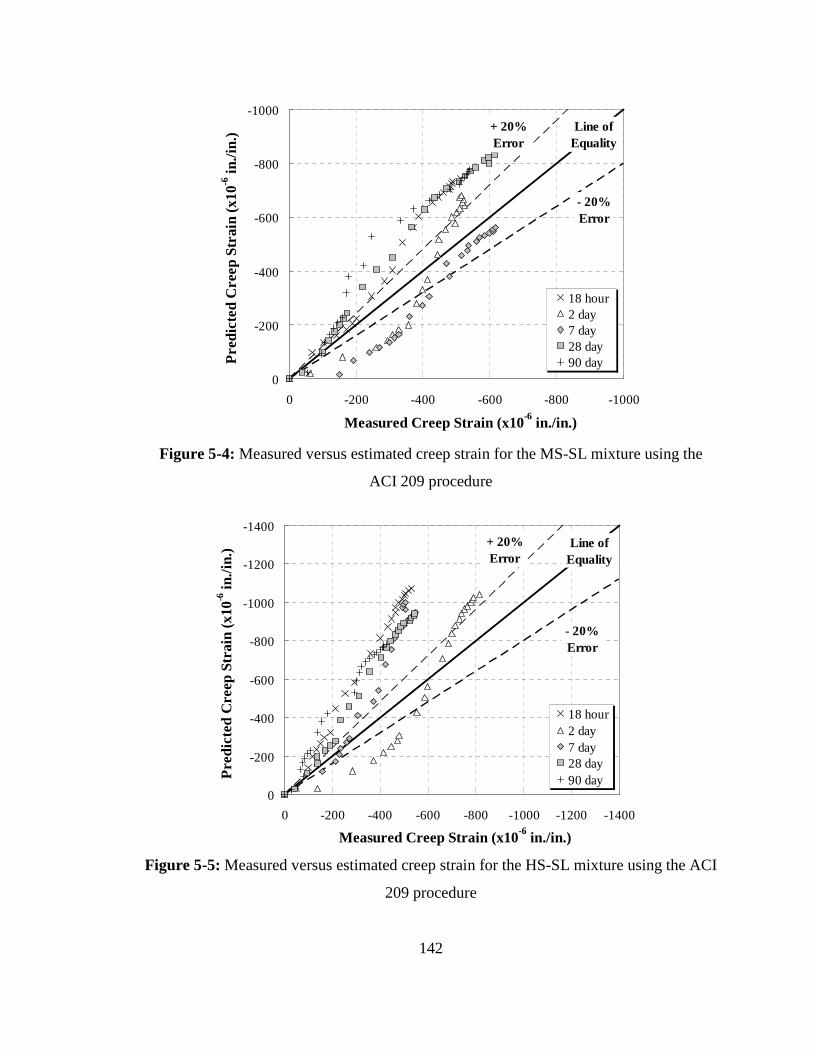
142
-1000
-800
-600
-400
-200
0
-1000-800-600-400-2000
Measured Creep Strain (x10-6 in./in.)
Pre
dict
ed C
reep
Str
ain
(x10
-6 in
./in.
)
18 hour2 day7 day28 day90 day
+ 20% Error
- 20% Error
Line of Equality
Figure 5-4: Measured versus estimated creep strain for the MS-SL mixture using the
ACI 209 procedure
-1400
-1200
-1000
-800
-600
-400
-200
0
-1400-1200-1000-800-600-400-2000
Measured Creep Strain (x10-6 in./in.)
Pre
dict
ed C
reep
Str
ain
(x10
-6 in
./in
.)
18 hour2 day7 day28 day90 day
+ 20% Error
- 20% Error
Line of Equality
Figure 5-5: Measured versus estimated creep strain for the HS-SL mixture using the ACI
209 procedure
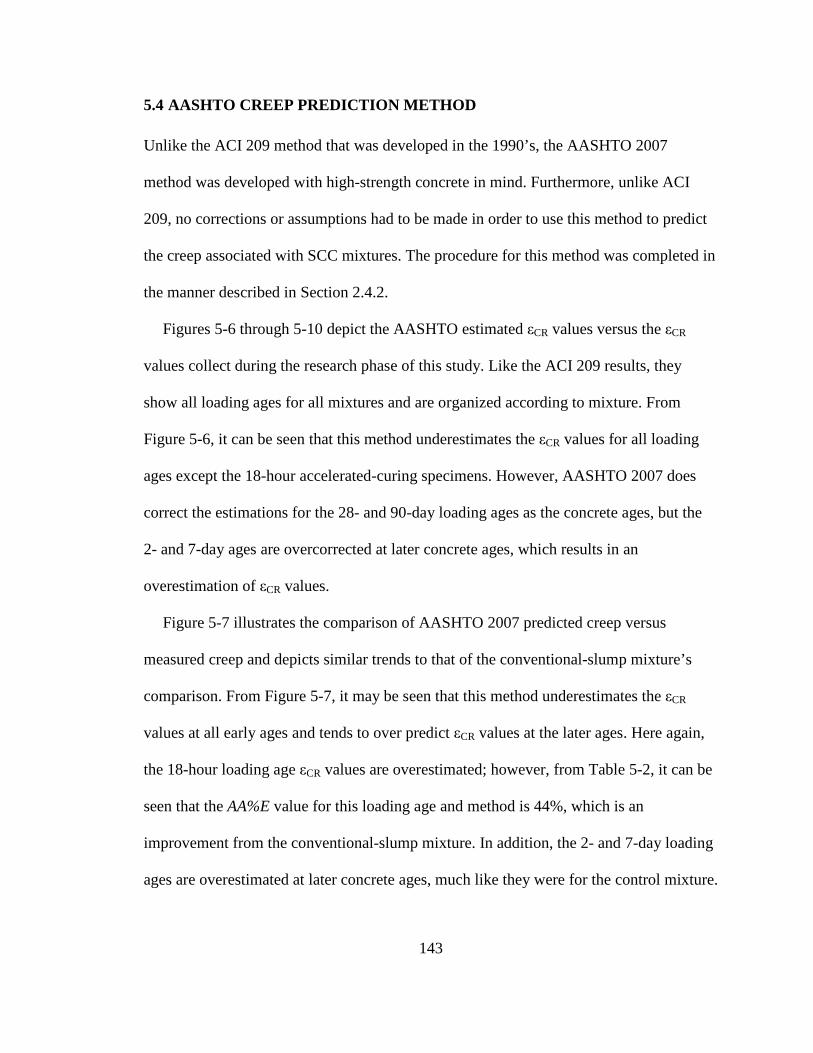
143
5.4 AASHTO CREEP PREDICTION METHOD
Unlike the ACI 209 method that was developed in the 1990’s, the AASHTO 2007
method was developed with high-strength concrete in mind. Furthermore, unlike ACI
209, no corrections or assumptions had to be made in order to use this method to predict
the creep associated with SCC mixtures. The procedure for this method was completed in
the manner described in Section 2.4.2.
Figures 5-6 through 5-10 depict the AASHTO estimated εCR values versus the εCR
values collect during the research phase of this study. Like the ACI 209 results, they
show all loading ages for all mixtures and are organized according to mixture. From
Figure 5-6, it can be seen that this method underestimates the εCR values for all loading
ages except the 18-hour accelerated-curing specimens. However, AASHTO 2007 does
correct the estimations for the 28- and 90-day loading ages as the concrete ages, but the
2- and 7-day ages are overcorrected at later concrete ages, which results in an
overestimation of εCR values.
Figure 5-7 illustrates the comparison of AASHTO 2007 predicted creep versus
measured creep and depicts similar trends to that of the conventional-slump mixture’s
comparison. From Figure 5-7, it may be seen that this method underestimates the εCR
values at all early ages and tends to over predict εCR values at the later ages. Here again,
the 18-hour loading age εCR values are overestimated; however, from Table 5-2, it can be
seen that the AA%E value for this loading age and method is 44%, which is an
improvement from the conventional-slump mixture. In addition, the 2- and 7-day loading
ages are overestimated at later concrete ages, much like they were for the control mixture.

144
Finally, the creep for the 28- and 90-day specimens are more closely estimated than any
other ages for this mixture, as most of the estimates are within the ± 20% error tolerance.
From Figure 5-8, which shows the comparison for the HS-FA mixture, it is evident
that this method continues to underestimate the εCR values at early concrete ages.
Moreover, it then overestimates the 18-hour εCR values at later concrete ages. Here again,
the 2- and 7-day εCR values are overestimated at later ages and the 28-day εCR values tend
to be very accurate. The estimated creep values for the 90-day specimens are within
reasonable proximity to the ± 20% error tolerance, indicating tolerable accuracy for this
loading age.
Figure 5-9 illustrates the same comparison for the MS-SL mixture. From this figure, it
is again evident that early-age εCR values are underestimated; however, this method
overestimates the later concrete age εCR values for this mixture. In fact, only the 7-day
εCR values are within the preferred ± 20% range at later concrete ages. This method
proves especially inaccurate for estimating the creep values for the 18-hour accelerated-
cured specimens. In fact, according to Table 5-2, the AA%E value for this loading age
and method is 54%, which is among the highest error values of all five mixtures.
Figure 5-10 shows the same trends that were identified for the creep estimated for
previous mixtures using this method. This method underestimates the early-age εCR
values for the 2-, 7-, and 28-day loading ages, but then overestimates the later-age εCR
values for the 7-, 28, and 90-day specimens. The biggest difference here is the improved
accuracy of the later-age 2-day εCR values, which are the only ones within the ± 20%
range. It is evident from looking at this figure that this method does not accurately
estimate the εCR values for concrete mixture of this SCM type and strength level.
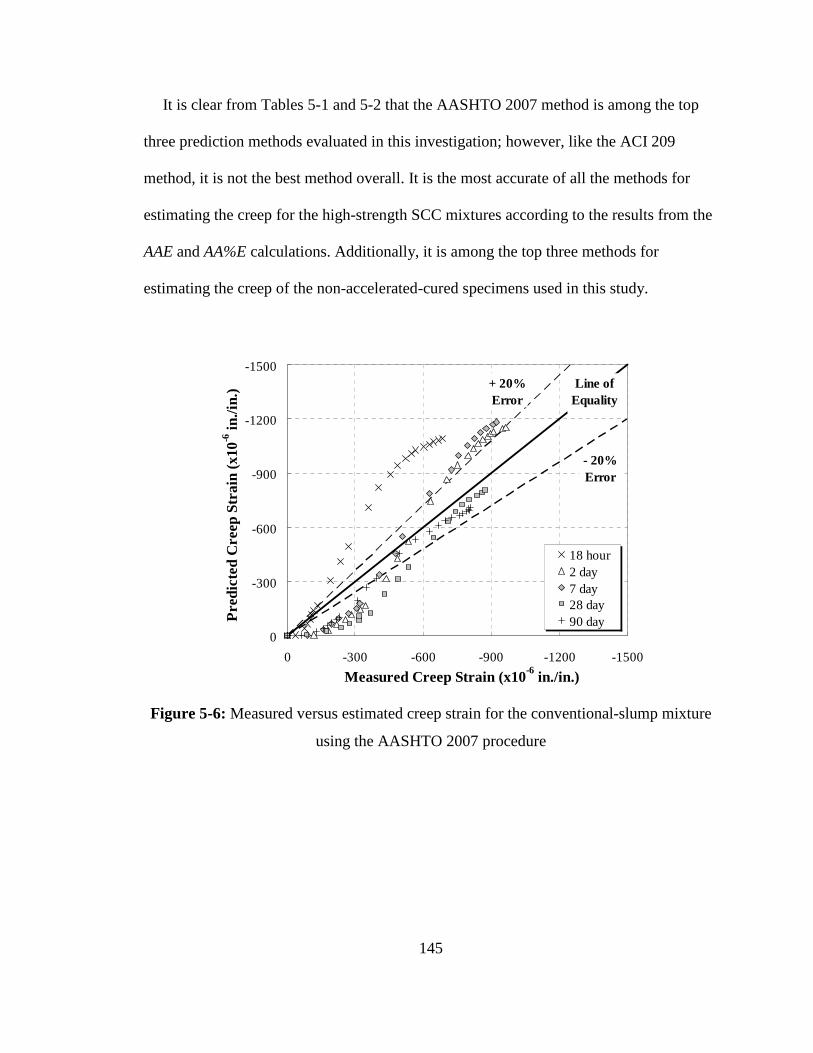
145
It is clear from Tables 5-1 and 5-2 that the AASHTO 2007 method is among the top
three prediction methods evaluated in this investigation; however, like the ACI 209
method, it is not the best method overall. It is the most accurate of all the methods for
estimating the creep for the high-strength SCC mixtures according to the results from the
AAE and AA%E calculations. Additionally, it is among the top three methods for
estimating the creep of the non-accelerated-cured specimens used in this study.
-1500
-1200
-900
-600
-300
0
-1500-1200-900-600-3000
Measured Creep Strain (x10-6 in./in.)
Pre
dict
ed C
reep
Str
ain
(x10
-6 in
./in.
)
18 hour2 day7 day28 day90 day
+ 20% Error
- 20% Error
Line of Equality
Figure 5-6: Measured versus estimated creep strain for the conventional-slump mixture
using the AASHTO 2007 procedure
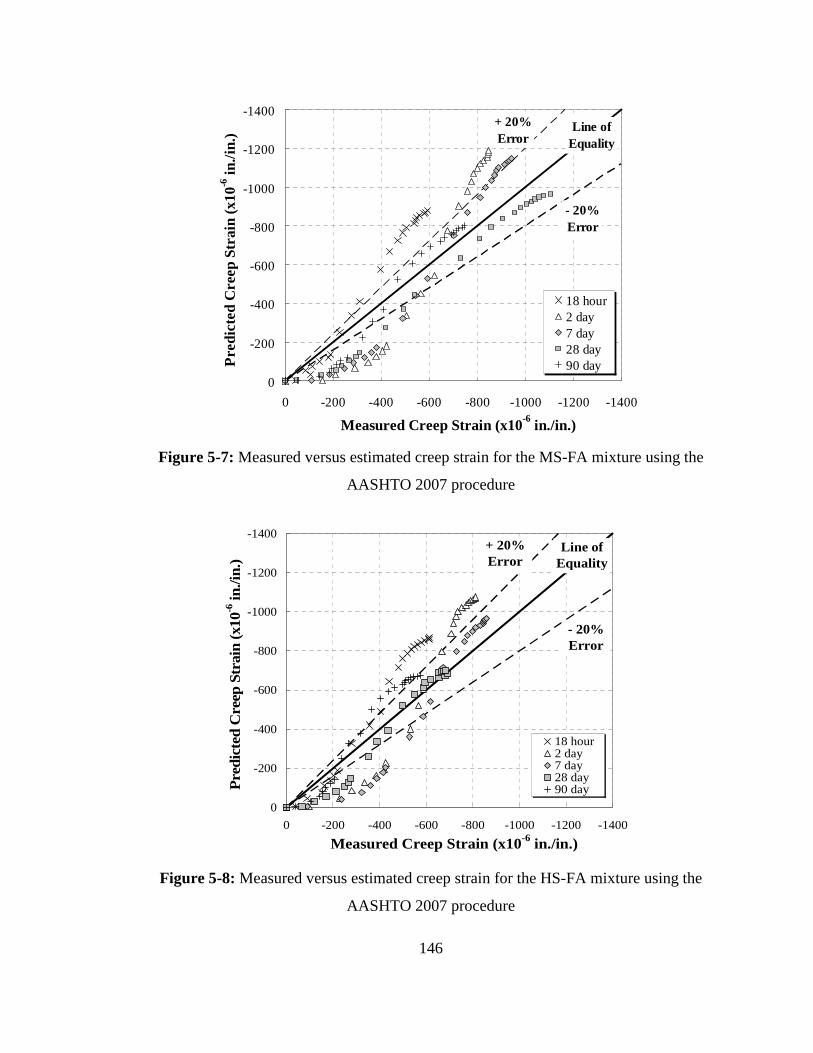
146
-1400
-1200
-1000
-800
-600
-400
-200
0
-1400-1200-1000-800-600-400-2000
Measured Creep Strain (x10-6 in./in.)
Pre
dict
ed C
reep
Str
ain
(x10
-6 in
./in.
)
18 hour2 day7 day28 day90 day
+ 20% Error
- 20% Error
Line of Equality
Figure 5-7: Measured versus estimated creep strain for the MS-FA mixture using the
AASHTO 2007 procedure
-1400
-1200
-1000
-800
-600
-400
-200
0
-1400-1200-1000-800-600-400-2000
Measured Creep Strain (x10-6 in./in.)
Pre
dict
ed C
reep
Str
ain
(x10
-6 in
./in.
)
18 hour2 day7 day28 day90 day
+ 20% Error
- 20% Error
Line of Equality
Figure 5-8: Measured versus estimated creep strain for the HS-FA mixture using the
AASHTO 2007 procedure
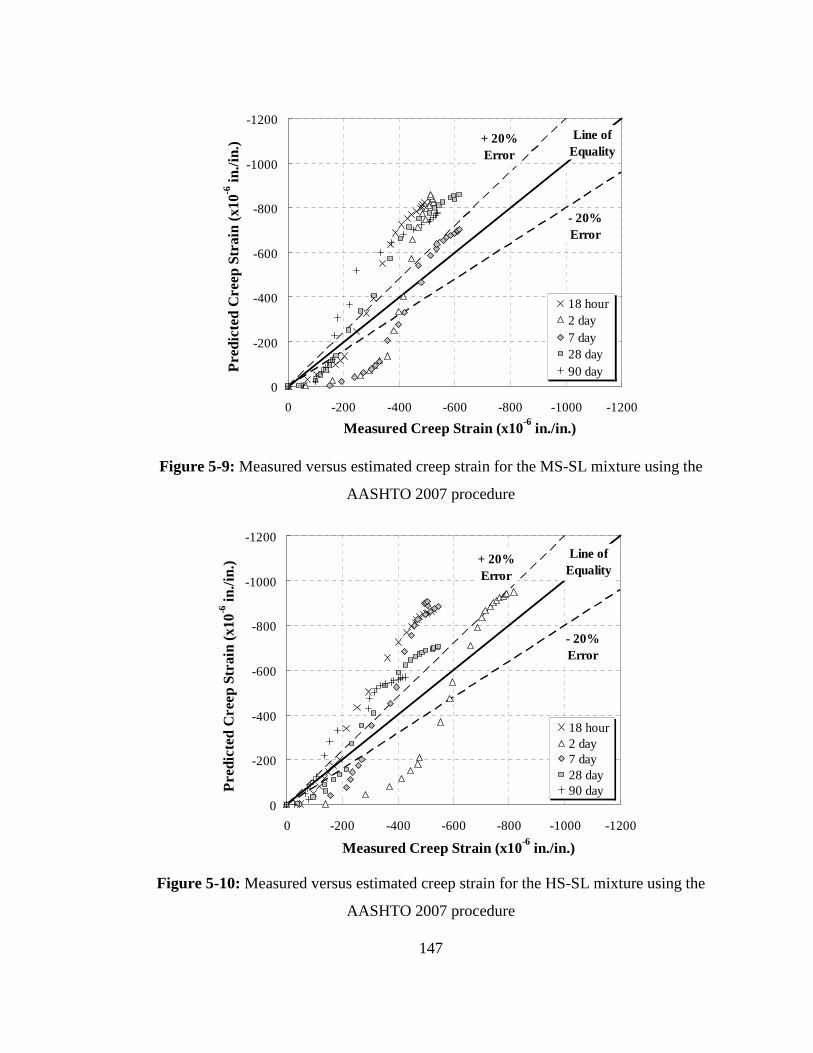
147
-1200
-1000
-800
-600
-400
-200
0
-1200-1000-800-600-400-2000
Measured Creep Strain (x10-6 in./in.)
Pre
dict
ed C
reep
Str
ain
(x10
-6 in
./in.
)
18 hour2 day7 day28 day90 day
+ 20% Error
- 20% Error
Line of Equality
Figure 5-9: Measured versus estimated creep strain for the MS-SL mixture using the
AASHTO 2007 procedure
-1200
-1000
-800
-600
-400
-200
0
-1200-1000-800-600-400-2000
Measured Creep Strain (x10-6 in./in.)
Pre
dict
ed C
reep
Str
ain
(x10
-6 in
./in.
)
18 hour2 day7 day28 day90 day
+ 20% Error
- 20% Error
Line of Equality
Figure 5-10: Measured versus estimated creep strain for the HS-SL mixture using the
AASHTO 2007 procedure

148
5.5 CEB 90 CREEP PREDICTION METHOD
The CEB 90 creep prediction method, like the AASHTO 2007 method, required no
assumptions or corrections be made in order for it to be used to estimate εCR values for
any of the mixtures. All analysis associated with this method was completed according to
the procedures outlined in Section 2.4.3 of this report.
Figures 5-11 through 5-15 illustrate the comparison made between the predicted εCR
values from the CEB 90 method and the measured εCR values recorded during testing. In
Figure 5-11 and in Tables 5-1 and 5-2, it can be seen that this method provides better εCR
estimates for the conventional-slump mixture than both the ACI 209 and AASHTO 2007
methods. The early-age εCR values for all non-accelerated-cured samples are all
reasonably well estimated. The only noticeably underestimated εCR values are the ones
associated with the 28- and 90-day specimens; however, these are within reasonable
proximity to the ± 20% range, which is preferred. The only overestimated values are
those associated with the 18-hour accelerated-cured specimens. The creep for the 18-hour
loading age is grossly overestimated at all concrete ages.
Figure 5-12 shows the εCR comparison for the MS-FA mixture. Here it can be seen
that this method provided accurate estimates of the εCR values for this mixture. The creep
for all loading ages, including the 18-hour loading age, is accurately estimated. In fact,
the only creep estimates that fall outside of the ± 20% range are those of the 28-day
loading age, and even those are only slightly more than 20% underestimated.
Figure 5-13, which shows the HS-FA mixture’s creep comparison, illustrates again
that this method provides reasonably accurate estimations of the measured εCR values for
SCC mixtures. Most of the estimated εCR values fall within the preferred ± 20% error

149
range. In fact, only the 18-hour loading age has εCR values that stay outside of this range
for an appreciable amount of time. In all, this method provides accurate creep estimates
for all loading ages and at all concrete ages.
In Figure 5-14, it is evident that the estimated εCR values are within close proximity of
the line of equality, which means that this method accurately predicts εCR values at all
concrete ages. Only the creep of the 2- and 7-day specimens are ever underestimated at
earlier ages; however, at later ages, their creep estimates are improved. In contrast, all
other loading ages are always overestimated; however, these overestimated creep values
are predominantly in close proximity of the ± 20% error envelope.
Finally, Figure 5-15, which depicts this comparison for the HS-SL mixture, shows
slightly different trends. Here the creep for all the loading ages except the 2-day loading
age are over predicted at all concrete ages. Even though the 2-day εCR values are
overestimated, they are still within close proximity of the ± 20% error range. In all, this
method provides the most accurately predicted εCR values for all the SCC mixtures in this
study.
The last statement is reinforced by the results from the statistical analysis, which are
found in Tables 5-1 and 5-2. From those tables it is clear that the CEB 90 method
provided the most accurate results for all non-accelerated-cured specimens according to
both the AAE and AA%E calculations. In addition, it was among the top three methods
used to predict the creep strain for the accelerated-cured specimens.
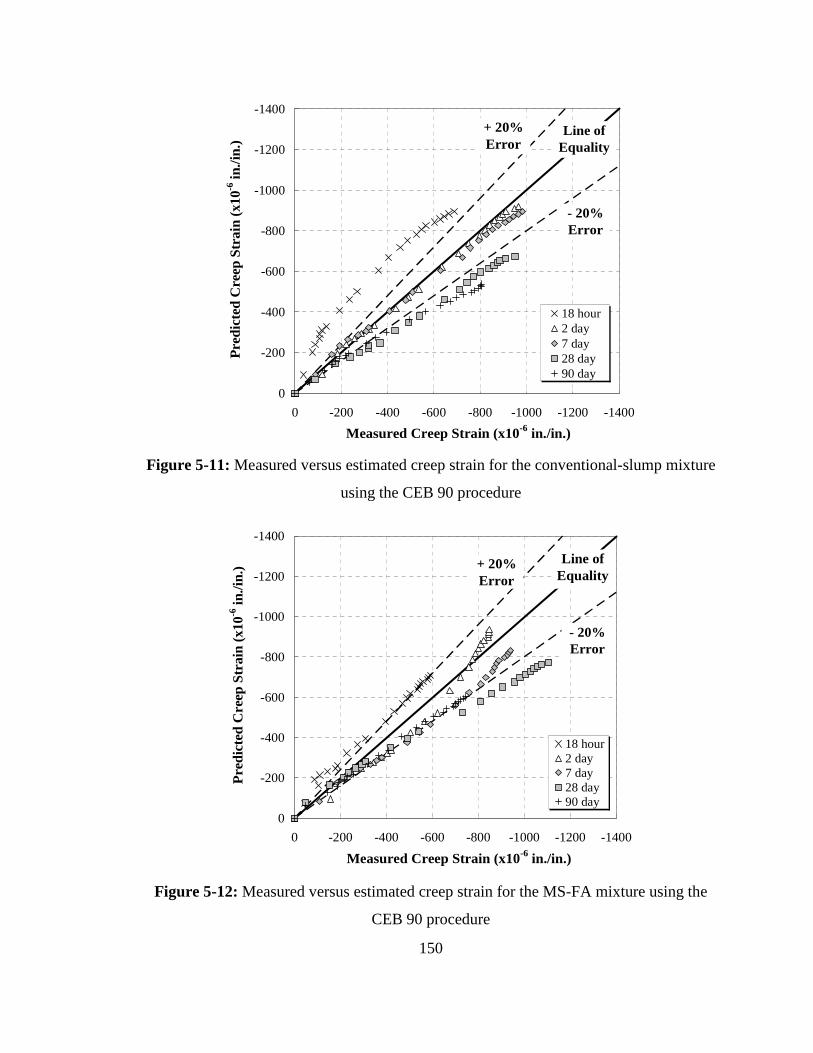
150
-1400
-1200
-1000
-800
-600
-400
-200
0
-1400-1200-1000-800-600-400-2000
Measured Creep Strain (x10-6 in./in.)
Pre
dict
ed C
reep
Str
ain
(x10
-6 in
./in.
)
18 hour2 day7 day28 day90 day
+ 20% Error
- 20% Error
Line of Equality
Figure 5-11: Measured versus estimated creep strain for the conventional-slump mixture
using the CEB 90 procedure
-1400
-1200
-1000
-800
-600
-400
-200
0
-1400-1200-1000-800-600-400-2000
Measured Creep Strain (x10-6 in./in.)
Pre
dict
ed C
reep
Str
ain
(x10
-6 in
./in.
)
18 hour2 day7 day28 day90 day
+ 20% Error
- 20% Error
Line of Equality
Figure 5-12: Measured versus estimated creep strain for the MS-FA mixture using the
CEB 90 procedure
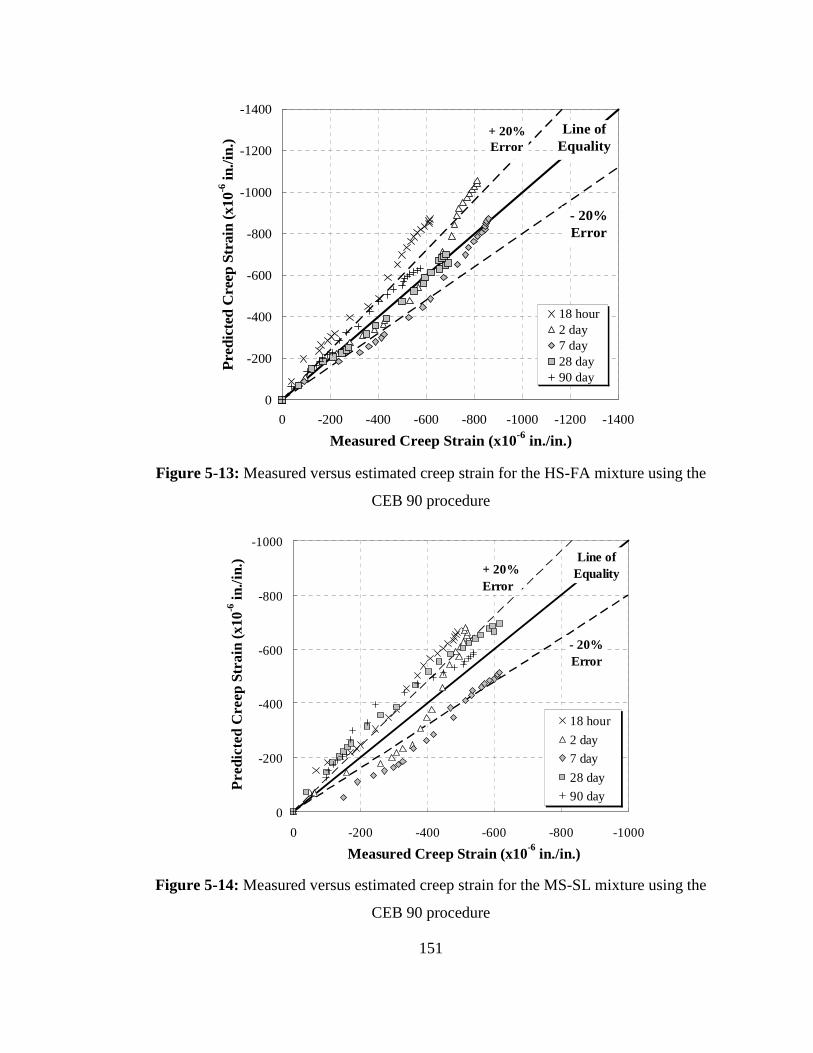
151
-1400
-1200
-1000
-800
-600
-400
-200
0
-1400-1200-1000-800-600-400-2000
Measured Creep Strain (x10-6 in./in.)
Pre
dict
ed C
reep
Str
ain
(x10
-6 in
./in.
)
18 hour2 day7 day28 day90 day
+ 20% Error
- 20% Error
Line of Equality
Figure 5-13: Measured versus estimated creep strain for the HS-FA mixture using the
CEB 90 procedure
-1000
-800
-600
-400
-200
0
-1000-800-600-400-2000
Measured Creep Strain (x10-6 in./in.)
Pre
dict
ed C
reep
Str
ain
(x10
-6 in
./in
.)
18 hour
2 day
7 day
28 day
90 day
+ 20% Error
- 20% Error
Line of Equality
Figure 5-14: Measured versus estimated creep strain for the MS-SL mixture using the
CEB 90 procedure
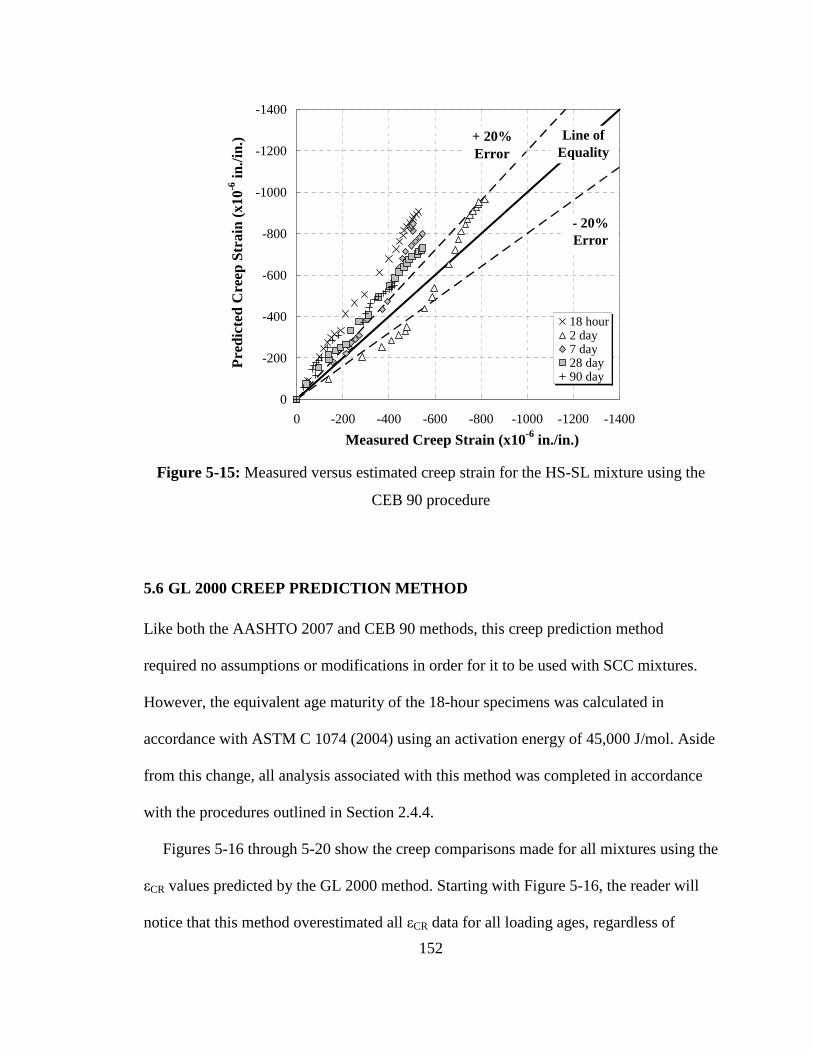
152
-1400
-1200
-1000
-800
-600
-400
-200
0
-1400-1200-1000-800-600-400-2000
Measured Creep Strain (x10-6 in./in.)
Pre
dict
ed C
reep
Str
ain
(x10
-6 in
./in.
)
18 hour2 day7 day28 day90 day
+ 20% Error
- 20% Error
Line of Equality
Figure 5-15: Measured versus estimated creep strain for the HS-SL mixture using the
CEB 90 procedure
5.6 GL 2000 CREEP PREDICTION METHOD
Like both the AASHTO 2007 and CEB 90 methods, this creep prediction method
required no assumptions or modifications in order for it to be used with SCC mixtures.
However, the equivalent age maturity of the 18-hour specimens was calculated in
accordance with ASTM C 1074 (2004) using an activation energy of 45,000 J/mol. Aside
from this change, all analysis associated with this method was completed in accordance
with the procedures outlined in Section 2.4.4.
Figures 5-16 through 5-20 show the creep comparisons made for all mixtures using the
εCR values predicted by the GL 2000 method. Starting with Figure 5-16, the reader will
notice that this method overestimated all εCR data for all loading ages, regardless of

153
mixture type, concrete age, or the curing regime used. It was especially inaccurate when
estimating the εCR values for the 18-hour loading age. Only the εCR values for the 90-day
loading age were within the ± 20% error range.
In Figure 5-17, which depicts the comparison for the MS-FA mixture, the same trends
are evident. The 18-hour accelerated curing specimens were grossly overestimated. In a
similar fashion, but to a lesser degree, all other loading ages were overestimated. Not
even the 90-day εCR values were within the preferred range.
This trend continues in Figures 5-18 through 5-20, becoming more pronounced as the
strength levels increase. This is especially evident in Figure 5-20, which shows the
comparison for the HS-SL mixture. In this figure, the εCR values are severely
overestimated and the trends for all loading ages are much steeper than any of the other
mixtures. It is clear by looking at these figures, that this method does not provide
accurate estimates of the εCR values for any of the concrete mixtures used in this study.
These conclusions are reaffirmed through the results in Tables 5-1 and 5-2, which
clearly show that the GL 2000 method provided results among the least accurate of all the
methods in this study. According to all three comparison statistics, the estimation errors
associated with this method grow as the concrete strength level rises, which agrees with
the visual information provided in Figures 5-16 through 5-20.
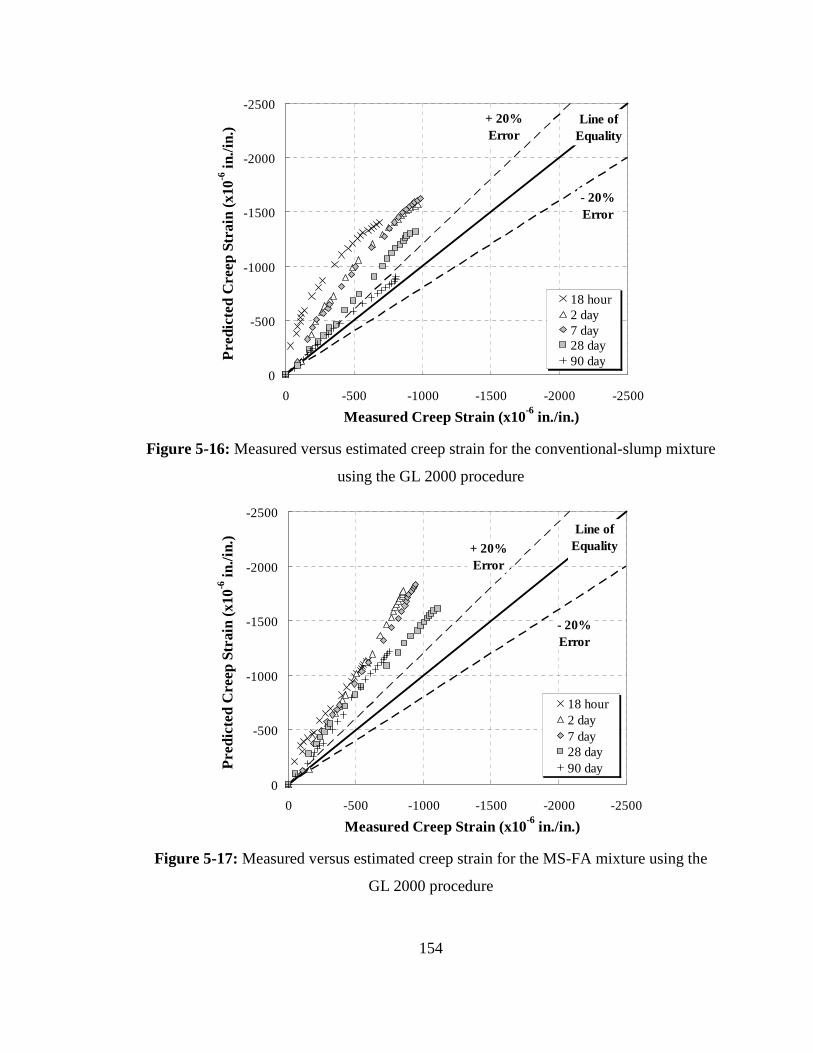
154
-2500
-2000
-1500
-1000
-500
0
-2500-2000-1500-1000-5000
Measured Creep Strain (x10-6 in./in.)
Pre
dict
ed C
reep
Str
ain
(x10
-6 in
./in.
)
18 hour2 day7 day28 day90 day
+ 20% Error
- 20% Error
Line of Equality
Figure 5-16: Measured versus estimated creep strain for the conventional-slump mixture
using the GL 2000 procedure
-2500
-2000
-1500
-1000
-500
0
-2500-2000-1500-1000-5000
Measured Creep Strain (x10-6 in./in.)
Pre
dict
ed C
reep
Str
ain
(x10
-6 in
./in.
)
18 hour2 day7 day28 day90 day
+ 20% Error
- 20% Error
Line of Equality
Figure 5-17: Measured versus estimated creep strain for the MS-FA mixture using the
GL 2000 procedure
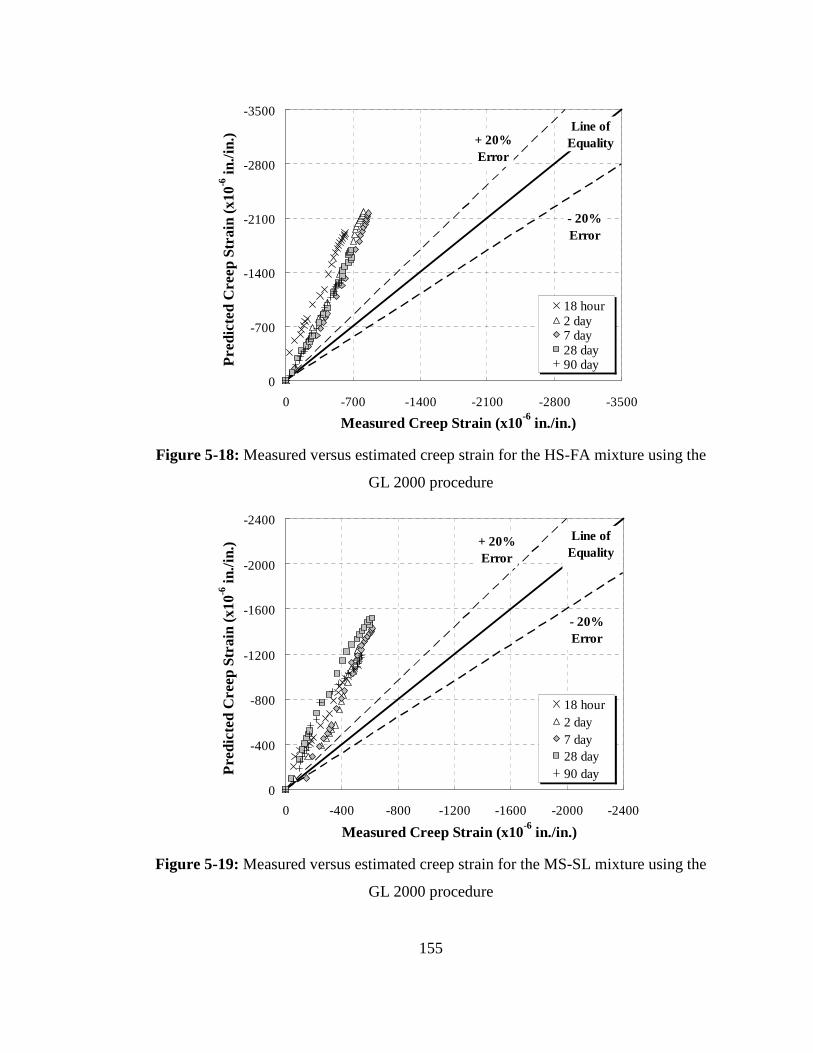
155
-3500
-2800
-2100
-1400
-700
0
-3500-2800-2100-1400-7000
Measured Creep Strain (x10-6 in./in.)
Pre
dict
ed C
reep
Str
ain
(x10
-6 in
./in.
)
18 hour2 day7 day28 day90 day
+ 20% Error
- 20% Error
Line of Equality
Figure 5-18: Measured versus estimated creep strain for the HS-FA mixture using the
GL 2000 procedure
-2400
-2000
-1600
-1200
-800
-400
0
-2400-2000-1600-1200-800-4000
Measured Creep Strain (x10-6 in./in.)
Pre
dict
ed C
reep
Str
ain
(x10
-6 in
./in.
)
18 hour2 day7 day28 day90 day
+ 20% Error
- 20% Error
Line of Equality
Figure 5-19: Measured versus estimated creep strain for the MS-SL mixture using the
GL 2000 procedure
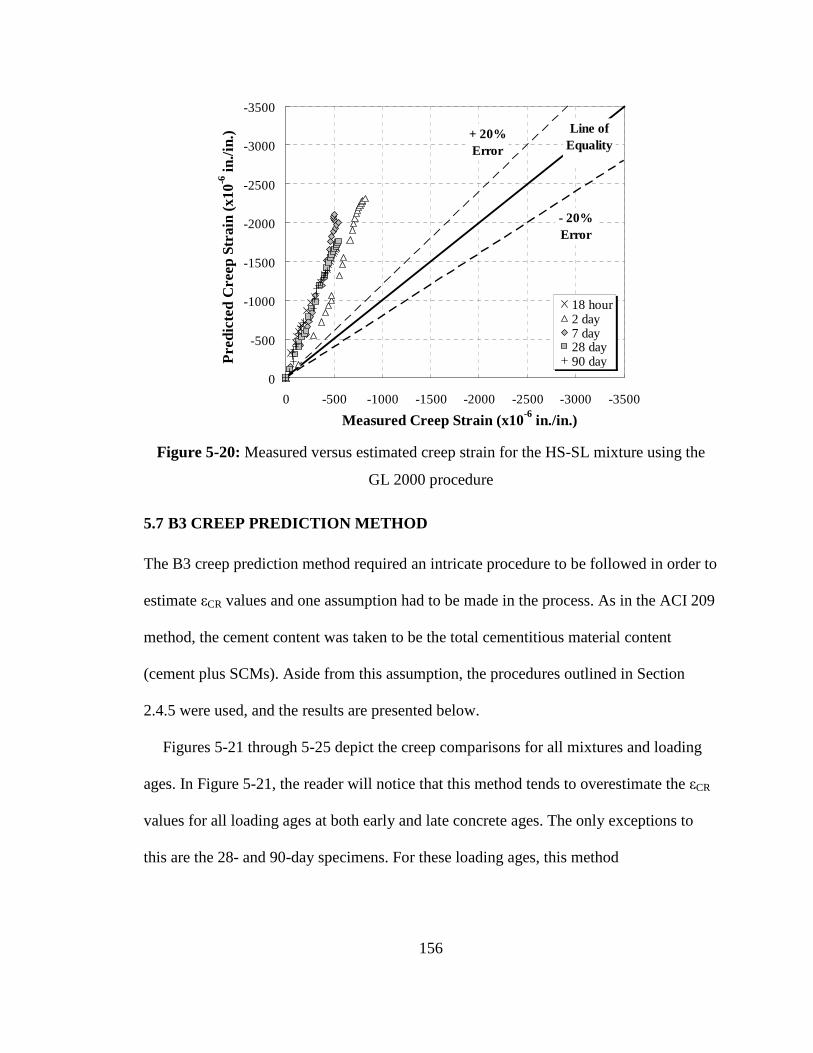
156
-3500
-3000
-2500
-2000
-1500
-1000
-500
0
-3500-3000-2500-2000-1500-1000-5000
Measured Creep Strain (x10-6 in./in.)
Pre
dict
ed C
reep
Str
ain
(x10
-6 in
./in.
)
18 hour2 day7 day28 day90 day
+ 20% Error
- 20% Error
Line of Equality
Figure 5-20: Measured versus estimated creep strain for the HS-SL mixture using the
GL 2000 procedure
5.7 B3 CREEP PREDICTION METHOD
The B3 creep prediction method required an intricate procedure to be followed in order to
estimate εCR values and one assumption had to be made in the process. As in the ACI 209
method, the cement content was taken to be the total cementitious material content
(cement plus SCMs). Aside from this assumption, the procedures outlined in Section
2.4.5 were used, and the results are presented below.
Figures 5-21 through 5-25 depict the creep comparisons for all mixtures and loading
ages. In Figure 5-21, the reader will notice that this method tends to overestimate the εCR
values for all loading ages at both early and late concrete ages. The only exceptions to
this are the 28- and 90-day specimens. For these loading ages, this method

157
underestimated the εCR values for the early concrete ages and then overestimates them at
later concrete ages.
Figure 5-22 shows the creep comparison for the MS-FA mixture. This method tends to
overestimate all εCR values for the early ages of the 18-hour, 2-, and 7-day specimens,
which are overestimated for all concrete ages. The 28- and 90-day specimens are
underestimated early on, but then overestimated at later concrete ages; however, the 28-
day estimated εCR values do, for the most part, stay within the ± 20% error range at all
times.
Figures 5-23 through 5-25 also reveal that the εCR values are overestimated at later
concrete ages for all five loading ages. From the trends seen in these three figures, it
appears that this method is unable to accurately predict creep strain in high-strength
concrete mixtures.
This argument is further strengthened by the results from the statistical comparison
found in Tables 5-1 and 5-2. From these tables, it can be seen that, statistically, the B3
method is among the least accurate of all the methods in this study, especially with the
high-strength concrete mixtures. This can be seen with the increasing values from both
the AAE and AA%E calculations for the non-accelerated- and accelerated-cured
specimens. It is only surpassed in inaccuracy by the GL 2000 method.
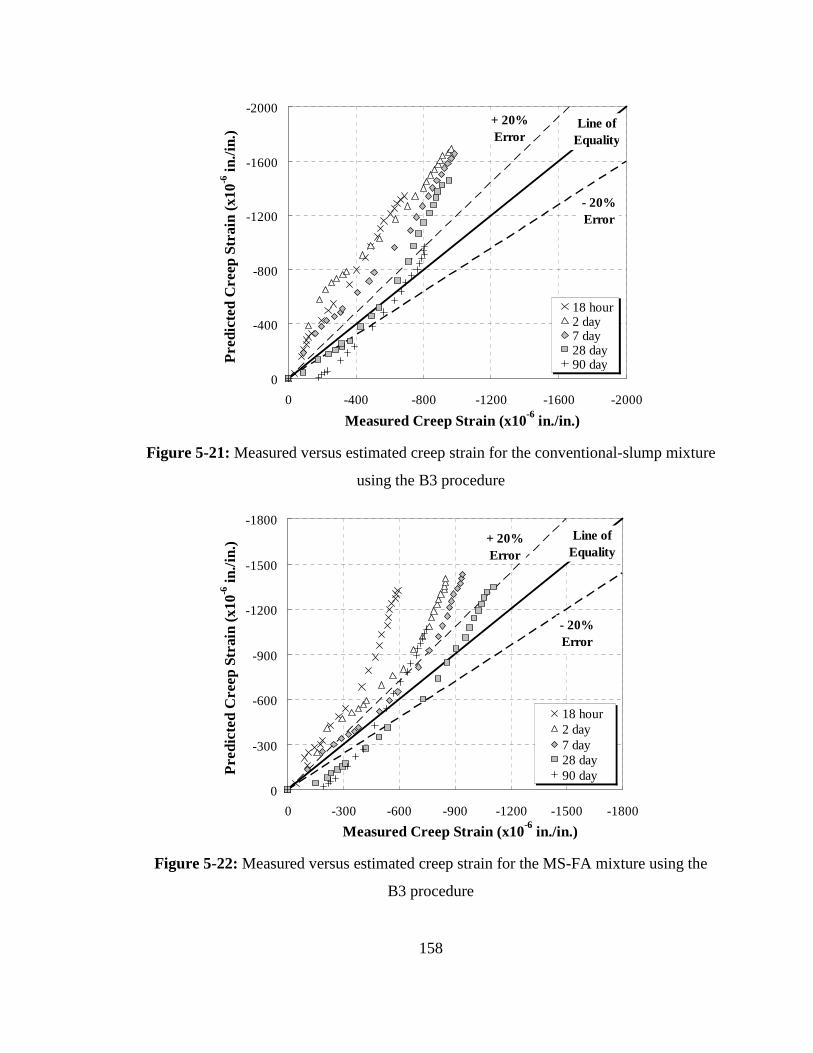
158
-2000
-1600
-1200
-800
-400
0
-2000-1600-1200-800-4000
Measured Creep Strain (x10-6 in./in.)
Pre
dict
ed C
reep
Str
ain
(x10
-6 in
./in.
)
18 hour2 day7 day28 day90 day
+ 20% Error
- 20% Error
Line of Equality
Figure 5-21: Measured versus estimated creep strain for the conventional-slump mixture
using the B3 procedure
-1800
-1500
-1200
-900
-600
-300
0
-1800-1500-1200-900-600-3000
Measured Creep Strain (x10-6 in./in.)
Pre
dict
ed C
reep
Str
ain
(x10
-6 in
./in.
)
18 hour2 day7 day28 day90 day
+ 20% Error
- 20% Error
Line of Equality
Figure 5-22: Measured versus estimated creep strain for the MS-FA mixture using the
B3 procedure
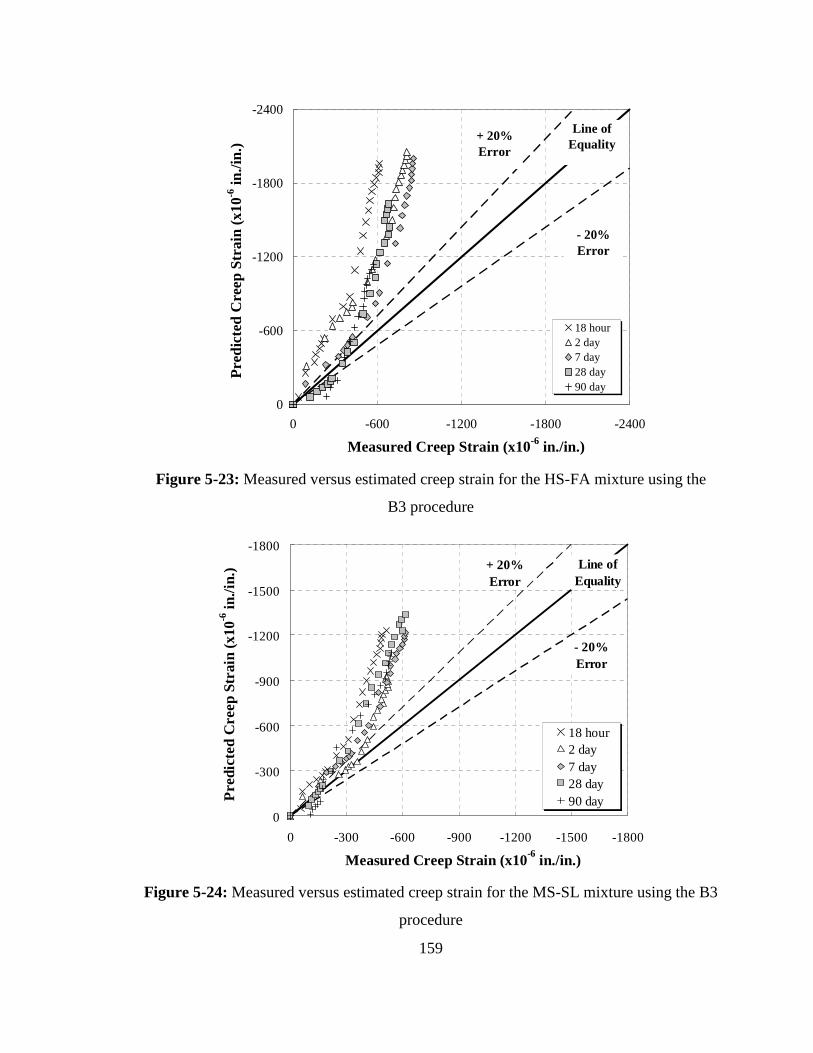
159
-2400
-1800
-1200
-600
0
-2400-1800-1200-6000
Measured Creep Strain (x10-6 in./in.)
Pre
dict
ed C
reep
Str
ain
(x10
-6 in
./in.
)
18 hour2 day7 day28 day90 day
+ 20% Error
- 20% Error
Line of Equality
Figure 5-23: Measured versus estimated creep strain for the HS-FA mixture using the
B3 procedure
-1800
-1500
-1200
-900
-600
-300
0
-1800-1500-1200-900-600-3000
Measured Creep Strain (x10-6 in./in.)
Pre
dict
ed C
reep
Str
ain
(x10
-6 in
./in.
)
18 hour2 day7 day28 day90 day
+ 20% Error
- 20% Error
Line of Equality
Figure 5-24: Measured versus estimated creep strain for the MS-SL mixture using the B3
procedure
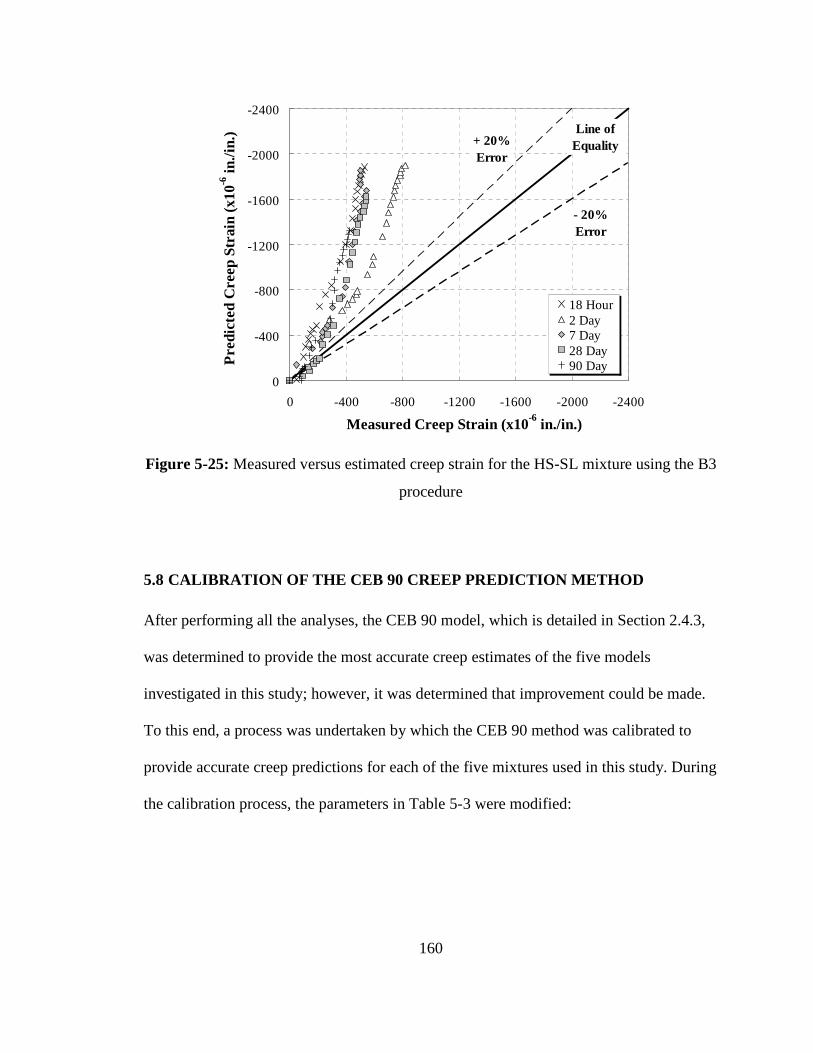
160
-2400
-2000
-1600
-1200
-800
-400
0
-2400-2000-1600-1200-800-4000
Measured Creep Strain (x10-6 in./in.)
Pre
dict
ed C
reep
Str
ain
(x10
-6 in
./in.
)
18 Hour2 Day7 Day28 Day90 Day
+ 20% Error
- 20% Error
Line of Equality
Figure 5-25: Measured versus estimated creep strain for the HS-SL mixture using the B3
procedure
5.8 CALIBRATION OF THE CEB 90 CREEP PREDICTION METHOD
After performing all the analyses, the CEB 90 model, which is detailed in Section 2.4.3,
was determined to provide the most accurate creep estimates of the five models
investigated in this study; however, it was determined that improvement could be made.
To this end, a process was undertaken by which the CEB 90 method was calibrated to
provide accurate creep predictions for each of the five mixtures used in this study. During
the calibration process, the parameters in Table 5-3 were modified:

161
Table 5-3: Parameters used in the Modified CEB 90 method
Parameter Original Formulation Non-Accelerated-Cured Formulation
Accelerated-Cured Formulation
)( cmfβ )5.0()/(
3.5
cmocm ff
)5.0()/(
3.5
cmocm ff
)5.0()/(
65.4
cmocm ff
)( 0tβ ( ) )2.0(10 /1.0
1
tt+
( ) )18.0(10 /26.0
1
tt+
( ) )18.0(10 /26.0
1
tt+
)( 0tβ )3.0(
10
10
/)(
/)(
−+−
ttt
ttt
Hβ
)27.0(
10
10
/)(
/)(
−+−
ttt
ttt
Hβ
35.0
10
10
/)(
/)(
−+−
ttt
ttt
Hβ
The following variables, which are defined below, were used in the equations in the
Table 5-3:
ƒcm = mean compressive strength of concrete at 28 days (MPa)
ƒcmo = 10 MPa
t0 = age of concrete at time of loading (days)
t1 = 1 day
t = age of concrete at the moment considered (days)
15002502.111500
18
0
≤+
+=
h
h
RH
RHHβ
In addition to these parameters, the maturity function used in the CEB 90 method to
account for curing conditions was changed. The following equation shows the original
formulation:
( ){ }∑=
∆+−∆=
n
i iiT TtT
tt1 0/273
400065.13exp

162
During the calibration process, the previous equation was updated with an activation
energy of 45,000 J/mol, which provided the following equation for both the non-
accelerated- and accelerated-cured specimens:
( ){ }∑=
∆+−∆=
n
i iiT TtT
tt1 0/273
541047.18exp
where,
tT = temperature adjusted concrete age which replaces t in the
corresponding equations (days)
∆ti = increment of days where T prevails
T(∆ti) = the temperature (˚C) during the time period ∆ti
T0 = 1 ˚C
With the parameter modifications list above, predictions using the calibrated CEB 90
method, which is referred to as the Modified CEB 90 method, were completed in the
manner described in Section 2.4.3.
Tables 5-4 and 5-5 show the results from the comparison statistics calculations that
were performed to evaluate the Modified CEB 90 method. Also shown are the statistical
values for the CEB 90 method. The statistics used in these tables are detailed in Section
5.2.1.
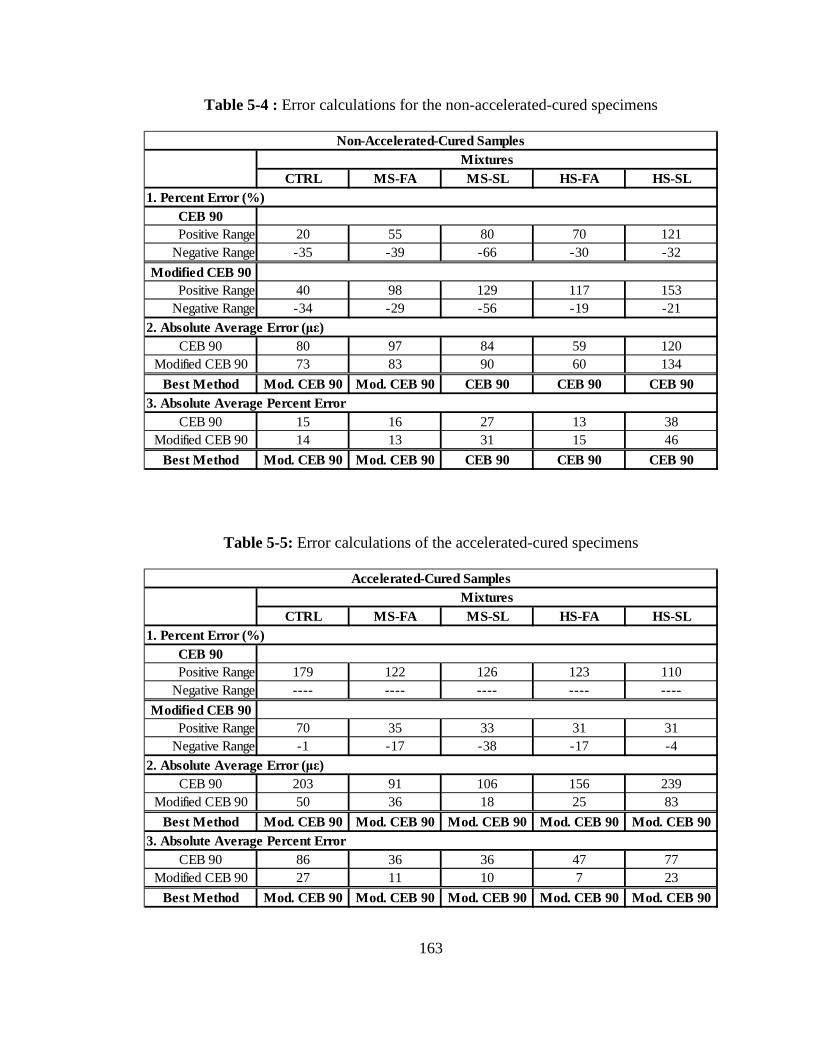
163
Table 5-4 : Error calculations for the non-accelerated-cured specimens
CTRL MS-FA MS-SL HS-FA HS-SL
20 55 80 70 121-35 -39 -66 -30 -32
40 98 129 117 153-34 -29 -56 -19 -21
80 97 84 59 12073 83 90 60 134
Mod. CEB 90 Mod. CEB 90 CEB 90 CEB 90 CEB 90
15 16 27 13 3814 13 31 15 46
Mod. CEB 90 Mod. CEB 90 CEB 90 CEB 90 CEB 90
CEB 90
Best Method
Modified CEB 90
Best Method3. Absolute Average Percent Error
CEB 90Modified CEB 90
Negative Range
2. Absolute Average Error (µε)
Modified CEB 90Positive Range
Positive RangeNegative Range
Non-Accelerated-Cured SamplesMixtures
1. Percent Error (%)CEB 90
Table 5-5: Error calculations of the accelerated-cured specimens
CTRL MS-FA MS-SL HS-FA HS-SL
179 122 126 123 110---- ---- ---- ---- ----
70 35 33 31 31-1 -17 -38 -17 -4
203 91 106 156 23950 36 18 25 83
Mod. CEB 90 Mod. CEB 90 Mod. CEB 90 Mod. CEB 90 Mod. CEB 90
86 36 36 47 7727 11 10 7 23
Mod. CEB 90 Mod. CEB 90 Mod. CEB 90 Mod. CEB 90 Mod. CEB 90
CEB 90
Best Method
Modified CEB 90
Best Method3. Absolute Average Percent Error
CEB 90Modified CEB 90
Negative Range
2. Absolute Average Error (µε)
Modified CEB 90Positive Range
Positive RangeNegative Range
Accelerated-Cured SamplesMixtures
1. Percent Error (%)CEB 90

164
Figures 5-26 through 5-27 depict the estimated εCR values calculated using the
Modified CEB 90 method versus the measured creep values. From Figure 5-26 it can be
seen that the Modified CEB 90 method provides accurate estimations of the εCR for all
loading ages of the conventional-slump mixture. In fact the only εCR values that are
outside of the ± 20% error range are the later ages of the 28- and 90-day specimens. Even
these are within close proximity of the preferred tolerance. Furthermore, in Tables 5-4
and 5-5, the accuracy of this modified method is further reinforced. The AA%E values
displayed in both of these tables illustrate that this method is an improvement from the
CEB 90 method, especially with regards to the accelerated-cured specimens.
Figure 5-27 shows the estimated versus measured εCR values for the MS-FA mixture.
From this figure it can be seen that the modified method provides accurate estimations of
the εCR. Here again the only εCR values that are outside the ± 20% range are the later-age
values 28-day specimens. The accuracy of this method is further revealed in Tables 5-4
and 5-5, which show an improvement in the AA%E statistical values when comparing the
CEB 90 method and the Modified CEB 90 method.
Figure 5-28 shows trends similar to Figures 5-26 and 5-27 in that the estimated values
remain predominately within the ± 20% tolerance range. In contrast, Figures 5-29 and 5-
30 show a decrease in the accuracy of this method as the strength level raises. In fact, the
only improvement in accuracy from the CEB 90 method is associated with the
accelerated-cured specimens. In Table 5-5 this can be seen in the form of the AA%E
values, where the Modified CEB 90 method has only a 23% error while the CEB 90
method has a 77% error.
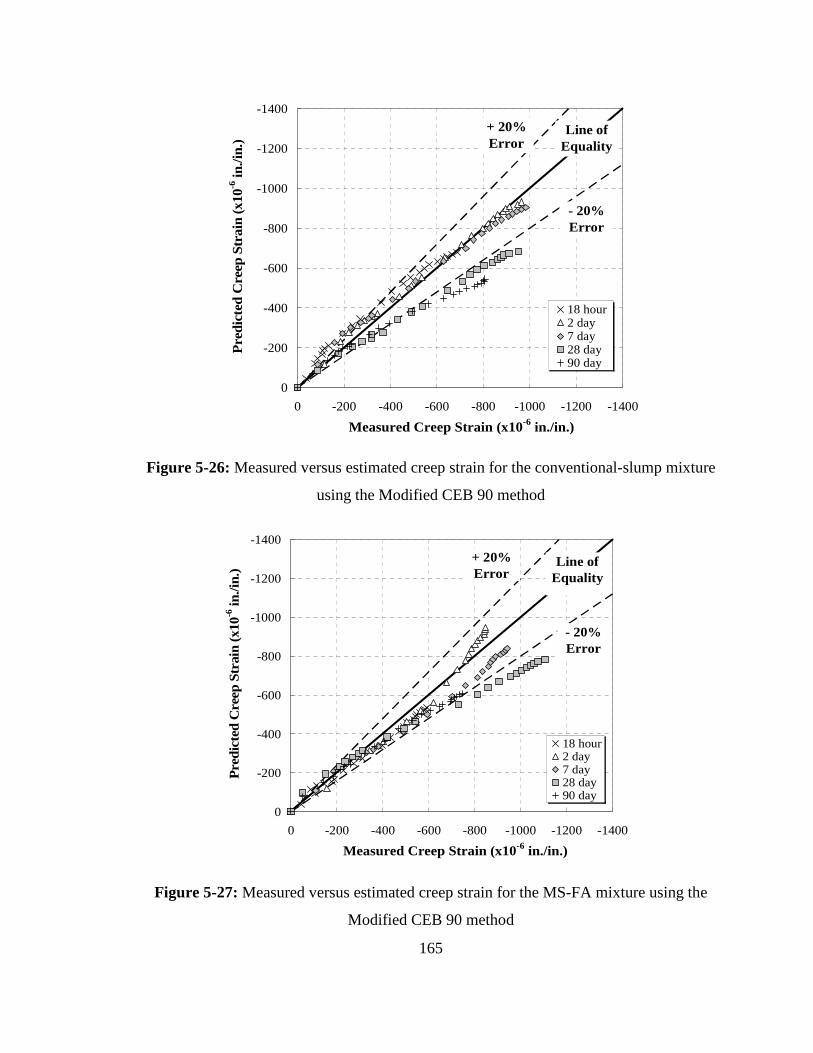
165
-1400
-1200
-1000
-800
-600
-400
-200
0
-1400-1200-1000-800-600-400-2000
Measured Creep Strain (x10-6 in./in.)
Pre
dict
ed C
reep
Str
ain
(x10
-6 in
./in.
)
18 hour2 day7 day28 day90 day
+ 20% Error
- 20% Error
Line of Equality
Figure 5-26: Measured versus estimated creep strain for the conventional-slump mixture
using the Modified CEB 90 method
-1400
-1200
-1000
-800
-600
-400
-200
0
-1400-1200-1000-800-600-400-2000
Measured Creep Strain (x10-6 in./in.)
Pre
dict
ed C
reep
Str
ain
(x10
-6 in
./in.
)
18 hour2 day7 day28 day90 day
+ 20% Error
- 20% Error
Line of Equality
Figure 5-27: Measured versus estimated creep strain for the MS-FA mixture using the
Modified CEB 90 method
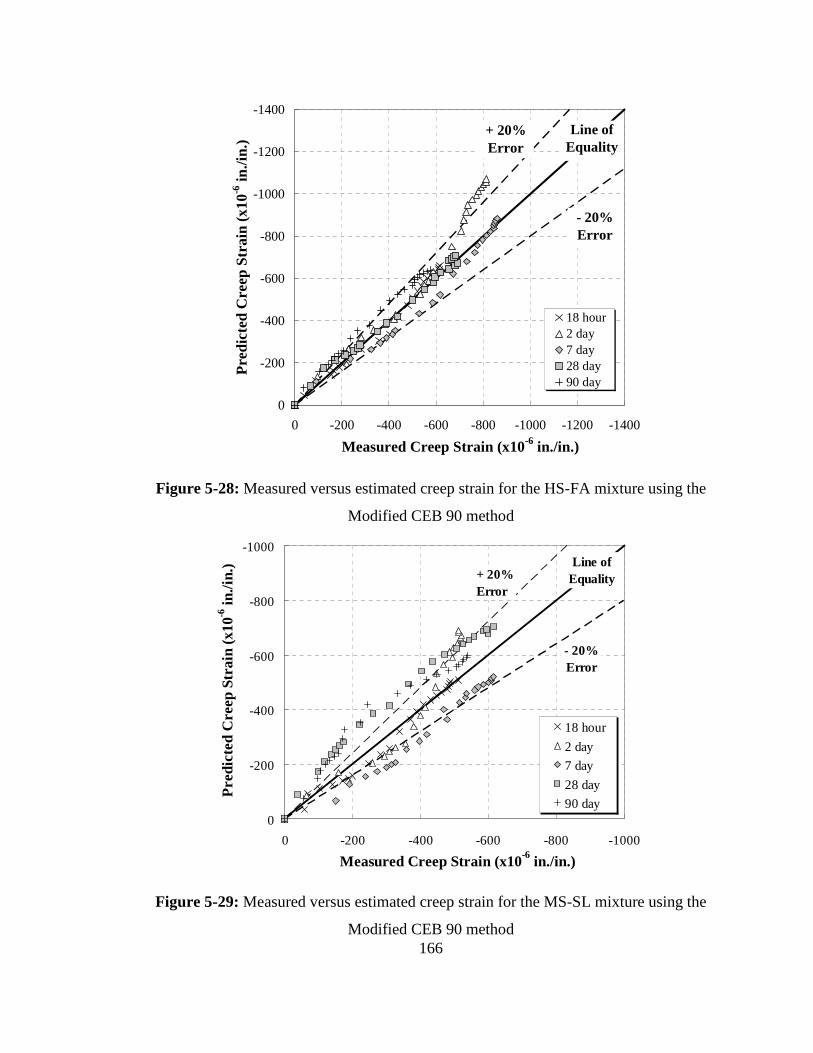
166
-1400
-1200
-1000
-800
-600
-400
-200
0
-1400-1200-1000-800-600-400-2000
Measured Creep Strain (x10-6 in./in.)
Pre
dict
ed C
reep
Str
ain
(x10
-6 in
./in.
)
18 hour2 day7 day28 day90 day
+ 20% Error
- 20% Error
Line of Equality
Figure 5-28: Measured versus estimated creep strain for the HS-FA mixture using the
Modified CEB 90 method
-1000
-800
-600
-400
-200
0
-1000-800-600-400-2000
Measured Creep Strain (x10-6 in./in.)
Pre
dict
ed C
reep
Str
ain
(x10
-6 in
./in.
)
18 hour
2 day
7 day
28 day
90 day
+ 20% Error
- 20% Error
Line of Equality
Figure 5-29: Measured versus estimated creep strain for the MS-SL mixture using the
Modified CEB 90 method
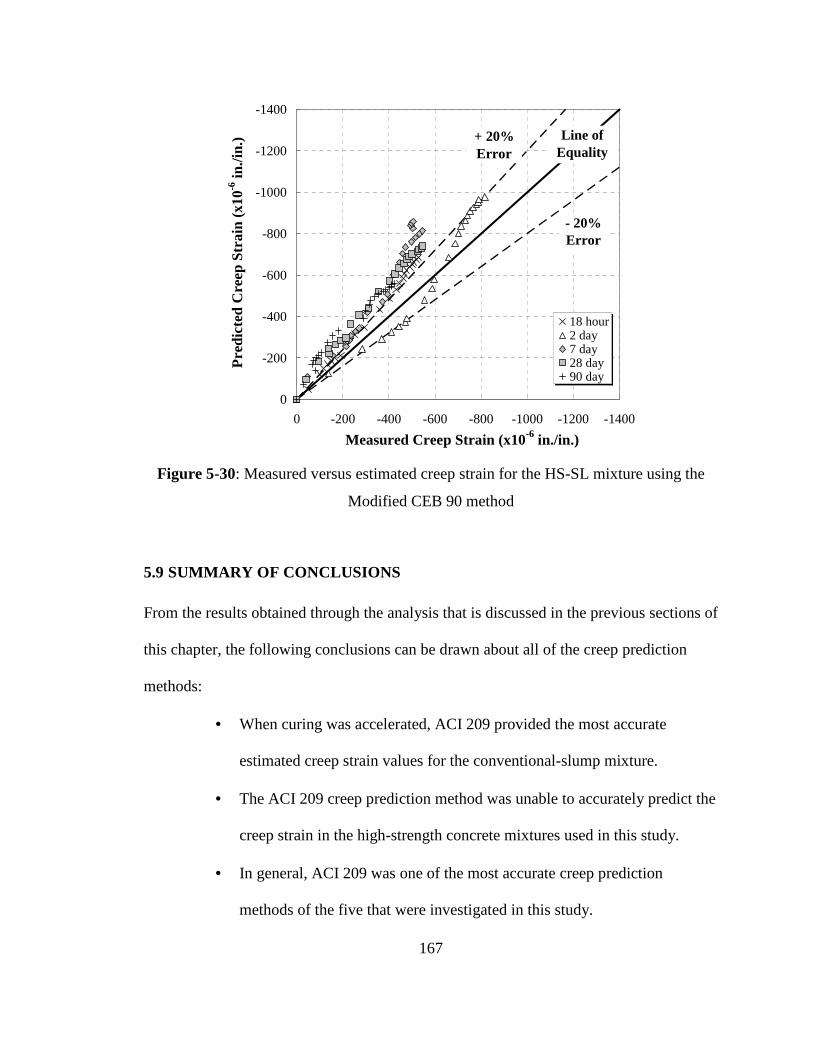
167
-1400
-1200
-1000
-800
-600
-400
-200
0
-1400-1200-1000-800-600-400-2000
Measured Creep Strain (x10-6 in./in.)
Pre
dict
ed C
reep
Str
ain
(x10
-6 in
./in.
)
18 hour2 day7 day28 day90 day
+ 20% Error
- 20% Error
Line of Equality
Figure 5-30: Measured versus estimated creep strain for the HS-SL mixture using the
Modified CEB 90 method
5.9 SUMMARY OF CONCLUSIONS
From the results obtained through the analysis that is discussed in the previous sections of
this chapter, the following conclusions can be drawn about all of the creep prediction
methods:
• When curing was accelerated, ACI 209 provided the most accurate
estimated creep strain values for the conventional-slump mixture.
• The ACI 209 creep prediction method was unable to accurately predict the
creep strain in the high-strength concrete mixtures used in this study.
• In general, ACI 209 was one of the most accurate creep prediction
methods of the five that were investigated in this study.
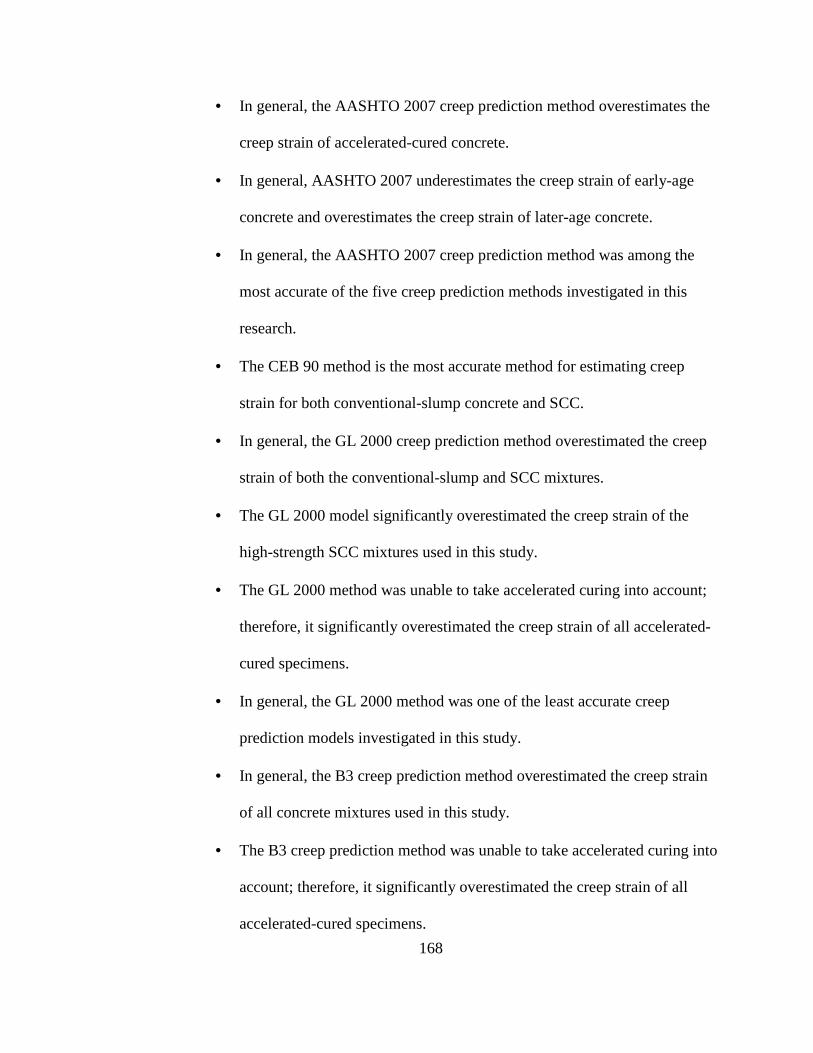
168
• In general, the AASHTO 2007 creep prediction method overestimates the
creep strain of accelerated-cured concrete.
• In general, AASHTO 2007 underestimates the creep strain of early-age
concrete and overestimates the creep strain of later-age concrete.
• In general, the AASHTO 2007 creep prediction method was among the
most accurate of the five creep prediction methods investigated in this
research.
• The CEB 90 method is the most accurate method for estimating creep
strain for both conventional-slump concrete and SCC.
• In general, the GL 2000 creep prediction method overestimated the creep
strain of both the conventional-slump and SCC mixtures.
• The GL 2000 model significantly overestimated the creep strain of the
high-strength SCC mixtures used in this study.
• The GL 2000 method was unable to take accelerated curing into account;
therefore, it significantly overestimated the creep strain of all accelerated-
cured specimens.
• In general, the GL 2000 method was one of the least accurate creep
prediction models investigated in this study.
• In general, the B3 creep prediction method overestimated the creep strain
of all concrete mixtures used in this study.
• The B3 creep prediction method was unable to take accelerated curing into
account; therefore, it significantly overestimated the creep strain of all
accelerated-cured specimens.

169
• The B3 model significantly overestimated the creep strain of the high-
strength SCC mixtures used in this study.
• In general, the B3 creep prediction method was one of the least accurate
creep prediction methods investigated in this study
• The Modified CEB 90 method provides improved accuracy with regards
to estimating the creep strain of all the moderate-strength mixtures in this
study when compared to the CEB 90 method, except for the MS-SL
mixture.
• The Modified CEB 90 method provides improved accuracy with regards
to estimating the creep strain of all the accelerated-cured specimens in this
study when compared to the CEB 90 method.
170
CHAPTER 6
CONCLUSIONS AND RECOMMENDATIONS
6.1 SUMMARY OF LABORATORY WORK
For this study, four SCC mixtures and one conventional-slump mixture were mixed and
tested to determine the creep behavior of each. The SCC mixtures were comprised of
varying types and quantities of constituent materials. This included Type III portland
cement and two types of supplementary cementing materials (Class C fly ash and GGBF
slag), for which the replacement percentages were varied. Two different water-to-
cementitious materials ratios were also used for the various SCC mixtures. Compressive
strength, creep, and drying shrinkage data were gathered for all mixtures. In addition,
eight 6 in. x 12 in. cylinders were accelerated-cured at elevated temperatures similar to
those used by the prestressing industry in the Southeastern United States.
For each SCC mixture, the slump flow, VSI, T-50, and total air content values were
determined. The compressive strength testing was conducted on 6 in. x 12 in. cylinders in
accordance with AASHTO T 22 (2003). Creep and drying shrinkage specimens were
made from 6 in. x 12 in. cylinders and were tested according ASTM C 512 (2006).
Specimens of each mixture were loaded at five loading ages to determine the creep
response of each mixture. All specimens were loaded to 40 percent of their compressive
strength at the time of insertion into the creep frames.
171
6.2 CONCLUSIONS
6.2.1 FRESH PROPERTIES
From this research, the following conclusion can be drawn about the fresh properties of
SCC:
1. For a given SCM, as the w/cm decreases, the T-50 time increases, which
indicates that the viscosity increases with a decrease in w/cm.
2. GGBF slag mixtures exhibited larger T-50 times than fly ash mixtures
proportioned to provide similar 18-hour strength.
6.2.2 HARDENED PROPERTIES
From this research, the following conclusions can be drawn about the hardened properties
of SCC:
1. Mixtures containing GGBF slag gained compressive strength at a slower
rate than those containing a cement replacement of Class C fly ash.
2. When curing is accelerated and the load is applied at 18 hours, the creep
of all the SCC mixtures is less than the creep of the conventional-slump
mixture.
3. Since the accelerated curing condition simulates plant conditions,
excessive creep in not expected for full-scale members constructed with
these SCC mixtures.

172
4. All SCC mixtures cured under elevated or standard laboratory temperature
exhibited creep values similar to or less that the conventional-slump
concrete mixture.
5. When curing is not accelerated, the creep behavior of the moderate-
strength fly ash SCC and conventional-slump mixture is similar.
6. The high-strength mixtures had the highest paste content, but exhibited
less creep than any of the moderate-strength mixtures. This is attributed to
the increased strength and decreased permeability of the hydrated cement
paste of these low-w/cm mixtures.
7. At a fixed w/cm, SCC mixtures made with GGBF slag creep less than
those made with fly ash, regardless of the age at loading.
8. All SCC mixtures exhibited lower drying shrinkage as the w/cm
decreased.
9. All SCC mixtures exhibited drying shrinkage strains that were similar in
magnitude to the conventional-slump mixture. For this reason, full-scale
members constructed with SCC are not expected to experience excessive
drying shrinkage.
6.2.3 CREEP PREDICTION METHODS
Based on the results obtained through this research, the following conclusions can be
drawn:
1. When curing was accelerated, ACI 209 provided the most accurate
estimated creep strain values for the conventional-slump mixture.
173
2. The ACI 209 creep prediction method was unable to accurately predict the
creep strain in the high-strength concrete mixtures used in this study.
3. In general, ACI 209 was one of the most accurate creep prediction
methods of the five that were investigated in this study.
4. In general, the AASHTO 2007 creep prediction method overestimates the
creep strain of accelerated-cured concrete.
5. In general, AASHTO 2007 underestimates the creep strain of early-age
concrete and overestimates the creep strain of later-age concrete.
6. In general, the AASHTO 2007 creep prediction method was among the
most accurate of the five creep prediction methods investigated in this
research.
7. The CEB 90 method is the most accurate method for estimating creep
strain for both conventional-slump concrete and SCC.
8. In general, the GL 2000 creep prediction method overestimated the creep
strain of both the conventional-slump and SCC mixtures.
9. The GL 2000 model significantly overestimated the creep strain of the
high-strength SCC mixtures used in this study.
10. The GL 2000 method was unable to take accelerated curing into account;
therefore, it significantly overestimated the creep strain of all accelerated-
cured specimens.
11. In general, the GL 2000 method was one of the least accurate creep
prediction models investigated in this study.

174
12. In general, the B3 creep prediction method overestimated the creep strain
of all concrete mixtures used in this study.
13. The B3 creep prediction method was unable to take accelerated curing into
account; therefore, it significantly overestimated the creep strain of all
accelerated-cured specimens.
14. The B3 model significantly overestimated the creep strain of the high-
strength SCC mixtures used in this study.
15. In general, the B3 creep prediction method was one of the least accurate
creep prediction methods investigated in this study.
16. The Modified CEB 90 method provides improved accuracy with regards
to estimating the creep strain of all the moderate-strength mixtures in this
study when compared to the CEB 90 method, except for the MS-SL
mixture.
17. The Modified CEB 90 method provides improved accuracy with regards
to estimating the creep strain of all the accelerated-cured specimens in this
study when compared to the CEB 90 method.
6.3 RECOMMENDATIONS FOR FUTURE RESEARCH
Before implementing SCC into prestressed construction, future research needs to be
conducted. The following recommendations can be made based on the research detailed
in this report:

175
• Further research is required to determine the long-term creep behavior of
these SCC mixtures past one year.
• Creep and shrinkage testing should be performed on full-scale prestressed
elements to determine the behavior of these SCC mixtures in real-world
applications.

176
REFERENCES
AASHTO. 2007. AASHTO LRFD Bridge Design Specifications: Customary U.S. Units.
3rd ed. Washington D.C.: American Association of State Highway and Transportation
Officials (AASHTO).
AASHTO M 43. 2003. “Sizes of Aggregate for Road and Bridge Construction”. In
Standard Specifications for Transportation Materials and Methods of Sampling and
Testing. Washington, DC: American Association of State Highway and
Transportation Officials.
AASHTO M 6. 2003. “Fine Aggregate for Portland Cement Concrete”. In Standard
Specifications for Transportation Materials and Methods of Sampling and Testing.
Washington, DC: American Association of State Highway and Transportation
Officials.
AASHTO M 6. 2003. “Fine Aggregate for Portland Cement Concrete”. In Standard
Specifications for Transportation Materials and Methods of Sampling and Testing.
Washington, DC: American Association of State Highway and Transportation
Officials.
AASHTO M 6. 2003. “Fine Aggregate for Portland Cement Concrete”. In Standard
Specifications for Transportation Materials and Methods of Sampling and Testing.
Washington, DC: American Association of State Highway and Transportation
Officials.
177
AASHTO T 22. 2003. “Compressive Strength of Cylindrical Concrete Specimens”. In
Standard Specifications for Transportation Materials and Methods of Sampling and
Testing. Washington, DC: American Association of State Highway and
Transportation Officials.
AASHTO T 121. 2003. “Mass per Cubic Meter (Cubic Foot), Yield, and Air Content
(Gravimetric) of Concrete”. In Standard Specifications for Transportation Materials
and Methods of Sampling and Testing. Washington, DC: American Association of
State Highway and Transportation Officials.
AASHTO T 126. 2003. “Making and Curing Concrete Test Specimens in the
Laboratory”. In Standard Specifications for Transportation Materials and Methods of
Sampling and Testing. Washington, DC: American Association of State Highway and
Transportation Officials.
AASHTO T 231. 2003. “Capping Cylindrical Concrete Specimens”. In Standard
Specifications for Transportation Materials and Methods of Sampling and Testing.
Washington, DC: American Association of State Highway and Transportation
Officials.
AASHTO T 309. 2003. “Temperature of Freshly Mixed Portland Cement Concrete”. In
Standard Specifications for Transportation Materials and Methods of Sampling and
Testing. Washington, DC: American Association of State Highway and
Transportation Officials.
ACI 116. 2000. “Cement and Concrete Technology (ACI 116R)”. In ACI Manual of
Concrete Practice 2001: Part 1. Farmington Hills, Michigan: American Concrete
Institute, 116R-1-116R-73.
178
ACI 209. 1997. “Prediction of Creep, Shrinkage, and Temperature Effects in concrete
Structures (ACI 209R)”. In ACI Manual of Concrete Practice 2001: Part 1.
Farmington Hills, Michigan: American Concrete Institute, 209R-1-209R-47.
ACI 233. 2000. “Ground Granulated Blast-Furnace Slag as a Cementitious Constituent in
Concrete (ACI 233R)”. In ACI Manual of Concrete Practice 2001: Part 1.
Farmington Hills, Michigan: American Concrete Institute, 233R-1-233R-18.
Al-Manaseer, A., Lam, J. P. 2005. Statistical Evaluation of Shrinkage and Creep Models.
ACI Materials Journal 102, no.3: 170-176
Assaad, J., Khayat, K. H. and Daczko, J. 2004. Evaluation of Static Stability of Self-
Consolidating Concrete. ACI Materials Journal 101, no. 3: 207-215.
ASTM C 150. 2006. “Specification for Portland Cement”. ASTM International. West
Conshohocken, Pennsylvania.
ASTM C 512. 2006. “Standard Test for Creep in Concrete”. ASTM International. West
Conshohocken, Pennsylvania.
ASTM C 1611. 2006. “Standard Test Method for Slump Flow of Self-Consolidating
Concrete”. ASTM International. West Conshohocken, Pennsylvania.
Bazant, Z. P. 2001. Prediction of Concrete Creep and Shrinkage: Past, Present and
Future. Nuclear Engineering and Design 203, no. 1: 27-38.
Bazant, Z. P. and Baweja, S. 2000. “Description of Model B3 and Prediction Procedure”.
In The Adam Neville Symposium: Creep and Shrinkage – Structural Design Effects,
ed. A. Al-Manaseer. Farmington Hills, Michigan: American Concrete Institute, 3-34.
Carino, N.J., and Tank, R.C. 1992. Maturity Functions for Concrete Made with Various
Cements and Admixtures. ACI Materials Journal 89, no. 2: 188-196
179
CEB. 1990. “Creep and Shrinkage”. In CEB-FIP Model Code 1990. Lausanne,
Switzerland: Comite Euro-International du Beton (CEB), 53-65.
Chopin, D., Francy, O., Lebourgeois, S. and Rougeau, P. 2003. “Creep and Shrinkage of
Accelerated-cured Self-Compacting Concrete”. In Self-Compacting Concrete:
Proceedings of the 3rd International RILEM Symposium, ed. O. Wallevik and I.
Nielsson. Bagneux, France: RILEM Publications, 672-683.
Collepardi, M., Borsoi, A., Collepardi, S., and Troli, R. 2005. “Strength, Shrinkage and
Creep of SCC and Flowing Concrete”. In Second North American Conference on the
Design and Use of Self-Consolidating Concrete and the Fourth International RILEM
Symposium on Self-Compacting Concrete, 911-920. Addison, Illinois: Hanley-Wood.
D’Ambrosia, M. D., Lange, D. A., and Brinks, A. J., 2005. “Restrained Shrinkage and
Creep of SCC and Flowing Concrete”. In Second North American Conference on the
Design and Use of Self-Consolidating Concrete and the Fourth International RILEM
Symposium on Self-Compacting Concrete, 921-928. Addison, Illinois: Hanley-Wood.
Domone, P. 2000. “Mix Design”. In State-of-the-Art Report (23) of RILEM Technical
Committee 174-SCC, ed. A. Skarendahl and O. Petersson. Cachan Cedex, France:
RILEM Publications, 49-56.
Gardner, N. J. and Lockman, M. J. 2001. Design Provisions for Drying Shrinkage and
Creep of Normal-Strength Concrete. ACI Materials Journal 98, no. 2: 159-167
Khayat, K. H. 1999. Workability, Testing, and Performance of Self-Consolidating
Concrete. ACI Materials Journal 96, no. 3: 346-353.
180
Khayat, K and Daczko, J. 2003. “The Holistic Approach to Self-Consolidating Concrete”.
In First North American Conference on the Design and Use of Self-Consolidating
Concrete 12-13 November 2002, ed. S. Shah, J. Daczko, and J. Lingscheit. Addison,
Illinois: Hanley-Wood, 9-14.
Khayat, K., Hu, C. and Monty, H. 1999. “Stability of Self-Consolidating Concrete,
Advantages and Potential Applications”. In Self-Compacting Concrete: Proceedings
of the First International RILEM Symposium, ed. A. Skarendahl and O. Petersson.
Cachan Cedex, France: RILEM Publications, 143-152.
Lee, Y., Yi, S. T., Kim, M. S. and Kim, J. K. 2006. Evaluation of a Basic Creep Model
with Respect to Autogeneous Shrinkage. Cement and Concrete Research 36, no. 7:
1268-1278.
Mindess, S., Young, J. F. and Darwin, D. 2003. Concrete, 2nd edition. Upper Saddle
River, New Jersey: Prentice Hall.
Muller, H. S. and Hillsdorf, H. K. 1990. “Evaluation of the Time-Dependent Behavior of
Concrete, Summary Report on the Work of General Task Group 9”. CEB Bulletin d’
Information, no. 199: 290
National Cooperative Highway Research Program (NCHRP). 2003. Report 496:
Prestressed Losses in Pretension High-Strength Concrete Bridge Girders.
Neville, A. M. 1996. Properties of Concrete, 4th. New York, New York: John Wiley &
Sons, Inc.
181
Okamura, H. and Ouchi, M. 1999. “Self-Compacting Concrete. Development, Present
Use and Future”. In Self-Compacting Concrete: Proceedings of the First
International RILEM Symposium, ed. A. Skarendal and O. Petersson. Cachan Cedex,
France: RILEM Publications, 3-14
Pierard, J., Dieryck, V., and Desmyter, J. 2005. “Autogeneous Shrinkage of Self-
Compacting Concrete”. In Second North American Conference on the Design and
Use of Self-Consolidating Concrete and the Fourth International RILEM Symposium
on Self-Compacting Concrete, 1013-1022. Addison, Illinois: Hanley-Wood.
Precast/Prestressed Concrete Institute (PCI). 2004. Interim Guidelines for the Use of Self-
Consolidating Concrete in Precast/Prestressed Concrete Institute Member Plants, 1st
edition. Chicago, Illinois: Precast/Prestressed Concrete Institute.
Raghavan, K.P., Sarma, B.S., Chattopadhyay, D. 2003. “Creep, Shrinkage and Chloride
Permeability Properties of Self-Consolidating Concrete”. In First North American
Conference on the Design and Use of Self-Consolidating Concrete 12-13 November
2002, ed. S. Shah, J. Daczko, and J. Lingsheit, 307-317. Addison, Illinois: Hanley-
Wood.
Roberts, J. 2005. Evaluation of Self-Consolidating Concrete for Use in Prestressed Girder
Applications. M.S. Thesis, Auburn University.
Schindler A.K., Barnes, R.W., Roberts, J.B., Rodriguez, S. 2006. Properties of Self-
Consolidating Concrete for Prestressed Members. ACI Materials Journal 104, no.1:
53-61.
182
Seng, V. and Shima, H. 2005. “Creep and Shrinkage of Self-Compacting Concrete with
Different Limestone Powder Contents”. In Second North American Conference on the
Design and Use of Self-Consolidating Concrete and the Fourth International RILEM
Symposium on Self-Compacting Concrete, 981-987. Addison, Illinois: Hanley-Wood.
Tangtermsirikul, S. and Khayat, K. 2000. “Fresh Concrete Properties”. In State-of-the-
Art-Report (23) of RILEM Technical Committee 174-SCC, ed. A. Skarendahl and O.
Petersson. Cachan Cedex, France: RILEM Publications, 17-22.

183
APPENDICES

184
APPENDIX A
RAW TEST DATA
A.1 COLLECTED TEST DATA
Tables A-1 through A-25 contain all creep test data collected during this study. Each
table contains the total strain, drying shrinkage strain, creep strain, and applied load level
for the individual loading age that is identified on the top line. Also provided are the
compressive strength of the loading age and the target applied load level. Furthermore,
the quality control compressive strength of the loading age is given. This test was done to
ensure all batches of a mixture were similar in strength.
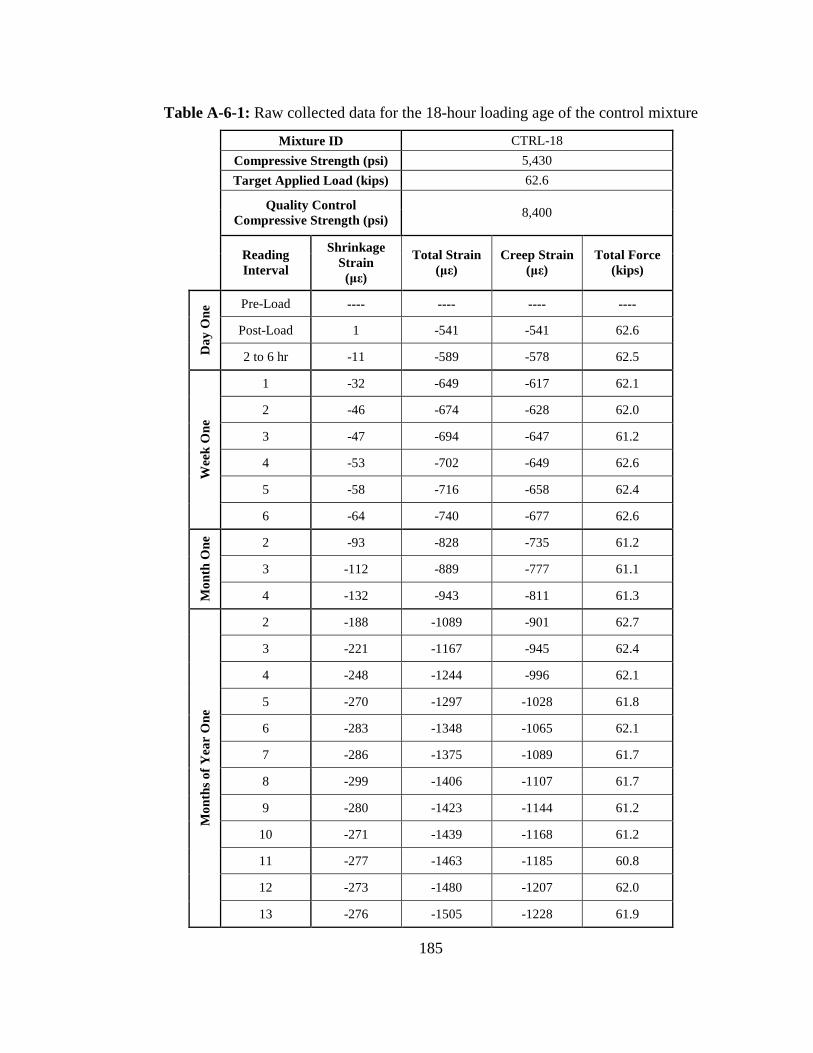
185
Table A-6-1: Raw collected data for the 18-hour loading age of the control mixture
Mixture ID CTRL-18
Compressive Strength (psi) 5,430
Target Applied Load (kips) 62.6
Quality Control Compressive Strength (psi)
8,400
Reading Interval
Shrinkage Strain (µε)
Total Strain (µε)
Creep Strain (µε)
Total Force (kips)
Pre-Load ---- ---- ---- ----
Post-Load 1 -541 -541 62.6
Day
One
2 to 6 hr -11 -589 -578 62.5
1 -32 -649 -617 62.1
2 -46 -674 -628 62.0
3 -47 -694 -647 61.2
4 -53 -702 -649 62.6
5 -58 -716 -658 62.4
Wee
k O
ne
6 -64 -740 -677 62.6
2 -93 -828 -735 61.2
3 -112 -889 -777 61.1
Mon
th O
ne
4 -132 -943 -811 61.3
2 -188 -1089 -901 62.7
3 -221 -1167 -945 62.4
4 -248 -1244 -996 62.1
5 -270 -1297 -1028 61.8
6 -283 -1348 -1065 62.1
7 -286 -1375 -1089 61.7
8 -299 -1406 -1107 61.7
9 -280 -1423 -1144 61.2
10 -271 -1439 -1168 61.2
11 -277 -1463 -1185 60.8
12 -273 -1480 -1207 62.0
Mon
ths
of Y
ear
One
13 -276 -1505 -1228 61.9

186
Table A-6-2: Raw collected data for the 2-day loading age of the control mixture
Mixture ID CTRL-2
Compressive Strength (psi) 5,850
Target Applied Load (kips) 65.9
Quality Control Compressive Strength (psi)
8,400
Reading Interval
Shrinkage Strain (µε)
Total Strain (µε)
Creep Strain (µε)
Total Force (kips)
Pre-Load ---- ---- ---- ----
Post-Load 0 -510 -510 65.9
Day
One
2 to 6 hr -3 -631 -627 67.0
1 -20 -715 -695 67.5
2 -22 -753 -731 67.5
3 -26 -794 -768 67.4
4 -29 -826 -796 67.0
5 -39 -872 -833 67.2
Wee
k O
ne
6 -47 -902 -855 67.3
2 -98 -1045 -947 66.9
3 -130 -1130 -999 67.1
Mon
th O
ne
4 -156 -1202 -1045 66.6
2 -222 -1367 -1145 67.5
3 -254 -1469 -1215 67.5
4 -282 -1543 -1261 67.5
5 -300 -1608 -1309 67.3
6 -318 -1649 -1331 66.9
7 -324 -1675 -1352 66.9
8 -333 -1706 -1373 67.3
9 -340 -1735 -1395 66.9
10 -338 -1745 -1407 66.6
11 -340 -1762 -1422 66.2
12 -313 -1772 -1459 67.1
Mon
ths
of Y
ear
One
13 -317 -1792 -1475 66.9
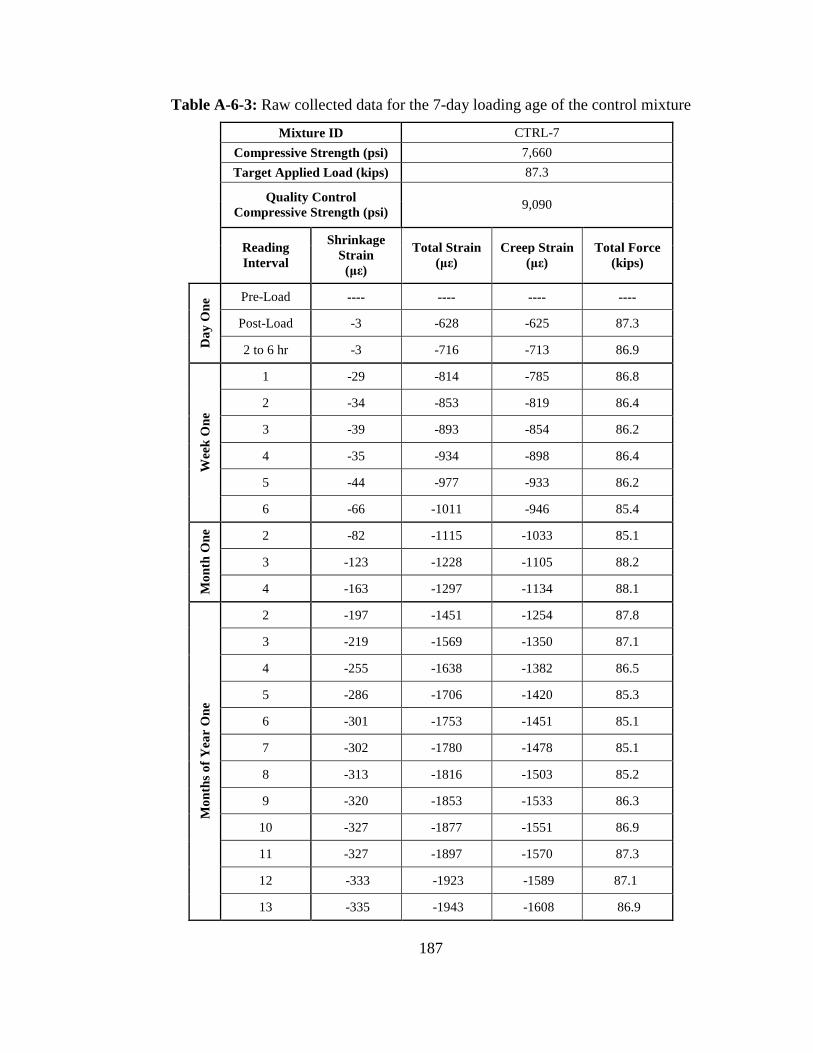
187
Table A-6-3: Raw collected data for the 7-day loading age of the control mixture
Mixture ID CTRL-7
Compressive Strength (psi) 7,660
Target Applied Load (kips) 87.3
Quality Control Compressive Strength (psi)
9,090
Reading Interval
Shrinkage Strain (µε)
Total Strain (µε)
Creep Strain (µε)
Total Force (kips)
Pre-Load ---- ---- ---- ----
Post-Load -3 -628 -625 87.3
Day
One
2 to 6 hr -3 -716 -713 86.9
1 -29 -814 -785 86.8
2 -34 -853 -819 86.4
3 -39 -893 -854 86.2
4 -35 -934 -898 86.4
5 -44 -977 -933 86.2
Wee
k O
ne
6 -66 -1011 -946 85.4
2 -82 -1115 -1033 85.1
3 -123 -1228 -1105 88.2
Mon
th O
ne
4 -163 -1297 -1134 88.1
2 -197 -1451 -1254 87.8
3 -219 -1569 -1350 87.1
4 -255 -1638 -1382 86.5
5 -286 -1706 -1420 85.3
6 -301 -1753 -1451 85.1
7 -302 -1780 -1478 85.1
8 -313 -1816 -1503 85.2
9 -320 -1853 -1533 86.3
10 -327 -1877 -1551 86.9
11 -327 -1897 -1570 87.3
12 -333 -1923 -1589 87.1
Mon
ths
of Y
ear
One
13 -335 -1943 -1608 86.9
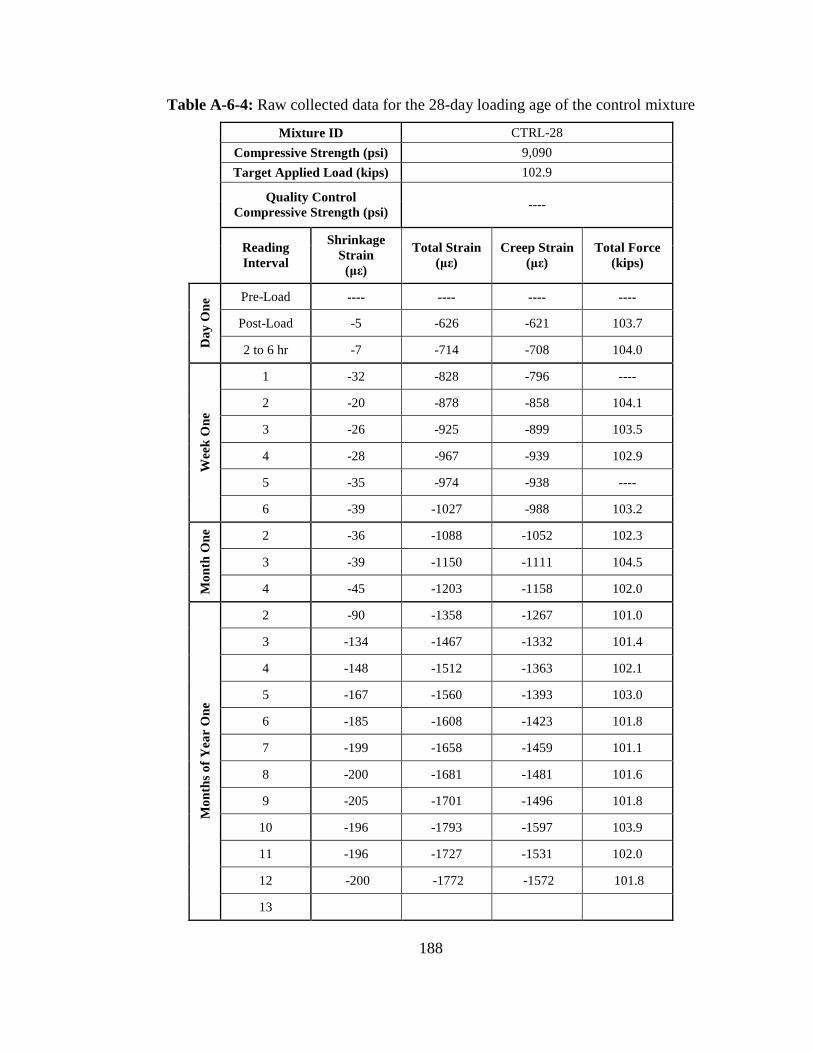
188
Table A-6-4: Raw collected data for the 28-day loading age of the control mixture
Mixture ID CTRL-28
Compressive Strength (psi) 9,090
Target Applied Load (kips) 102.9
Quality Control Compressive Strength (psi)
----
Reading Interval
Shrinkage Strain (µε)
Total Strain (µε)
Creep Strain (µε)
Total Force (kips)
Pre-Load ---- ---- ---- ----
Post-Load -5 -626 -621 103.7
Day
One
2 to 6 hr -7 -714 -708 104.0
1 -32 -828 -796 ----
2 -20 -878 -858 104.1
3 -26 -925 -899 103.5
4 -28 -967 -939 102.9
5 -35 -974 -938 ----
Wee
k O
ne
6 -39 -1027 -988 103.2
2 -36 -1088 -1052 102.3
3 -39 -1150 -1111 104.5
Mon
th O
ne
4 -45 -1203 -1158 102.0
2 -90 -1358 -1267 101.0
3 -134 -1467 -1332 101.4
4 -148 -1512 -1363 102.1
5 -167 -1560 -1393 103.0
6 -185 -1608 -1423 101.8
7 -199 -1658 -1459 101.1
8 -200 -1681 -1481 101.6
9 -205 -1701 -1496 101.8
10 -196 -1793 -1597 103.9
11 -196 -1727 -1531 102.0
12 -200 -1772 -1572 101.8
Mon
ths
of Y
ear
One
13

189
Table A-6-5: Raw collected data for the 90-day loading age of the control mixture
Mixture ID CTRL-90
Compressive Strength (psi) 8,330
Target Applied Load (kips) 94.3
Quality Control Compressive Strength (psi)
8,400
Reading Interval
Shrinkage Strain (µε)
Total Strain (µε)
Creep Strain (µε)
Total Force (kips)
Pre-Load ---- ---- ---- ----
Post-Load 0 -612 -612 95.4
Day
One
2 to 6 hr -3 -679 -676 95.1
1 7 -733 -740 94.2
2 -2 -773 -771 93.4
3 -7 -796 -789 93.3
4 -14 -821 -807 93.4
5 -10 -839 -829 93.3
Wee
k O
ne
6 -13 -857 -843 93.2
2 -23 -945 -922 96.1
3 -29 -991 -962 95.5
Mon
th O
ne
4 -28 -1035 -1006 93.7
2 -46 -1153 -1107 93.3
3 -62 -1239 -1176 93.2
4 -74 -1313 -1239 92.6
5 -65 -1347 -1282 92.9
6 -68 -1376 -1308 92.4
7 -67 -1406 -1339 92.4
8 -59 -1432 -1374 92.5
9 -69 -1455 -1386 92.7
10 -74 -1477 -1402 92.6
11 -78 -1495 -1416 93.9
12 -83 -1495 -1412 93.6
Mon
ths
of Y
ear
One
13 -83 -1521 -1438 93.3
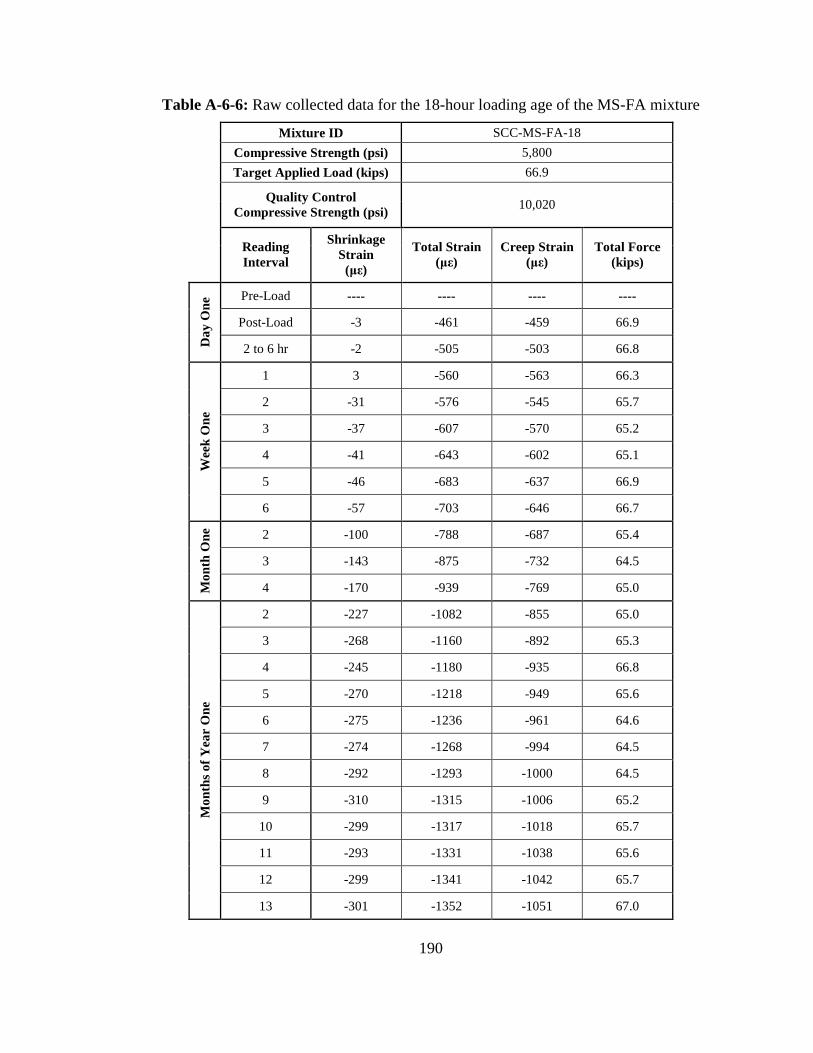
190
Table A-6-6: Raw collected data for the 18-hour loading age of the MS-FA mixture
Mixture ID SCC-MS-FA-18
Compressive Strength (psi) 5,800
Target Applied Load (kips) 66.9
Quality Control Compressive Strength (psi)
10,020
Reading Interval
Shrinkage Strain (µε)
Total Strain (µε)
Creep Strain (µε)
Total Force (kips)
Pre-Load ---- ---- ---- ----
Post-Load -3 -461 -459 66.9
Day
One
2 to 6 hr -2 -505 -503 66.8
1 3 -560 -563 66.3
2 -31 -576 -545 65.7
3 -37 -607 -570 65.2
4 -41 -643 -602 65.1
5 -46 -683 -637 66.9
Wee
k O
ne
6 -57 -703 -646 66.7
2 -100 -788 -687 65.4
3 -143 -875 -732 64.5
Mon
th O
ne
4 -170 -939 -769 65.0
2 -227 -1082 -855 65.0
3 -268 -1160 -892 65.3
4 -245 -1180 -935 66.8
5 -270 -1218 -949 65.6
6 -275 -1236 -961 64.6
7 -274 -1268 -994 64.5
8 -292 -1293 -1000 64.5
9 -310 -1315 -1006 65.2
10 -299 -1317 -1018 65.7
11 -293 -1331 -1038 65.6
12 -299 -1341 -1042 65.7
Mon
ths
of Y
ear
One
13 -301 -1352 -1051 67.0
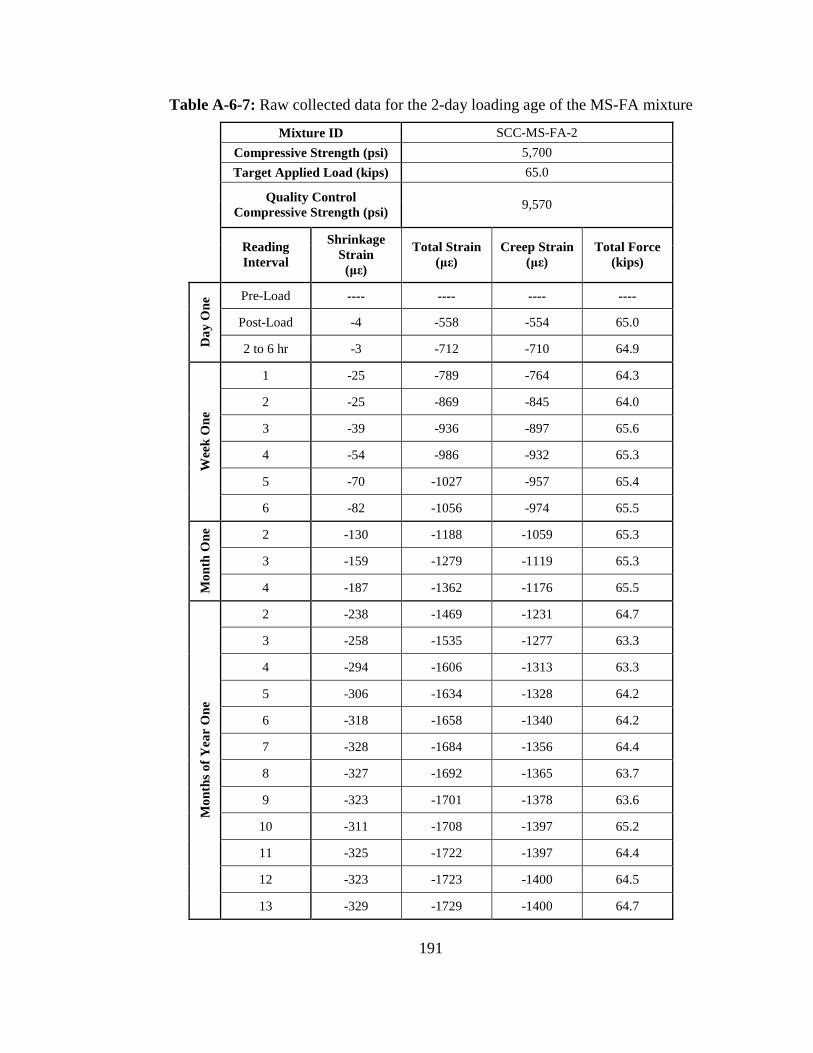
191
Table A-6-7: Raw collected data for the 2-day loading age of the MS-FA mixture
Mixture ID SCC-MS-FA-2
Compressive Strength (psi) 5,700
Target Applied Load (kips) 65.0
Quality Control Compressive Strength (psi)
9,570
Reading Interval
Shrinkage Strain (µε)
Total Strain (µε)
Creep Strain (µε)
Total Force (kips)
Pre-Load ---- ---- ---- ----
Post-Load -4 -558 -554 65.0
Day
One
2 to 6 hr -3 -712 -710 64.9
1 -25 -789 -764 64.3
2 -25 -869 -845 64.0
3 -39 -936 -897 65.6
4 -54 -986 -932 65.3
5 -70 -1027 -957 65.4
Wee
k O
ne
6 -82 -1056 -974 65.5
2 -130 -1188 -1059 65.3
3 -159 -1279 -1119 65.3
Mon
th O
ne
4 -187 -1362 -1176 65.5
2 -238 -1469 -1231 64.7
3 -258 -1535 -1277 63.3
4 -294 -1606 -1313 63.3
5 -306 -1634 -1328 64.2
6 -318 -1658 -1340 64.2
7 -328 -1684 -1356 64.4
8 -327 -1692 -1365 63.7
9 -323 -1701 -1378 63.6
10 -311 -1708 -1397 65.2
11 -325 -1722 -1397 64.4
12 -323 -1723 -1400 64.5
Mon
ths
of Y
ear
One
13 -329 -1729 -1400 64.7

192
Table A-6-8: Raw collected data for the 7-day loading age of the MS-FA mixture
Mixture ID SCC-MS-FA-7
Compressive Strength (psi) 7,570
Target Applied Load (kips) 85.6
Quality Control Compressive Strength (psi)
9,570
Reading Interval
Shrinkage Strain (µε)
Total Strain (µε)
Creep Strain (µε)
Total Force (kips)
Pre-Load ---- ---- ---- ----
Post-Load -1 -622 -621 85.7
Day
One
2 to 6 hr -4 -733 -729 86.8
1 -5 -811 -806 86.5
2 -5 -873 -867 86.3
3 -21 -928 -907 85.8
4 -25 -975 -950 85.9
5 -29 -1008 -979 87.3
Wee
k O
ne
6 -36 -1037 -1001 87.3
2 -106 -1216 -1111 86.0
3 -126 -1293 -1166 86.0
Mon
th O
ne
4 -151 -1364 -1213 86.3
2 -201 -1523 -1322 87.0
3 -237 -1617 -1380 86.0
4 -239 -1671 -1432 86.7
5 -250 -1704 -1454 86.6
6 -258 -1739 -1481 86.0
7 -272 -1763 -1491 85.5
8 -269 -1769 -1500 85.5
9 -262 -1772 -1510 85.3
10 -270 -1804 -1534 85.7
11 -272 -1819 -1547 87.0
12 -278 -1832 -1555 87.2
Mon
ths
of Y
ear
One
13 -287 -1848 -1561 86.6

193
Table A-6-9: Raw collected data for the 28-day loading age of the MS-FA mixture
Mixture ID SCC-MS-FA-28
Compressive Strength (psi) 9,570
Target Applied Load (kips) 108.2
Quality Control Compressive Strength (psi)
----
Reading Interval
Shrinkage Strain (µε)
Total Strain (µε)
Creep Strain (µε)
Total Force (kips)
Pre-Load ---- ---- ---- ----
Post-Load 0 -750 -750 109.4
Day
One
2 to 6 hr -3 -804 -800 107.6
1 -3 -905 -902 108.4
2 -3 -967 -964 107.9
3 -16 -1002 -986 108.9
4 -17 -1035 -1017 108.4
5 -15 -1060 -1045 107.9
Wee
k O
ne
6 -24 -1085 -1061 108.0
2 -43 -1212 -1168 108.1
3 -49 -1293 -1243 108.0
Mon
th O
ne
4 -59 -1349 -1290 108.8
2 -98 -1579 -1481 107.4
3 -137 -1698 -1561 106.2
4 -145 -1753 -1608 106.1
5 -152 -1808 -1656 106.2
6 -140 -1854 -1714 106.3
7 -150 -1882 -1731 106.1
8 -154 -1909 -1755 108.1
9 -158 -1935 -1777 108.6
10 -169 -1962 -1793 108.0
11 -176 -1985 -1809 107.1
12 -180 -2005 -1825 106.4
Mon
ths
of Y
ear
One
13 -174 -2031 -1857 106.2

194
Table A-6-10: Raw collected data for the 90-day loading age of the MS-FA mixture
Mixture ID SCC-MS-FA-90
Compressive Strength (psi) 9,830
Target Applied Load (kips) 112.8
Quality Control Compressive Strength (psi)
9,570
Reading Interval
Shrinkage Strain (µε)
Total Strain (µε)
Creep Strain (µε)
Total Force (kips)
Pre-Load ---- ---- ---- ----
Post-Load -1 -730 -730 112.8
Day
One
2 to 6 hr -3 -782 -780 112.4
1 1 -871 -871 113.0
2 -6 -921 -915 111.5
3 1 -920 -922 113.3
4 7 -939 -946 113.2
5 8 -953 -961 113.1
Wee
k O
ne
6 -13 -1001 -988 112.8
2 5 -1046 -1051 113.1
3 4 -1090 -1094 113.3
Mon
th O
ne
4 -18 -1156 -1138 113.3
2 -25 -1222 -1196 112.5
3 -45 -1306 -1261 113.0
4 -45 -1344 -1298 113.3
5 -38 -1375 -1337 113.1
6 -30 -1407 -1377 112.4
7 -38 -1428 -1390 113.2
8 -39 -1462 -1423 113.4
9 -59 -1487 -1428 113.3
10 -69 -1510 -1441 111.9
11 -78 -1530 -1452 110.8
12 -81 -1545 -1465 110.0
Mon
ths
of Y
ear
One
13 -87 -1562 -1475 110.1
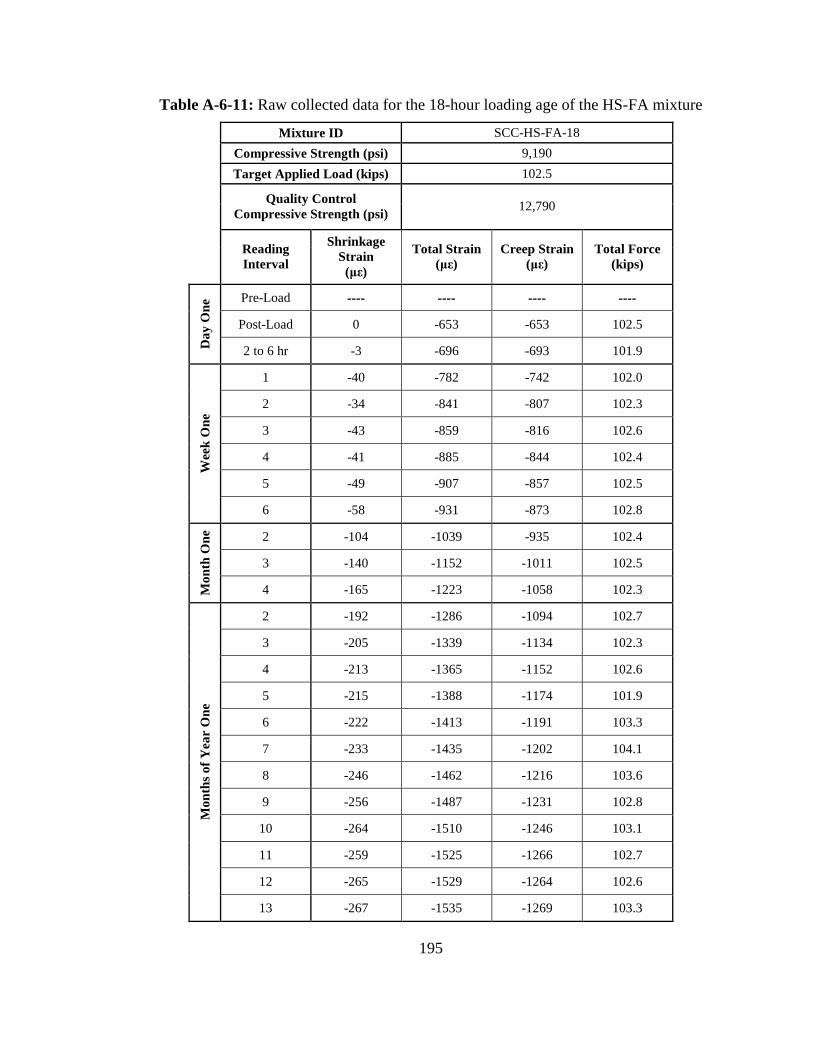
195
Table A-6-11: Raw collected data for the 18-hour loading age of the HS-FA mixture
Mixture ID SCC-HS-FA-18
Compressive Strength (psi) 9,190
Target Applied Load (kips) 102.5
Quality Control Compressive Strength (psi)
12,790
Reading Interval
Shrinkage Strain (µε)
Total Strain (µε)
Creep Strain (µε)
Total Force (kips)
Pre-Load ---- ---- ---- ----
Post-Load 0 -653 -653 102.5
Day
One
2 to 6 hr -3 -696 -693 101.9
1 -40 -782 -742 102.0
2 -34 -841 -807 102.3
3 -43 -859 -816 102.6
4 -41 -885 -844 102.4
5 -49 -907 -857 102.5
Wee
k O
ne
6 -58 -931 -873 102.8
2 -104 -1039 -935 102.4
3 -140 -1152 -1011 102.5
Mon
th O
ne
4 -165 -1223 -1058 102.3
2 -192 -1286 -1094 102.7
3 -205 -1339 -1134 102.3
4 -213 -1365 -1152 102.6
5 -215 -1388 -1174 101.9
6 -222 -1413 -1191 103.3
7 -233 -1435 -1202 104.1
8 -246 -1462 -1216 103.6
9 -256 -1487 -1231 102.8
10 -264 -1510 -1246 103.1
11 -259 -1525 -1266 102.7
12 -265 -1529 -1264 102.6
Mon
ths
of Y
ear
One
13 -267 -1535 -1269 103.3

196
Table A-6-12: Raw collected data for the 2-day loading age of the HS-FA mixture
Mixture ID SCC-HS-FA-2
Compressive Strength (psi) 9,100
Target Applied Load (kips) 101.3
Quality Control Compressive Strength (psi)
12,970
Reading Interval
Shrinkage Strain (µε)
Total Strain (µε)
Creep Strain (µε)
Total Force (kips)
Pre-Load ---- ---- ---- ----
Post-Load -1 -724 -723 101.3
Day
One
2 to 6 hr -1 -821 -819 104.8
1 -17 -968 -951 105.0
2 -39 -1044 -1004 105.0
3 -61 -1119 -1058 105.0
4 -57 -1164 -1107 104.9
5 -57 -1201 -1144 105.0
Wee
k O
ne
6 -66 -1216 -1150 104.8
2 -93 -1348 -1255 105.0
3 -128 -1418 -1290 104.9
Mon
th O
ne
4 -157 -1468 -1311 104.7
2 -181 -1571 -1390 101.7
3 -198 -1628 -1430 103.5
4 -209 -1650 -1441 102.2
5 -207 -1657 -1451 103.7
6 -220 -1678 -1458 103.1
7 -216 -1692 -1476 103.6
8 -209 -1703 -1494 103.7
9 -215 -1719 -1504 103.5
10 -217 -1732 -1515 103.9
11 -229 -1753 -1524 105.0
12 -196 -1731 -1535 104.7
Mon
ths
of Y
ear
One
13 -212 -1747 -1535 104.0

197
Table A-6-13: Raw collected data for the 7-day loading age of the HS-FA mixture
Mixture ID SCC-HS-FA-7
Compressive Strength (psi) 11,110
Target Applied Load (kips) 128.2
Quality Control Compressive Strength (psi)
12,800
Reading Interval
Shrinkage Strain (µε)
Total Strain (µε)
Creep Strain (µε)
Total Force (kips)
Pre-Load ---- ---- ---- ----
Post-Load -2 -756 -754 128.2
Day
One
2 to 6 hr -1 -846 -845 125.8
1 -9 -998 -989 124.1
2 -12 -1089 -1077 125.4
3 -19 -1135 -1115 125.4
4 -32 -1174 -1142 126.2
5 -41 -1210 -1168 126.6
Wee
k O
ne
6 -49 -1228 -1179 124.3
2 -80 -1362 -1282 123.8
3 -102 -1442 -1340 123.6
Mon
th O
ne
4 -109 -1481 -1372 123.4
2 -139 -1566 -1426 123.3
3 -163 -1646 -1484 123.8
4 -179 -1697 -1517 123.7
5 -185 -1715 -1530 123.3
6 -191 -1742 -1552 123.2
7 -190 -1757 -1567 125.1
8 -186 -1771 -1585 124.7
9 -181 -1780 -1599 123.5
10 -191 -1790 -1599 123.4
11 -198 -1801 -1603 123.3
12 -213 -1820 -1607 123.3
Mon
ths
of Y
ear
One
13 -213 -1827 -1613 123.9

198
Table A-6-14: Raw collected data for the 28-day loading age of the HS-FA mixture
Mixture ID SCC-HS-FA-28
Compressive Strength (psi) 12,800
Target Applied Load (kips) 145.1
Quality Control Compressive Strength (psi)
----
Reading Interval
Shrinkage Strain (µε)
Total Strain (µε)
Creep Strain (µε)
Total Force (kips)
Pre-Load ---- ---- ---- ----
Post-Load -1 -788 -786 145.1
Day
One
2 to 6 hr -3 -857 -854 145.7
1 -1 -910 -908 145.2
2 -3 -960 -957 145.0
3 -6 -1005 -999 144.8
4 -9 -1045 -1036 144.8
5 -7 -1061 -1055 147.3
Wee
k O
ne
6 -11 -1074 -1063 144.7
2 -27 -1166 -1139 144.6
3 -27 -1202 -1176 144.6
Mon
th O
ne
4 -36 -1258 -1222 142.6
2 -56 -1342 -1285 142.4
3 -67 -1404 -1337 142.7
4 -60 -1435 -1375 143.6
5 -84 -1466 -1382 143.0
6 -86 -1492 -1406 142.7
7 -68 -1509 -1441 143.0
8 -74 -1542 -1468 144.4
9 -89 -1566 -1477 144.3
10 -109 -1549 -1440 143.7
11 -114 -1567 -1453 142.7
12 -119 -1581 -1462 142.7
Mon
ths
of Y
ear
One
13 -125 -1593 -1469 142.6

199
Table A-6-15: Raw collected data for the 90-day loading age of the HS-FA mixture
Mixture ID SCC-HS-FA-90
Compressive Strength (psi) 13,630
Target Applied Load (kips) 151.5
Quality Control Compressive Strength (psi)
12,800
Reading Interval
Shrinkage Strain (µε)
Total Strain (µε)
Creep Strain (µε)
Total Force (kips)
Pre-Load ---- ---- ---- ----
Post-Load -4 -891 -887 151.6
Day
One
2 to 6 hr -6 -930 -924 151.2
1 -6 -996 -990 153.3
2 -3 -1032 -1029 152.8
3 -7 -1051 -1044 152.4
4 -11 -1067 -1055 151.9
5 -9 -1083 -1074 151.6
Wee
k O
ne
6 -6 -1101 -1095 151.5
2 -11 -1135 -1124 151.2
3 -15 -1168 -1154 151.2
Mon
th O
ne
4 -11 -1214 -1204 150.6
2 -2 -1255 -1253 149.5
3 -37 -1327 -1290 149.3
4 -32 -1356 -1324 149.2
5 -33 -1384 -1351 148.7
6 -21 -1407 -1386 147.2
7 -35 -1428 -1393 146.6
8 -49 -1447 -1397 146.1
9 -57 -1466 -1409 145.6
10 -58 -1476 -1418 144.9
11 -63 -1495 -1432 145.1
12 -67 -1515 -1449 147.3
Mon
ths
of Y
ear
One
13 -71 -1533 -1462 147.0

200
Table A-6-16: Raw collected data for the 18-hour loading age of the MS-SL mixture
Mixture ID SCC-MS-SL-18
Compressive Strength (psi) 6,250
Target Applied Load (kips) 71.1
Quality Control Compressive Strength (psi)
9,100
Reading Interval
Shrinkage Strain (µε)
Total Strain (µε)
Creep Strain (µε)
Total Force (kips)
Pre-Load ---- ---- ---- ----
Post-Load -2 -461 -459 71.1
Day
One
2 to 6 hr -3 -518 -516 70.5
1 -63 -589 -526 70.5
2 -80 -641 -561 70.2
3 -90 -688 -598 70.2
4 -96 -726 -630 70.6
5 -93 -740 -647 70.6
Wee
k O
ne
6 -110 -769 -659 70.2
2 -154 -859 -705 70.5
3 -167 -910 -742 71.6
Mon
th O
ne
4 -188 -955 -767 70.5
2 -227 -1025 -798 69.9
3 -257 -1087 -829 69.4
4 -260 -1106 -846 69.4
5 -257 -1124 -866 69.4
6 -265 -1154 -889 69.4
7 -268 -1173 -905 71.1
8 -270 -1190 -920 70.6
9 -265 -1202 -937 69.7
10 -275 -1214 -940 69.8
11 -286 -1230 -944 69.5
12 -303 -1250 -947 69.4
Mon
ths
of Y
ear
One
13 -293 -1264 -971 69.6

201
Table A-6-17: Raw collected data for the 2-day loading age of the MS-SL mixture
Mixture ID SCC-MS-SL-2
Compressive Strength (psi) 4,620
Target Applied Load (kips) 53.0
Quality Control Compressive Strength (psi)
8,890
Reading Interval
Shrinkage Strain (µε)
Total Strain (µε)
Creep Strain (µε)
Total Force (kips)
Pre-Load ---- ---- ---- ----
Post-Load -1 -425 -424 53.0
Day
One
2 to 6 hr -3 -492 -488 52.8
1 -19 -602 -582 51.8
2 -33 -716 -683 52.0
3 -54 -772 -718 51.9
4 -70 -803 -733 52.3
5 -78 -829 -751 52.5
Wee
k O
ne
6 -64 -844 -780 52.1
2 -104 -908 -805 52.3
3 -122 -946 -823 53.1
Mon
th O
ne
4 -129 -967 -838 53.0
2 -163 -1031 -868 51.9
3 -188 -1059 -871 51.6
4 -192 -1082 -890 51.3
5 -189 -1107 -919 52.0
6 -222 -1132 -910 51.4
7 -222 -1145 -923 52.6
8 -223 -1157 -934 52.7
9 -217 -1164 -947 52.7
10 -229 -1171 -942 52.9
11 -231 -1176 -945 52.5
12 -265 -1200 -935 52.1
Mon
ths
of Y
ear
One
13 -273 -1211 -937 51.8

202
Table A-6-18: Raw collected data for the 7-day loading age of the MS-SL mixture
Mixture ID SCC-MS-SL-7
Compressive Strength (psi) 6,840
Target Applied Load (kips) 78.3
Quality Control Compressive Strength (psi)
8,890
Reading Interval
Shrinkage Strain (µε)
Total Strain (µε)
Creep Strain (µε)
Total Force (kips)
Pre-Load ---- ---- ---- ----
Post-Load -2 -405 -403 78.3
Day
One
2 to 6 hr 0 -554 -554 77.3
1 -71 -666 -595 76.5
2 -76 -718 -642 77.4
3 -90 -764 -675 77.1
4 -96 -800 -704 76.4
5 -111 -829 -718 77.4
Wee
k O
ne
6 -130 -861 -730 76.5
2 -173 -934 -762 76.4
3 -181 -982 -800 76.5
Mon
th O
ne
4 -194 -1016 -822 76.4
2 -227 -1109 -882 77.0
3 -274 -1146 -873 78.8
4 -260 -1178 -918 77.4
5 -265 -1202 -937 77.2
6 -286 -1224 -938 77.0
7 -274 -1237 -964 78.7
8 -283 -1256 -973 78.8
9 -277 -1265 -988 77.2
10 -274 -1277 -1003 76.2
11 -279 -1291 -1012 75.9
12 -283 -1296 -1013 77.6
Mon
ths
of Y
ear
One
13 -301 -1321 -1019 78.7

203
Table A-6-19: Raw collected data for the 28-day loading age of the MS-SL mixture
Mixture ID SCC-MS-SL-28
Compressive Strength (psi) 10,610
Target Applied Load (kips) 120.8
Quality Control Compressive Strength (psi)
----
Reading Interval
Shrinkage Strain (µε)
Total Strain (µε)
Creep Strain (µε)
Total Force (kips)
Pre-Load ---- ---- ---- ----
Post-Load -1 -710 -708 120.7
Day
One
2 to 6 hr -3 -750 -747 120.5
1 11 -797 -808 119.9
2 -12 -838 -826 118.3
3 -7 -852 -845 118.3
4 -5 -865 -859 118.1
5 -5 -875 -870 118.1
Wee
k O
ne
6 -4 -885 -881 118.1
2 -13 -941 -928 120.5
3 -9 -979 -970 119.3
Mon
th O
ne
4 -27 -1045 -1017 119.0
2 -40 -1115 -1075 118.6
3 -43 -1156 -1113 118.5
4 -56 -1199 -1144 119.1
5 -59 -1239 -1180 119.8
6 -60 -1277 -1216 119.3
7 -72 -1306 -1235 119.3
8 -80 -1332 -1252 118.9
9 -89 -1356 -1267 119.3
10 -91 -1399 -1307 119.6
11 -97 -1389 -1292 119.3
12 -106 -1410 -1304 119.6
Mon
ths
of Y
ear
One
13 -113 -1437 -1324 119.6

204
Table A-6-20: Raw collected data for the 90-day loading age of the MS-SL mixture
Mixture ID SCC-MS-SL-90
Compressive Strength (psi) 11,580
Target Applied Load (kips) 128.5
Quality Control Compressive Strength (psi)
8,890
Reading Interval
Shrinkage Strain (µε)
Total Strain (µε)
Creep Strain (µε)
Total Force (kips)
Pre-Load ---- ---- ---- ----
Post-Load -1 -754 -753 128.5
Day
One
2 to 6 hr -3 -811 -808 128.8
1 6 -844 -850 128.5
2 -9 -867 -858 129.0
3 -7 -879 -872 128.9
4 -5 -890 -885 128.6
5 -2 -899 -897 128.5
Wee
k O
ne
6 -9 -920 -912 128.4
2 -14 -936 -922 128.5
3 -21 -952 -930 128.4
Mon
th O
ne
4 -22 -997 -975 129.1
2 -22 -1020 -998 128.6
3 -25 -1111 -1085 128.8
4 -31 -1156 -1125 128.6
5 -29 -1199 -1170 129.7
6 -26 -1228 -1202 128.9
7 -24 -1259 -1235 128.8
8 -31 -1292 -1261 128.5
9 -36 -1301 -1265 129.2
10 -58 -1334 -1276 129.1
11 -67 -1349 -1281 128.5
12 -81 -1370 -1289 128.8
Mon
ths
of Y
ear
One
13 -101 -1393 -1292 129.4
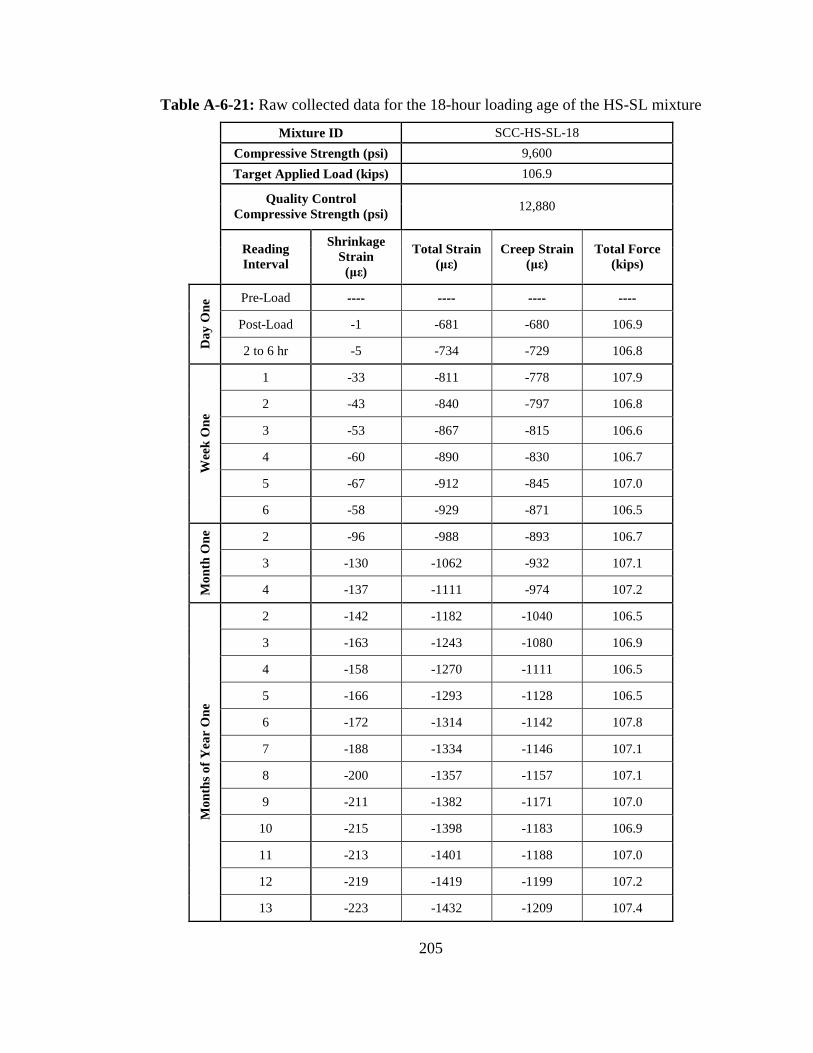
205
Table A-6-21: Raw collected data for the 18-hour loading age of the HS-SL mixture
Mixture ID SCC-HS-SL-18
Compressive Strength (psi) 9,600
Target Applied Load (kips) 106.9
Quality Control Compressive Strength (psi)
12,880
Reading Interval
Shrinkage Strain (µε)
Total Strain (µε)
Creep Strain (µε)
Total Force (kips)
Pre-Load ---- ---- ---- ----
Post-Load -1 -681 -680 106.9
Day
One
2 to 6 hr -5 -734 -729 106.8
1 -33 -811 -778 107.9
2 -43 -840 -797 106.8
3 -53 -867 -815 106.6
4 -60 -890 -830 106.7
5 -67 -912 -845 107.0
Wee
k O
ne
6 -58 -929 -871 106.5
2 -96 -988 -893 106.7
3 -130 -1062 -932 107.1
Mon
th O
ne
4 -137 -1111 -974 107.2
2 -142 -1182 -1040 106.5
3 -163 -1243 -1080 106.9
4 -158 -1270 -1111 106.5
5 -166 -1293 -1128 106.5
6 -172 -1314 -1142 107.8
7 -188 -1334 -1146 107.1
8 -200 -1357 -1157 107.1
9 -211 -1382 -1171 107.0
10 -215 -1398 -1183 106.9
11 -213 -1401 -1188 107.0
12 -219 -1419 -1199 107.2
Mon
ths
of Y
ear
One
13 -223 -1432 -1209 107.4

206
Table A-6-22: Raw collected data for the 2-day loading age of the HS-SL mixture
Mixture ID SCC-HS-SL-2
Compressive Strength (psi) 8,830
Target Applied Load (kips) 101.7
Quality Control Compressive Strength (psi)
12,490
Reading Interval
Shrinkage Strain (µε)
Total Strain (µε)
Creep Strain (µε)
Total Force (kips)
Pre-Load ---- ---- ---- ----
Post-Load 0 -662 -662 101.7
Day
One
2 to 6 hr 0 -800 -800 100.6
1 -74 -1019 -946 99.6
2 -78 -1110 -1032 101.6
3 -97 -1171 -1074 101.4
4 -111 -1217 -1106 101.7
5 -122 -1255 -1133 101.8
Wee
k O
ne
6 -143 -1284 -1141 100.0
2 -159 -1376 -1216 98.9
3 -166 -1415 -1249 98.9
Mon
th O
ne
4 -190 -1449 -1259 98.6
2 -213 -1535 -1323 98.8
3 -230 -1579 -1349 99.7
4 -237 -1600 -1363 100.7
5 -252 -1627 -1375 100.6
6 -263 -1658 -1394 100.2
7 -264 -1667 -1403 100.6
8 -268 -1683 -1414 101.7
9 -260 -1688 -1428 100.6
10 -257 -1699 -1442 99.7
11 -262 -1711 -1449 98.9
12 -263 -1715 -1453 99.2
Mon
ths
of Y
ear
One
13 -260 -1739 -1479 101.6

207
Table A-6-23: Raw collected data for the 7-day loading age of the HS-SL mixture
Mixture ID SCC-HS-SL-7
Compressive Strength (psi) 10,580
Target Applied Load (kips) 118.4
Quality Control Compressive Strength (psi)
12,880
Reading Interval
Shrinkage Strain (µε)
Total Strain (µε)
Creep Strain (µε)
Total Force (kips)
Pre-Load ---- ---- ---- ----
Post-Load -1 -736 -734 118.4
Day
One
2 to 6 hr -3 -784 -781 117.4
1 -26 -918 -891 120.2
2 -24 -973 -949 119.6
3 -36 -999 -963 118.2
4 -45 -1014 -970 120.4
5 -52 -1043 -990 120.6
Wee
k O
ne
6 -60 -1065 -1005 120.6
2 -77 -1117 -1040 120.4
3 -91 -1197 -1106 120.3
Mon
th O
ne
4 -115 -1244 -1129 119.7
2 -134 -1290 -1156 119.4
3 -148 -1331 -1182 119.6
4 -150 -1344 -1194 121.1
5 -147 -1352 -1205 121.0
6 -132 -1365 -1233 120.8
7 -143 -1393 -1250 117.8
8 -143 -1409 -1266 120.0
9 -142 -1422 -1280 120.1
10 -175 -1413 -1238 122.0
11 -203 -1433 -1229 120.7
12 -213 -1445 -1232 121.7
Mon
ths
of Y
ear
One
13 -225 -1464 -1239 121.6
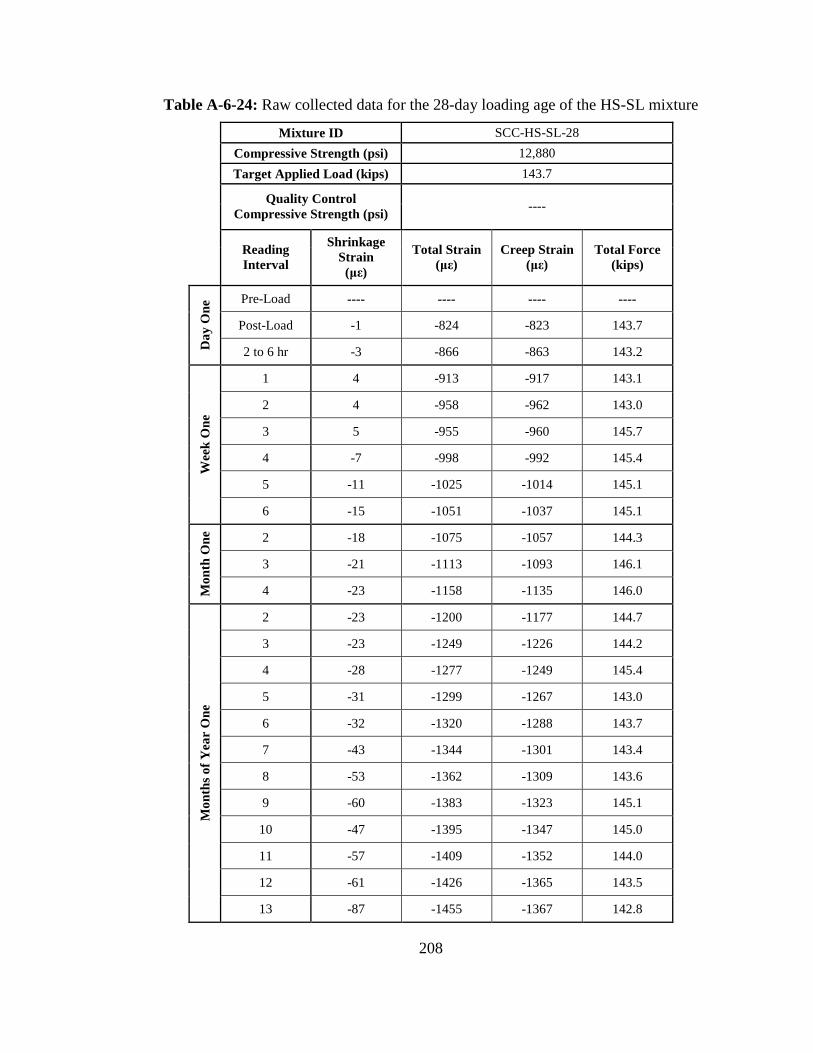
208
Table A-6-24: Raw collected data for the 28-day loading age of the HS-SL mixture
Mixture ID SCC-HS-SL-28
Compressive Strength (psi) 12,880
Target Applied Load (kips) 143.7
Quality Control Compressive Strength (psi)
----
Reading Interval
Shrinkage Strain (µε)
Total Strain (µε)
Creep Strain (µε)
Total Force (kips)
Pre-Load ---- ---- ---- ----
Post-Load -1 -824 -823 143.7
Day
One
2 to 6 hr -3 -866 -863 143.2
1 4 -913 -917 143.1
2 4 -958 -962 143.0
3 5 -955 -960 145.7
4 -7 -998 -992 145.4
5 -11 -1025 -1014 145.1
Wee
k O
ne
6 -15 -1051 -1037 145.1
2 -18 -1075 -1057 144.3
3 -21 -1113 -1093 146.1
Mon
th O
ne
4 -23 -1158 -1135 146.0
2 -23 -1200 -1177 144.7
3 -23 -1249 -1226 144.2
4 -28 -1277 -1249 145.4
5 -31 -1299 -1267 143.0
6 -32 -1320 -1288 143.7
7 -43 -1344 -1301 143.4
8 -53 -1362 -1309 143.6
9 -60 -1383 -1323 145.1
10 -47 -1395 -1347 145.0
11 -57 -1409 -1352 144.0
12 -61 -1426 -1365 143.5
Mon
ths
of Y
ear
One
13 -87 -1455 -1367 142.8

209
Table A-6-25: Raw collected data for the 90-day loading age of the HS-SL mixture
Mixture ID SCC-HS-SL-90
Compressive Strength (psi) 13,670
Target Applied Load (kips) 153.5
Quality Control Compressive Strength (psi)
12,880
Reading Interval
Shrinkage Strain (µε)
Total Strain (µε)
Creep Strain (µε)
Total Force (kips)
Pre-Load ---- ---- ---- ----
Post-Load -1 -778 -777 153.5
Day
One
2 to 6 hr -3 -809 -807 152.9
1 -2 -859 -857 152.1
2 -5 -848 -843 151.6
3 -16 -867 -851 151.6
4 -26 -887 -861 151.6
5 -24 -895 -871 151.6
Wee
k O
ne
6 -13 -898 -885 151.7
2 -16 -929 -913 151.6
3 -28 -960 -932 151.7
Mon
th O
ne
4 -31 -989 -958 151.6
2 -25 -1093 -1069 152.8
3 -12 -1089 -1077 151.6
4 -13 -1105 -1091 151.6
5 -32 -1130 -1097 152.0
6 -41 -1158 -1117 152.2
7 -56 -1189 -1133 151.6
8 -51 -1205 -1154 151.6
9 -58 -1221 -1163 152.2
10 -60 -1239 -1179 153.5
11 -63 -1250 -1187 152.8
12 -68 -1259 -1191 153.6
Mon
ths
of Y
ear
One
13 -75 -1276 -1201 152.1