Embed Size (px)
Citation preview

20
Creep and Shrinkage Cable-Stayed Bridges
• In
TRANSPORTATION RESEARCH RECORD 1290
Composite
S. G. ARzouMAN1n1s, 1 R. G. BuRG, 2 AND J. ScHMID1
The application of strict controls on the creep and shrinkage exhibited by the roadway deck concrete of composite cable-stayed bridges is of primary importance . Precast deck panels from concrete specifically designed for minimized creep and shrinkage effects, carefully cured and matured are almost exclusively used in these structures. Such concrete shows a reduced long-term modular ratio which is quite different from the recommended by AASHTO for the design of composite girders. The provisions of AC! 209 can be used for the prediction of the creep and shrinkage effects of concrete . Creep tests are important for consideration of the specific material, project and site data.
Several cable-stayed bridges with composite girders have been designed and built in North America in recent years. The concrete roadway deck of these bridges is an integral part of the steel support system and carries vertical loads and significant horizontal compressive forces. The latter forces, typical in cable-stayed bridges, result from the inclined cables which support the composite girders.
Due to economic considerations, the concrete deck, which is efficient in carrying compressive forces, is made composite with the steel girders (built-up members or trusses) for live as we l l as dead loads. The effectiveness of this composite structural system is related to the creep and shrinkage properties of the concrete. Shrinkage is the decrease with time of the concrete volume due to changes in the moisture content and other phys i co-chemical changes. Creep on the other hand is the time-dependent increase of the concrete strain due to applied sustained loads. The effect of creep and shrinkage is the slow transfer of stresses from the concrete to the steel resulting in long-term reduced efficiency of the concrete in resisting loads.
The competitiveness of composite girders as opposed to other structural systems of cable-stayed bridges, entails the reduction of the concrete deck weight to the absolute minimum. This is achieved using high strength concrete, which reduces the thickness of the deck. Nevertheless, the high dead load stresses, primarily due to the horizontal forces from the cables throughout the length of the bridge, result in increased creep of the concrete.
The effect of creep on the carrying capacity of short and medium length composite girder bridges is considered
1steinman Boynton Gronquist & Birdsall, New York, NY 10038
2construction Technology Laboratories, Inc. Skokie, IL 60077-1030
in the AASHTO specifications. For cast-in-place concrete, AASHTO requires a threefold increase of the modular ratio, defined as the ratio of steel modulus of elasticity to concrete modulus of elasticity. For example, for 6,000 psi concrete, the modular ratio for loads of short duration Clive, earthquake, wind loads etc.) is 6 while for loads of long duration (dead loads etc.) is 18. This increase of the modular ratio implies that the modulus of elasticity of concrete (or the concrete stiffness) for long-term loads is three times smaller than the modulus of elasticity (or concrete stiffness) for short-term loads.
Al though shrinkage is not specifically mentioned as contributing in the increase of the modular ratio, the AASHTO procedure has apparently worked satisfactorily for conventional composite girder bridges. For cable-stayed bridges, however, this approach to resolving the creep and shrinkage problem results in an uneconomical solution and is clearly inadequate.
MODULAR RATIO
The size of concrete and steel sections in composite members depends on the relative stiffness of the two materials. Consideration of the creep and shrinkage effects is essential in the design of composite members. Thus, co111pos i te members are sized considering the short and long-term stiffness of concrete using the transformed area method and the modular ratio of concrete for short and long-term loads.
For composite cable-stayed bridges, the effect of creep and shrinkage is controlled thr.ough the application of strict requirements on the long-term modular ratio. In actual designs of composite bridges this ratio has been specified as low as 11 (1,2,3).
The forces in the composite top chord members of a recent design of a two lane cable-stayed truss bridge are used to demonstrate the benefit of using a low long-term modular ratio. Dead plus live loads due to HS-20 loadings are considered. Assuming uniform concrete properties throughout the deck, the modular ratio for live loads is taken as 6, while for dead loads it is varied from 11 up to 18.
Table 1 shows the stresses in the steel and concrete corresponding to different long-term modular ratio NL values. It also shows the change of stresses in the steel and the concrete for modular ratio values higher than 11. It is seen that for the increase of the modular ratio from 11 to 12 the steel stresses increase by as much as 5.3% and the concrete stresses decrease by as much as 2.6%. Similarly, for the modular ratio increase
Arzoumanidis et al. 21
TABLE 1: STEEL AND CONCRETE STRESSES IN TOP CHORD
s T E E L c 0 N c R E T E
Top Chord Stresses in Ksi Percentage Increase Stresses in Ksi Percentage Decrease Member with respect to Nl=11 with respect to Nl=11
No Nl=11
U02'-U02 - 10.3 U02 -U06 -10.9 U06 -UlO -18.9 UlO -Ul4 -24.7 Ul4 -Ul8 -24.0 Ul8 -U22 -23.0 U22 -U26 -23.8 U26 -U30 -21. 6 U30 -U34 -21. 3 U34 -U38 - 20.2 U38 -U42 -20.3 U42 -U46 -20 .7 U46 -USO -21. 2 USO -U54 -20.8 U54 -U58 -20.9 U58- U62 -20.7 U62 -U66 -19.8 U66 -U70 -18.0 U70 -U74 -17.9 U74 -U78 - 17. 5 U7 8 -U82 -17 .3 U82 -U86 - 16 .5 U86 -U90 -15.8 U90 -U94 - 15.2
PRECAST SLAB
Nl=12 Nl=13
-10.3 -10.3 -10.9 -10.9 -18.9 -18.9 -24.8 -24 .8 -24.2 -24.4 -23.3 -23.7 -24.3 -24.7 -22 . 1 -22.6 -21.8 -22.4 -20.8 -21. 4 -21. 0 -21. 7 -21. 4 -22.1 -22 . 0 -22.7 -21. 6 -22.4 -21. 7 -22.5 -21 . 6 -22.4 -20.7 -21. 5 -19.0 -19.8 -18.8 -19.7 -18.4 -19.3 -18.2 -19.0 -17 .4 -18.2 -16 . 6 -17.4 - 16.0 -16.7
Nl=18 Nl=12 Nl=13
-10 .3 0.1 0. 2 -11. 0 0.2 0.3 -19.0 0.1 0. 2 -24.8 0. 0 0. 1 -25 .2 0.8 1. 6 -25.1 1. 5 2.9 -26.7 1. 9 3.8 -24.7 2.4 4.6 -24.6 2.6 5. 1 -24 .0 3. 2 6. 2 -24 .4 3.4 6. 5 -25.l 3.6 7.0 -25 .9 3.7 7.2 -25.5 3.9 7. 5 -25.8 4.0 7.7 -25 .8 4.1 8 . 0 -25 . 1 4.5 8.8 -23.6 5.2 10.1 -23.3 5.2 10.0 -22.9 5.2 10.0 -22.6 5.3 10 .2 -21. 7 5.3 10 . 2 -20 . 7 5.2 10 . 1 -19.9 5.3 10 .3
CAST- IN - PLACE CONCRETE
NEOPRENE TUBING
Figure 1 Precast panel connection detail
from 11 to 13, the corresponding maximum change of the steel and concrete stresses is 10.3% and 5.0% respectively.
It is further interesting to note the steel and concrete stresses for the long-term modular ratio 18 specified by AASHTO for cast-in-place concrete. The steel stresses increase by as much as 31.5% and the concrete stresses decrease by as much as 15.4%. This change of stresses implies a considerable reduction in the long-term participation of the concrete deck in carrying loads and,
Nl=18 Nl=11 Nl=12 Nl=13 Nl=18 Nl=12 Nl=13 Nl=18
0.6 1. 0 0.8 0.2 5.1 9.1
12.0 14.4 15.7 19 . 1 20 . 0 21. 4 22.0 22.8 23. 5 24 .4 26.8 30.7 30.6 30.6 31.2 31. 2 31. 0 31. 5
-0.13 -0.13 -0.13 -0 .13 0.1 0.3 0.9 -0.28 -0.28 -0.28 -0.27 0.1 0.3 0.8 -0.30 -0.30 -0.29 -0 . 29 0.0 0.1 0.3 -0 . 51 -0 . 50 -0.50 -0.48 0.9 1. 8 5.7 -0.68 -0 . 67 -0.66 -0 . 63 1. 3 2.6 8 .1 -0.81 -0.80 -0.79 -0 . 73 1. 6 3.2 10.0 -0.96 -0.94 -0.93 -0.85 1.7 3.4 10.8 -1 .04 -1. 02 -1.00 -0.91 2.1 4.0 12.6 -1.16 -1.14 -1.11 -1. 00 2.3 4.5 13 .8 -1.26 -1 .23 -1. 20 -1. 08 2.4 4.6 14 .3 -1.35 -1. 31 -1.28 -1.15 2.5 4.8 14 . 7 -1.43 -1. 40 -1.37 -1. 22 2.5 4.8 14.7 -1. 51 -1.48 -1.44 -1. 29 2.5 4.8 14.7 -1.55 -1. 51 -1. 47 -1. 32 2.6 5.0 15.l -1.60 -1.55 -1.52 -1. 35 2.6 5. 0 15.2 -1.64 -1 . 60 -1.56 -1 .39 2.6 5.0 15 . 2 -1.64 -1. 60 -1.56 -1. 39 2.6 5.0 15 . 2 -1. 73 -1.69 -1. 65 -1.47 2.6 5.0 15.4 -1. 72 -1. 67 -1.63 -1. 46 2.6 5.0 15.3 -1 .69 -1.64 -1.60 -1.43 2.6 5. 0 15.3 -1 .66 -1.62 -1. 58 -1. 41 2.5 4.9 14.9 -1 . 59 -1 . 55 -1. 52 -1 .36 2. 5 4.9 14 .9 -1 . 53 -1. 49 -1. 45 -1.30 2. 5 4.8 14.7 -1. 47 -1.43 -1. 40 -1. 26 2.4 4.6 14.2
consequently, diminished effectiveness. For this reason, the use of concrete with long-term modular ratio of 18 would be uneconomical.
ERECTION CONSIDERATIONS
Al though a few composite cable-stayed bridges adopted cast - in-place concrete roadway decks, most bridges have used precast deck panels. The precast deck panels are fabricated and cured under carefully controlled conditions and allowed to mature for an extended period of time. This procedure improves the creep properties of the concrete and, at the same time, removes a considerable percentage of the concrete shrinkage prior to the application of loads to the panels on the bridge.
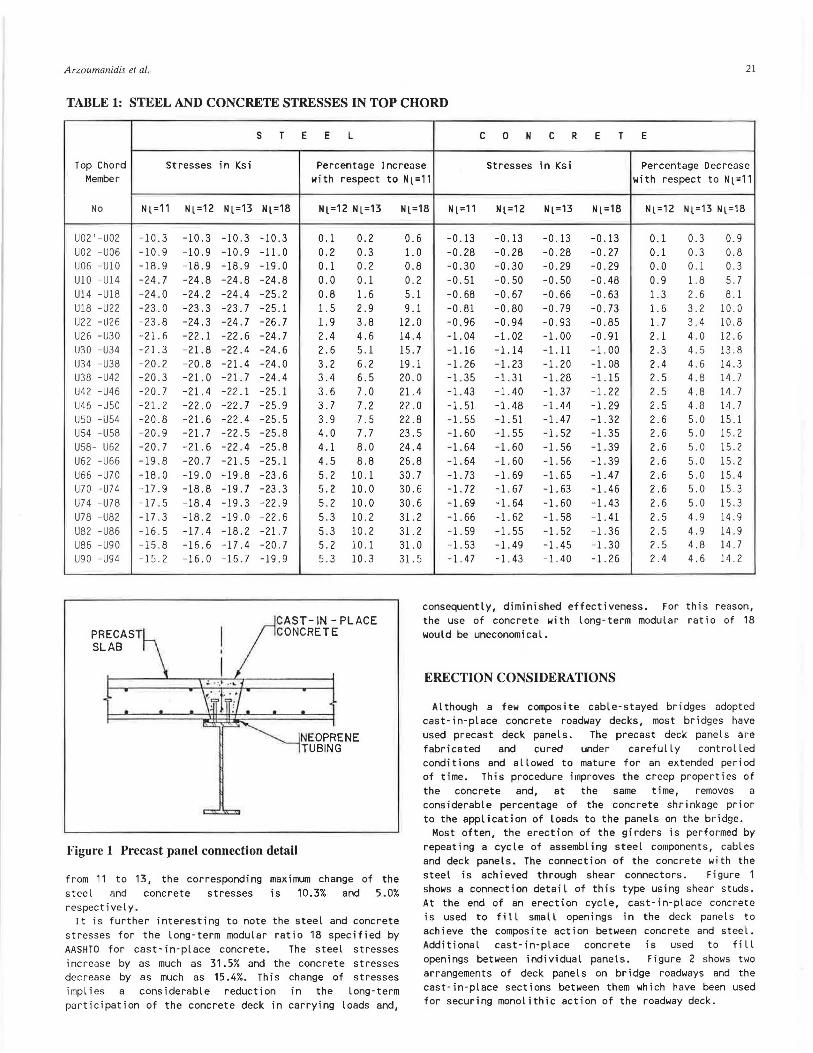
Most often, the erection of the girders is performed by repeating a cycle of assembling steel components, cables and deck panels. The connection of the concrete with the steel is achieved through shear connectors. Figure 1 shows a connection detail of this type using shear studs. At the end of an erection cycle, cast-in-place concrete is used to fill small openings in the deck panels to achieve the composite action between concrete and steel. Additional cast-in-place concrete is used to fill openings between individual panels. Figure 2 shows two arrangements of deck panels on bridge roadways and the cast-in-pl ace sections between them which have been used for securing monolithic action of the roadway deck.
CAST-IN-PLACE CONCRE
CAST-IN· PLACE CONCRETE
PRECAST DECK
----r--j · -I· -1 · ----1 ·-+.-I• ----1 · _,.. <t. FLOORBEAM
I
~ GIRDER
If. BRIDGE
l~·---...,_--i---..;..---~1 -· --1----1~ .. --i...l •---J.oJ ,,_ 't_ FLOORBEAM
~~'";:<,,~55!~552SSi~~zf~(,;'1 ,,m_ ;:z. Jz/-:(;lz;: J,_ z:; f -':'i--~~~~· !=Z2:2:2:~· ~±2~·~~ _r='f. GIRDER
PANEL ~~
~ """'{ I
I
I
~ BRIDGE B STRINGER
[ct_ GIRDER
Figure 2 Tuo arrangements of precast deck panels on bridge roadways
1066.27' (325 . 000) 574 . 00' (175. 000)
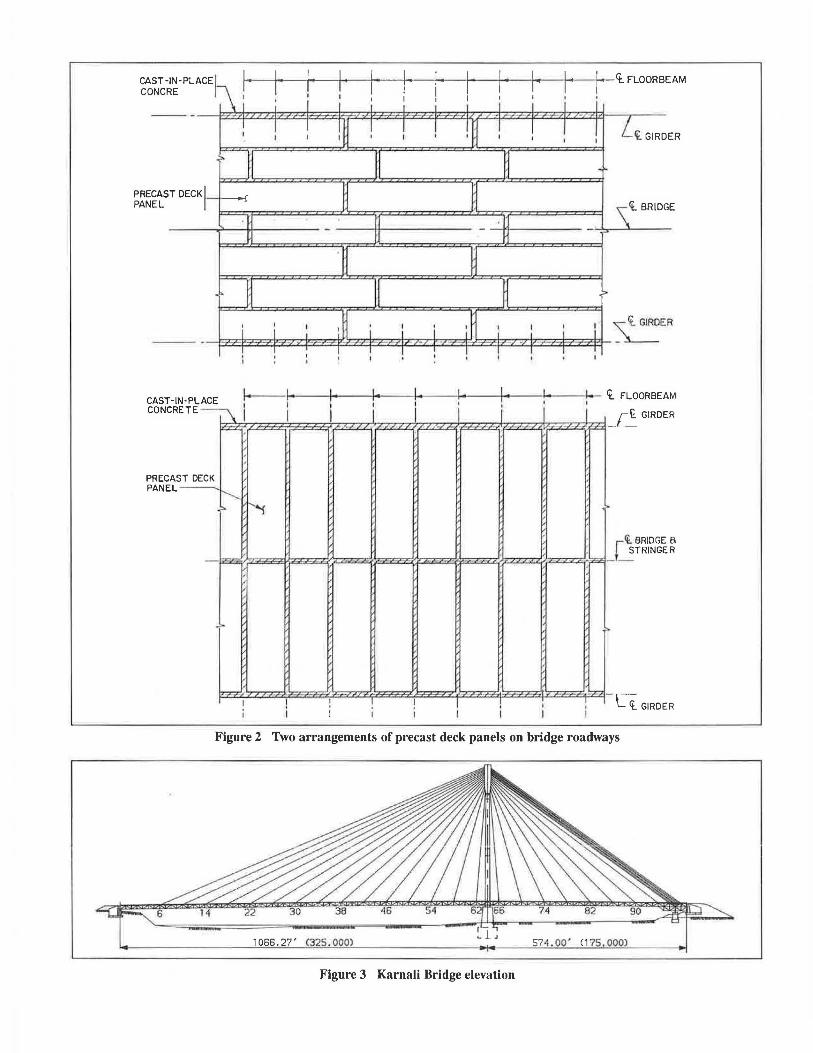
Figure 3 Karnali Bridge elevation

Arzoumanidis et al.
The erection procedures and in particular the timing of placing the cast-in-place concrete affect significantly the distribution of the dead load forces between concrete and steel. Consider the Karnal i River Bridge which is a one tower asynmetric composite truss cablestayed bridge, figure 3, currently under construction in Nepal. The distribution of the dead load forces in the steel and concrete components of the top chord prior to achieving composite action and at the completion of the erection are shown in figure 4. It is seen that the dead load forces of the concrete and steel components of the top chord are not the same throughout the length of the bridge. Sections of the chord near the tower carry higher forces than sections further away. By adjusting the erection procedures, it is possible to modify the level of dead load forces distributed between concrete and steel both prior to as well as after achieving composite action.
It is clear that the deck of composite cable-stayed bridges with precast panels essentially consists of precast and cast-in-place concrete sections. The cast-inplace sections do not undergo the rigorous curing and extended maturing of the precast concrete panels and they
3,000
23
appear to be in relative disadvantage regarding their creep and shrinkage properties. To minimize or even eliminate the effect of shrinkage, shrinkage compensating cement may be implemented. Three factors appear to further limit the consequences from this apparent disadvantage of the cast-in-place concrete:
1. The relatively small percentage of the cast-in-place concrete which is typically around 18 percent of the total concrete volume.
2. The dead load force distribution in the roadway deck along the length of the bridge which shows a significant reduction of the forces away from the tower as shown in figure 4.
3. The history of dead load application during erection as discussed below.
Assuming a ten day erection cycle for a typical bridge segment between consecutive stays, figure 5 shows the loading history during erection of three sections of the concrete deck in the main span. It can be seen that the sections of the deck with the highest stresses are loaded at the slowest rate and receive their full load after a considerable period of time.
~·~ ·
U> ~ 2,500
_s-·_,-·
CONCRETE AT THE~ ~. _r- ,_r .
END OF ERECTION, ~.__r- · --1 rSTEEL AT THE ~
w 2,000 -(.)
0::: 0 u...
1,500 __J <[
x 1,000 <[
500
2
Figure 4
2 .0
...;
en ~
1.5 CJ) CJ) w 0::: I-CJ)
w 1.0 I-w er (.) z 0 (.)
0 .5
0
r .-J END OF ERECTION
~·_j -· .~·---· -·.,,-·-·- · - · --·- · _j r ·-·-·-_;
r-· -·-· .... . r·-·-' f=""J.=-9-----·-· ISTEEL BEFORE r-·-t_ __ i_ __ ,_ __ ""'---~--, /COMPOSITE ACTION
L--,_J __ ---~--~
CONCRETE BEFORE COMPOSITE ACTION
'----""""'-- - ,_ ---
6 10 14 18 22 26 30 34 38 42 46 50 54 58 62 PANEL POINT (PP) NO.
Dead load force distribution in the concrete and steel of the top chord in main span.
LOCATION OF DECK SECTION
a. NEAR THE TOWER (PP 62-64)
b. NEAR THE CENTER OF MAIN SPAN (PP 32-34)
C. NEAR THE END OF MAIN SPAN (PP 10-14)
~---r • r--....1
r-_; .r--r·-' ;--
r---' • I r·-.J
~--' : ,_ _ _; r---J OJ .--_; b]Jr-··j
r---' : .- __, .---_, : __ _r- ,_ .......
...r-..... .---...r--..1 r-~- •
I
50 100 TIME (DAYS)
i--1
C I r _J
I I
150
Figure 5 Loading history of three deck sections during erection.

24
CREEP TESTING PROGRAM
Although the long-term modular ratio of a given concrete mix can be estimated using calculation methods based on fresh and hardened concrete properties (4), a better value can be developed based on actual creep tests conducted on several candidate concrete mixes. Creep testing is conducted in accordance with ASTM C512-87 entitled "Standard Test Method for Creep of Concrete in Compression" (5).
Creep tests are conducted by subjecting standard 6x12 inch concrete specimens to a sustained compressive load and at specified time intervals measuring changes of the concrete strain. To account for strain resulting from drying shrinkage, drying induced strains in companion unloaded specimens are measured and the resulting strains are subtracted from load induced strains. Creep tests and the corresponding shrinkage tests, are conducted in a control led temperature and humidity room maintained at 73.4 ~ 3.0°F and 50 ~ 4% relative humidity.
The imposed load for creep testing may be as high as 40 percent of the compressive strength of the concrete measured at the age of loading. If the stress level in the structure is known, it is desirable to conduct the test at that stress tevel. However, if the stress level in the structure varies or it is not known, a stress of between 30 and 40 percent of the concrete strength may be safely used. Several researchers (6 ,7) have reported that for stress levels less than about 40 to 50 percent of concrete strength, creep strains are approximately proportional to the sustained stress and obey the principal of superposition of strain history. ·
Because age of loading has a profound effect on the creep properties of any concrete, creep tests are conducted at several different ages. Typical loading ages include 2, 7, 28, 90 days and 1 year. Later age loading is desirable especially if the construction schedule is such that deck panels will not be loaded until long after they are cast. Because it is desirable to have at least 3 months of creep data on which to base long-term modular ratio predictions, it is apparent that creep tests must be started early in the construction phase of a project. If this is not possible, the effect of loading age on long-term modular ratio can be estimated from a series of creep tests performed at loading ages between 2 and 28 days.
LONG TERM MODULAR RATIO BASED ON CREEP TESTS
The short-term modular ratio is denoted as
Ns =
where Ns Es Ee
Ee
short-term modular ratio modulus of elasticity of steel modulus of elasticity of concrete
and the long-term modular ratio as
Ee ff
( 1)
(2)
TRANSPORTATION RESEARCH RECORD 1290
where
NL long-term modular ratio Eeff= long-term effective modulus of elasticity of
concrete
The long-term effective modulus of elasticity of concrete includes the effect of initial elastic deflection and long-term deflection due to creep and shrinkage. If the importance of shrinkage is minimized through measures as considered above, the long- term effective modulus of elasticity of concrete can be expressed in terms of the modulus of elasticity at time t and the ultimate creep coefficient as shown in the following expression (4)
Ec(t) Ee ff (3)
1 + rau
where
Ec(t)= modulus of elasticity of concrete at time t 121u =ultimate creep coefficient defined as the ratio
of ultimate creep strain to initial strain.
Using the above relationships, the long-term modular ratio can be expressed in terms of the short-term modular ratio and the ultimate creep coefficient as follows
where
Ka loading age correction factor, 1.0 at 7 days Yl humidity correction factor Yh element thickness correction factor
Creep analysis based on the above approach appropriate only when the gradual changes of stress to creep are relatively small and do not result fundamental change in the distribution of stresses the response of a structure.
(4)
is due
in and
The ultimate creep coefficient needed for the prediction of the long-term modular ratio can be established from creep tests. As shown in equation (4), several adjustments must be made to the ultimate creep coefficient to account for age of loading of the creep test specimens as compared to the actual members in the structure, effects of member size as compared to the standard test specimen size, and ambient humidity conditions at the site as compared to the humidity conditions at the laboratory. The fol lowing paragraphs describe how creep test data and knowledge of site and specific structure conditions can be used to estimate long-term modular ratio.
According to reference 4, the creep coefficient at time t for loading age of 7 days for moist cured concrete and for 1 to 3 days steam cured concrete can be expressed in the following form
t0.6 - - - - - - - - - - - - _IZIU (5)
f + t0.6
Arzoumanidis er al.
where
0t creep coefficient at time t
0u ultimate creep coefficient
half time in days
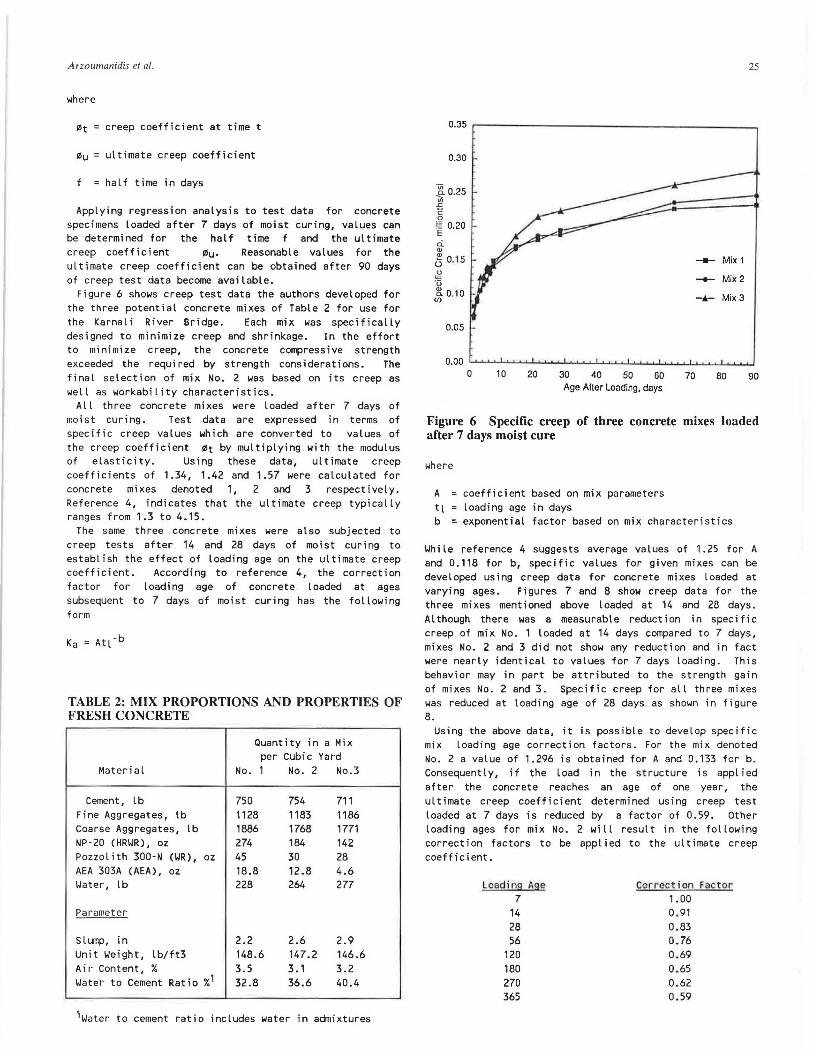
Applying regression analysis to test data for concrete specimens loaded after 7 days of moist curing, values can be determined for the half time f and the ultimate creep coefficient 0u. Reasonable values for the ultimate creep coefficient can be obtained after 90 days of creep test data become available.
Figure 6 shows creep test data the authors developed for the three potential concrete mixes of Table 2 for use for the Karnal i River Bridge. Each mix was specifically designed to minimize creep and shrinkage. In the effort to min1m1ze creep, the concrete compressive strength exceeded the required by strength considerations. The final selection of mix No. 2 was based on its creep as well as workability characteristics.
All three concrete mixes were loaded after 7 days of moist curing. Test data are expressed in terms of specific creep values which are converted to values of the creep coefficient 0t by multiplying with the modulus of elasticity. Using these data, ultimate creep coefficients of 1.34, 1.42 and 1.57 were calculated for concrete mixes denoted 1, 2 and 3 respectively. Reference 4, indicates that the ultimate creep typically ranges from 1.3 to 4.15.
The same three concrete mixes were also subjected to creep tests after 14 and 28 days of moist curing to establish the effect of loading age on the ultimate creep coefficient. According to reference 4, the correction factor for loading age of concrete loaded at ages subsequent to 7 days of moist curing has the fol lowing form
Ka = Aq ·b
TABLE 2: MIX PROPORTIONS AND PROPERTIES OF FRESH CONCRETE
Material
Cement, lb Fine Aggregates, lb Coarse Aggregates, lb NP·20 (HRWR), oz Pozzolith 300·N (WR), oz AEA 303A (AEA), oz Water, lb
Paramet er
Slump, in Unit Weight, lb/ft3 Air Content, % Water to Cement Ratio %1
Quantity in a Mix per Cubic Yard
No. 1
750 1128 1886 274 45 18.8 228
2.2 148.6 3.5 32.8
No. 2
754 1183 1768 184 30 12.8 264
2.6 147.2 3.1 36.6
No.3
711 1186 1771 142 28 4.6 277
2.9 146.6 3.2 40.4
1water to cement ratio includes water in admixtures
25
0.35 r--------------- ------ --.
0.30
~ 0.2S .: c 0 § 0.20 E ci <I>
~ 0.1S
.g ·a ~ 0.1 0
Cf)
a.as
-- Mix1
-- Mix2 --.-- Mix3
0.00 w.... ................................................................................................. o....L..J ........ ........J ................ J... ......... .....J. ......... ...........J
0 10 20 30 40 so 60 70 80 90 Age After Loading, days
Figure 6 Specific creep of three concrete mixes loaded after 7 days moist cure
where
A coefficient based on mix parameters tt loading age in days b exponential factor based on mix characteristics
While reference 4 suggests average values of 1.25 for A and 0.118 for b, specific values for given mixes can be developed using creep data for concrete mixes loaded at varying ages. Figures 7 and 8 show creep data for the three mixes mentioned above loaded at 14 and 28 days. Although there was a measurable reduction in specific creep of mix No. 1 loaded at 14 days compared to 7 days, mixes No. 2 and 3 did not show any reduction and in fact were nearly identical to values for 7 days loading. This behavior may in part be attributed to the strength gain of mixes No. 2 and 3. Specific creep for all three mixes was reduced at loading age of 28 days as shown in figure 8.
Using the above data, it is possible to develop specific mix loading age correction factors. For the mix denoted No. 2 a value of 1.296 is obtained for A and 0.133 for b. Consequently, if the load in the structure is applied after the concrete reaches an age of one year, the ultimate creep coefficient determined using creep test loaded at 7 days is reduced by a factor of 0.59. Other loading ages for mix No. 2 will result in the following correction factors to be applied to the ultimate creep coefficient.
Loadin9 Ase Correction Fac t or 7 1.00
14 0.91 28 0.83 56 0.76
120 0.69 180 0.65 270 0.62 365 0.59
26
0.30
·:g_ 0.25 Cii .r: c 0 § 0.20 E 0: Q)
5 0.15 0 -= ·o ~0. 10
(J)
0.05
0.00 u.... ............................................................................ _._. ................................... ......_........,._._._._. ......... ...........,
0 10 20 30 40 50 60 70 80 90 Age Aller Loading, days
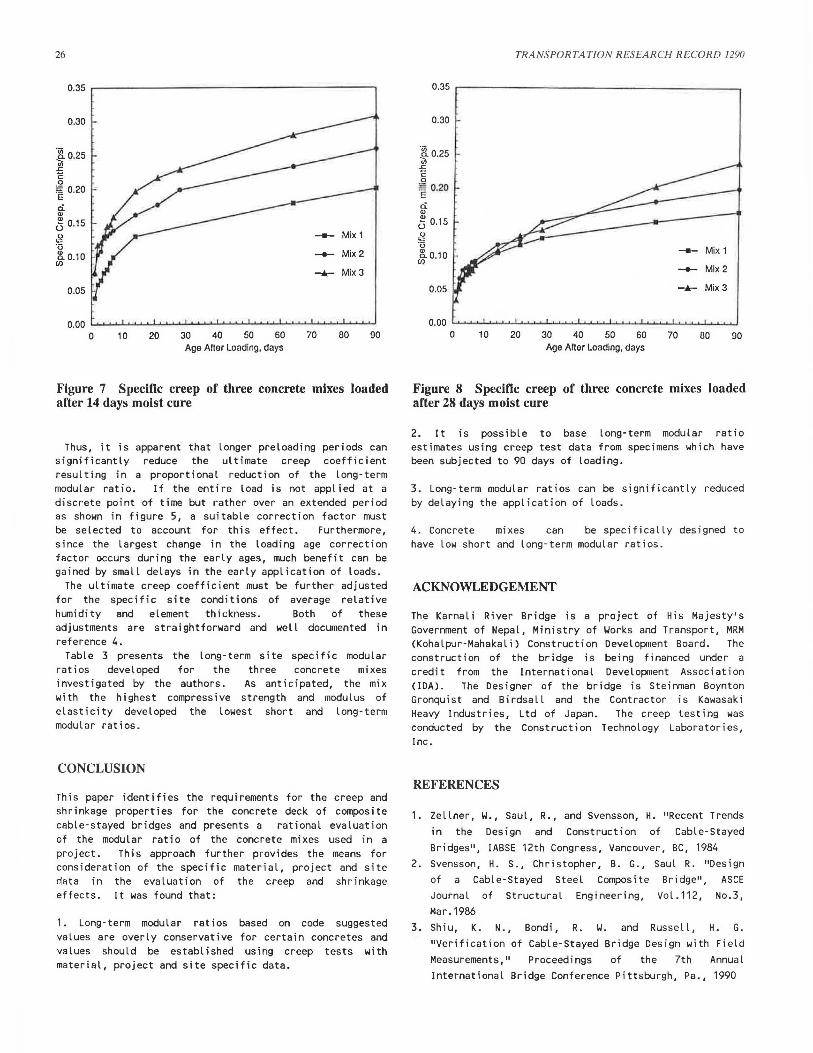
Figure 7 Specific creep of three concrete mixes loaded after 14 days moist cure
Thus, it is apparent that longer preloading periods can significantly reduce the ultimate creep coefficient resulting in a proportional reduction of the long-term modular ratio. If the entire load is not applied at a discrete point of time but rather over an extended period as shown in figure 5, a suitable correction factor must be se L ected to account for this effect. Furthermore, since the largest change in the loading age correction factor occurs during the early ages, much benefit can be gained by small delays in the early application of loads.
The ultimate creep coefficient must be further adjusted for the specific site conditions of average relative humidity and e L ement thickness. Both of these adjustments are straightforward and well documented in reference 4.
Table 3 presents the long-term site specific modular ratios developed for the three concrete mixes investigated by the authors. As anticipated, the mix with the highest compressive strength and modulus of elasticity developed the Lowest short and long·term modular ratios.
CONCLUSION
This paper identifies the requirements for the creep and shrinkage properties for the concrete deck of composite cable-stayed bridges and presents a rational evaluation of the modular ratio of the concrete mixes used in a project. This approach further provides the means for consideration of the specific material, project and site data in the evaluation of the creep and shrinkage effects. It was found that:
1. Long-term modular ratios based on code suggested values are overly conservative for certain concretes and values should be established using creep tests with material, project and site specific data.
TRANSPORTATION RESEARCH RECORD 1290
0.30
"iii ~0.25 .r: c 0
~ 0.20
0: Q)
5 0.15 0
:0 ~0. 10
(J)
0.05
0 10 20 30 40 50 60 70 80 90 Age After Loading, days
Figure 8 Specific creep of three concrete mixes loaded after 28 days moist cure
2. It is possible to base Long-term modular ratio estimates using creep test data from specimens which have been subjected to 90 days of loading.
3. Long-term modular ratios can be significantly reduced by delaying the application of loads .
4. Concrete mixes can be specificall y designed to have Low short and long-term modular ratios .
ACKNOWLEDGEMENT
The Karnal i River Bridge is a project of His Majesty's Government of Nepal, Ministry of Works and Transport, MRM (Kohalpur-Mahakal i) Construction Development Board. The construction of the bridge is being financed under a credit from the International Development Association (IDA). The Designer of the bridge is Steinman Boynton Gronquist and Birdsall and the Contractor is Kawasaki Heavy Industries, Ltd of Japan. The creep testing was conducted by the Construction Technology Laboratories, Inc.
REFERENCES
1. Zellner, W., Saul, R., and Svensson, H. "Recent Trends
in the Design and Construction of Cable-Stayed
Bridges", IABSE 12th Congress, Vancouver, BC, 1984
2. Svensson, H. S., Christopher, B. G., Saul R. "Design
of a Cable-Stayed Steel Composite Bridge", ASCE
Journal of Structural Engineering, Vol . 112 , No.3,
Mar. 1986
3. Shiu, K. N., Bondi, R. w. and Russell, H. G.
"Verification of Cable-Stayed Bridge Design with Field
Measurements," Proceedings of the 7th Annual
International Bridge Conference Pittsburgh, Pa., 1990

Arzoumanidis et al. 27
TABLE 3: LONG TERM MODULAR RATIO FOR THREE CONCRETE MIXES
Compressive Modulus Short-term Creep Loading Age Humidity Thickness Long-term Mix Strength of Elasticity Modular Coefficient Factor Correction Correction Modular No 28 days, psi ksi Ratio 7 days 1 Year Factor Factor Ratio
1 9500 4760 6.09 1.342 0.422 0.821 0.947 8.8 2 7890 4534 6.40 1.419 0.591 0.821 0.947 10.6 3 7300 4345 6.67 1.573 0.623 0.821 0.947 11.8
4. AC! ColTITiittee 209 "Prediction of Creep, Shrinkage, and Temperature Effects in Concrete Structures" AC! Manual of Concrete Practice, Part 1
5. ASTM 512 - 87 "Standard Test Method for Creep of Concrete in Compression" American Society for Testing and Materials, Philadelphia, PA
6. McHenry, D., "A New Application of Creep in Concrete
and its Application for Design," Proceedings American Society for Tesing and Materials, v. 43, 1943, 1069-1086
7. Bazant, Z. P., "Theory of Creep and Shrinkage in Concrete Structures: Precis of Recent Developments," Mechanics Today, Vol. 2, ed. by S. Nemat-Nasser, Pergamon Press, New York, 1975, pp. 1-92.