Embed Size (px)
Citation preview

Global Investment Returns Yearbook
2017 - Slide Deck Elroy Dimson, Paul Marsh and Mike Staunton | London Business School Richard Kersley, Michael O'Sullivan | Credit Suisse
Credit Suisse Research Institute
February 2017

Credit Suisse Global Investment Returns Yearbook 2017
Credit Suisse is proud to publish the 2017
edition of the Global Investment Returns Yearbook.
The Yearbook is produced in conjunction with
Elroy Dimson, Paul Marsh and Mike Staunton, recognized as leading authorities
on the analysis of the long-run performance and trends of stocks, bonds, Treasury bills (cash), inflation and currencies.
The Yearbook provides an analysis of investment returns stretching back 117 years,
spanning all five asset categories in 23 countries.
As well as the typical long term perspective to
current events it brings, this year’s edition provides fresh analysis of factor investing
strategies. Are smart beta strategies…smart?
Richard Kersley Head Global Thematic Research, Global Markets, Credit Suisse +44 20 7888 0313 [email protected]
Michael O'Sullivan Chief Investment Officer, International Wealth Management, Credit Suisse +41 44 332 81 73 michael.o'[email protected]
2
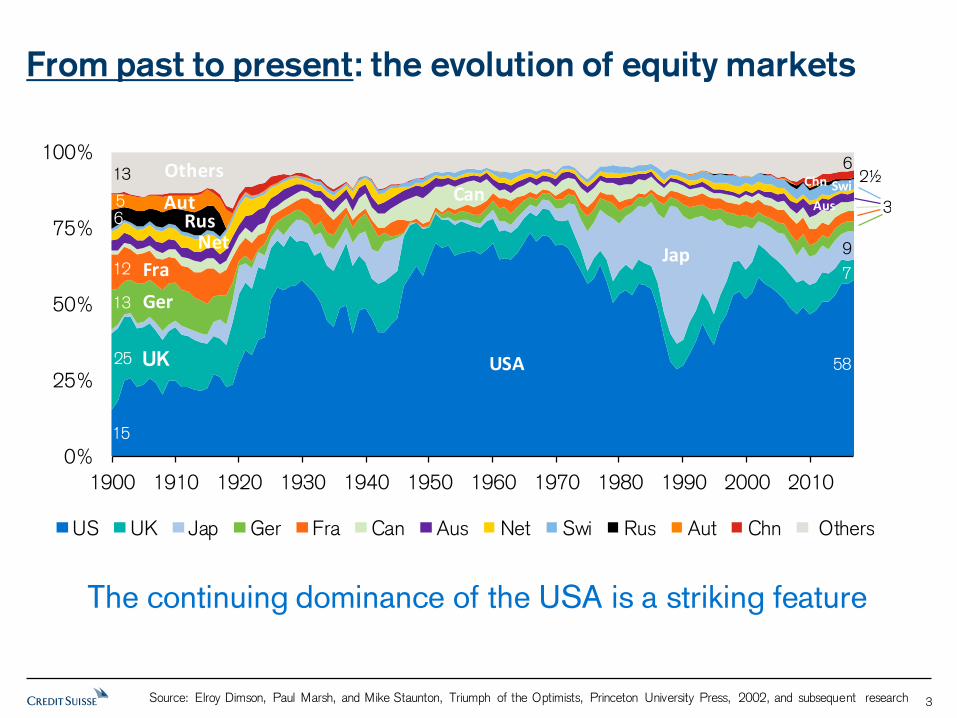
From past to present: the evolution of equity markets
0%
25%
50%
75%
100%
1900 1910 1920 1930 1940 1950 1960 1970 1980 1990 2000 2010
US UK Jap Ger Fra Can Aus Net Swi Rus Aut Chn Others
58
7
9
3
2½6
15
13
56
12
13
25 UK
AutRus
Ger
Fra
USA
Jap
Can
Net
OthersSwi
Aus
Chn
The continuing dominance of the USA is a striking feature
Source: Elroy Dimson, Paul Marsh, and Mike Staunton, Triumph of the Optimists, Princeton University Press, 2002, and subsequent research 3
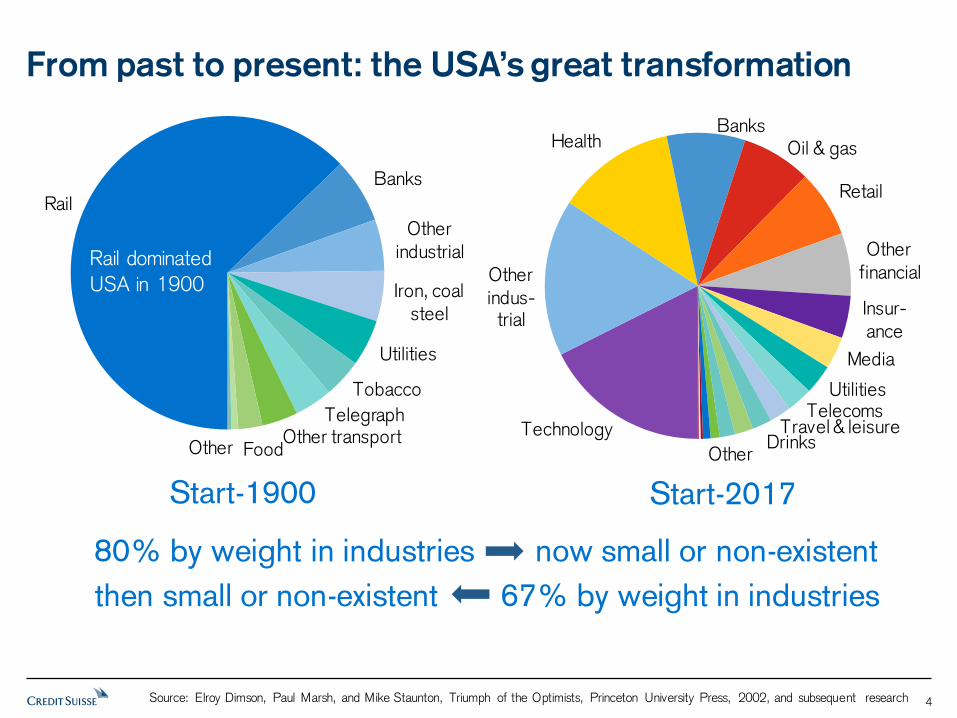
From past to present: the USA’s great transformation
Rail
Banks
Other
industrial
Iron, coalsteel
Utilities
Tobacco
TelegraphOther transport
FoodOther
Start-1900 Start-2017
80% by weight in industries now small or non-existent
then small or non-existent 67% by weight in industries
Technology
Other indus-trial
HealthBanks
Oil & gas
Retail
Other
financial
Insur-
ance
Media
UtilitiesTelecoms
Travel & leisureDrinks
Other
Rail dominated
USA in 1900
Source: Elroy Dimson, Paul Marsh, and Mike Staunton, Triumph of the Optimists, Princeton University Press, 2002, and subsequent research 4
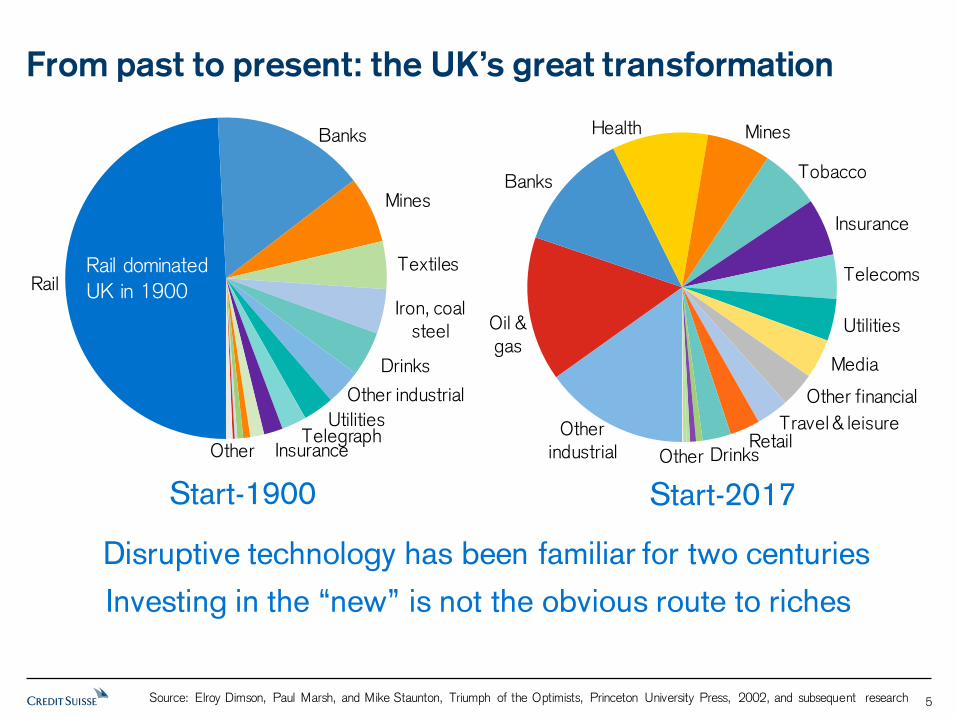
From past to present: the UK’s great transformation
Start-1900 Start-2017
Disruptive technology has been familiar for two centuries
Investing in the “new” is not the obvious route to riches
Rail
Banks
Mines
Textiles
Iron, coal
steel
Drinks
Other industrial
UtilitiesTelegraph
InsuranceOtherOther
industrial
Oil &
gas
Banks
Health Mines
Tobacco
Insurance
Telecoms
Utilities
Media
Other financial
Travel & leisureRetail
DrinksOther
Rail dominated
UK in 1900
Source: Elroy Dimson, Paul Marsh, and Mike Staunton, Triumph of the Optimists, Princeton University Press, 2002, and subsequent research 5

The past: Real returns and dividends, 1900–2016
We should focus on real return. Real return is largely dividends.
1,402
11.9 9.8
2.6
0
1
10
100
1,000
10,000
1900 10 20 30 40 50 60 70 80 90 2000 10
Equities: return 6.4% p.a. Equities: capital gain 2.1% p.a.
Bonds 2.0% p.a. Bills 0.8% p.a.
0.1
Reinv-
ested
divi-
dends
513
8.1
3.3
0
1
10
100
1,000
1900 10 20 30 40 50 60 70 80 90 2000 10
Equities: return 5.5% p.a. Equities: capital gain 0.8% p.a.
Bonds 1.8% p.a. Bills 1.0% p.a.
0.1
2.7
Reinv-
ested
divi-
dends
United Kingdom
United States
Source: Elroy Dimson, Paul Marsh, and Mike Staunton, Triumph of the Optimists, Princeton University Press, 2002, and subsequent research 6

Long-run asset returns for all countries, 1900–2016
Prospectively, the world equity premium (versus bills) is 3–3½%
4.3
5.1
6.4
-6
-4
-2
0
2
4
6
Aut Ita Bel Fra Ger Prt Spa Jap Eur Nor WxU Ire Swi Net Wld Den Fin UK Can Swe NZ US Aus SAf
Equities Bonds Bills
Annualized real return (%)
Historical equity risk
premium vs. bonds = 3.2%
Historical equity risk
premium vs. bills = 4.2%
Source: Elroy Dimson, Paul Marsh, and Mike Staunton, Triumph of the Optimists, Princeton University Press, 2002, and subsequent research 7
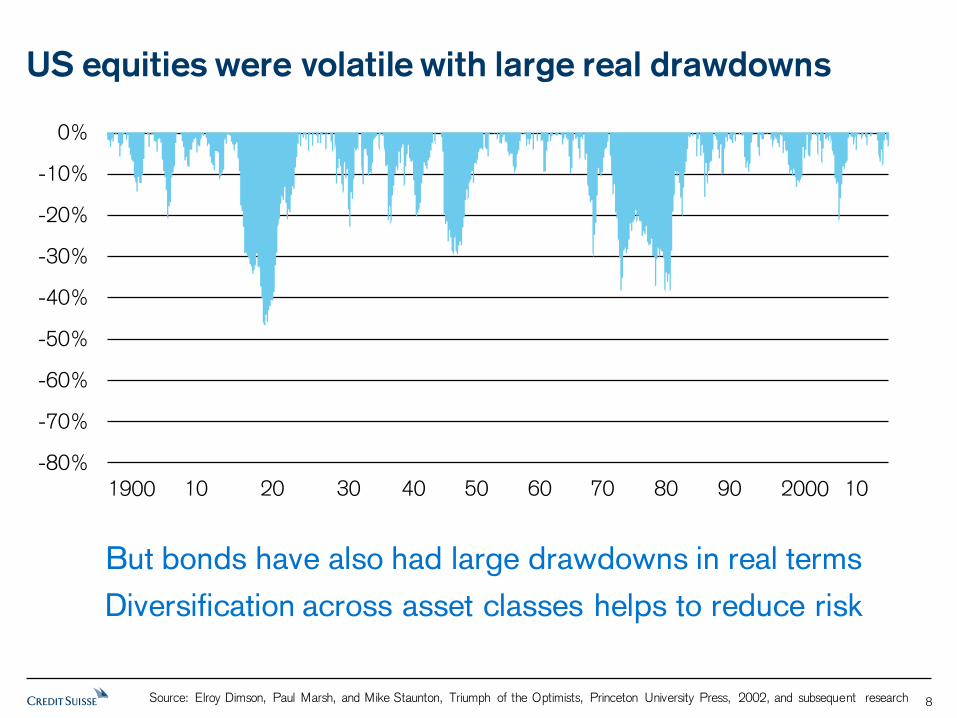
US equities were volatile with large real drawdowns
-80%
-70%
-60%
-50%
-40%
-30%
-20%
-10%
0%
But bonds have also had large drawdowns in real terms
Diversification across asset classes helps to reduce risk
-80%
-70%
-60%
-50%
-40%
-30%
-20%
-10%
0%
-80%
-70%
-60%
-50%
-40%
-30%
-20%
-10%
0%
Bonds
Equities-80%
-70%
-60%
-50%
-40%
-30%
-20%
-10%
0%
Source: Elroy Dimson, Paul Marsh, and Mike Staunton, Triumph of the Optimists, Princeton University Press, 2002, and subsequent research 8
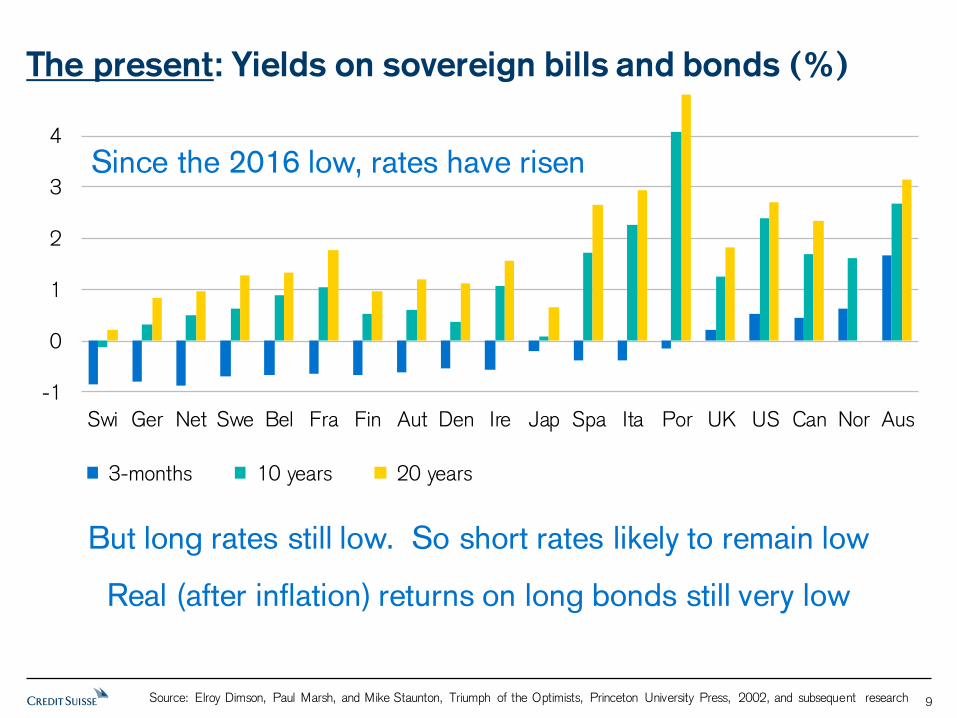
But long rates still low. So short rates likely to remain low
Real (after inflation) returns on long bonds still very low
-1
0
1
2
3
4
Swi Ger Net Swe Bel Fra Fin Aut Den Ire Spa Ita Jap Por UK US Can Nor Aus
3-months 10 years 20 years
In 2016 rates hit all-time low
-1
0
1
2
3
4
Swi Ger Net Swe Bel Fra Fin Aut Den Ire Jap Spa Ita Por UK US Can Nor Aus
3-months 10 years 20 years
The present: Yields on sovereign bills and bonds (%)
Since the 2016 low, rates have risen
Source: Elroy Dimson, Paul Marsh, and Mike Staunton, Triumph of the Optimists, Princeton University Press, 2002, and subsequent research 9
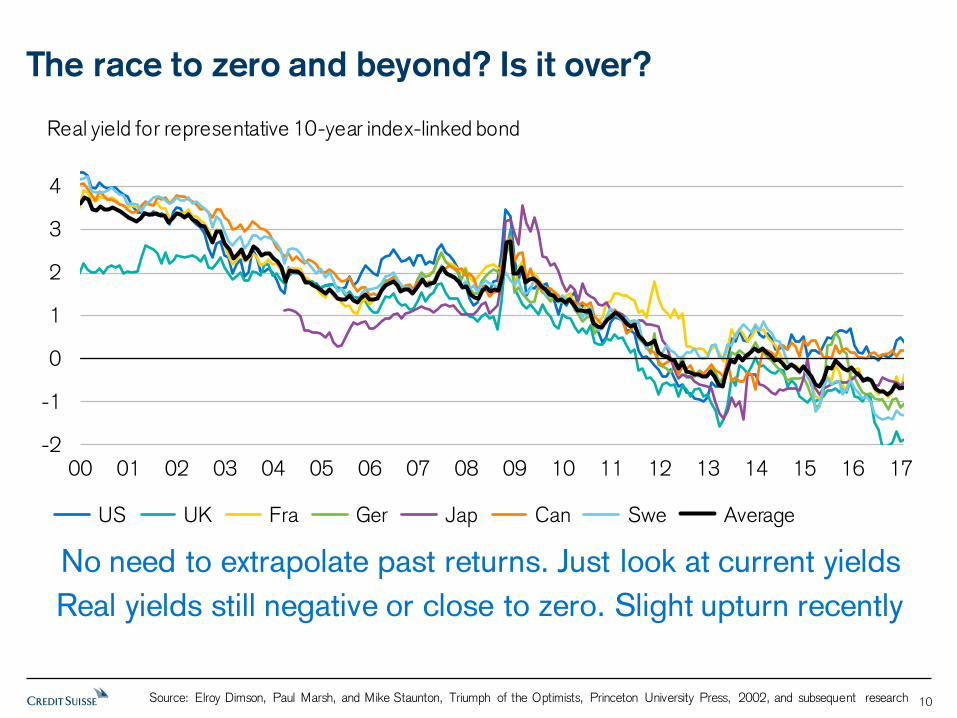
The race to zero and beyond? Is it over?
-2
-1
0
1
2
3
4
00 01 02 03 04 05 06 07 08 09 10 11 12 13 14 15 16 17
US UK Fra Ger Jap Can Swe Average
Real yield for representative 10-year index-linked bond
No need to extrapolate past returns. Just look at current yields
Real yields still negative or close to zero. Slight upturn recently
Source: Elroy Dimson, Paul Marsh, and Mike Staunton, Triumph of the Optimists, Princeton University Press, 2002, and subsequent research 10

Real interest rates impact subsequent real equity and bond returns
Low real interest rates means a low return world
- 5.4
1.4
4.2 5.2 5.2
7.6 9.0
11.0
- 10.0
- 3.4
2.2
4.0
5.6
9.8
- 11
- 2.2
0.1
1.4
2.8
4.6
9.4
-15
-10
-5
0
5
10
Low 5% Next 15% Next 15% Next 15% Next 15% Next 15% Next 15% Top 5%
Equities next 5 years % p.a. Bonds next 5 years % p.a. Real interest rate boundary %
Percentiles of real interest rates across 2,317 country - years
Real rate of return (%)
Source: Elroy Dimson, Paul Marsh, and Mike Staunton, Triumph of the Optimists, Princeton University Press, 2002, and subsequent research 11
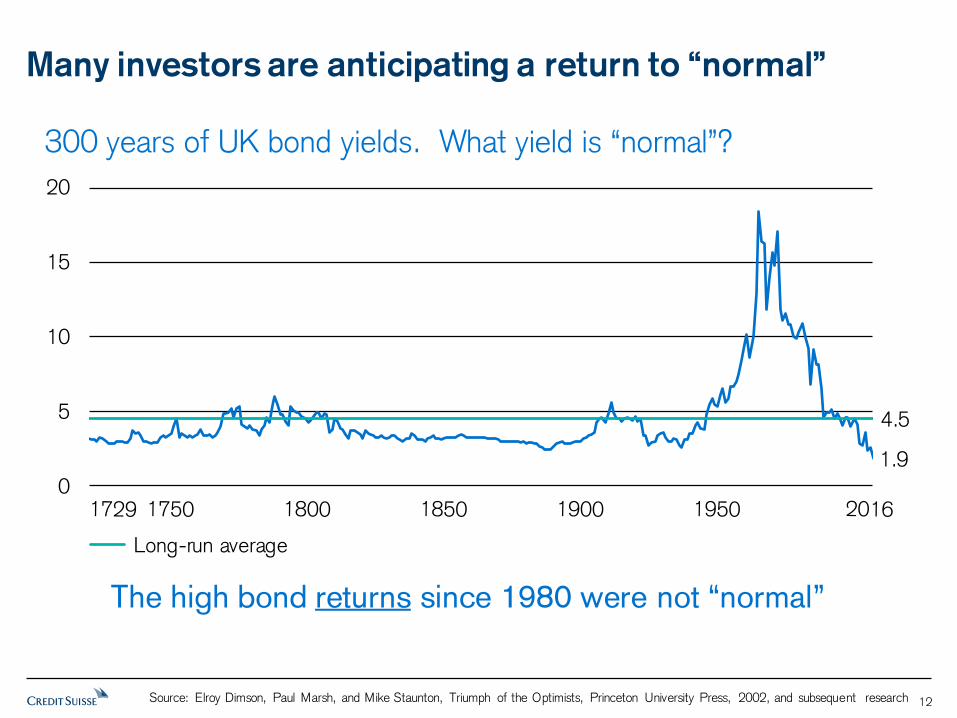
Many investors are anticipating a return to “normal”
1.9
4.5
0
5
10
15
20
Long-run average
The high bond returns since 1980 were not “normal”
300 years of UK bond yields. What yield is “normal”?
Source: Elroy Dimson, Paul Marsh, and Mike Staunton, Triumph of the Optimists, Princeton University Press, 2002, and subsequent research 12
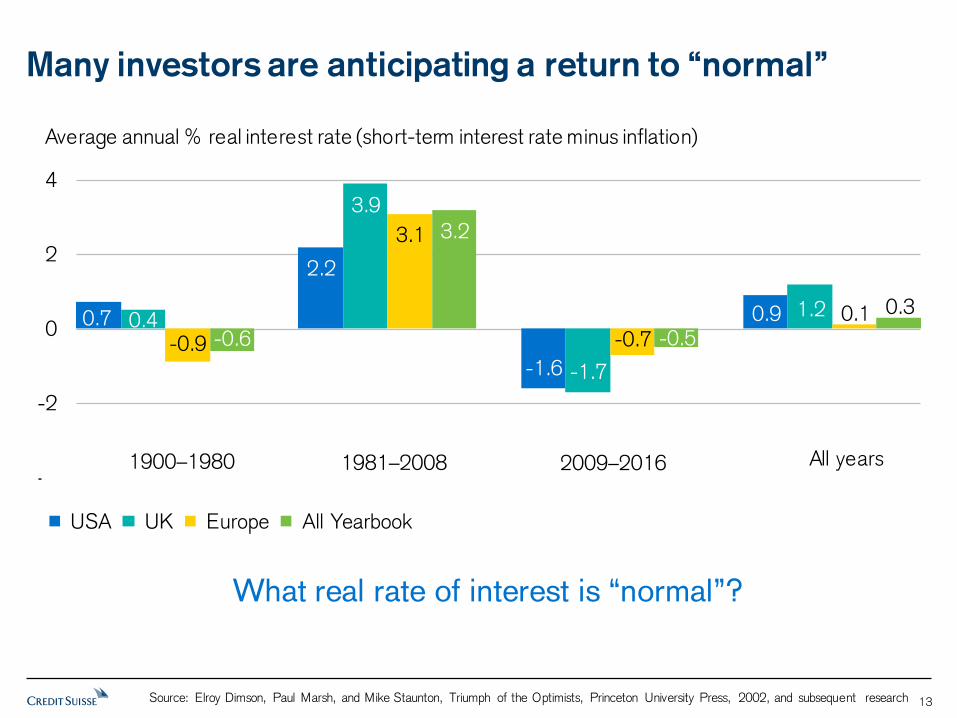
Many investors are anticipating a return to “normal”
What real rate of interest is “normal”?
0.7
2.2
-1.6
0.90.4
3.9
-1.7
1.2
-0.9
3.1
-0.70.1
-0.6
3.2
-0.5
0.3
-4
-2
0
2
4
USA UK Europe All Yearbook
Average annual % real interest rate (short-term interest rate minus inflation)
1900–1980 1981–2008 2009–2016 All years
Source: Elroy Dimson, Paul Marsh, and Mike Staunton, Triumph of the Optimists, Princeton University Press, 2002, and subsequent research 13
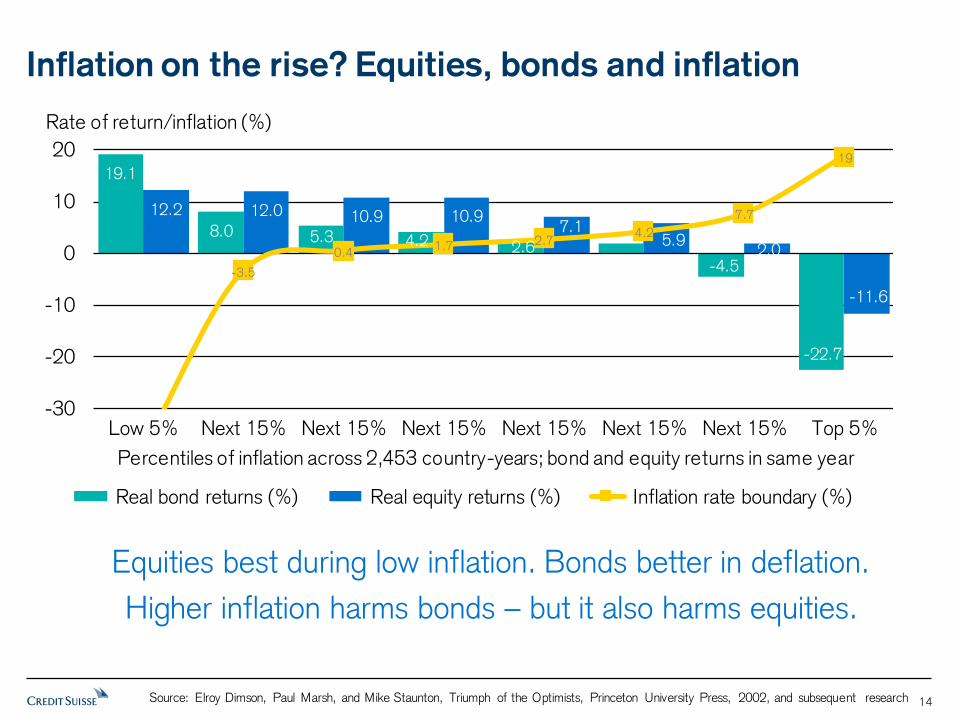
Inflation on the rise? Equities, bonds and inflation
Equities best during low inflation. Bonds better in deflation.
Higher inflation harms bonds – but it also harms equities.
19.1
8.0 5.3 4.2 2.6-4.5
-22.7
12.2 12.0 10.9 10.97.1
5.92.0
-11.6
-3.5
0.41.7 2.7
4.2
7.7
19
-30
-20
-10
0
10
20
Low 5% Next 15% Next 15% Next 15% Next 15% Next 15% Next 15% Top 5%
Real bond returns (%) Real equity returns (%) Inflation rate boundary (%)
Percentiles of inflation across 2,453 country-years; bond and equity returns in same year
Rate of return/inflation (%)
Source: Elroy Dimson, Paul Marsh, and Mike Staunton, Triumph of the Optimists, Princeton University Press, 2002, and subsequent research 14
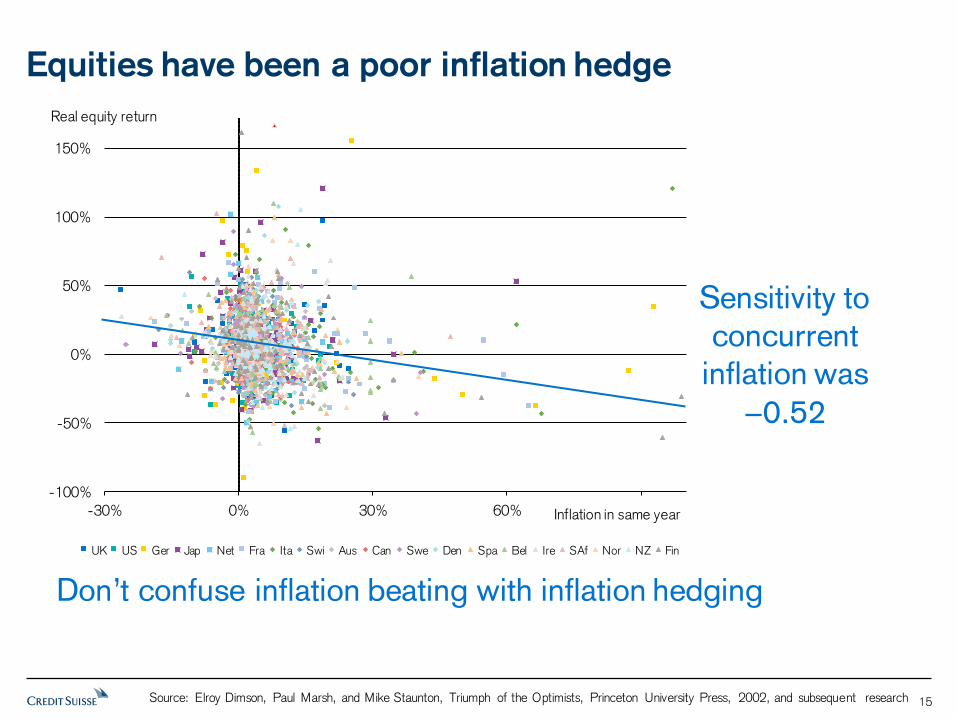
Equities have been a poor inflation hedge
Sensitivity to
concurrent
inflation was
−0.52
Don’t confuse inflation beating with inflation hedging
-100%
-50%
0%
50%
100%
150%
-30% 0% 30% 60% 90%
UK US Ger Jap Net Fra Ita Swi Aus Can Swe Den Spa Bel Ire SAf Nor NZ Fin
Inflation in same year
Real equity return
Source: Elroy Dimson, Paul Marsh, and Mike Staunton, Triumph of the Optimists, Princeton University Press, 2002, and subsequent research 15

The future: What equity premium can we expect?
We estimate the long-run equity premium vs bills to be 3–3½%
5.1
4.1
0.5
0.5
3.3
0.8
0
1
2
3
4
5
Historical equity
real return
Real dividend
growth
Change in
P/D ratio
Average
dividend yield
Treasury bill
return
Expected equity
risk premium
Annualised (% p.a.)
Source: Elroy Dimson, Paul Marsh, and Mike Staunton, Triumph of the Optimists, Princeton University Press, 2002, and subsequent research 16
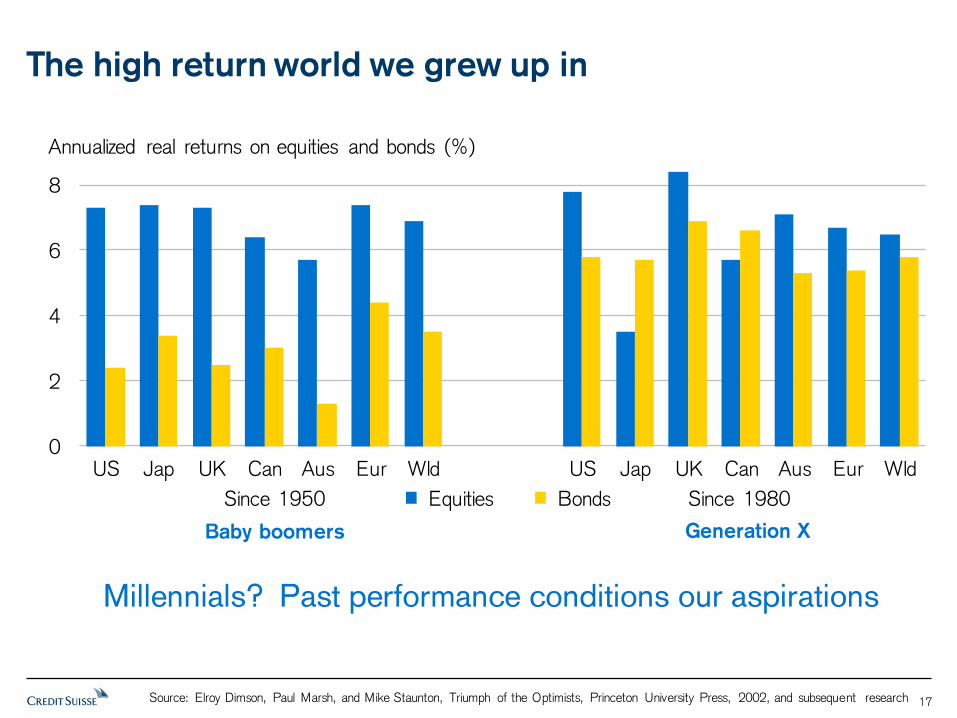
The high return world we grew up in
Millennials? Past performance conditions our aspirations
0
2
4
6
8
US Jap UK Can Aus Eur Wld US Jap UK Can Aus Eur Wld
Since 1950 Since 1980 Equities Bonds
Annualized real returns on equities and bonds (%)
Baby boomers Generation X
Source: Elroy Dimson, Paul Marsh, and Mike Staunton, Triumph of the Optimists, Princeton University Press, 2002, and subsequent research 17
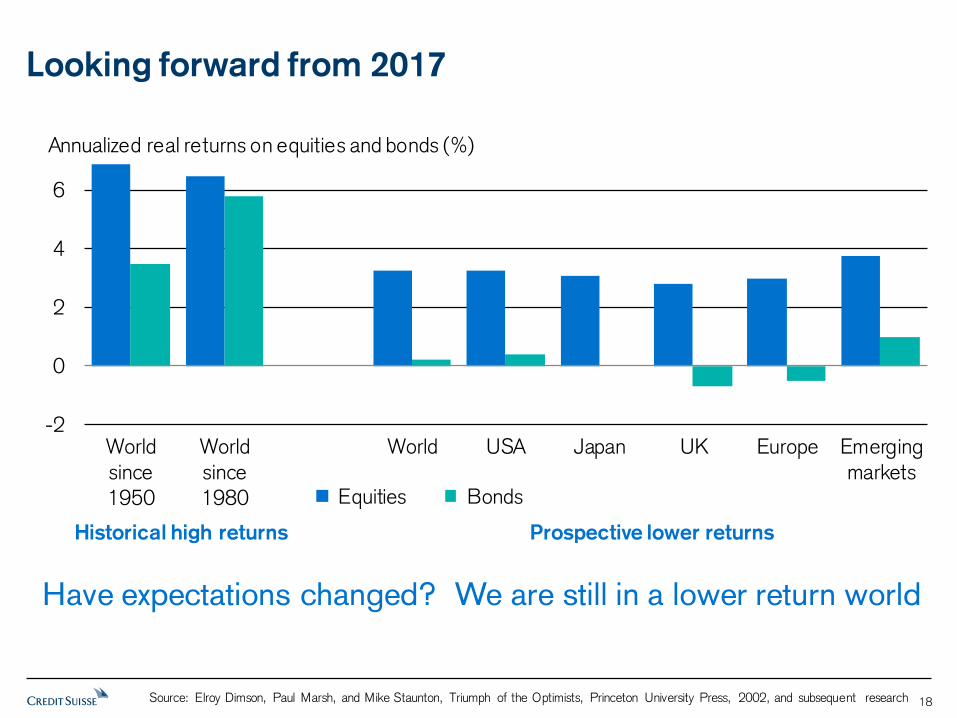
Looking forward from 2017
-2
0
2
4
6
World
since
1950
World
since
1980
World USA Japan UK Europe Emerging
markets
Historical high returns Prospective lower returns
Equities Bonds
Annualized real returns on equities and bonds (%)
We are still in a lower return world Have expectations changed?
-2
0
2
4
6
World
since
1950
World
since
1980
World USA Japan UK Europe Emerging
markets
Historical high returns Prospective lower returns
Equities Bonds
Annualized real returns on equities and bonds (%)
Source: Elroy Dimson, Paul Marsh, and Mike Staunton, Triumph of the Optimists, Princeton University Press, 2002, and subsequent research 18

Real interest rates are low, and bond yields are low
– expected returns on all assets are lower than past returns
– modest rises in inflation are unlikely to impact real returns
Long-run equity premium (vs bills) is around 3–3½%
– lower than the historical average
– equities will stay volatile, but diversification lowers risk
What to do about the low-return world?
– the Yearbook provides a long-term perspective
– the current ‘vogue’ is to seek returns from smart beta…
The future
Source: Elroy Dimson, Paul Marsh, and Mike Staunton, Triumph of the Optimists, Princeton University Press, 2002, and subsequent research 19

Investors ditching active management (USA, 2007–16)
Sources: Investment Company Institute, Simfund, Credit Suisse
Cumulati
ve asset
flow
(USD bn)
20
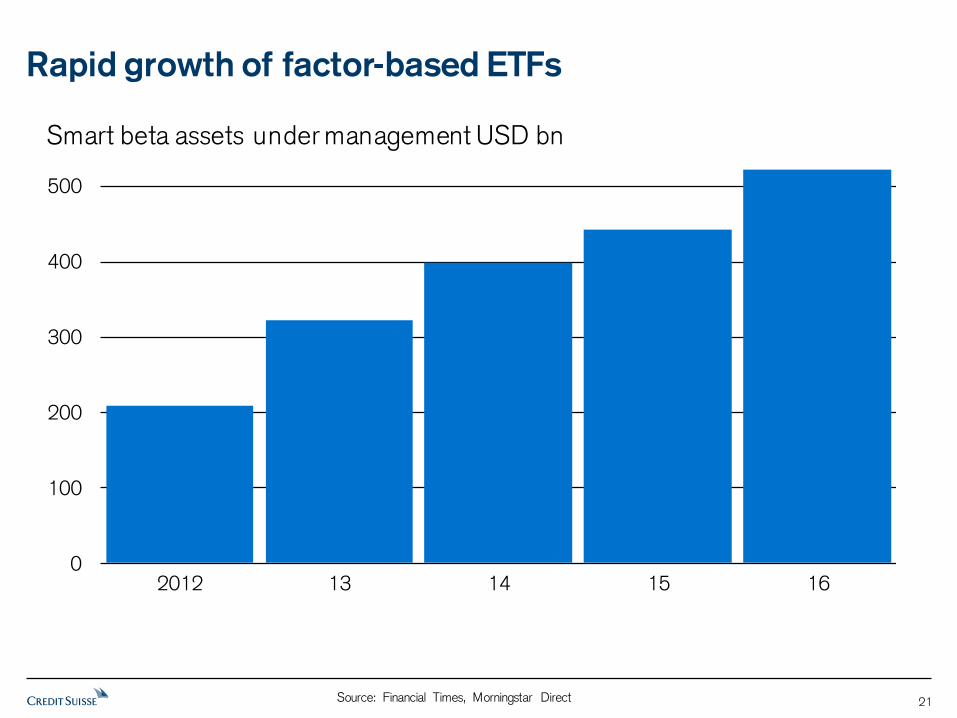
Rapid growth of factor-based ETFs
Source: Financial Times, Morningstar Direct
0
100
200
300
400
500
2012 13 14 15 16
Smart beta assets under management USD bn
21
Are investment institutions adopting smart beta?
75% now using or actively evaluating smart beta
Among users, two-thirds considering further allocation
20% now use ≥ 5 smart beta indexes (vs 2% in 2014)
22
The smart-beta “zoo”
Researchers have reported on 458 factors
– few will work out-of-sample
Fama-French identify five factors
– market, size, value, profitability, investment
– others stress low-risk, and momentum
We study five factors
– low-risk, momentum, size, value, income
– over up to 117 years, and in up to 23 markets
Source: Elroy Dimson, Paul Marsh, and Mike Staunton, Triumph of the Optimists, Princeton University Press, 2002, and subsequent research 23

Low-risk investing
Classic strategy (published 1972)
– low beta portfolio gives superior risk-adjusted return
– now labelled as BAB (Bet Against Beta)
Recent approach uses idiosyncratic volatility
– low-volatility portfolio gives superior return…
– … compared to high-volatility portfolio
Many variants of these “low-vol” strategies
– an approach that has become popular since the GFC
Source: Elroy Dimson, Paul Marsh, and Mike Staunton, Triumph of the Optimists, Princeton University Press, 2002, and subsequent research 24
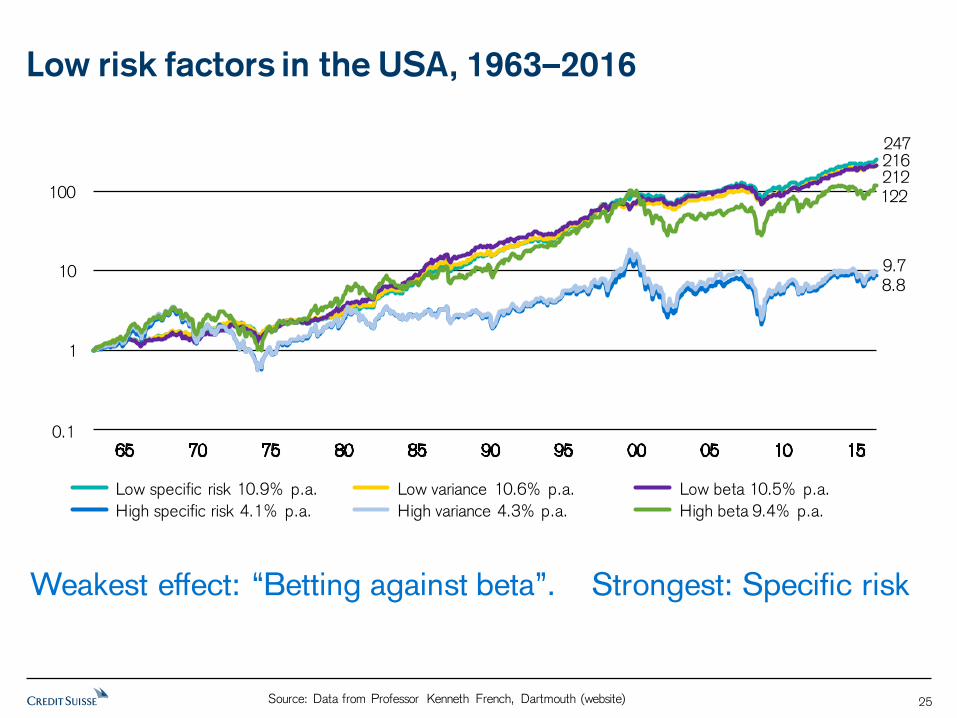
Low risk factors in the USA, 1963–2016
247
212
8.8 9.7
122
0
1
10
100
1,000
Low specific risk 10.9% p.a. Low variance 10.6% p.a. Low beta 10.5% p.a.
High specific risk 4.1% p.a. High variance 4.3% p.a. High beta 9.4% p.a.
0.1
216
Weakest effect: “Betting against beta”
Source: Data from Professor Kenneth French, Dartmouth (website)
Weakest effect: “Betting against beta”. Strongest: Specific risk
25
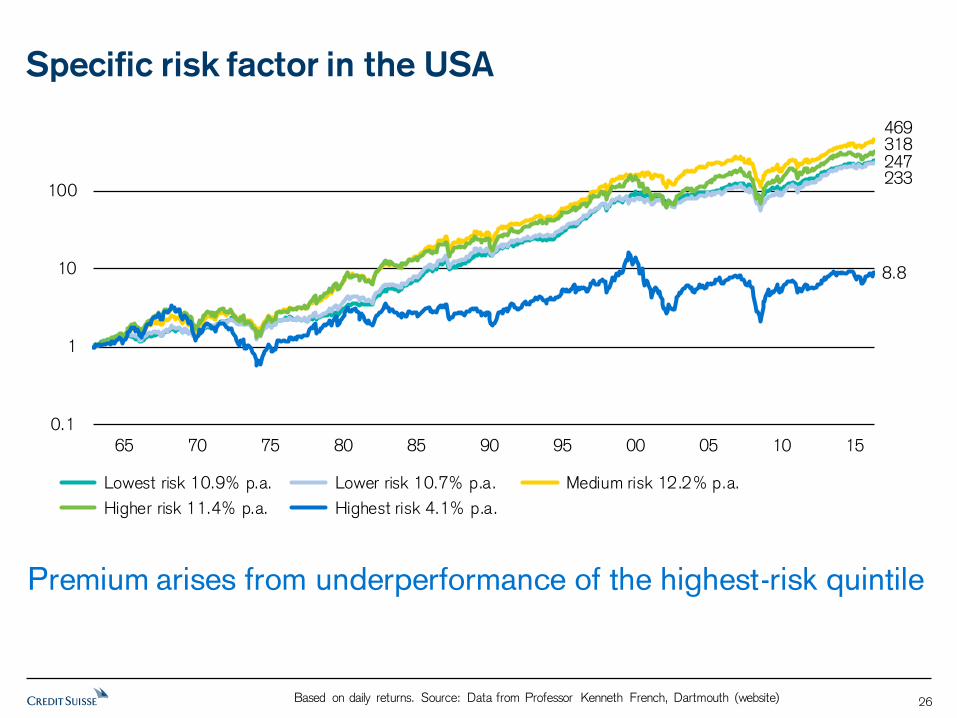
Specific risk factor in the USA
247233
469318
8.8
0
1
10
100
1,000
Lowest risk 10.9% p.a. Lower risk 10.7% p.a. Medium risk 12.2% p.a.
Higher risk 11.4% p.a. Highest risk 4.1% p.a.
0.1
Premium arises from underperformance of the highest-risk quintile
Based on daily returns. Source: Data from Professor Kenneth French, Dartmouth (website) 26

Specific risk factor in the UK
35.924.9
3.9
0
1
10
100
Lowest risk 11.6% p.a. Medium risk 10.3% p.a. Highest risk 4.2% p.a.
0.1
Same methodology using daily data: UK results similar to USA
Source: Elroy Dimson, Paul Marsh, and Mike Staunton, Triumph of the Optimists, Princeton University Press, 2002, and subsequent research 27
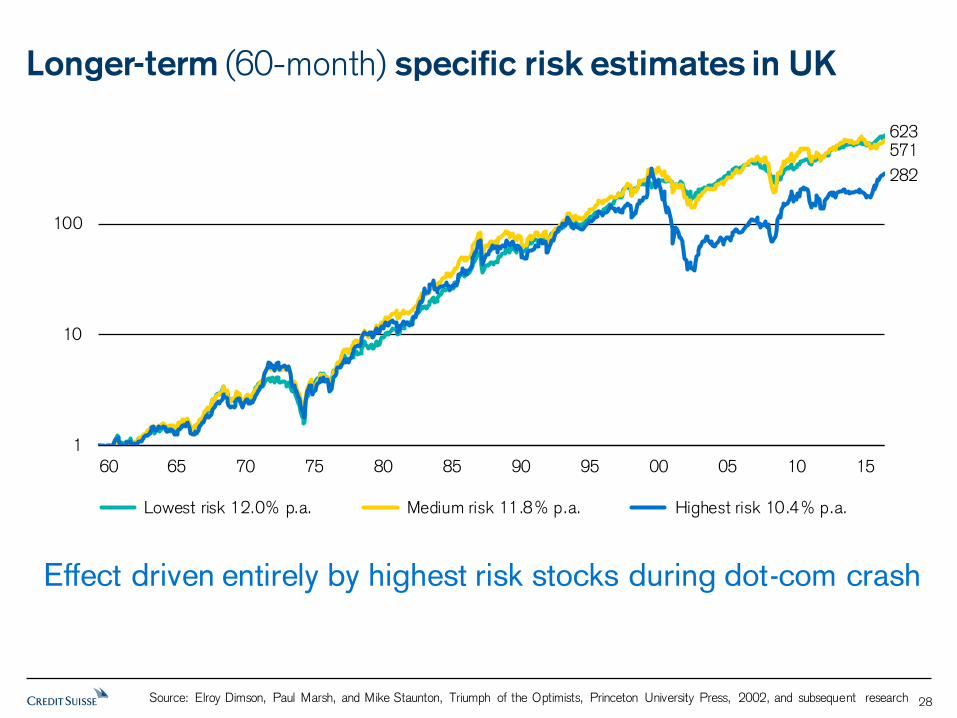
Longer-term (60-month) specific risk estimates in UK
Effect driven entirely by highest risk stocks during dot-com crash
623571
282
1
10
100
1,000
Lowest risk 12.0% p.a. Medium risk 11.8% p.a. Highest risk 10.4% p.a.
Source: Elroy Dimson, Paul Marsh, and Mike Staunton, Triumph of the Optimists, Princeton University Press, 2002, and subsequent research 28
Momentum
Sort stocks by return over past 6 or 12 months
—target the top and bottom quintile (say)
Wait a month
—then buy past winners (and short past losers)
Rebalance periodically
—typically after 6, 3 or 1 month(s)
Measure premium: WML (“Winner Minus Loser”)
Source: Elroy Dimson, Paul Marsh, and Mike Staunton, Triumph of the Optimists, Princeton University Press, 2002, and subsequent research 29

The momentum premium, 1900*–2016
United States† United Kingdom‡
* from 1926 in the US † Based on a 6/1/6 momentum strategy ‡ Based on a 12/1/1 momentum strategy
Large long-run, pre-cost returns; but volatile with high turnover
2,131,993
3,634
0
1
10
100
1,000
10,000
100,000
1,000,000
10,000,000
Winner 17.5% per year Loser 9.5% per year
Cumulative difference
between winners and
losers 7.4%
0.1
5,043,966
61
0
1
10
100
1,000
10,000
100,000
1,000,000
10,000,000
1900 10 20 30 40 50 60 70 80 90 2000 10
Winner 14.1% per year Loser 3.6% per year
Cumulative difference
between winners and
losers 10.4%0.1
Source: Elroy Dimson, Paul Marsh, and Mike Staunton, Triumph of the Optimists, Princeton University Press, 2002, and subsequent research 30

Unusually, the factor premium was larger after the original study
.71.79
-0.5
0.0
0.5
1.0
1.5
Jap Chi Rus Spa US Can Aus Swe Prt Fra Aut Avg Ger Neth Ita Bel Swi Fin Ire UK Nor Den NZ SAf
Griffin, Ji & Martin: to end-2000 Full period to end-2016 (updated by Dimson, Marsh & Staunton)
Winner minus loser returns, % per month
Momentum returns around the world
Source: Elroy Dimson, Paul Marsh, and Mike Staunton, Triumph of the Optimists, Princeton University Press, 2002, and subsequent research 31

Other factors: the size premium, 1926*–2015
United States
The smallest firms have performed the best, but not consistently
* from 1955 in the UK
Sources: US CRSP capitalization deciles are from Morningstar; UK Small and Mid-caps are Numis indices
United Kingdom
33,879
4,690
53,263
0
1
10
100
1,000
10,000
100,000
26 30 35 40 45 50 55 60 65 70 75 80 85 90 95 00 05 10 15
Micro-caps 12.7% per year Small-caps 12.1% per year
Larger-caps 9.7% per year
0.1
27,256
6,861
3,220
1,087
1
10
100
1,000
10,000
100,000
1955 60 65 70 75 80 85 90 95 2000 05 10 15
Micro-caps 17.9% per year Small-caps 15.3% per year
Mid-caps 13.9% per year Large-caps 12.0% per year
32
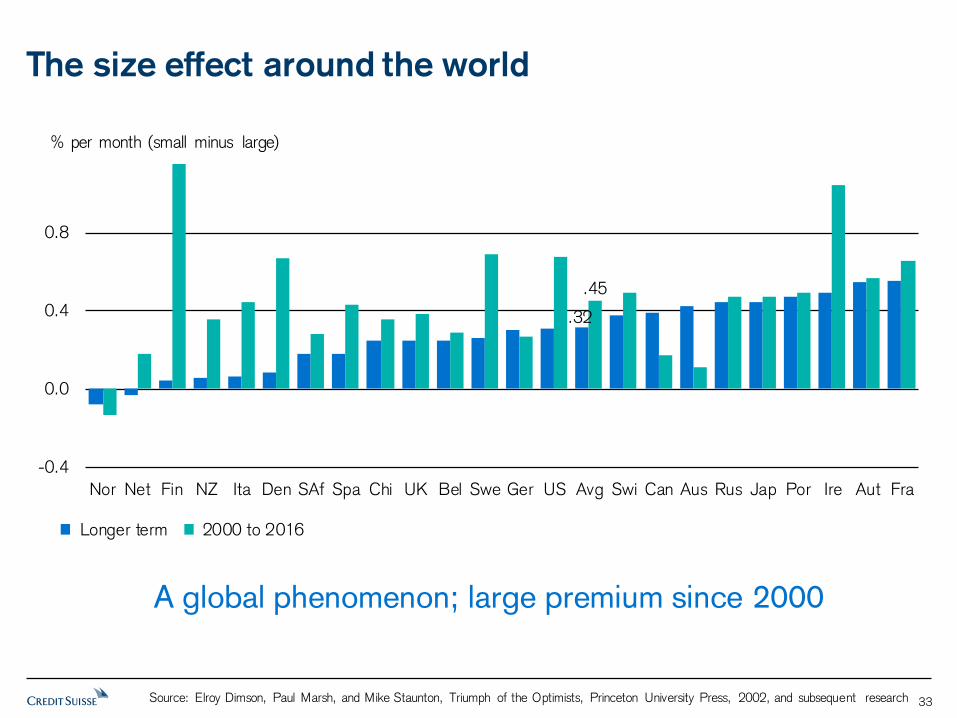
The size effect around the world
.32
.45
-0.4
0.0
0.4
0.8
Nor Net Fin NZ Ita Den SAf Spa Chi UK Bel Swe Ger US Avg Swi Can Aus Rus Jap Por Ire Aut Fra
Longer term 2000 to 2016
% per month (small minus large)
A global phenomenon; large premium since 2000
Source: Elroy Dimson, Paul Marsh, and Mike Staunton, Triumph of the Optimists, Princeton University Press, 2002, and subsequent research 33
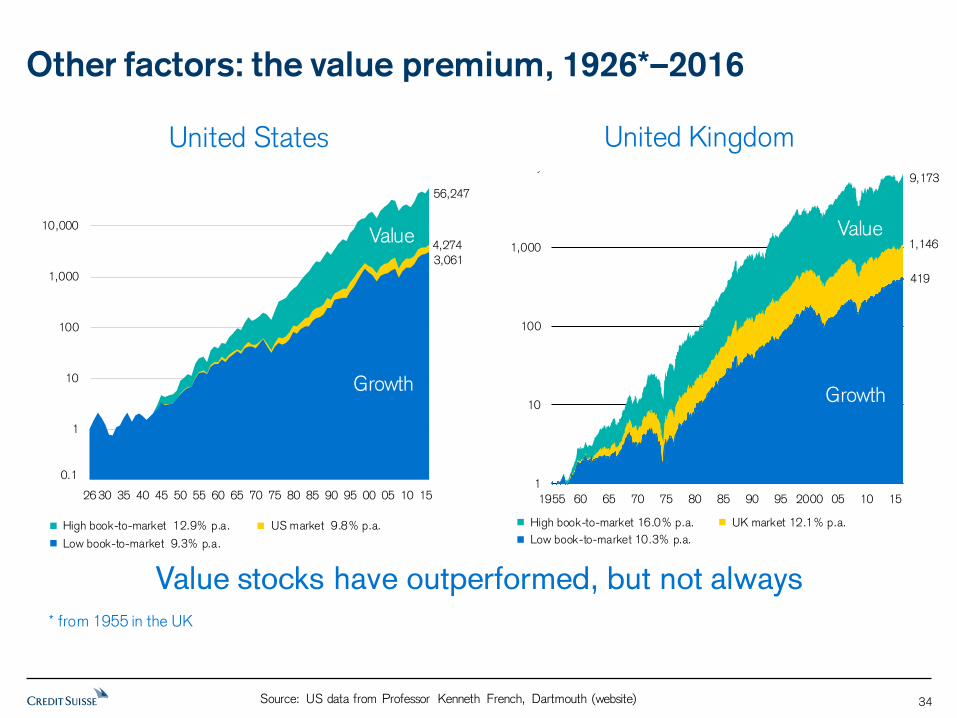
Other factors: the value premium, 1926*–2016
* from 1955 in the UK
United States United Kingdom
Value stocks have outperformed, but not always
56,247
4,274
3,061
0
1
10
100
1,000
10,000
100,000
26 30 35 40 45 50 55 60 65 70 75 80 85 90 95 00 05 10 15
High book-to-market 12.9% p.a. US market 9.8% p.a.
Low book-to-market 9.3% p.a.
0.1
9,173
1,146
419
1
10
100
1,000
10,000
1955 60 65 70 75 80 85 90 95 2000 05 10 15
High book-to-market 16.0% p.a. UK market 12.1% p.a.
Low book-to-market 10.3% p.a.
Value
Growth Growth
Value
Source: US data from Professor Kenneth French, Dartmouth (website) 34

The value effect around the world
2.1 2.5
-10
-5
0
5
10
Ire Fin Den Swi Ita Por NZ US Bel Ger UK Spa Wld Fra SAf Net Swe Can Aus Aut Nor Jap Chi Rus
Longer term Since 2000
Source: MSCI value and growth indexes
Value beat growth in most countries over the long-run
% per year (value minus growth)
35
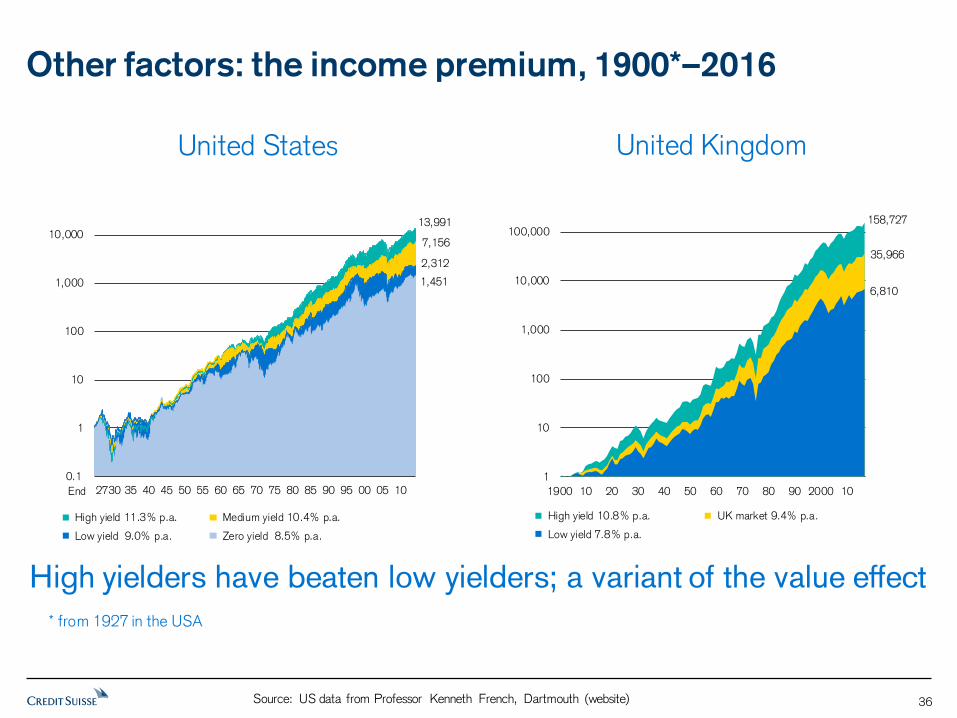
Other factors: the income premium, 1900*–2016
* from 1927 in the USA
High yielders have beaten low yielders; a variant of the value effect
United States United Kingdom
1,451
13,991
7,156
2,312
0
1
10
100
1,000
10,000
100,000
High yield 11.3% p.a. Medium yield 10.4% p.a.
Low yield 9.0% p.a. Zero yield 8.5% p.a.
0.1
End
158,727
35,966
6,810
1
10
100
1,000
10,000
100,000
1,000,000
1900 10 20 30 40 50 60 70 80 90 2000 10
High yield 10.8% p.a. UK market 9.4% p.a.
Low yield 7.8% p.a.
Source: US data from Professor Kenneth French, Dartmouth (website) 36
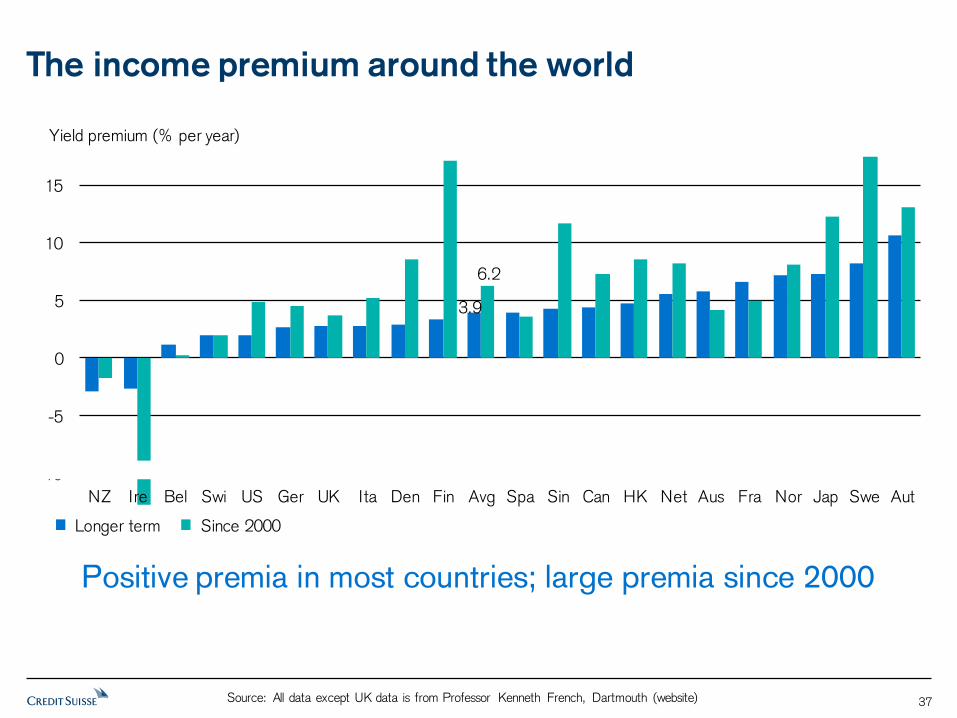
The income premium around the world
Positive premia in most countries; large premia since 2000
Source: All data except UK data is from Professor Kenneth French, Dartmouth (website)
3.9
6.2
-10
-5
0
5
10
15
NZ Ire Bel Swi US Ger UK Ita Den Fin Avg Spa Sin Can HK Net Aus Fra Nor Jap Swe Aut
Longer term Since 2000
Yield premium (% per year)
37
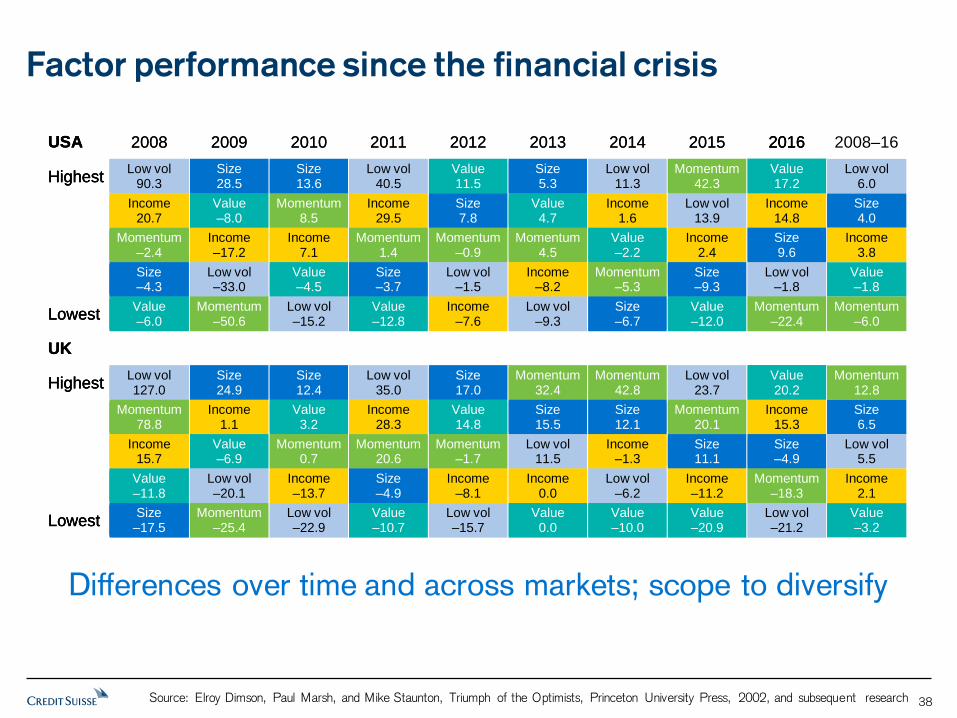
Factor performance since the financial crisis
USA 2016
Highest Value 17.2
Income
14.8
Size 9.6
Low vol
–1.8
Lowest Momentum
–22.4
UK
Highest Value 20.2
Income
15.3
Size –4.9
Momentum
–18.3
Lowest Low vol –21.2
USA 2008 2009 2010 2011 2012 2013 2014 2015 2016
Highest Low vol
90.3 Size 28.5
Size 13.6
Low vol 40.5
Value 11.5
Size 5.3
Low vol 11.3
Momentum 42.3
Value 17.2
Income
20.7 Value –8.0
Momentum 8.5
Income 29.5
Size 7.8
Value 4.7
Income 1.6
Low vol 13.9
Income 14.8
Momentum
–2.4 Income –17.2
Income 7.1
Momentum 1.4
Momentum –0.9
Momentum 4.5
Value –2.2
Income 2.4
Size 9.6
Size –4.3
Low vol –33.0
Value –4.5
Size –3.7
Low vol –1.5
Income –8.2
Momentum –5.3
Size –9.3
Low vol –1.8
Lowest Value –6.0
Momentum –50.6
Low vol –15.2
Value –12.8
Income –7.6
Low vol –9.3
Size –6.7
Value –12.0
Momentum –22.4
UK
Highest Low vol 127.0
Size 24.9
Size 12.4
Low vol 35.0
Size 17.0
Momentum 32.4
Momentum 42.8
Low vol 23.7
Value 20.2
Momentum
78.8 Income
1.1 Value
3.2 Income
28.3 Value 14.8
Size 15.5
Size 12.1
Momentum 20.1
Income 15.3
Income
15.7 Value –6.9
Momentum 0.7
Momentum 20.6
Momentum –1.7
Low vol 11.5
Income –1.3
Size 11.1
Size –4.9
Value –11.8
Low vol –20.1
Income –13.7
Size –4.9
Income –8.1
Income 0.0
Low vol –6.2
Income –11.2
Momentum –18.3
Lowest Size –17.5
Momentum –25.4
Low vol –22.9
Value –10.7
Low vol –15.7
Value 0.0
Value –10.0
Value –20.9
Low vol –21.2
USA 2008 2009 2010 2011 2012 2013 2014 2015 2016 2008–16
Highest Low vol
90.3 Size 28.5
Size 13.6
Low vol 40.5
Value 11.5
Size 5.3
Low vol 11.3
Momentum 42.3
Value 17.2
Low vol 6.0
Income
20.7 Value –8.0
Momentum 8.5
Income 29.5
Size 7.8
Value 4.7
Income 1.6
Low vol 13.9
Income 14.8
Size 4.0
Momentum
–2.4 Income –17.2
Income 7.1
Momentum 1.4
Momentum –0.9
Momentum 4.5
Value –2.2
Income 2.4
Size 9.6
Income 3.8
Size –4.3
Low vol –33.0
Value –4.5
Size –3.7
Low vol –1.5
Income –8.2
Momentum –5.3
Size –9.3
Low vol –1.8
Value –1.8
Lowest Value –6.0
Momentum –50.6
Low vol –15.2
Value –12.8
Income –7.6
Low vol –9.3
Size –6.7
Value –12.0
Momentum –22.4
Momentum –6.0
UK
Highest Low vol 127.0
Size 24.9
Size 12.4
Low vol 35.0
Size 17.0
Momentum 32.4
Momentum 42.8
Low vol 23.7
Value 20.2
Momentum 12.8
Momentum
78.8 Income
1.1 Value
3.2 Income
28.3 Value 14.8
Size 15.5
Size 12.1
Momentum 20.1
Income 15.3
Size 6.5
Income
15.7 Value –6.9
Momentum 0.7
Momentum 20.6
Momentum –1.7
Low vol 11.5
Income –1.3
Size 11.1
Size –4.9
Low vol 5.5
Value –11.8
Low vol –20.1
Income –13.7
Size –4.9
Income –8.1
Income 0.0
Low vol –6.2
Income –11.2
Momentum –18.3
Income 2.1
Lowest Size –17.5
Momentum –25.4
Low vol –22.9
Value –10.7
Low vol –15.7
Value 0.0
Value –10.0
Value –20.9
Low vol –21.2
Value –3.2
Differences over time and across markets; scope to diversify
Source: Elroy Dimson, Paul Marsh, and Mike Staunton, Triumph of the Optimists, Princeton University Press, 2002, and subsequent research 38
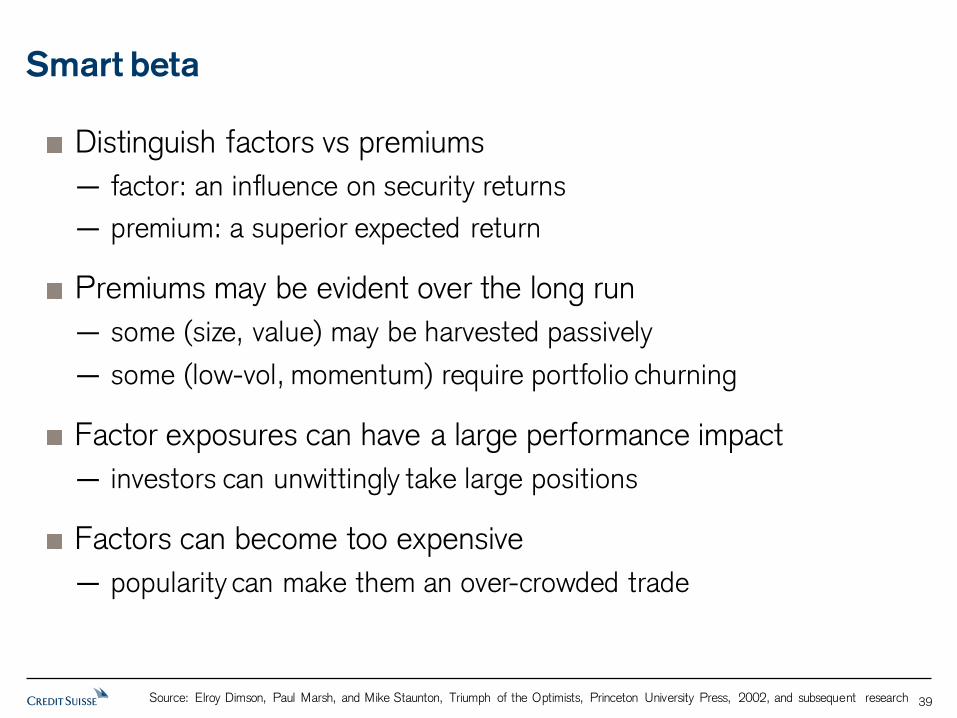
Distinguish factors vs premiums
— factor: an influence on security returns
— premium: a superior expected return
Premiums may be evident over the long run
— some (size, value) may be harvested passively
— some (low-vol, momentum) require portfolio churning
Factor exposures can have a large performance impact
— investors can unwittingly take large positions
Factors can become too expensive
— popularity can make them an over-crowded trade
Smart beta
Source: Elroy Dimson, Paul Marsh, and Mike Staunton, Triumph of the Optimists, Princeton University Press, 2002, and subsequent research 39
General disclaimer / Important information This document was produced by and the opinions expressed are those of Credit Suisse (“CS”) as of the date of writ ing and are subject to change. It has been prepared solely for information purposes and for the use of the recipient. It does not const itute an offer or an invitat ion by or on behalf of CS to any person to buy or sell any security. Nothing in this material const itutes investment, legal, accounting or tax advice, or a representat ion that any investment or strategy is suitable or appropriate to your individual circumstances, or otherwise const itutes a personal recommendation to you. The price and value of investments mentioned and any income that might accrue may fluctuate and may fall or rise. Any reference to past performance is not a guide to the future. The information and analysis contained in this document have been compiled or arrived at from sources believed to be reliable but CS does not make any representat ion as to their accuracy or completeness and does not accept liability for any loss arising from the use hereof. A Credit Suisse Group company may have acted upon the information and analysis contained in this publicat ion before being made available to clients of CS. Investments in emerging markets are speculat ive and considerably more volat ile than investments in established markets. Some of the main risks are polit ical risks, economic risks, credit risks, currency risks and market risks. Investments in foreign currencies are subject to exchange rate fluctuat ions. Any quest ions about topics raised in this piece or your investments should be made direct ly to your local relat ionship manager or other advisers. Before entering into any transact ion, you should consider the suitability of the transact ion to your part icular circumstances and independently review (with your professional advisers as necessary) the specific financial risks as well as legal, regulatory, credit, tax and accounting consequences. This document may provide the addresses of, or contain hyperlinks to, websites. Except to the extent to which the report refers to website material of CS, CS has not reviewed any such site and takes no responsibility for the content contained therein. Such address or hyperlink (including addresses or hyperlinks to CS's own website material) is provided solely for your convenience and information and the content of any such website does not in any way form part of this document. Accessing such website or following such link through this report or CS's website shall be at your own risk. This report is issued and distributed in European Union (except Switzerland): by Credit Suisse (UK) Limited and Credit Suisse Securit ies (Europe) Limited. Credit Suisse Securit ies (Europe) Limited and Credit Suisse (UK) Limited, both authorized by the Prudential Regulat ion Authority and regulated by the Financial Conduct Authority and the Prudential Regulat ion Authority, are associated but independent legal entit ies within Credit Suisse; Germany: Credit Suisse Securit ies (Europe) Limited Niederlassung Frankfurt am Main regulated by the Bundesanstalt fuer Finanzdienst leistungsaufsicht ("BaFin"); United States and Canada: Credit Suisse Securit ies (USA) LLC; Switzerland: Credit Suisse AG authorized and regulated by the Swiss Financial Market Supervisory Authority (FINMA); Brazil: Banco de Invest imentos Credit Suisse (Brasil) S.A or its affiliates; Mexico: Banco Credit Suisse (México), S.A. (transact ions related to the securit ies mentioned in this report will only be effected in compliance with applicable regulat ion); Japan: by Credit Suisse Securit ies (Japan) Limited, Financial Instruments Firm, Director-General of Kanto Local Finance Bureau ( Kinsho) No. 66, a member of Japan Securit ies Dealers Associat ion, The Financial Futures Associat ion of Japan, Japan Investment Advisers Associat ion, Type II Financial Instruments Firms Associat ion; Hong Kong: Credit Suisse (Hong Kong) Limited; Australia: Credit Suisse Equit ies (Australia) Limited; Thailand: Credit Suisse Securit ies (Thailand) Limited, regulated by the Office of the Securit ies and Exchange Commission, Thailand, having registered address at 990 Abdulrahim Place, 27th Floor, Unit 2701, Rama IV Road, Silom, Bangrak, Bangkok10500, Thailand, Tel. +66 2614 6000; Malaysia: Credit Suisse Securit ies (Malaysia) Sdn Bhd, Credit Suisse AG, Singapore Branch; India: Credit Suisse Securit ies (India) Private Limited (CIN no.U67120MH1996PTC104392) regulated by the Securit ies and Exchange Board of India as Research Analyst (registrat ion no. INH 000001030) and as Stock Broker (registrat ion no. INB230970637; INF230970637; INB010970631; INF010970631), having registered address at 9th Floor, Ceejay House, Dr.A.B. Road, Worli, Mumbai - 18, India, T- +91-22 6777 3777; South Korea: Credit Suisse Securit ies (Europe) Limited, Seoul Branch; Taiwan: Credit Suisse AG Taipei Securit ies Branch; Indonesia: PT Credit Suisse Securit ies Indonesia; Philippines: Credit Suisse Securit ies (Philippines ) Inc., and elsewhere in the world by the relevant authorized affiliate of the above. Additional Regional Disclaimers Hong Kong: Credit Suisse (Hong Kong) Limited ("CSHK") is licensed and regulated by the Securit ies and Futures Commission of Hong Kong under the laws of Hong Kong, which differ from Australian laws. CSHKL does not hold an Australian financial services license (AFSL) and is exempt from the requirement to hold an AFSL under the Corporat ions Act 2001 (the Act) under Class Order 03/1103 published by the ASIC in respect of financial services provided to Australian wholesale clients (within the meaning of sect ion 761G of the Act). Research on Taiwanese securit ies produced by Credit Suisse AG, Taipei Securit ies Branch has been prepared by a registered Senior Business Person. Malaysia: Research provided to residents of Malaysia is authorized by the Head of Research for Credit Suisse Securit ies (Malaysia) Sdn Bhd, to whom they should direct any queries on +603 2723 2020. Singapore: This report has been prepared and issued for distribut ion in Singapore to inst itut ional investors, accredited investors and expert investors (each as defined under the Financial Advisers Regulat ions) only, and is also distributed by Credit Suisse AG, Singapore branch to overseas investors (as defined under the Financial Advisers Regulat ions). By virtue of your status as an inst itut ional investor, accredited investor, expert investor or overseas investor, Credit Suisse AG, Singapore branch is exempted from complying with certain compliance requirements under the Financial Advisers Act, Chapter 110 of Singapore (the "FAA"), the Financial Advisers Regulat ions and the relevant Notices and Guidelines issued thereunder, in respect of any financial advisory service which Credit Suisse AG, Singapore branch may provide to you. UAE: This information is being distributed by Credit Suisse AG (DIFC Branch), duly licensed and regulated by the Dubai Financial Services Authority (“DFSA”). Related financial services or products are only made available to Professional Clients or Market Counterpart ies, as defined by the DFSA, and are not intended for any other persons. Credit Suisse AG (DIFC Branch) is located on Level 9 East, The Gate Building, DIFC, Dubai, United Arab Emirates. UK: The protect ions made available by the Financial Conduct Authority and/or the Prudential Regulat ion Authority for retail clients do not apply to investments or services provided by a person outside the UK, nor will the Financial Services Compensat ion Scheme be available if the issuer of the investment fails to meet its obligat ions. To the extent communicated in the United Kingdom (“UK”) or capable of having an effect in the UK, this document const itutes a financial promotion which has been approved by Credit Suisse (UK) Limited which is authorized by the Prudential Regulat ion Authority and regulated by the Financial Conduct Authority and the Prudential Regulat ion Authority for the conduct of investment business in the UK. The registered address of Credit Suisse (UK) Limited is Five Cabot Square, London, E14 4QR. Please note that the rules under the UK’s Financial Services and Markets Act 2000 relat ing to the protect ion of retail clients will not be applicable to you and t hat any potent ial compensation made available to “eligible claimants” under the UK’s Financial Services Compensat ion Scheme will also not be available to you. Tax treatment depends on the individual circumstances of each client and may be subject to changes in future EU: This report has been produced by subsidiaries and affiliates of Credit Suisse operat ing under its Global Markets Division and/or Internat ional Wealth Management Division. This document may not be reproduced either in whole, or in part, without the written permission of the authors and Credit Suisse. © 2017 Credit Suisse Group AG and/or its affiliates. All rights reserved
Global Disclaimer / Important Information
40