Embed Size (px)
Citation preview
Credit Suisse Healthcare Conference
Phoenix, ArizonaNovember 14, 2007

Jeff Campbell
Executive Vice President & Chief Financial Officer

Some of the information in this presentation may constitute forward-looking statements that are subject to various uncertainties. These uncertainties could cause actual results to differ materially from those projected or implied. The risk factors associated with those uncertainties are described in the Company’s reports and exhibits filed with the Securities and Exchange Commission. Financial information is presented here in summary form. Full details areprovided in the Company’s most recent Annual Report on Form 10-K. All of this information is available at www.mckesson.com. The Company assumes no obligation to update or revise any such statements, whether as a result of new information or otherwise.
Safe Harbor Clause

How McKesson Helps Transform Healthcare
Ensuring the safe and timely delivery of vital medications and supplies using our distribution system, scale and supply chain excellence
Improving health outcomes and patient safety by developing processes and technologies to optimize care and reduce errors
Making healthcare more convenient, personal and effective for patients
Smoothing information and revenue flows by streamlining interactions between clinicians, payors and patients
Ensuring that healthcare dollars are well spent

McKesson DistributionSolutions
#1 in pharmaceutical distribution in U.S., Canada,
and Mexico
#1 generics distributor
Large Rx repackaging
Specialty distribution & patient services for manufacturers
Comprehensive retail information systems and
automation offerings
#1 in medical-surgical distribution to primary and
extended care
Leading Market Positions
McKesson Technology Solutions
50% of all U.S. Hospitals, 77% of those >200 beds
Leader in clinical, revenue cycle, and resource management
solutions
#1 hospital automation
19 Products in KLAS Top 3 for their categories*
Leading businesses in U.K. and France
#1 in medical management software and services for Payors
#1 in disease management for Medicaid agencies
* Based on McKesson calculation. Source: KLAS 2007 Mid-Year Top 20 Year Report; www.healthcomputing.com; © 2007 KLAS Enterprises, LLC. All rights reserved.
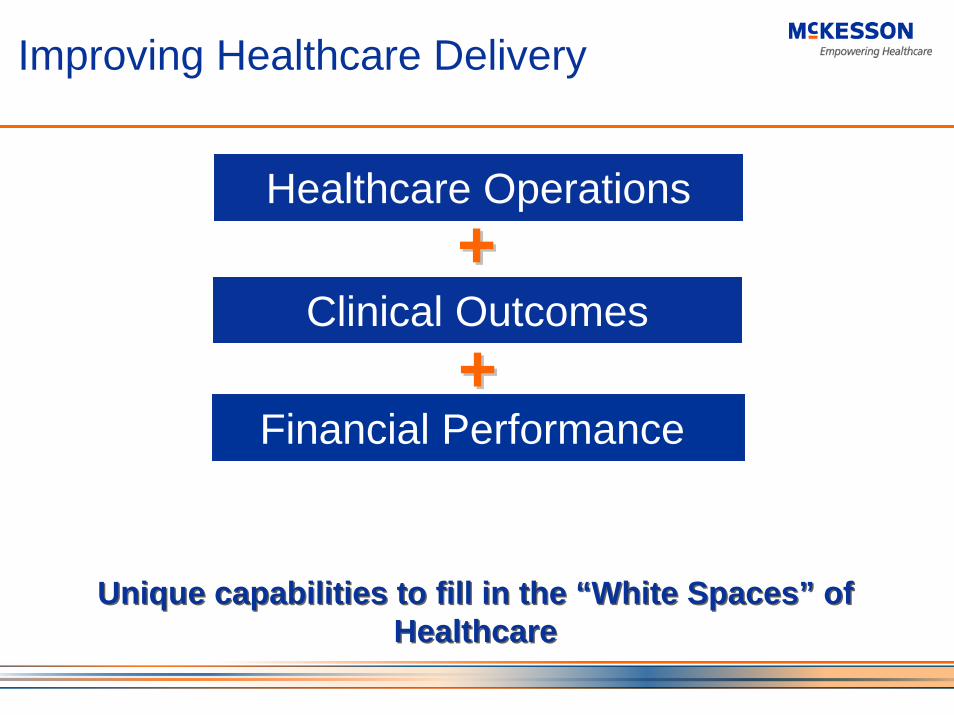
Improving Healthcare Delivery
Healthcare Operations
Clinical Outcomes
Financial Performance
Unique capabilities to fill in the “White Spaces” of Healthcare
Unique capabilities to fill in the “White Spaces” of Healthcare
++
++

Meeting Our Customers’ Needs By Making the Linkages Across McKesson
Payor
Patient
Hospital
Doctor’s Office
Government
PharmacyAll Software
Robots
Diagnostic Monitors
Outsourcing Services
Software
Biotech
Medical Supplies
Software
PharmaceuticalPharmaceuticals
Medical Supplies
Biotech Drugs
Pharmaceuticals
Robots
Software
Sunmark OTC
Care Mgmt Services
Relay Health
Health Mart
Patient Portal
Robots
Software

Creating Customers for Life –One McKesson
Working together with our customers to use the clinical knowledge, process expertise, technology and the resources of a Fortune 18
company to change the future of healthcare for the better.
Create long-termrelationships based on custom solutions
that deliverROI & quality
Sell McKesson’s comprehensive
offering
Introduce innovations that address emerging
healthcarechallenges

Long-term Relationships with Global Healthcare Leaders
Vanderbilt University Medical CenterVanderbilt University Medical Center

Seven Years of Strong Revenue Growth
$93.0$87.0
$36.7$42.0
$48.5$55.7
$68.0
$79.1
FY00* FY01* FY02 FY03 FY04 FY05 FY06 FY07
14% CAGR
$ Billions
* Revenues for FY00 and FY01 not adjusted for discontinued operations occurring after FY05.

Revenue Growth Leveraged into Higher EPS (from continuing operations)*
$0.65
($0.15)
$1.35
$1.82$2.10 $2.13
$2.46
$2.89
FY00 FY01 FY02 FY03 FY04 FY05 FY06 FY07
24% CAGR
* EPS from continuing operations, excluding securities litigation charges/(credits). EPS for FY00 and FY01 not adjusted for discontinued operations occurring after FY05.

Fiscal Year 2008 First Half Financial Results
YTD FY08 YTD FY07 ChgRevenuesDistribution Solutions 47,536$ 44,685$ 6%Technology Solutions 1,442 1,016 42%
48,978$ 45,701$ 7%
Operating ProfitDistribution Solutions 706$ 641$ 10%Technology Solutions 166 88 89%
872$ 729$ 20%
Income* 480$ 384$ 25%
Diluted EPS* 1.59$ 1.25$ 27%
($ in Millions except EPS)
* Income and diluted EPS from Continuing Operations excluding the Securities Litigation credit

Market-leading Momentum in Distribution Solutions
Strong relationships with branded pharmaceutical manufacturers and increased visibility to compensation
In addition to branded pharmaceuticals, focus on higher-margin products and services in both pharmaceutical and medical surgical distribution
Significant growth in generics franchise
Six Sigma and information technology drive quality improvements and operating efficiency
Expanding footprint in North America

McKesson is the Preferred Choice Among Customers
Health Mart Named “Pharmacy Chain of the Year”by Drug Topics Magazine
Wal-Mart “Supplier of the Year” for 2 of the last 4 years
Target Strategic Partner since 2006
Premier’s # 1 Quality Wholesaler
Ranked #1 of Top 20 Drug Retailers/Wholesalers in May/June 2007 edition of Private Label
“Overall Supplier of the Year”“Supplier of the Year for Pharmacy”

Market-leading Momentum in Technology Solutions
Highly-rated customer support & service, product innovation
Value propositions in Patient Safety and Imaging have driven sales beyond installed base of customers
Growing service businesses expands base of recurrent revenue
Emerging opportunities in physician and consumer-directed healthcare
Growing payor software product offering and expanding disease management market
Unique opportunity in connectivity

McKesson Technology Solutions --Product Quality Leadership
2007 Midyear Report 2007 Midyear Report –– 9 Category Leaders9 Category Leaders– Pathways Materials and Financials
Management G– Horizon Laboratory G– Horizon Cardiology RD
– Pathways Compliance Advisor OG
– Horizon Expert Orders andHorizon Expert Documentation G
– Horizon Performance Manager G– Ansos One-Staff OG
– AcuDose-Rx OG
– EC2000 Claims Administrator OG
2007 Midyear Report 2007 Midyear Report –– 19 Ranked in Top Three19 Ranked in Top Three– Horizon Meds Manager G– Physician Portal OG
– Horizon Passport OG
– Pathways Contract Management OG
– Horizon Practice Plus 26-100 & 100+
Market Segment Abbreviations: G – General; C – Community; OG – Other General; SH – Specialty Hospice; R – Reporting & Documentation; 26-100 – Number of Physicians; OM – Other Medical Equipment
Source: KLAS 2007 Mid-Year Top 20 Year Report; www.healthcomputing.com; © 2007 KLAS Enterprises, LLC. All rights reserved.
– Paragon C– Horizon Medical Imaging C– Paragon Clinicals and Financials C– Horizon Homecare SH
– Robot-RXOM

Today’s Patient Experience

Patient
HospitalHospitalHospital Physician OfficePhysician OfficePhysician Office PayorPayorPayor PharmacyPharmacyPharmacy
McKesson Leadership Strategy –Tomorrow’s Patient Experience
Connectivity by RelayHealthConnectivity by RelayHealthConnectivity by RelayHealth

Strong Balance Sheet …
25.0%22.3%
18.7%
14.4%
23.8%
FY03 FY04 FY05 FY06 FY07
Gross Debt-to-Capital Ratio

…With Significant Financial Flexibility to Create Further Value
Cash
$1+ BReq’dOps
Debt Capacity
Op Cash Flow
24%
Target30-40%
$1+ BSignificant Capital for
Future Deployment
$1.0B

Portfolio Approach to Capital Deployment
Increased financial flexibility to continue to execute our strategy
Increased financial flexibility to continue to Increased financial flexibility to continue to execute our strategy execute our strategy
Acquisitions
Synergistic opportunities
Accretive/Value add in line with long term strategy
Measured share repurchase over time
Internal investment
Dividend policy periodically reviewed
Factors Driving Sustained Value Creation at McKesson
Unique value proposition in growing healthcare services markets
Strong and expanding global businesses:Solid operating profit from distribution segmentUpside opportunities from higher growth, higher margin technology segment
Track record of improving financial performance and balanced capital deployment
Experienced and deep management team with strategic vision
Commitment to shareholder-focused corporate governance practices
Sustained Value CreationSustained Value CreationSustained Value Creation

Credit Suisse Healthcare Conference
Phoenix, ArizonaNovember 14, 2007

Diluted EPS Reconciliation
($ and shares in millions, except EPS)YTD FY07 YTD FY08
$ 483 $ 471
Exclude: Securities Litigation credit, net (5) (6) Income taxes on credit, net 2 2
Income tax reserve reversals (83) (3) (87)
excluding the Securities Litigation credit, net $ 480 $ 384
$ 1.59 $ 1.25
302 307
Income from continuing operations - as reported
Diluted earnings per common share from continuing operations, excluding the Securities Litigation credit, net
Shares on which diluted earnings per common share were based
Income from continuing operations