Embed Size (px)
Citation preview
CREDIT SUISSE GROUP AGParadeplatz 8P.O. BoxCH-8070 ZurichSwitzerland
Telephone +41 844 33 88 44Fax +41 44 333 88 [email protected]
February 14, 2017
Media Release
Credit Suisse Group announces 4Q16 and FY16 results
Strong asset inflows in 2016 with increased margins, highlighting the strength, diversification and scale of the Wealth Management platform. NNA of CHF 28.5 billion1 in 2016, with record AuM up 8% to CHF 734 billion1
IBCM delivers best fourth quarter revenue performance since 2012. Significant increase in transaction activity maintained across ECM and DCM in January 2017
Rightsizing of GM substantially completed with good momentum in 4Q16 and a strong start to the year in January 2017. GM franchise well positioned to capture future upside
Look-through CET1 ratio of 11.6% post-DOJ RMBS settlement (12.5%2 pre-settlement), an improvement of 140 bps compared to 3Q15 CET1 ratio of 10.2% reported at announcement of our new strategy in October 2015
Look-through CET1 leverage ratio of 3.3% post-DOJ RMBS settlement (3.5%3 pre-settlement), an improvement of 50 bps compared to 3Q15 CET1 leverage ratio of 2.8% reported at announcement of our new strategy in October 2015
Key business highlights
• 4Q16 reported PTL of CHF 1,903 million; FY16 reported PTL of CHF 1,966 million • 4Q16 adjusted* PTI of CHF 171 million; FY16 adjusted* PTI of CHF 615 million • 4Q16 and FY16 net loss attributable to shareholders of CHF 2,347 million and CHF 2,438 million, respectively• FY16 net cost savings of CHF 1.9 billion4, resulting in adjusted* total operating expenses of CHF 19.4 billion
measured at constant FX rates, or CHF 19.1 billion at actual FX rates; exceeded end-2016 target of below CHF 19.8 billion
• Substantial progress in reducing legacy assets within SRU, with RWA and leverage exposure both down 39%, in US dollars, at end-2016 compared to end-2015
Media ReleaseFebruary 14, 2017
Page 2
Continued progress in core franchises
• Strong NNA of CHF 28.5 billion1, up 58% compared to FY15 at higher adjusted* gross margin of 114 bp, demonstrating the scale and diversification of our Wealth Management franchise. Record FY16 Wealth Management AuM of CHF 734 billion1, up 8% compared to FY15
• FY16 NNA comprised CHF 14.3 billion of assets from Emerging Europe, the Middle East and Africa (13% growth rate), CHF 14.6 billion from the APAC region (10% growth rate), including positive inflows of CHF 0.7 billion in 4Q16, and CHF 4.2 billion from Europe, including International Private Clients (4% growth rate). NNA in Switzerland and in Latin America were negative in 4Q16. This was primarily due to the proactive measures we took to reduce the number of EAMs we work with in Switzerland, and was also driven by outflows from regularization both in Latin America and Switzerland
• Our Wealth Management focused divisions of SUB, IWM and APAC have made good progress. Compared to FY15, adjusted* PTI in SUB rose 9% (excluding Swisscard5) and adjusted* PTI in IWM rose 9% in FY16. In APAC Wealth Management and connected activities6 pro-forma PTI increased 65% in FY16
• Strong IBCM performance; FY16 net revenues in US dollars up 8% year on year, with higher market share across key products7. 4Q16 adjusted* net revenues of USD 569 million represent our strongest fourth quarter since 2012; FY16 IBCM adjusted* PTI in US dollars increased 219% compared to FY15
• Rightsizing of GM substantially completed with FY16 adjusted* PTI of USD 284 million in a year of significant restructuring. Improved operating leverage with FY16 revenues of USD 5,575 million
Tidjane Thiam, Chief Executive Officer of Credit Suisse, stated: “2016 was the first full year of implementing our new strategy and it was a challenging and busy 12 months. Thanks to our strong client franchise and the dedication of our teams, we have made good progress on our key objectives.”
“We have significantly reduced our fixed operating cost base and increased our operating leverage. We have generated industry-leading net inflows at higher margins. We have achieved meaningful successes in advisory and underwriting, with strong increases in both market share and profitability.7 We have substantially completed the rightsizing of GM and the division was profitable for FY16, with good momentum in 4Q16.”
“We have reached an agreement with the US Department of Justice on the RMBS matter, thus removing a major source of uncertainty for our future.”
“We have significantly strengthened the Group’s capital ratio, increasing the look-through CET1 ratio by 140 bps8 to 11.6% post-DOJ RMBS settlement compared to the ratio reported when we announced our new strategy in October 2015. Our look-through CET1 ratio pre-settlement would have been 12.5%2.”
“Our teams have worked hard and made good progress during a challenging year: they achieved a positive finish to the year. Many of the positive trends that we observed in 4Q16 have continued into January 2017. We believe we are well positioned to continue to make progress with our restructuring program in 2017 and 2018, and to capture profitable growth opportunities across our franchises and geographies.”
“With global geopolitical uncertainty increasing, we believe that our Swiss heritage and identity will be an asset as we work hard to provide performance, stability and safety for our clients around the world.”
Media ReleaseFebruary 14, 2017
Page 3
Changes to the Board of Directors
The Board of Directors of Credit Suisse Group AG is proposing Alexandre Zeller, as previously announced, and Andreas Gottschling for election as new non-executive Board members at the Annual General Meeting on April 28, 2017. Noreen Doyle and Jean Lanier, upon reaching the respective tenure limits, and Jassim Bin Hamad J.J. Al Thani will not stand for re-election. Chairman Urs Rohner and the other members of the Board of Directors are standing for re-election for a term of office of one year.
Regarding the nominations of Alexandre Zeller and Andreas Gottschling, Urs Rohner, Chairman of the Board of Directors of Credit Suisse Group, said: “Alexandre Zeller has an excellent track record in the financial services industry and a wealth of experience, particularly in our important Swiss home market. Andreas Gottschling has longstanding international experience, proven leadership skills and profound knowledge in risk management and regulatory capital issues. Alexandre Zeller and Andreas Gottschling both bring an enormous wealth of expertise to complement the Board of Directors in their respective areas.”
Urs Rohner commented as follows on Noreen Doyle, Jean Lanier and Jassim Al Thani stepping down from the Board of Directors: “Upon reaching the respective tenure limits, Noreen Doyle and Jean Lanier will not stand for re-election, nor will Jassim Al Thani, who steps down after seven years on the Board. Credit Suisse is very grateful to Noreen Doyle, Jean Lanier and Jassim Al Thani for their personal contributions to the bank. It was a huge privilege for us to work with them on the Board of Directors during a crucial period for Credit Suisse. I am very happy that Noreen Doyle will continue to serve as Chair of Credit Suisse International and Credit Suisse Securities (Europe) Limited, our UK subsidiaries, and I wish all of them the very best in their future endeavors.”
Dividend
The Board of Directors will propose to shareholders at the Annual General Meeting on April 28, 2017, a distri-bution of CHF 0.70 per share out of reserves from capital contributions for the financial year 2016. The distribution will be free of Swiss withholding tax and will not be subject to income tax for Swiss resident individuals holding the shares as a private investment. The distribution will be payable in cash or, subject to any legal restrictions applicable in shareholders’ home jurisdictions, in new shares of Credit Suisse Group at the option of the shareholder.
Media ReleaseFebruary 14, 2017
Page 4
Information for mediaMedia Relations, Credit Suisse Tel: +41 844 33 88 44 e-mail: [email protected]
Information for investorsInvestor Relations, Credit Suisse Tel: +41 44 333 71 49 e-mail: [email protected]
The complete 4Q16 earnings release and results presentation slides are available for download from 07:00 CET today at: https://www.credit-suisse.com/results
Presentation of 4Q16 and FY16 results – Tuesday, February 14, 2017
Event Analyst Call Media conference
Time 08:15 Zurich 10:00 Zurich
07:15 London 09:00 London
02:15 New York 04:00 New York
Speakers Tidjane Thiam, Chief Executive Officer Tidjane Thiam, Chief Executive Officer
David Mathers, Chief Financial Officer David Mathers, Chief Financial Officer
Language The presentation will be held in English. The presentation will be held in English.
Simultaneous interpreting in German will be available.
Access via +41 44 580 40 01 (Switzerland) +41 44 580 40 01 (Switzerland)
Telephone +44 1452 565 510 (Europe) +44 1452 565 510 (Europe)
+1 866 389 9771 (US) +1 866 389 9771 (US)
Reference: Credit Suisse Group quarterly results Reference: Credit Suisse Group Media Call
Please dial in 10 minutes before the start Please dial in 10 minutes before the start
of the presentation. of the presentation.
Q&A Session Opportunity to ask questions via the Opportunity to ask questions via the
telephone conference. telephone conference.
Playback Replay available approximately one hour Replay available approximately two hours
after the event: after the event:
+41 44 580 34 56 (Switzerland) +41 44 580 34 56 (Switzerland)
+44 1452 550 000 (Europe) +44 1452 550 000 (Europe)
+1 866 247 4222 (US) +1 866 247 4222 (US)
Conference ID: 56583629# Conference ID English: 56619547#
Conference ID German: 56653449#
The results of Credit Suisse Group comprise the results of our six reporting segments, including the Strategic Resolution Unit, and the Corporate Cen-ter. Core results exclude revenues and expenses from our Strategic Resolution Unit.
As we move ahead with the implementation of our strategy, it is important to measure the progress achieved by our underlying business performance in a consistent manner. To achieve this, we will focus our analyses on adjusted results.
Adjusted results referred to in this release are non-GAAP financial measures that exclude goodwill impairment and certain other revenues and expenses included in our reported results. Management believes that adjusted results provide a useful presentation of our operating results for the purposes of assessing our Group and divisional performance consistently over time, on a basis that excludes items that management does not consider representa-tive of our underlying performance. We will report quarterly on the same adjusted* basis for the Group, Core and divisional results until end-2018 to allow investors to monitor our progress in implementing our strategy, given the material restructuring charges we are likely to incur and other items which are not reflective of our underlying performance but are to be borne in the interim period. Tables in the appendix of this Media Release provide the detailed reconciliation between reported and adjusted results for the Group, Core businesses and the individual divisions.
Media ReleaseFebruary 14, 2017
Page 5
Overview of Group Performance and OutlookMaterial increase in operating leverage
In the first year of our three-year strategic plan, we significantly reduced our adjusted* fixed cost base with CHF 1.9 billion4 of net savings, exceeding our 2016 expense reduction target of CHF 1.4 billion. Our adjusted* total operating cost base has been reduced to CHF 19.4 billion measured at constant FX rates or CHF 19.1 billion measured at actual FX rates, placing us on track to deliver against our end-2018 target adjusted* operating cost base of below CHF 17 billion. Our focus on driving down costs, while maintaining investment in growth businesses and improving our control framework, has created positive operating leverage for our business going forward.
Profitable growth in Wealth Management
We have significantly strengthened our asset gathering capabilities and delivered profitable growth across our Wealth Management businesses. Net asset inflows increased 58% to CHF 28.5 billion1 in 2016 at improved margins. These results are largely the product of our focus on UHNWI and entrepreneur clients. AuM increased by CHF 53 billion in 2016, with balanced progress between mature markets and emerging markets. In 4Q16, we generated strong inflows of assets in the Middle East and Eastern Europe and Western Europe as well as in Asia Pacific. As a result of our continuing regularization efforts, we recorded 4Q16 outflows, mainly in Latin America and in Switzerland. We have also implemented selected exits among our EAMs in Switzerland, leading to outflows in addition to the usual end-of-year outflows in that market.
Strength in advisory and origination
IBCM delivered a strong performance, reflecting the quality of our advisory platform. FY16 net revenues in US dollars were up 8% year on year, with the Americas up 15% over that period, while the Street was down 7% and 3%7, respectively. Advisory revenues were up 11% year on year, significantly outperforming the Street7, which saw revenues decline 4%. Our teams advised on 6 of the 10 largest announced M&A transactions during the year.9
In 4Q16, IBCM delivered adjusted* PTI of USD 142 million and net revenues of USD 569 million, representing our strongest fourth quarter since 2012 and outperforming the Street7 in all of our key product areas. IBCM’s adjusted* return on regulatory capital10 for 4Q16 was 22%.
Benefits from GM restructuring starting to emerge
In a year of significant restructuring, GM remained profitable with adjusted* PTI of USD 284 million in FY16. In 4Q16, GM revenues were higher than in 4Q15, despite a 20% reduction in RWA in US dollars. With an annualized11 adjusted* cost base of less than USD 5.2 billion12 for 2016, we remain on track to reach our adjusted* target of less than USD 4.8 billion in costs and to generate an adjusted* return on regulatory capital10 of 10-15% by end-2018.
Our franchise in the Americas delivered an improved performance in 4Q16, underscoring the potential of our platform to capture future upside. The Credit franchise showed strong momentum with a 66% increase in net revenues in US dollars in 4Q16 compared to 4Q15. Our Cash Equities and Prime Services businesses in the Americas remained resilient, offset by continued muted client activity in EMEA, while revenues in Solutions were impacted by low levels of volatility in equity derivatives.
Media ReleaseFebruary 14, 2017
Page 6
We believe we are well positioned to benefit from further collaboration opportunities across the bank and our improved operating leverage.
Continued progress in the SRU
Over the past 12 months, the SRU has made significant progress in disposing of legacy positions and de-risking, with RWA and leverage exposure down by USD 29 billion (39%) and USD 67 billion (39%), respectively. In FY16, adjusted* total operating expenses decreased by USD 1,093 million compared to FY15.
Resolution of key legal issue
In January 2017, we announced that we had reached a final settlement with the DOJ related to our legacy RMBS business – a business conducted through 2007. It was a key strategic objective to put this matter behind us. In 4Q16, we recorded a provision of approximately USD 2 billion in addition to our existing provisions of USD 550 million in connection with this matter, which were recorded in prior periods.
Strengthening our capital position
As of December 31, 2016, we reported a look-through CET1 ratio of 11.6%, up 140 bps compared to the 3Q15 CET1 ratio of 10.2% reported when we announced our new strategy in October 2015. Without taking into account the impact of the settlement with the DOJ regarding our legacy RMBS business, we would have reached our highest-ever look-through CET 1 ratio of 12.5%2. The RMBS settlement removed a major source of uncertainty for the bank.
Current trading and outlook
In January 2017, we have seen positive inflows across each of our Wealth Management businesses. In GM, the momentum from 4Q16 has continued into January with continued client activity levels across capital markets and trading, particularly in our Credit and Securitized Products businesses with revenues for the month up over 100% compared to January 2016, somewhat offset by lower trading volumes and volatility levels in equities. In IBCM, we have seen a busy calendar of transaction pricing across both ECM and DCM, with IBCM net revenues for the month of January up 90% compared to January 2016.
We believe we are well positioned to seize opportunities to grow our business profitability. We have delivered against a number of our key strategic objectives and remain focused on executing with discipline. We believe that we will create significant value for our shareholders over time.
Media ReleaseFebruary 14, 2017
Page 7
Divisional summarySwiss Universal Bank (SUB)
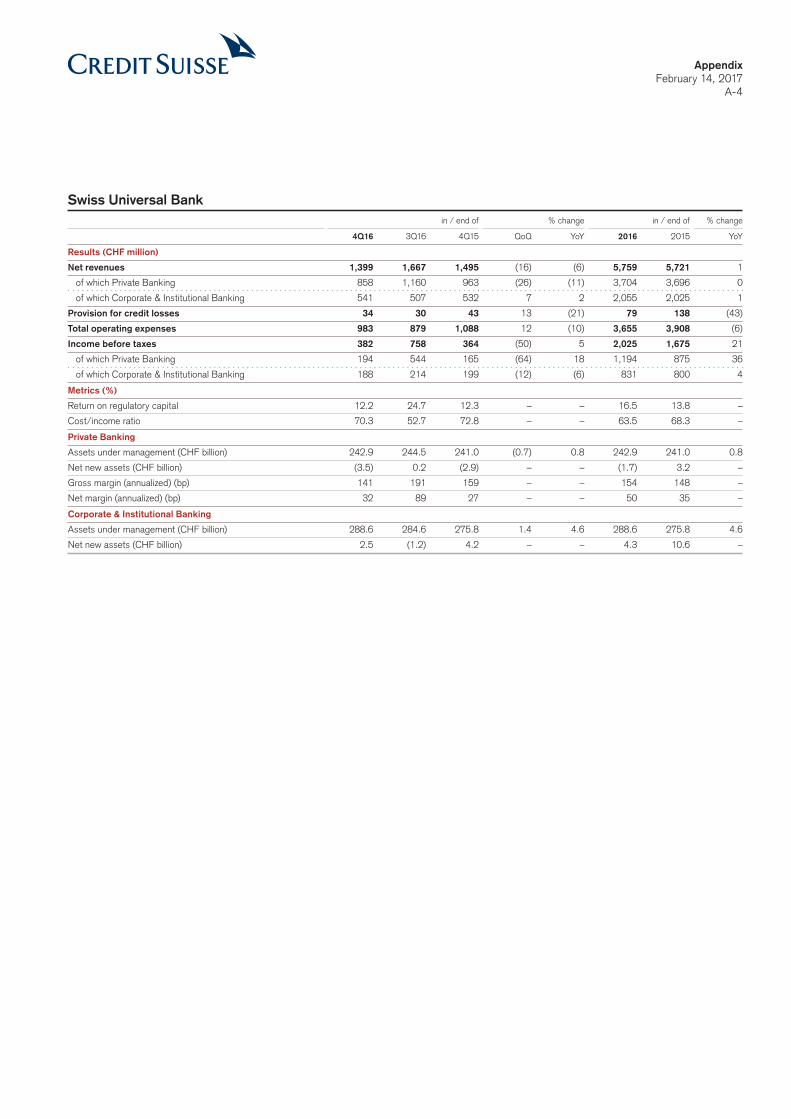
In 4Q16, SUB delivered year-on-year growth in adjusted* PTI for the fourth consecutive quarter – a good performance in a challenging Swiss market with negative interest rates. Adjusted* PTI of CHF 378 million increased 13% compared to 4Q15. Net revenues reflected stable NII and recurring commissions and fees, partially offset by lower transaction-based revenues compared to 4Q15, which included an extraordinary dividend from our ownership in SIX Group. Efficiency measures allowed us to generate savings and mitigate the costs of investing in regulatory, compliance and digitalization initiatives across the division. Adjusted* total operating expenses (excluding Swisscard5) decreased 4% compared to FY15. Credit provisions decreased by CHF 9 million and CHF 59 million compared to 4Q15 and FY15, respectively, reflecting the quality of our loan portfolio, an important characteristic of SUB. Adjusted* PTI (excluding Swisscard5) totaled CHF 1,738 million in FY16, up 9% from FY15. Adjusted* return on regulatory capital10 was 14% for FY16.
Credit Suisse (Schweiz) AG successfully started operations in November 2016, marking the delivery of a major project and the delivery of a central commitment to our regulator FINMA. Our preparations are on track for the planned partial IPO of Credit Suisse (Schweiz) AG13 in the second half of 2017, market conditions permitting and subject to the approval of the Board of Directors.
In Wealth Management, mandates penetration increased to 30% in 4Q16, an increase of 4 percentage points compared to 4Q15, driven by Credit Suisse Invest. Net asset outflows of CHF 3.5 billion in 4Q16 compared to outflows of CHF 2.9 billion in 4Q15, partly reflecting proactive measures to continuously improve our EAM network, leading to selected EAM exits. We also continued our efforts related to regularization. For FY16, asset inflows were CHF 2.1 billion, offset by further outflows from selected EAM exits and regularization of CHF 3.8 billion. AuM remained solid at CHF 242.9 billion, up 1% compared to FY15.
Our market-leading Corporate & Institutional Banking business delivered a strong quarter and a strong year. We retained our number one position in terms of announced M&A transactions14 and DCM15 deals in 2016. Total AuM in Corporate & Institutional Banking were CHF 288.6 billion, up 5% versus FY15. Our pipeline of business is strong and includes our advisory role in Johnson & Johnson’s announced USD 30 billion acquisition of the Swiss biotech firm Actelion Pharmaceuticals Ltd. Euromoney named us the ‘Best Investment Bank in Switzerland 2016’16 and International Financing Review the ‘Swiss Franc Bond House of the Year’17.
International Wealth Management (IWM)
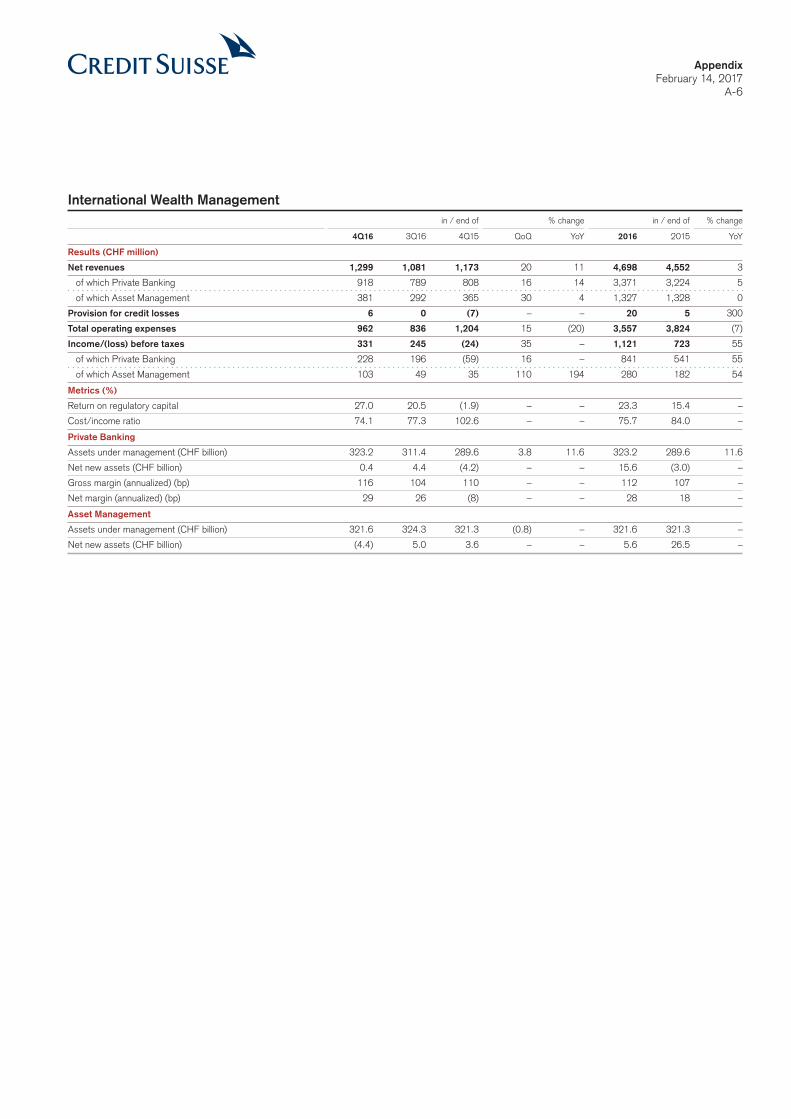
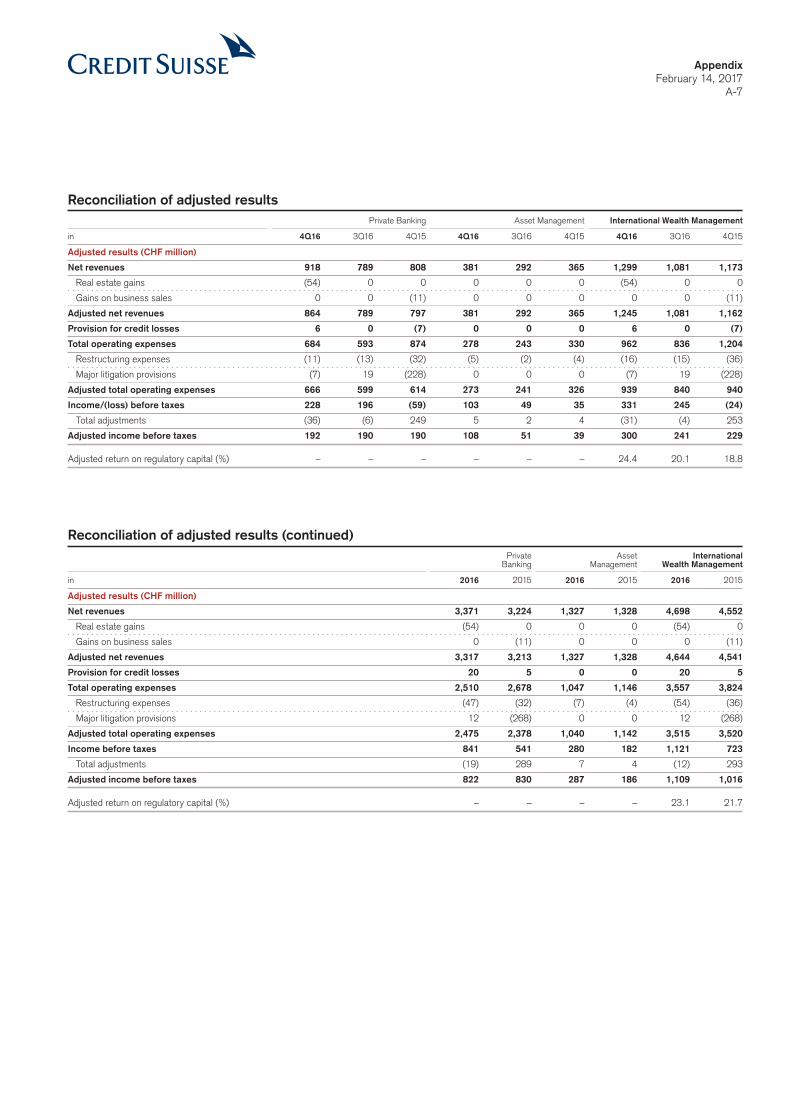
IWM delivered a strong performance with 9% growth in adjusted* PTI to CHF 1,109 million in FY16, an increase in net revenues and record NNA in Wealth Management. IWM showed good momentum during the year and had a strong finish with 4Q16 adjusted* PTI of CHF 300 million. This 31% increase reflected higher NII, improved client activity and higher performance revenues compared to 4Q15. FY16 adjusted* total operating expenses remained stable, reflecting IWM’s success in self-funding investments in growth and in compliance and risk functions as a result of disciplined cost management. Adjusted* return on regulatory capital10 for the division improved to 23% for FY16.
In Wealth Management, we delivered a strong performance in 4Q16 with adjusted* net revenues of CHF 864 million, an increase of 8% compared to 4Q15. Adjusted* net revenues increased by CHF 104 million or 3% in 2016, with higher NII and, in 4Q16, higher client activity. AuM increased 12% to CHF 323.2 billion in FY16 with NNA of CHF 15.6 billion across emerging markets and Europe at a growth rate of 5%, or 7% before regularization outflows of CHF 5.7 billion, as a result of our proactive stance. Wealth Management was able to grow both AuM and the adjusted* gross margin, which improved by 3 bps to 110 bps in FY16. Adjusted* PTI was stable in 4Q16 and FY16, with higher expenses, mainly due to investments, offsetting higher revenues. Adjusted* PTI was up 15% compared to 4Q15 excluding an extraordinary dividend from SIX Group in 4Q15.
Media ReleaseFebruary 14, 2017
Page 8
Asset Management reported strong adjusted* PTI of CHF 108 million and CHF 287 million in 4Q16 and FY16, up 177% and 54% compared to 4Q15 and FY15, respectively. Adjusted* total operating expenses decreased 9% in FY16, reflecting solid cost control during the year, while performance and placement revenues rose 27% and management fees increased 2%. NNA totaled CHF 5.6 billion in FY16, with net asset outflows in 4Q16, primarily reflecting emerging market money market outflows of CHF 3.5 billion.
Asia Pacific (APAC)
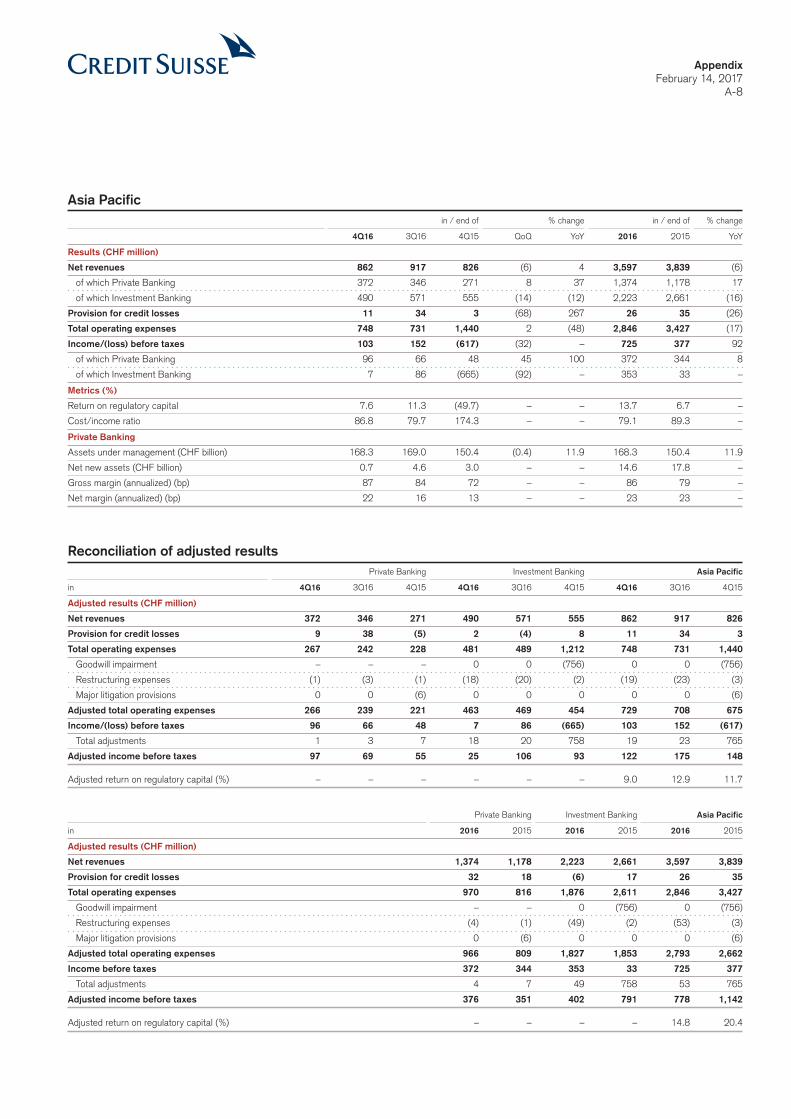
APAC delivered a strong performance in Wealth Management and connected activities6 in FY16 with pro-forma PTI of CHF 513 million, an increase of 65% year on year, and pro-forma return on regulatory capital10 of 23% in 2016.
We have an integrated approach to serving our clientele with our APAC Wealth Management business, our APAC underwriting and advisory business and our APAC Financing Group, all working closely together. We believe this approach was an important driver of the progress achieved in Wealth Management and connected activities6 in 2016.
Wealth Management generated record net revenues and record average AuM of CHF 171.6 billion in 4Q16, reflecting inflows of CHF 14.6 billion for FY16 and an annualized NNA growth rate of 10%. NNA were positive during 4Q16 at CHF 0.7 billion, despite the adverse impact of outflows due to regularization in 4Q16. Adjusted* gross margin improved by 15 bps compared to 4Q15 due to higher NII, recurring commissions and fees and transaction-based revenues, while adjusted* net margin increased by 8 bps. Credit Suisse was named the ‘Best Private Bank in Asia’ for the second year in succession and the third time overall by Asian Private Banker18.
Underwriting and advisory revenues increased 34% in US dollars compared to FY15 as a result of increased client activity. Credit Suisse is ranked number one in terms of share of wallet in Asia Pacific ex-Japan among interna-tional banks7.
The APAC Financing Group, set up in 2016, has been a key enabler to deliver an integrated approach to our core lending activities, resulting in a notable increase in deal flow across our key client segments in APAC.
Equity sales and trading revenues decreased 31% in FY16 compared to FY15 as they were adversely impacted by decreased client activity in Greater China. Fixed income sales and trading revenues remained resilient in FY16 despite significant declines in 4Q16.
APAC achieved adjusted* PTI of CHF 122 million in 4Q16 and of CHF 778 million in FY16. Adjusted* return on regulatory capital10 was 15% for FY16. Our Wealth Management and connected activities6 have had a very strong year and a very strong final quarter of 2016. Our focus on UHNWI and entrepreneurs has allowed us to grow both assets and margins in a challenging environment.
Investment Banking & Capital Markets (IBCM)
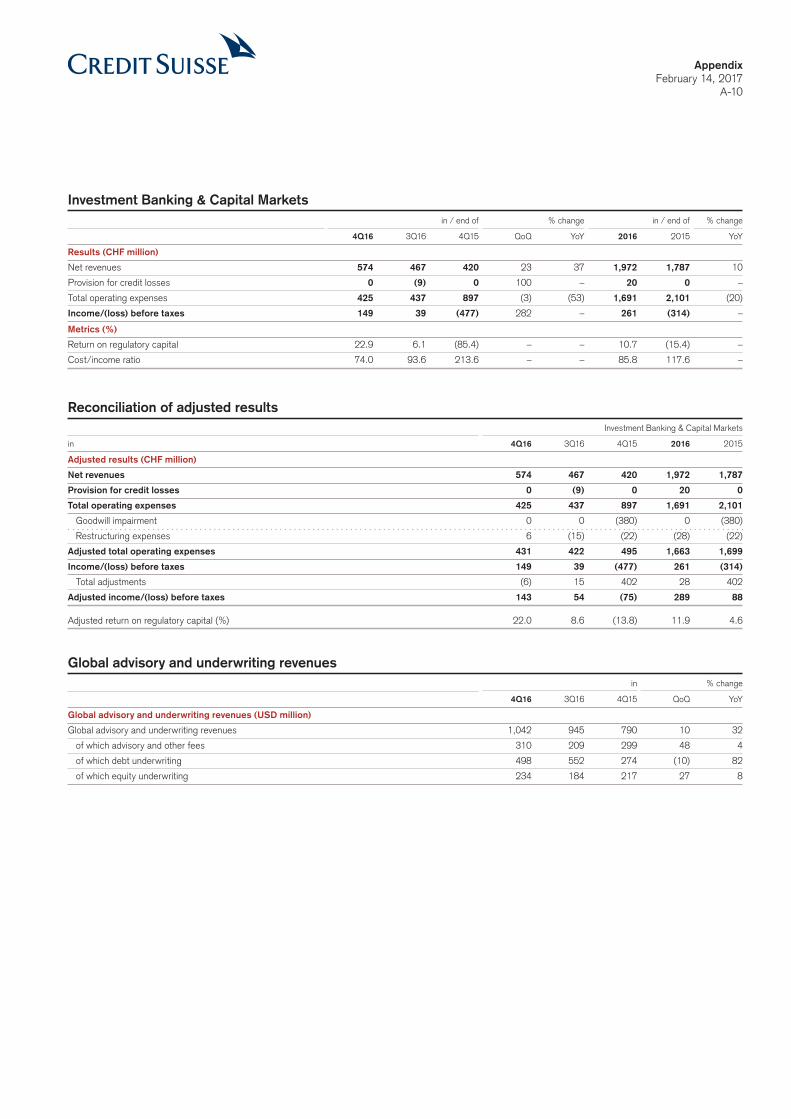
IBCM delivered a strong performance in FY16, reflecting excellent execution of our strategy presented in 2015, as evidenced by improved share of wallet across all key products and covered client segments7. Adjusted* PTI for FY16 was USD 297 million, up 219% compared to the prior year. Net revenues rose 8% year on year, driven by strong advisory and debt underwriting revenues, outperforming the Street7. Adjusted* total operating expenses decreased 5% compared to FY15, driven by cost discipline and the self-funding of growth investments.
In 4Q16, adjusted* PTI was USD 142 million and net revenues rose 36% compared to 4Q15 to USD 569 million, representing the strongest fourth quarter since 2012 and outperforming the Street7. Adjusted* return on regulatory capital10 increased to 12% in FY16.
Media ReleaseFebruary 14, 2017
Page 9
Global advisory and underwriting19 revenues rose 9% compared to FY15, outperforming the industry-wide fee pool, which decreased 5%7. We have grown our market share of completed M&A transactions and have also achieved global top-5 market positions in Leverage Finance7 and ECM7 for 2016.
Global Markets (GM)
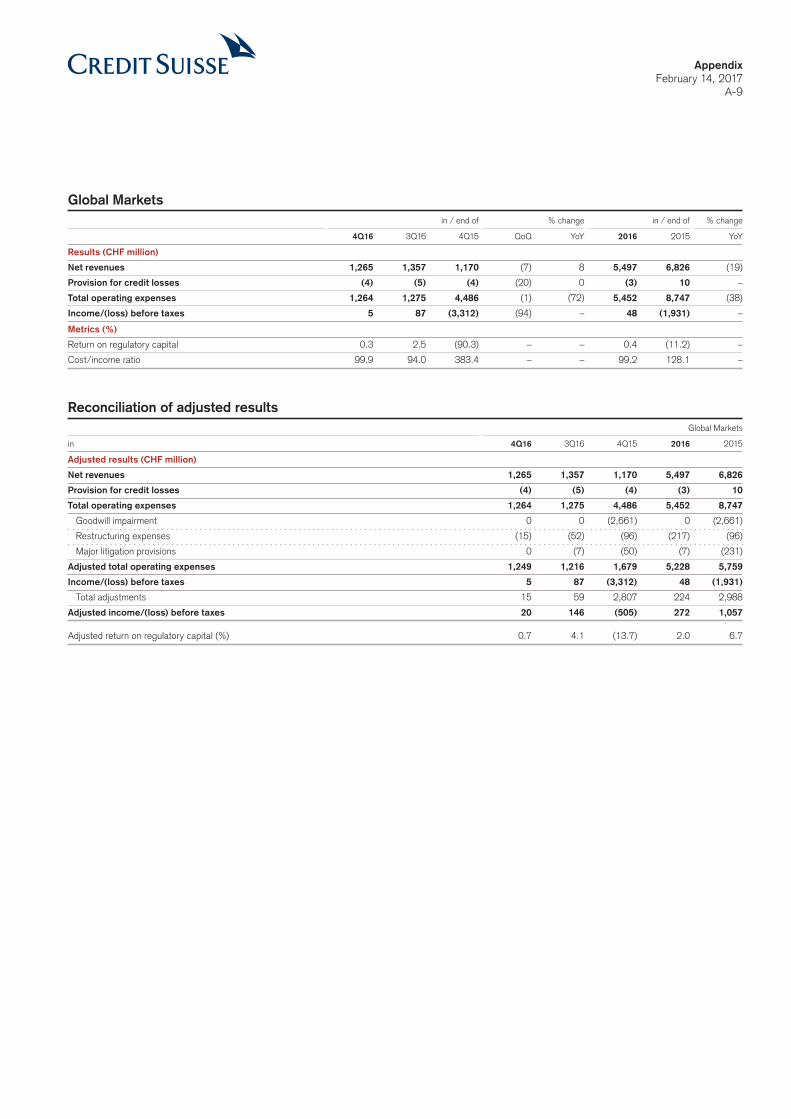
GM was profitable in a restructuring year with FY16 adjusted* PTI of USD 284 million, driven by a substantial reduction in costs and our ability to maintain leading market positions across our core franchises as we rightsized our business model. Adjusted* total operating expenses declined by USD 682 million compared to FY15.
In 4Q16, adjusted* PTI improved compared to 4Q15, reflecting more favorable market conditions and continued cost and capital discipline, highlighting the potential of the rightsized GM platform to capture future upside. Revenues improved across US leveraged finance trading and underwriting, securitized products and emerging markets businesses. In addition, excluding SMG, Equities revenues were resilient, as solid performance in Americas Cash Equities and Prime Services was offset by continued muted client activity in EMEA, and revenues in Solutions were impacted by low levels of volatility in equity derivatives.
GM ended 4Q16 with an annualized11 adjusted* operating cost base of less than USD 5.2 billion12, compared to USD 6.0 billion at end-2015. We are on track to achieve our end-2018 targets of less than USD 4.8 billion in costs and to generate an adjusted* return on regulatory capital10 of 10-15%. With increased capital efficiency and a reduced risk profile, we are operating at below our end-2016 RWA target of USD 60 billion and our USD 290 billion leverage exposure target.
Strategic Resolution Unit (SRU)
In 4Q16, the SRU continued to make significant progress in disposing of and de-risking legacy positions, with RWA and leverage exposure down by USD 11 billion and USD 16 billion, respectively, compared to 3Q16. RWA for derivative, loan and financing portfolios were reduced by 38% compared to 3Q16, through a broad range of transactions, including the sale of loan portfolios, and a large number of unwinds and compressions across macro and credit derivative products. Compared to FY15, RWA and leverage exposure both decreased by 39%, in US dollars, while the number of bilateral derivatives trades was reduced by 191,000 or 57%.
Compared to FY15, adjusted* total operating expenses decreased by USD 1,093 million or 41%, driven primarily by the exit from our US Private Banking onshore business and a reduced footprint in legacy investment banking businesses.
Adjusted* PTL of USD 516 million improved by USD 396 million compared to 4Q15. Exit costs were approximately 0.5% of RWA in 4Q16, which is below our revised long-term guidance of less than 3%. In 4Q16, we recorded a litigation provision of approximately USD 2 billion due to the settlement with the DOJ related to our legacy RMBS business. We aim to reduce the adjusted* full year PTI drag to approximately USD 800 million by end-2019.
Media ReleaseFebruary 14, 2017
Page 10
Biographies of the proposed new non-executive Board members
Alexandre Zeller was appointed Chairman of the Board of Directors of Credit Suisse (Schweiz) AG as of October 1, 2016. Prior to that, he was Chairman of the Board of Directors of SIX Group from May 2013. After completing his studies at the University of Lausanne (Business Administration) and Harvard Business School in Boston (Advanced Management Program), he worked in International Operational Audit at Nestlé in Vevey from 1984 to 1987. He subsequently held various functions at Credit Suisse in Zurich until 2002, during which time he was appointed to the Executive Board of Private Banking Switzerland in 1999 and to the position of CEO Private Banking Switzerland in 2002. After working as CEO of Banque Cantonale Vaudoise in Lausanne from 2002 to 2008, he then moved to HSBC Private Bank (Suisse) in Geneva, where he worked until 2012 as the CEO, Country Manager Switzerland, and Regional CEO Global Private Banking EMEA. Since 2012, Alexandre Zeller has held mandates as a professional board member with various companies and foundations in Switzerland. Alexandre Zeller is a Swiss citizen and was born in 1961.
Andreas Gottschling was a member of the Management Board and Chief Risk Officer of Erste Group Bank AG, Vienna, from 2013 to 2016. From 2012 to 2013, he was a senior advisor in the risk practice at McKinsey & Company, Zurich. Prior to that, he was with Deutsche Bank in London and Frankfurt, as a member of the Risk Executive Committee and Divisional Board from 2005 to 2012, with additional responsibility as Global Head of Operational Risk from 2006 to 2010. From 2003 to 2005, he held the role of Head of Quant Research at LGT Capital Management in Pfäffikon. From 2000 to 2003, he was a consultant at Euroquants, Frankenthal, and a Professor of Finance at Washington State University, Washington. He started his career at Deutsche Bank Research in 1997. Prior to that he studied Mathematics and Economics at Albert-Ludwigs University of Freiburg and Harvard University, and holds a Master and a PhD in Economics from the University of California, San Diego. Andreas Gottschling is a German citizen and was born in 1967.
Media ReleaseFebruary 14, 2017
Page 11
Footnotes* Adjusted results are non-GAAP financial measures. For a reconciliation of the adjusted results to the most directly comparable US GAAP measures,
see the Appendix of this media release for reconciliations of adjustment items.1 Relating to Wealth Management in SUB, IWM and APAC.2 The look-through CET1 ratio, without taking into account the impact of the final DOJ settlement relating to our legacy RMBS business, excludes a
provision in 4Q16 of approximately USD 2 billion and an increase in 4Q16 in operational risk RWA of approximately CHF 0.7 billion.3 The look-through CET1 leverage ratio, without taking into account the impact of the final DOJ settlement relating to our legacy RMBS business, excludes
a provision in 4Q16 of approximately USD 2 billion.4 FY16 net cost savings represents the difference between FY15 ‘adjusted operating expenses at constant FX rates’ of CHF 21.2 billion and FY16
‘adjusted operating expenses at constant FX rates’ of CHF 19.4 billion. ‘Adjusted operating expenses at constant FX rates’ include adjustments as made in all our disclosures for restructuring expenses (CHF 355 million in FY15 and CHF 539 million in FY16), major litigation expenses (CHF 820 million in FY15 and CHF 2,407 million in FY16) and a goodwill impairment taken in 4Q15 of CHF 3,797 million as well as adjustments for FX (CHF (318) million in FY15 and CHF (293) million in FY16).
5 Adjusted to exclude Swisscard net revenues of CHF 148 million and operating expenses of CHF 123 million for 2015 in SUB Wealth Management.6 Includes contributions from APAC Wealth Management, APAC Underwriting and Advisory as well as Financing for activities with our UHNWI,
Entrepreneurs and Corporate clients. Pro forma figures for Wealth Management and connected activities within APAC are based on preliminary estimates.
7 Source: Dealogic as of December 31, 2016.8 Compared to 3Q15 CET1 ratio of 10.2% reported at the announcement of our new strategy in October 2015.9 Source: Dealogic M&A Analytics as of January 3, 2016.10 Regulatory capital reflects the worst of 10% of RWA and 3.5% of leverage exposure. Return on regulatory capital is based on (adjusted) returns
after tax assuming a tax rate of 30% for all periods and capital allocated based on the worst of 10% of average RWA and 3.5% of average leverage exposure. For GM and IBCM, return on regulatory capital is based on US dollars denominated numbers.
11 Annualized numbers do not take account of variations in operating results, seasonality and other factors and may not be indicative of actual, full-year results.
12 4Q16 annualized adjusted* cost base, which was below our previous estimate of USD 5.2 billion presented at Investor Day on December 7, 2016.13 Scope of Credit Suisse (Schweiz) AG differs from SUB. Any such IPO would involve the sale of a minority stake and would be subject to, among other
things, all necessary approvals and would be intended to generate / raise additional capital for Credit Suisse AG or Credit Suisse (Schweiz) AG.14 Source: Thomson Securities, SDC Platinum, Credit Suisse.15 Source: International Financial Review.16 Source: Euromoney, July 2016.17 Source: IFR Review of the Year 2016.18 Source: Asian Private Banker – awards for distinction 2016.19 Gross global revenues from advisory, debt and equity underwriting generated across all divisions before cross-divisional revenue sharing agreements.
AbbreviationsAsia Pacific – APAC; Asset under Management – AuM; basis point – bps; Common Equity Tier 1 – CET1; Debt Capital Markets – DCM; Equity Capital Markets – ECM; Europe, the Middle East and Africa – EMEA; External Asset Managers – EAM; Foreign Exchange – FX; Full Year – FY; Global Mar-kets – GM; IFR – International Financial Review; Initial Public Offering – IPO; International Wealth Management – IWM; Investment Banking & Capital Markets – IBCM; Mergers and Acquisitions – M&A; Net Interest Income – NII; Net New Assets – NNA; Pre-tax income – PTI; Pre-tax loss – PTL; Relationship Managers – RMs; Residential Mortgage-Backed Securities – RMBS; Risk-weighted assets – RWA; Securities and Exchange Commission – SEC; Strategic Resolution Unit – SRU; Swiss Financial Market Supervisory Authority – FINMA; Swiss Universal Bank – SUB; Ultra-High-Net-Worth Individual – UHNWI; US Department of Justice – DOJ
Important information about the Swiss Universal BankThe data presented in this media release relating to the Swiss Universal Bank refers to the division of Credit Suisse Group as the same is currently managed within Credit Suisse Group.
The scope, revenues and expenses of the Swiss Universal Bank vary from the planned scope of Credit Suisse (Schweiz) AG and its subsidiaries, for which a partial IPO is planned, market conditions permitting. Any such IPO would involve the sale of a minority stake and would be subject to, among other things, all necessary approvals.
It is therefore not possible to make a like-for-like comparison of the Swiss Universal Bank as a division of Credit Suisse Group on the one hand and Credit Suisse (Schweiz) AG as a potential IPO vehicle on the other hand.
Media ReleaseFebruary 14, 2017
Page 12
Important information about this Media ReleaseInformation referenced in this Media Release, whether via website links or otherwise, is not incorporated into this Media Release.
“Adjusted operating expenses at constant FX rates” include adjustments as made in all our disclosures for restructuring expenses, major litigation expenses and a goodwill impairment taken in 4Q15 as well as adjustments for FX, applying the following main currency exchange rates for 1Q15: USD/CHF 0.9465, EUR/CHF 1.0482, GBP/CHF 1.4296, 2Q15: USD/CHF 0.9383, EUR/CHF 1.0418, GBP/CHF 1.4497, 3Q15: USD/CHF 0.9684, EUR/CHF 1.0787, GBP/CHF 1.4891, 4Q15: USD/CHF 1.0000, EUR/CHF 1.0851, GBP/CHF 1.5123, 1Q16: USD/CHF 0.9928, EUR/CHF 1.0941, GBP/CHF 1.4060, 2Q16: USD/CHF 0.9756, EUR/CHF 1.0956, GBP/CHF 1.3845, 3Q16: USD/CHF 0.9728, EUR/CHF 1.0882, GBP/CHF 1.2764, 4Q16: USD/CHF 1.0101, EUR/CHF 1.0798, GBP/CHF 1.2451. These currency exchange rates are unweighted, i.e. a straight line average of monthly rates. We apply this calculation consistently for the periods under review.
We may not achieve all of the expected benefits of our strategic initiatives. Factors beyond our control, including but not limited to the market and eco-nomic conditions, changes in laws, rules or regulations and other challenges discussed in our public filings, could limit our ability to achieve some or all of the expected benefits of these initiatives.
In particular, the terms “Illustrative”, “Ambition”, “Outlook” and “Goal” are not intended to be viewed as targets or projections, nor are they considered to be Key Performance Indicators. All such illustrations, ambitions and goals are subject to a large number of inherent risks, assumptions and uncertain-ties, many of which are completely outside of our control. Accordingly, this information should not be relied on for any purpose. We do not intend to update these illustrations, ambitions or goals.
In preparing this media release, management has made estimates and assumptions that affect the numbers presented. Actual results may differ. Fig-ures throughout this media release may also be subject to rounding adjustments. In particular, pro forma figures for Wealth Management and connected activities within APAC are based on preliminary estimates.
This presentation contains certain unaudited interim financial information for the year-to-date 2017, the date of our last published quarterly financial statements. This information has been derived from management accounts, is preliminary in nature, does not reflect the complete results of the first quarter of 2017 and is subject to change, including as a result of any normal quarterly adjustments in relation to the financial statements for the first quarter of 2017. This information has not been subject to any review by our independent registered public accounting firm. There can be no assurance that the final results for these periods will not differ from these preliminary results, and any such differences could be material. Quarterly financial results for the first quarter of 2017 will be included in our 1Q17 Financial Report. These interim results of operations are not necessarily indicative of the results to be achieved for the remainder of 1Q17 or the full first quarter of 2017.
As of January 1, 2013, Basel 3 was implemented in Switzerland along with the Swiss “Too Big to Fail” legislation and regulations thereunder (in each case, subject to certain phase-in periods). As of January 1, 2015, the Bank for International Settlements (BIS) leverage ratio framework, as issued by the Basel Committee on Banking Supervision (BCBS), was implemented in Switzerland by FINMA. Our related disclosures are in accordance with our interpretation of such requirements, including relevant assumptions. Changes in the interpretation of these requirements in Switzerland or in any of our assumptions or estimates could result in different numbers from those shown in this media release.
Unless otherwise noted, leverage exposure is based on the BIS leverage ratio framework and consists of period-end balance sheet assets and pre-scribed regulatory adjustments. Beginning in 2015, the Swiss leverage ratio is calculated as Swiss total capital, divided by period-end leverage expo-sure. The look-through BIS tier 1 leverage ratio and CET1 leverage ratio are calculated as look-through BIS tier 1 capital and CET1 capital, respectively, divided by end-period leverage exposure.
Mandates penetration means advisory and discretionary mandates in private banking businesses as a percentage of the related AuM, excluding those from the external asset manager business.
When we refer to Wealth Management focused divisions throughout this Media Release, we mean APAC, IWM and SUB. References to the “Wealth Management” businesses in APAC, IWM and SUB refer to those divisions’ Private Banking businesses.
Investors and others should note that we announce material information (including quarterly earnings releases and financial reports) to the investing public using press releases, SEC and Swiss ad hoc filings, our website and public conference calls and webcasts. We intend to also use our Twitter account @creditsuisse (https://twitter.com/creditsuisse) to excerpt key messages from our public disclosures, including earnings releases. We may retweet such messages through certain of our regional Twitter accounts, including @csschweiz (https://twitter.com/csschweiz) and @csapac (https://twitter.com/csapac).
Investors and others should take care to consider such abbreviated messages in the context of the disclosures from which they are excerpted. The information we post on these Twitter accounts is not a part of this Media Release.
In various tables, use of “-“ indicates not meaningful or not applicable.
A summary document containing a more detailed description of the option to receive the distribution in new shares will be made available to sharehold-ers of Credit Suisse Group on or around March 24, 2017. The conditions for the exercise of the scrip alternative, including possible restrictions to its availability to some Credit Suisse Group shareholders, will be specified in such summary document. This Earnings Release does not constitute an offer to sell or an invitation to subscribe for, or the solicitation of an offer to buy or subscribe for, securities of Credit Suisse Group nor shall it (or any part of it) or the fact of its distribution form the basis of, or be relied on in connection with, any contract therefor. This Earnings Release does not constitute a prospectus within the meaning of any applicable law. Eligible shareholders should make their decision to receive a cash distribution or to receive new shares of Credit Suisse Group as part of the 2016 distribution solely based on the terms and conditions of the 2016 distribution and the additional infor-mation contained in the relevant documents, which will be available upon publication of the invitation to the 2017 Annual General Meeting. This Earnings Release does not constitute a recommendation to shareholders to elect to receive new shares of Credit Suisse Group as part of the 2016 distribution. Eligible shareholders are furthermore advised to consult their bank, tax or financial adviser before making any decision.
Media ReleaseFebruary 14, 2017
Page 13
Selling restrictionsThis document, and the information contained herein, is not an offer to sell or a solicitation of offers to purchase or subscribe for securities of Credit Suisse Group AG or Credit Suisse (Schweiz) AG in Switzerland, the United States or any other jurisdiction. This document is not a prospectus within the meaning of article 652a of the Swiss Code of Obligations, nor is it a listing prospectus as defined in the listing rules of the SIX Swiss Exchange AG or any other exchange or regulated trading facility in Switzerland or a prospectus or offering document under any other applicable laws.
Copies of this document may not be sent to jurisdictions, or distributed in or sent from jurisdictions, in which such documents are barred or prohibited by law. A decision to invest in securities of Credit Suisse Group AG or Credit Suisse (Schweiz) AG should be based exclusively on a written agreement with Credit Suisse Group AG or an offering and listing prospectus to be published by Credit Suisse Group AG or Credit Suisse (Schweiz) AG for such purpose. Any offer and sale of securities of Credit Suisse (Schweiz) AG will not be registered under the U.S. Securities Act of 1933, as amended, and may not be offered in the United States of America absent such registration or an exemption from registration. There will be no public offering of such securities in the United States of America.
AppendixFebruary 14, 2017
A-1
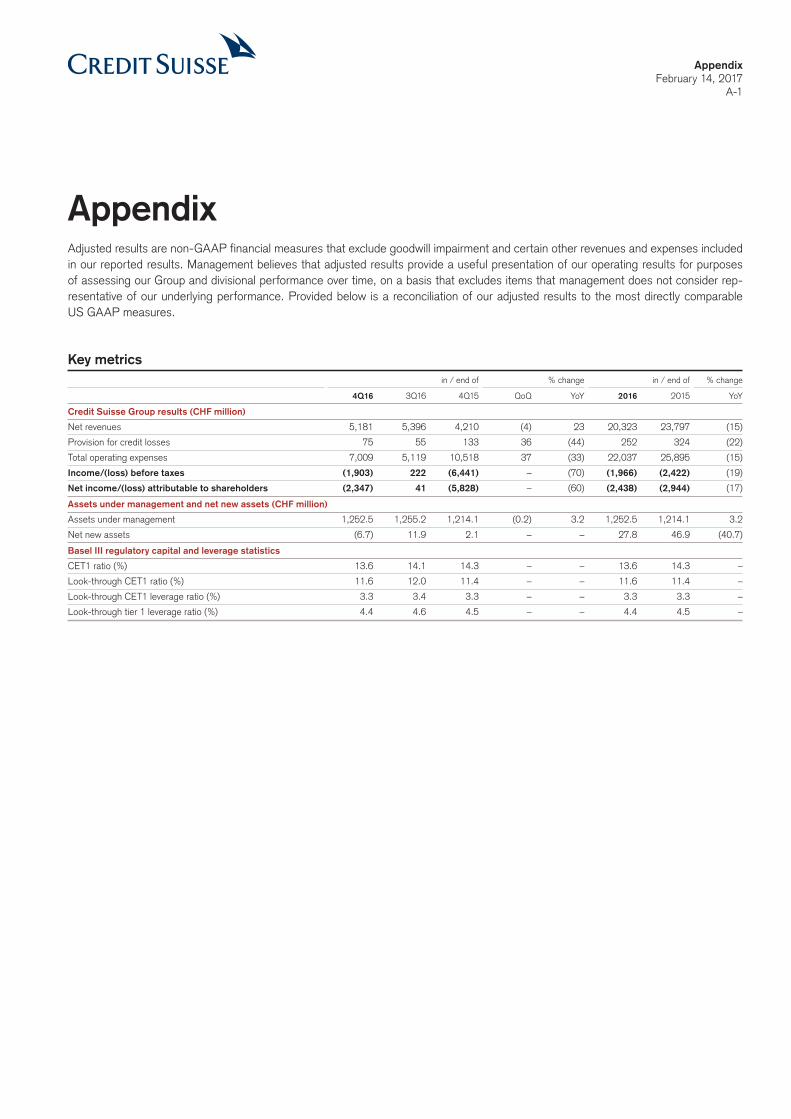
AppendixAdjusted results are non-GAAP financial measures that exclude goodwill impairment and certain other revenues and expenses included in our reported results. Management believes that adjusted results provide a useful presentation of our operating results for purposes of assessing our Group and divisional performance over time, on a basis that excludes items that management does not consider rep-resentative of our underlying performance. Provided below is a reconciliation of our adjusted results to the most directly comparable US GAAP measures.
Key metrics in / end of % change in / end of % change
4Q16 3Q16 4Q15 QoQ YoY 2016 2015 YoY
Credit Suisse Group results (CHF million)
Net revenues 5,181 5,396 4,210 (4) 23 20,323 23,797 (15)
Provision for credit losses 75 55 133 36 (44) 252 324 (22)
Total operating expenses 7,009 5,119 10,518 37 (33) 22,037 25,895 (15)
Income/(loss) before taxes (1,903) 222 (6,441) – (70) (1,966) (2,422) (19)
Net income/(loss) attributable to shareholders (2,347) 41 (5,828) – (60) (2,438) (2,944) (17)
Assets under management and net new assets (CHF million)
Assets under management 1,252.5 1,255.2 1,214.1 (0.2) 3.2 1,252.5 1,214.1 3.2
Net new assets (6.7) 11.9 2.1 – – 27.8 46.9 (40.7)
Basel III regulatory capital and leverage statistics
CET1 ratio (%) 13.6 14.1 14.3 – – 13.6 14.3 –
Look-through CET1 ratio (%) 11.6 12.0 11.4 – – 11.6 11.4 –
Look-through CET1 leverage ratio (%) 3.3 3.4 3.3 – – 3.3 3.3 –
Look-through tier 1 leverage ratio (%) 4.4 4.6 4.5 – – 4.4 4.5 –
AppendixFebruary 14, 2017
A-2
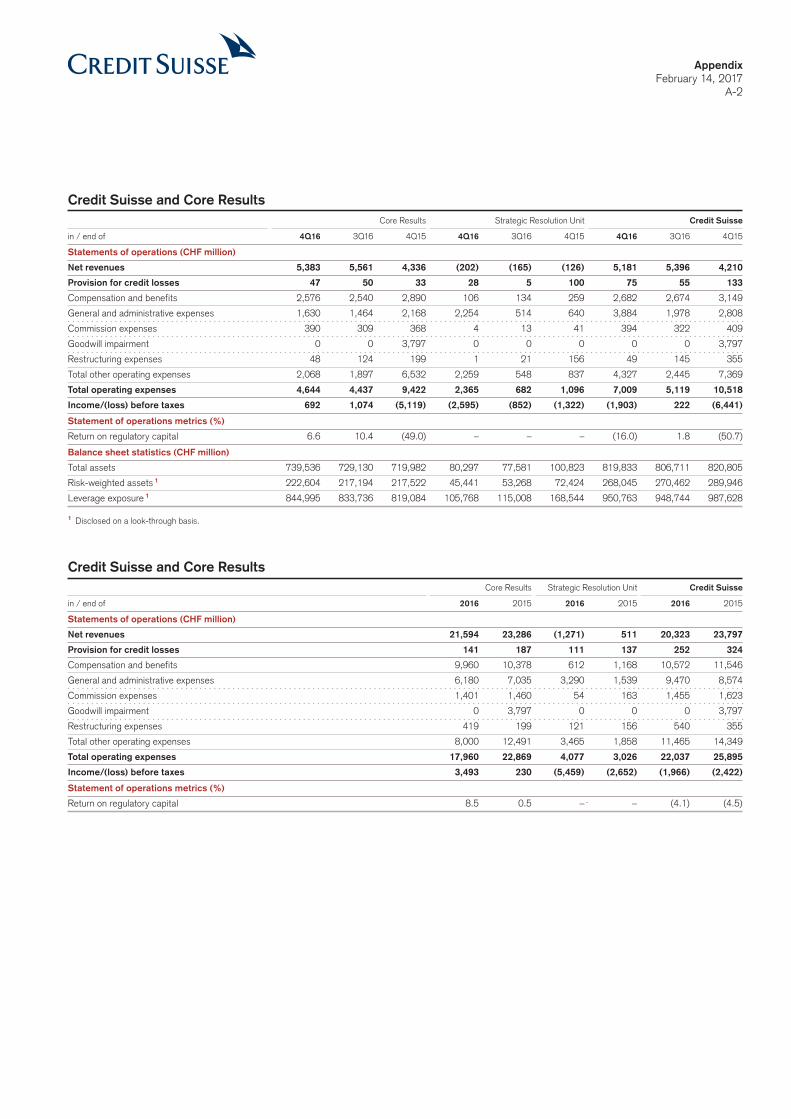
Credit Suisse and Core Results
Core Results Strategic Resolution Unit Credit Suisse
in / end of 4Q16 3Q16 4Q15 4Q16 3Q16 4Q15 4Q16 3Q16 4Q15
Statements of operations (CHF million)
Net revenues 5,383 5,561 4,336 (202) (165) (126) 5,181 5,396 4,210
Provision for credit losses 47 50 33 28 5 100 75 55 133
Compensation and benefits 2,576 2,540 2,890 106 134 259 2,682 2,674 3,149
General and administrative expenses 1,630 1,464 2,168 2,254 514 640 3,884 1,978 2,808
Commission expenses 390 309 368 4 13 41 394 322 409
Goodwill impairment 0 0 3,797 0 0 0 0 0 3,797
Restructuring expenses 48 124 199 1 21 156 49 145 355
Total other operating expenses 2,068 1,897 6,532 2,259 548 837 4,327 2,445 7,369
Total operating expenses 4,644 4,437 9,422 2,365 682 1,096 7,009 5,119 10,518
Income/(loss) before taxes 692 1,074 (5,119) (2,595) (852) (1,322) (1,903) 222 (6,441)
Statement of operations metrics (%)
Return on regulatory capital 6.6 10.4 (49.0) – – – (16.0) 1.8 (50.7)
Balance sheet statistics (CHF million)
Total assets 739,536 729,130 719,982 80,297 77,581 100,823 819,833 806,711 820,805
Risk-weighted assets 1 222,604 217,194 217,522 45,441 53,268 72,424 268,045 270,462 289,946
Leverage exposure 1 844,995 833,736 819,084 105,768 115,008 168,544 950,763 948,744 987,628
1 Disclosed on a look-through basis.
Credit Suisse and Core Results
Core Results Strategic Resolution Unit Credit Suisse
in / end of 2016 2015 2016 2015 2016 2015
Statements of operations (CHF million)
Net revenues 21,594 23,286 (1,271) 511 20,323 23,797
Provision for credit losses 141 187 111 137 252 324
Compensation and benefits 9,960 10,378 612 1,168 10,572 11,546
General and administrative expenses 6,180 7,035 3,290 1,539 9,470 8,574
Commission expenses 1,401 1,460 54 163 1,455 1,623
Goodwill impairment 0 3,797 0 0 0 3,797
Restructuring expenses 419 199 121 156 540 355
Total other operating expenses 8,000 12,491 3,465 1,858 11,465 14,349
Total operating expenses 17,960 22,869 4,077 3,026 22,037 25,895
Income/(loss) before taxes 3,493 230 (5,459) (2,652) (1,966) (2,422)
Statement of operations metrics (%)
Return on regulatory capital 8.5 0.5 – . – (4.1) (4.5)
AppendixFebruary 14, 2017
A-3
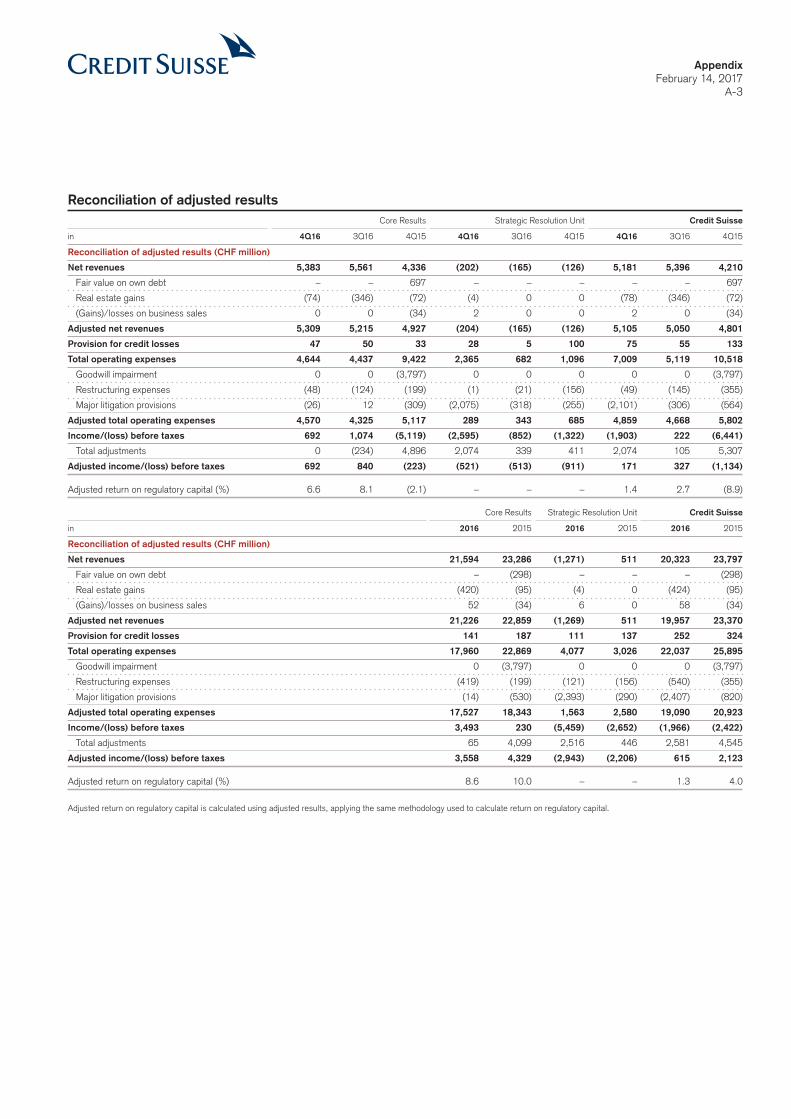
Reconciliation of adjusted results
Core Results Strategic Resolution Unit Credit Suisse
in 4Q16 3Q16 4Q15 4Q16 3Q16 4Q15 4Q16 3Q16 4Q15
Reconciliation of adjusted results (CHF million)
Net revenues 5,383 5,561 4,336 (202) (165) (126) 5,181 5,396 4,210
Fair value on own debt – – 697 – – – – – 697
Real estate gains (74) (346) (72) (4) 0 0 (78) (346) (72)
(Gains)/losses on business sales 0 0 (34) 2 0 0 2 0 (34)
Adjusted net revenues 5,309 5,215 4,927 (204) (165) (126) 5,105 5,050 4,801
Provision for credit losses 47 50 33 28 5 100 75 55 133
Total operating expenses 4,644 4,437 9,422 2,365 682 1,096 7,009 5,119 10,518
Goodwill impairment 0 0 (3,797) 0 0 0 0 0 (3,797)
Restructuring expenses (48) (124) (199) (1) (21) (156) (49) (145) (355)
Major litigation provisions (26) 12 (309) (2,075) (318) (255) (2,101) (306) (564)
Adjusted total operating expenses 4,570 4,325 5,117 289 343 685 4,859 4,668 5,802
Income/(loss) before taxes 692 1,074 (5,119) (2,595) (852) (1,322) (1,903) 222 (6,441)
Total adjustments 0 (234) 4,896 2,074 339 411 2,074 105 5,307
Adjusted income/(loss) before taxes 692 840 (223) (521) (513) (911) 171 327 (1,134)
Adjusted return on regulatory capital (%) 6.6 8.1 (2.1) – – – 1.4 2.7 (8.9)
Core Results Strategic Resolution Unit Credit Suisse
in 2016 2015 2016 2015 2016 2015
Reconciliation of adjusted results (CHF million)
Net revenues 21,594 23,286 (1,271) 511 20,323 23,797
Fair value on own debt – (298) – – – (298)
Real estate gains (420) (95) (4) 0 (424) (95)
(Gains)/losses on business sales 52 (34) 6 0 58 (34)
Adjusted net revenues 21,226 22,859 (1,269) 511 19,957 23,370
Provision for credit losses 141 187 111 137 252 324
Total operating expenses 17,960 22,869 4,077 3,026 22,037 25,895
Goodwill impairment 0 (3,797) 0 0 0 (3,797)
Restructuring expenses (419) (199) (121) (156) (540) (355)
Major litigation provisions (14) (530) (2,393) (290) (2,407) (820)
Adjusted total operating expenses 17,527 18,343 1,563 2,580 19,090 20,923
Income/(loss) before taxes 3,493 230 (5,459) (2,652) (1,966) (2,422)
Total adjustments 65 4,099 2,516 446 2,581 4,545
Adjusted income/(loss) before taxes 3,558 4,329 (2,943) (2,206) 615 2,123
Adjusted return on regulatory capital (%) 8.6 10.0 – – 1.3 4.0
Adjusted return on regulatory capital is calculated using adjusted results, applying the same methodology used to calculate return on regulatory capital.
AppendixFebruary 14, 2017
A-4
Swiss Universal Bank in / end of % change in / end of % change
4Q16 3Q16 4Q15 QoQ YoY 2016 2015 YoY
Results (CHF million)
Net revenues 1,399 1,667 1,495 (16) (6) 5,759 5,721 1
of which Private Banking 858 1,160 963 (26) (11) 3,704 3,696 0
of which Corporate & Institutional Banking 541 507 532 7 2 2,055 2,025 1
Provision for credit losses 34 30 43 13 (21) 79 138 (43)
Total operating expenses 983 879 1,088 12 (10) 3,655 3,908 (6)
Income before taxes 382 758 364 (50) 5 2,025 1,675 21
of which Private Banking 194 544 165 (64) 18 1,194 875 36
of which Corporate & Institutional Banking 188 214 199 (12) (6) 831 800 4
Metrics (%)
Return on regulatory capital 12.2 24.7 12.3 – – 16.5 13.8 –
Cost/income ratio 70.3 52.7 72.8 – – 63.5 68.3 –
Private Banking
Assets under management (CHF billion) 242.9 244.5 241.0 (0.7) 0.8 242.9 241.0 0.8
Net new assets (CHF billion) (3.5) 0.2 (2.9) – – (1.7) 3.2 –
Gross margin (annualized) (bp) 141 191 159 – – 154 148 –
Net margin (annualized) (bp) 32 89 27 – – 50 35 –
Corporate & Institutional Banking
Assets under management (CHF billion) 288.6 284.6 275.8 1.4 4.6 288.6 275.8 4.6
Net new assets (CHF billion) 2.5 (1.2) 4.2 – – 4.3 10.6 –
AppendixFebruary 14, 2017
A-5
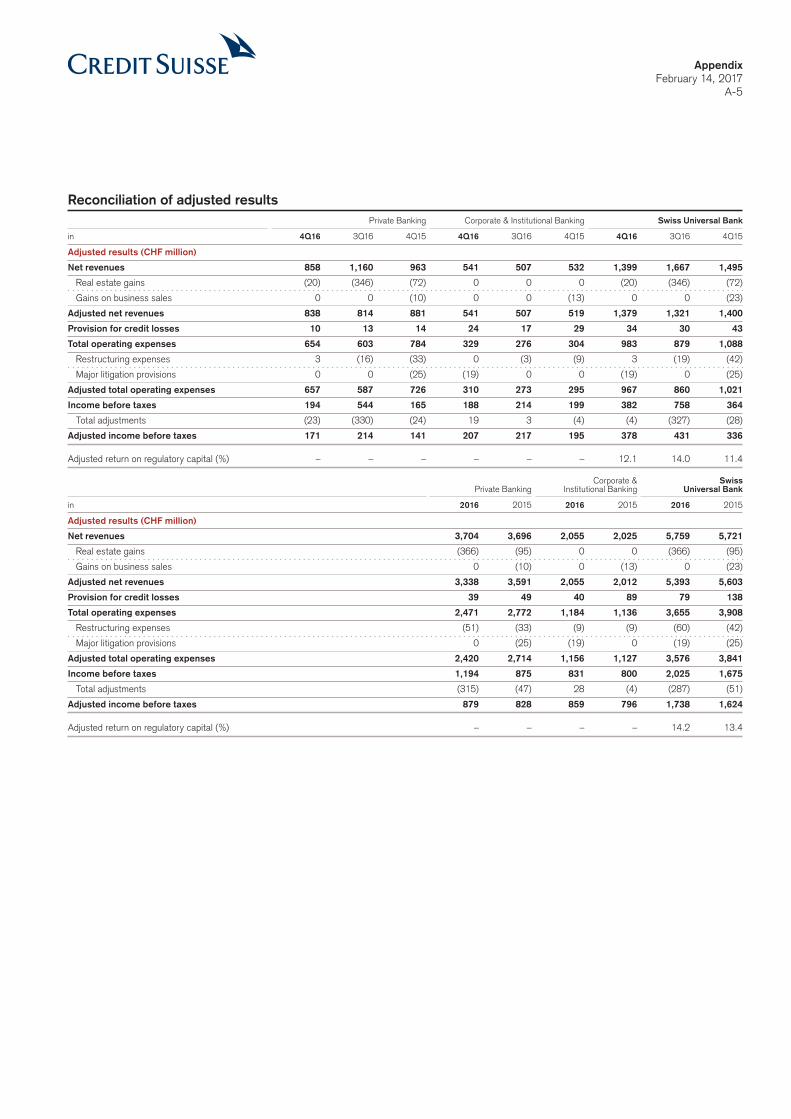
Reconciliation of adjusted results Private Banking Corporate & Institutional Banking Swiss Universal Bank
in 4Q16 3Q16 4Q15 4Q16 3Q16 4Q15 4Q16 3Q16 4Q15
Adjusted results (CHF million)
Net revenues 858 1,160 963 541 507 532 1,399 1,667 1,495
Real estate gains (20) (346) (72) 0 0 0 (20) (346) (72)
Gains on business sales 0 0 (10) 0 0 (13) 0 0 (23)
Adjusted net revenues 838 814 881 541 507 519 1,379 1,321 1,400
Provision for credit losses 10 13 14 24 17 29 34 30 43
Total operating expenses 654 603 784 329 276 304 983 879 1,088
Restructuring expenses 3 (16) (33) 0 (3) (9) 3 (19) (42)
Major litigation provisions 0 0 (25) (19) 0 0 (19) 0 (25)
Adjusted total operating expenses 657 587 726 310 273 295 967 860 1,021
Income before taxes 194 544 165 188 214 199 382 758 364
Total adjustments (23) (330) (24) 19 3 (4) (4) (327) (28)
Adjusted income before taxes 171 214 141 207 217 195 378 431 336
Adjusted return on regulatory capital (%) – – – – – – 12.1 14.0 11.4
Corporate & Swiss Private Banking Institutional Banking Universal Bank
in 2016 2015 2016 2015 2016 2015
Adjusted results (CHF million)
Net revenues 3,704 3,696 2,055 2,025 5,759 5,721
Real estate gains (366) (95) 0 0 (366) (95)
Gains on business sales 0 (10) 0 (13) 0 (23)
Adjusted net revenues 3,338 3,591 2,055 2,012 5,393 5,603
Provision for credit losses 39 49 40 89 79 138
Total operating expenses 2,471 2,772 1,184 1,136 3,655 3,908
Restructuring expenses (51) (33) (9) (9) (60) (42)
Major litigation provisions 0 (25) (19) 0 (19) (25)
Adjusted total operating expenses 2,420 2,714 1,156 1,127 3,576 3,841
Income before taxes 1,194 875 831 800 2,025 1,675
Total adjustments (315) (47) 28 (4) (287) (51)
Adjusted income before taxes 879 828 859 796 1,738 1,624
Adjusted return on regulatory capital (%) – – – – 14.2 13.4
AppendixFebruary 14, 2017
A-6
International Wealth Management in / end of % change in / end of % change
4Q16 3Q16 4Q15 QoQ YoY 2016 2015 YoY
Results (CHF million)
Net revenues 1,299 1,081 1,173 20 11 4,698 4,552 3
of which Private Banking 918 789 808 16 14 3,371 3,224 5
of which Asset Management 381 292 365 30 4 1,327 1,328 0
Provision for credit losses 6 0 (7) – – 20 5 300
Total operating expenses 962 836 1,204 15 (20) 3,557 3,824 (7)
Income/(loss) before taxes 331 245 (24) 35 – 1,121 723 55
of which Private Banking 228 196 (59) 16 – 841 541 55
of which Asset Management 103 49 35 110 194 280 182 54
Metrics (%)
Return on regulatory capital 27.0 20.5 (1.9) – – 23.3 15.4 –
Cost/income ratio 74.1 77.3 102.6 – – 75.7 84.0 –
Private Banking
Assets under management (CHF billion) 323.2 311.4 289.6 3.8 11.6 323.2 289.6 11.6
Net new assets (CHF billion) 0.4 4.4 (4.2) – – 15.6 (3.0) –
Gross margin (annualized) (bp) 116 104 110 – – 112 107 –
Net margin (annualized) (bp) 29 26 (8) – – 28 18 –
Asset Management
Assets under management (CHF billion) 321.6 324.3 321.3 (0.8) – 321.6 321.3 –
Net new assets (CHF billion) (4.4) 5.0 3.6 – – 5.6 26.5 –
AppendixFebruary 14, 2017
A-7
Reconciliation of adjusted results Private Banking Asset Management International Wealth Management
in 4Q16 3Q16 4Q15 4Q16 3Q16 4Q15 4Q16 3Q16 4Q15
Adjusted results (CHF million)
Net revenues 918 789 808 381 292 365 1,299 1,081 1,173
Real estate gains (54) 0 0 0 0 0 (54) 0 0
Gains on business sales 0 0 (11) 0 0 0 0 0 (11)
Adjusted net revenues 864 789 797 381 292 365 1,245 1,081 1,162
Provision for credit losses 6 0 (7) 0 0 0 6 0 (7)
Total operating expenses 684 593 874 278 243 330 962 836 1,204
Restructuring expenses (11) (13) (32) (5) (2) (4) (16) (15) (36)
Major litigation provisions (7) 19 (228) 0 0 0 (7) 19 (228)
Adjusted total operating expenses 666 599 614 273 241 326 939 840 940
Income/(loss) before taxes 228 196 (59) 103 49 35 331 245 (24)
Total adjustments (36) (6) 249 5 2 4 (31) (4) 253
Adjusted income before taxes 192 190 190 108 51 39 300 241 229
Adjusted return on regulatory capital (%) – – – – – – 24.4 20.1 18.8
Reconciliation of adjusted results (continued) Private Asset International Banking Management Wealth Management
in 2016 2015 2016 2015 2016 2015
Adjusted results (CHF million)
Net revenues 3,371 3,224 1,327 1,328 4,698 4,552
Real estate gains (54) 0 0 0 (54) 0
Gains on business sales 0 (11) 0 0 0 (11)
Adjusted net revenues 3,317 3,213 1,327 1,328 4,644 4,541
Provision for credit losses 20 5 0 0 20 5
Total operating expenses 2,510 2,678 1,047 1,146 3,557 3,824
Restructuring expenses (47) (32) (7) (4) (54) (36)
Major litigation provisions 12 (268) 0 0 12 (268)
Adjusted total operating expenses 2,475 2,378 1,040 1,142 3,515 3,520
Income before taxes 841 541 280 182 1,121 723
Total adjustments (19) 289 7 4 (12) 293
Adjusted income before taxes 822 830 287 186 1,109 1,016
Adjusted return on regulatory capital (%) – – – – 23.1 21.7
AppendixFebruary 14, 2017
A-8
Asia Pacific in / end of % change in / end of % change
4Q16 3Q16 4Q15 QoQ YoY 2016 2015 YoY
Results (CHF million)
Net revenues 862 917 826 (6) 4 3,597 3,839 (6)
of which Private Banking 372 346 271 8 37 1,374 1,178 17
of which Investment Banking 490 571 555 (14) (12) 2,223 2,661 (16)
Provision for credit losses 11 34 3 (68) 267 26 35 (26)
Total operating expenses 748 731 1,440 2 (48) 2,846 3,427 (17)
Income/(loss) before taxes 103 152 (617) (32) – 725 377 92
of which Private Banking 96 66 48 45 100 372 344 8
of which Investment Banking 7 86 (665) (92) – 353 33 –
Metrics (%)
Return on regulatory capital 7.6 11.3 (49.7) – – 13.7 6.7 –
Cost/income ratio 86.8 79.7 174.3 – – 79.1 89.3 –
Private Banking
Assets under management (CHF billion) 168.3 169.0 150.4 (0.4) 11.9 168.3 150.4 11.9
Net new assets (CHF billion) 0.7 4.6 3.0 – – 14.6 17.8 –
Gross margin (annualized) (bp) 87 84 72 – – 86 79 –
Net margin (annualized) (bp) 22 16 13 – – 23 23 –
Reconciliation of adjusted results Private Banking Investment Banking Asia Pacific
in 4Q16 3Q16 4Q15 4Q16 3Q16 4Q15 4Q16 3Q16 4Q15
Adjusted results (CHF million)
Net revenues 372 346 271 490 571 555 862 917 826
Provision for credit losses 9 38 (5) 2 (4) 8 11 34 3
Total operating expenses 267 242 228 481 489 1,212 748 731 1,440
Goodwill impairment – – – 0 0 (756) 0 0 (756)
Restructuring expenses (1) (3) (1) (18) (20) (2) (19) (23) (3)
Major litigation provisions 0 0 (6) 0 0 0 0 0 (6)
Adjusted total operating expenses 266 239 221 463 469 454 729 708 675
Income/(loss) before taxes 96 66 48 7 86 (665) 103 152 (617)
Total adjustments 1 3 7 18 20 758 19 23 765
Adjusted income before taxes 97 69 55 25 106 93 122 175 148
Adjusted return on regulatory capital (%) – – – – – – 9.0 12.9 11.7
Private Banking Investment Banking Asia Pacific
in 2016 2015 2016 2015 2016 2015
Adjusted results (CHF million)
Net revenues 1,374 1,178 2,223 2,661 3,597 3,839
Provision for credit losses 32 18 (6) 17 26 35
Total operating expenses 970 816 1,876 2,611 2,846 3,427
Goodwill impairment – – 0 (756) 0 (756)
Restructuring expenses (4) (1) (49) (2) (53) (3)
Major litigation provisions 0 (6) 0 0 0 (6)
Adjusted total operating expenses 966 809 1,827 1,853 2,793 2,662
Income before taxes 372 344 353 33 725 377
Total adjustments 4 7 49 758 53 765
Adjusted income before taxes 376 351 402 791 778 1,142
Adjusted return on regulatory capital (%) – – – – 14.8 20.4
AppendixFebruary 14, 2017
A-9
Global Markets in / end of % change in / end of % change
4Q16 3Q16 4Q15 QoQ YoY 2016 2015 YoY
Results (CHF million)
Net revenues 1,265 1,357 1,170 (7) 8 5,497 6,826 (19)
Provision for credit losses (4) (5) (4) (20) 0 (3) 10 –
Total operating expenses 1,264 1,275 4,486 (1) (72) 5,452 8,747 (38)
Income/(loss) before taxes 5 87 (3,312) (94) – 48 (1,931) –
Metrics (%)
Return on regulatory capital 0.3 2.5 (90.3) – – 0.4 (11.2) –
Cost/income ratio 99.9 94.0 383.4 – – 99.2 128.1 –
Reconciliation of adjusted results Global Markets
in 4Q16 3Q16 4Q15 2016 2015
Adjusted results (CHF million)
Net revenues 1,265 1,357 1,170 5,497 6,826
Provision for credit losses (4) (5) (4) (3) 10
Total operating expenses 1,264 1,275 4,486 5,452 8,747
Goodwill impairment 0 0 (2,661) 0 (2,661)
Restructuring expenses (15) (52) (96) (217) (96)
Major litigation provisions 0 (7) (50) (7) (231)
Adjusted total operating expenses 1,249 1,216 1,679 5,228 5,759
Income/(loss) before taxes 5 87 (3,312) 48 (1,931)
Total adjustments 15 59 2,807 224 2,988
Adjusted income/(loss) before taxes 20 146 (505) 272 1,057
Adjusted return on regulatory capital (%) 0.7 4.1 (13.7) 2.0 6.7
AppendixFebruary 14, 2017
A-10
Investment Banking & Capital Markets in / end of % change in / end of % change
4Q16 3Q16 4Q15 QoQ YoY 2016 2015 YoY
Results (CHF million)
Net revenues 574 467 420 23 37 1,972 1,787 10
Provision for credit losses 0 (9) 0 100 – 20 0 –
Total operating expenses 425 437 897 (3) (53) 1,691 2,101 (20)
Income/(loss) before taxes 149 39 (477) 282 – 261 (314) –
Metrics (%)
Return on regulatory capital 22.9 6.1 (85.4) – – 10.7 (15.4) –
Cost/income ratio 74.0 93.6 213.6 – – 85.8 117.6 –
Reconciliation of adjusted results Investment Banking & Capital Markets
in 4Q16 3Q16 4Q15 2016 2015
Adjusted results (CHF million)
Net revenues 574 467 420 1,972 1,787
Provision for credit losses 0 (9) 0 20 0
Total operating expenses 425 437 897 1,691 2,101
Goodwill impairment 0 0 (380) 0 (380)
Restructuring expenses 6 (15) (22) (28) (22)
Adjusted total operating expenses 431 422 495 1,663 1,699
Income/(loss) before taxes 149 39 (477) 261 (314)
Total adjustments (6) 15 402 28 402
Adjusted income/(loss) before taxes 143 54 (75) 289 88
Adjusted return on regulatory capital (%) 22.0 8.6 (13.8) 11.9 4.6
Global advisory and underwriting revenues in % change
4Q16 3Q16 4Q15 QoQ YoY
Global advisory and underwriting revenues (USD million)
Global advisory and underwriting revenues 1,042 945 790 10 32
of which advisory and other fees 310 209 299 48 4
of which debt underwriting 498 552 274 (10) 82
of which equity underwriting 234 184 217 27 8
AppendixFebruary 14, 2017
A-11
Cautionary statement regarding forward-looking informationThis media release contains statements that constitute forward-looking statements. In addition, in the future we, and others on our behalf, may make statements that constitute forward-looking statements. Such forward-looking statements may include, without limitation, statements relating to the following:p our plans, objectives or goals;p our future economic performance or prospects;p the potential effect on our future performance of certain contingencies; andp assumptions underlying any such statements.
Words such as “believes,” “anticipates,” “expects,” “intends” and “plans” and similar expressions are intended to identify forward-looking statements but are not the exclusive means of identifying such statements. We do not intend to update these forward-looking statements except as may be required by applicable securities laws.
By their very nature, forward-looking statements involve inherent risks and uncertainties, both general and specific, and risks exist that predictions, forecasts, projections and other outcomes described or implied in forward-looking statements will not be achieved. We caution you that a number of important factors could cause results to differ materially from the plans, objectives, expectations, estimates and intentions expressed in such forward-looking statements. These factors include:p the ability to maintain sufficient liquidity and access capital markets;p market volatility and interest rate fluctuations and development s affecting interest rate levels;p the strength of the global economy in general and the strength of the economies of the countries in which we conduct our operations, in particular
the risk of continued slow economic recovery or downturn in the US or other developed countries in 2016 and beyond;p the direct and indirect impacts of deterioration or slow recovery in residential and commercial real estate markets;p adverse rating actions by credit rating agencies in respect of us, sovereign issuers, structured credit products or other credit-related exposures;p the ability to achieve our strategic objectives, including improved performance, reduced risks, lower costs and more efficient use of capital;p the ability of counterparties to meet their obligations to us;p the effects of, and changes in, fiscal, monetary, exchange rate, trade and tax policies, as well as currency fluctuations;p political and social developments, including war, civil unrest or terrorist activity;p the possibility of foreign exchange controls, expropriation, nationalization or confiscation of assets in countries in which we conduct our operations;p operational factors such as systems failure, human error, or the failure to implement procedures properly;p actions taken by regulators with respect to our business and practices and possible resulting changes to our business organization, practices andp policies in countries in which we conduct our operations;p the effects of changes in laws, regulations or accounting policies or practices in countries in which we conduct our operations;p competition or changes in our competitive position in geographic and business areas in which we conduct our operations;p the ability to retain and recruit qualified personnel;p the ability to maintain our reputation and promote our brand;p the ability to increase our market share and control expenses;p technological changes;p the timely development and acceptance of our new products and services and the perceived overall value of these products and services by users;p acquisitions, including the ability to integrate acquired businesses successfully, and divestitures, including the ability to sell non-core assets;p the adverse resolution of litigation, regulatory proceedings and other contingencies;p the ability to achieve our cost efficiency, net new asset, pre-tax income/(loss), capital ratios and return on regulatory capital, leverage exposure
threshold, RWA threshold, and other targets and ambitions; andp other unforeseen or unexpected events and our success at managing these and the risks involved in the foregoing.
We caution you that the foregoing list of important factors is not exclusive. When evaluating forward-looking statements, you should carefully consider the foregoing factors and other uncertainties and events, including the information set forth in “Risk factors” in I – Information on the company in our Annual Report 2015.