Embed Size (px)
Citation preview

John GerspachChief Financial Officer
February 12, 2013
Credit Suisse Financial Services Forum
1
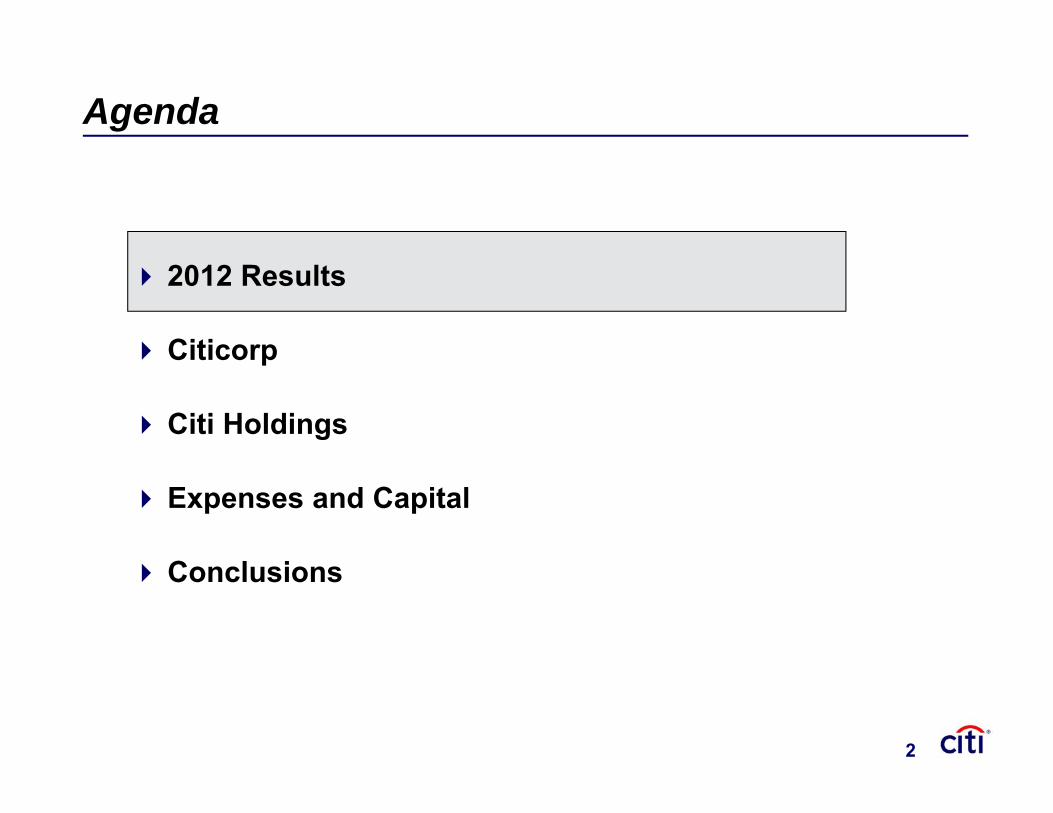
2012 Results
Citicorp
Citi Holdings
Expenses and Capital
Conclusions
Agenda
2
2
2012 Highlights
Improved core business performance in 2012
Revenue, volume and net income growth in each business
Stable net interest margin
Continued strong credit quality
Reported results reflected the continued impact of legacy issues
Continuing to wind-down Citi Holdings
Strong capital and liquidity position
3
3
Credit Provisions Net Income
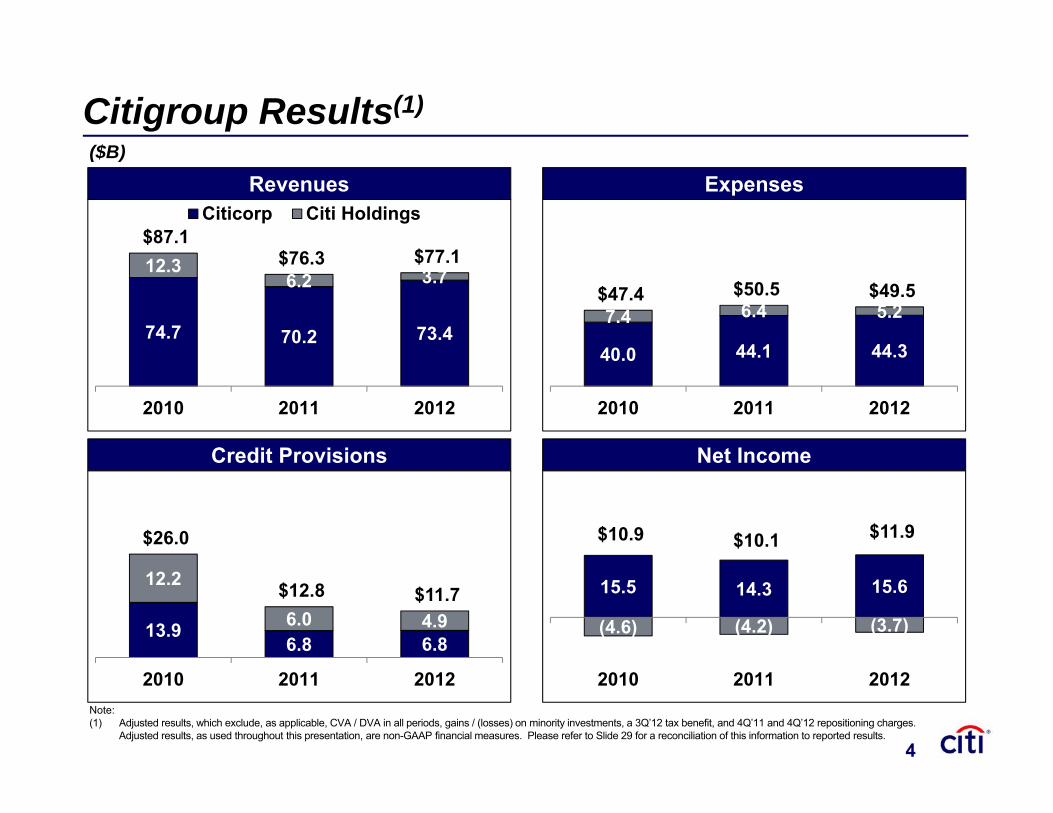
($B)
ExpensesRevenues
Citigroup Results(1)
74.7 70.2 73.4
12.3 6.2 3.7
$87.1 $76.3 $77.1
2010 2011 2012
Citicorp Citi Holdings
13.96.8 6.8
12.2
6.0 4.9
$26.0
$12.8 $11.7
2010 2011 2012
40.0 44.1 44.3
7.4 6.4 5.2$47.4 $50.5 $49.5
2010 2011 2012
15.5 14.3 15.6
(4.6) (4.2) (3.7)
$10.9 $10.1 $11.9
2010 2011 2012Note:(1) Adjusted results, which exclude, as applicable, CVA / DVA in all periods, gains / (losses) on minority investments, a 3Q’12 tax benefit, and 4Q’11 and 4Q’12 repositioning charges.
Adjusted results, as used throughout this presentation, are non-GAAP financial measures. Please refer to Slide 29 for a reconciliation of this information to reported results. 4
4
2012 Results
Citicorp
Citi Holdings
Expenses and Capital
Conclusions
Agenda
5
5
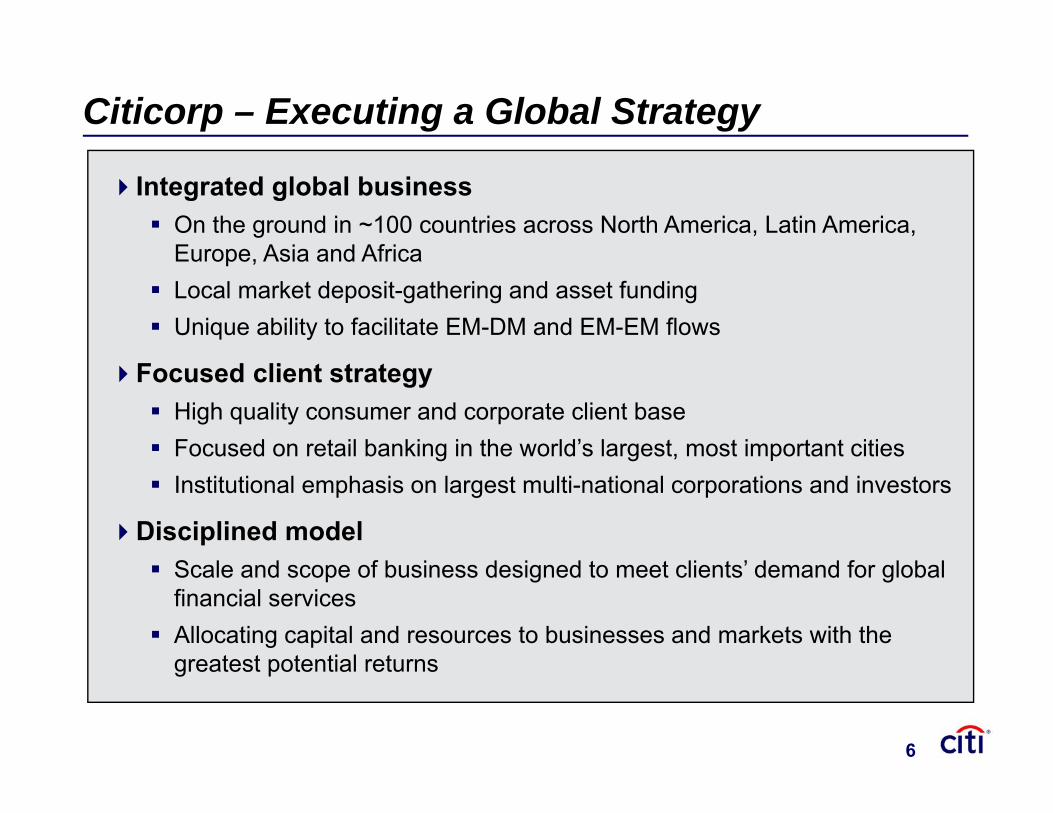
Citicorp – Executing a Global Strategy
Integrated global business On the ground in ~100 countries across North America, Latin America,
Europe, Asia and Africa Local market deposit-gathering and asset funding Unique ability to facilitate EM-DM and EM-EM flows
Focused client strategy High quality consumer and corporate client base Focused on retail banking in the world’s largest, most important cities Institutional emphasis on largest multi-national corporations and investors
Disciplined model Scale and scope of business designed to meet clients’ demand for global
financial services Allocating capital and resources to businesses and markets with the
greatest potential returns
6
67
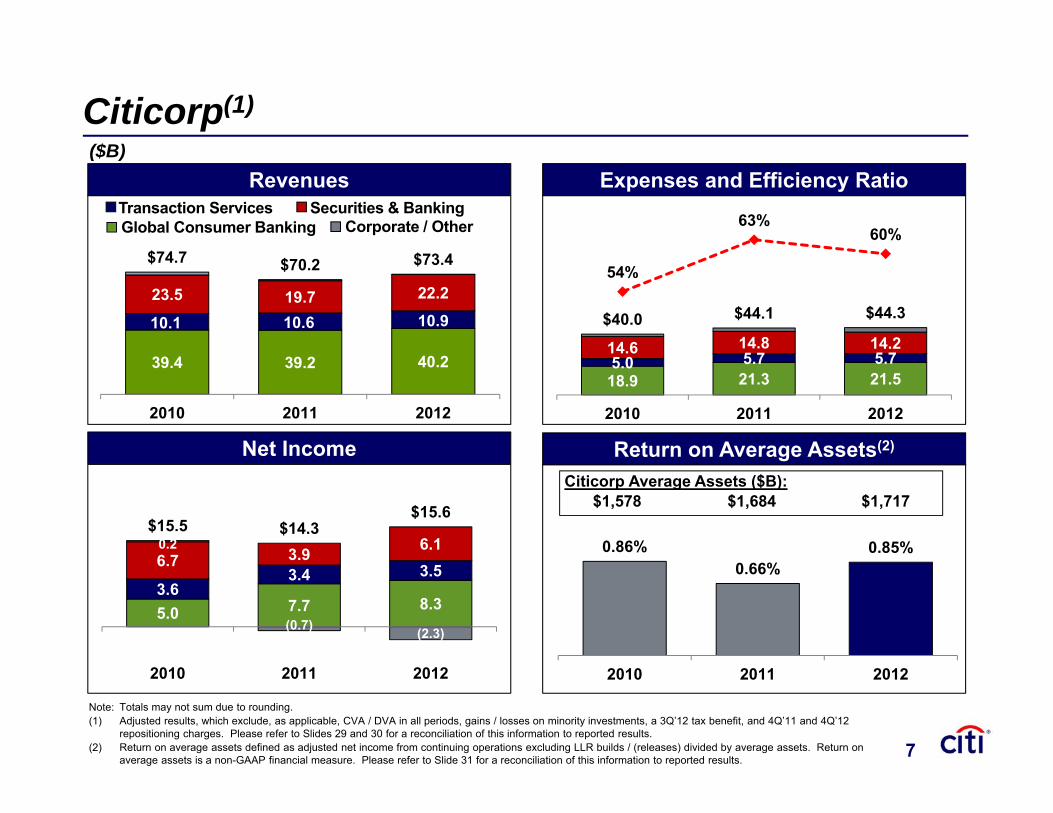
39.4 39.2 40.2
10.1 10.6 10.923.5 19.7 22.2
$74.7 $70.2 $73.4
2010 2011 2012
0.86%0.66%
0.85%
2010 2011 2012
Citicorp Average Assets ($B):$1,578 $1,684 $1,717
Citicorp(1)
5.0 7.7 8.33.6
3.4 3.56.7 3.9 6.10.2
(0.7) (2.3)
$15.5 $14.3$15.6
2010 2011 2012
Net Income
Revenues($B)
Return on Average Assets(2)
Note: Totals may not sum due to rounding.(1) Adjusted results, which exclude, as applicable, CVA / DVA in all periods, gains / losses on minority investments, a 3Q’12 tax benefit, and 4Q’11 and 4Q’12
repositioning charges. Please refer to Slides 29 and 30 for a reconciliation of this information to reported results. (2) Return on average assets defined as adjusted net income from continuing operations excluding LLR builds / (releases) divided by average assets. Return on
average assets is a non-GAAP financial measure. Please refer to Slide 31 for a reconciliation of this information to reported results.
Expenses and Efficiency Ratio
18.9 21.3 21.55.0 5.7 5.714.6 14.8 14.2
$40.0 $44.1 $44.3
54%
63%60%
2010 2011 2012
Global Consumer BankingTransaction Services Securities & Banking
Corporate / Other
7
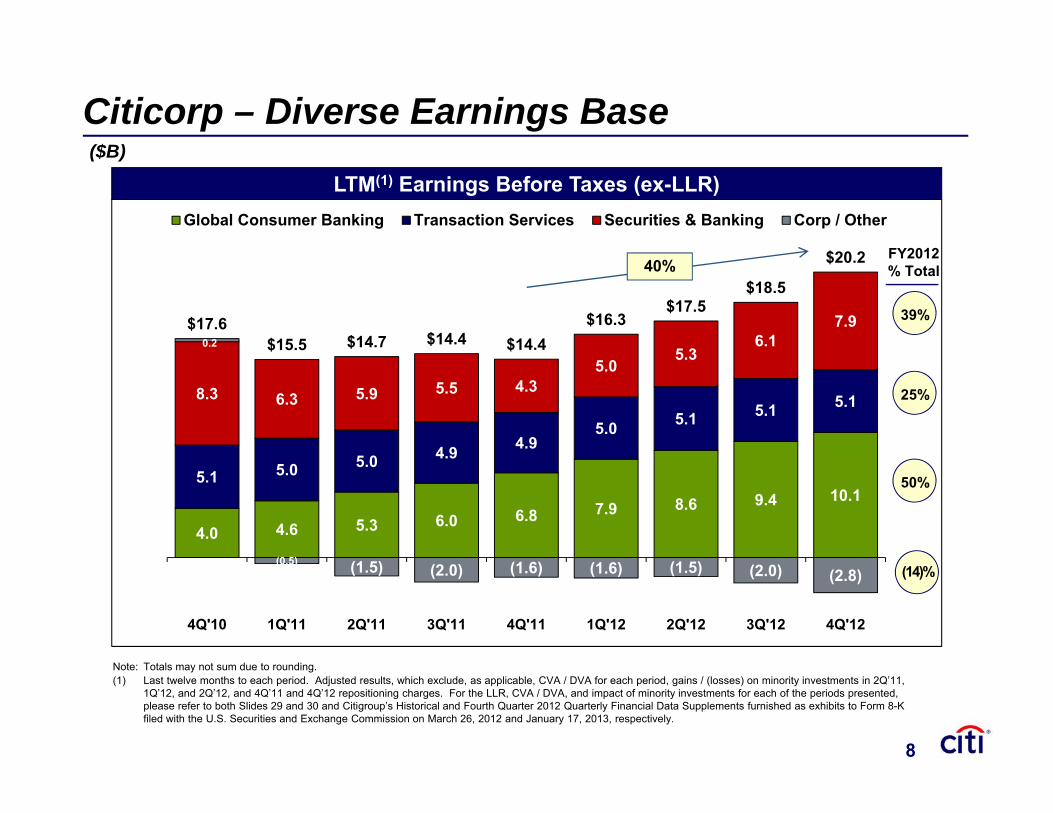
4.0 4.6 5.3 6.0 6.8 7.9 8.6 9.4 10.15.1 5.0 5.0 4.9 4.9
5.0 5.1 5.1 5.18.3 6.3 5.9 5.5 4.3 5.0
5.3 6.1
7.9 0.2
(0.5) (1.5) (2.0) (1.6) (1.6) (1.5) (2.0) (2.8)
$17.6 $15.5 $14.7 $14.4 $14.4
$16.3 $17.5
$18.5
$20.2
4Q'10 1Q'11 2Q'11 3Q'11 4Q'11 1Q'12 2Q'12 3Q'12 4Q'12
Global Consumer Banking Transaction Services Securities & Banking Corp / Other
LTM(1) Earnings Before Taxes (ex-LLR)
Citicorp – Diverse Earnings Base
Note: Totals may not sum due to rounding. (1) Last twelve months to each period. Adjusted results, which exclude, as applicable, CVA / DVA for each period, gains / (losses) on minority investments in 2Q’11,
1Q’12, and 2Q’12, and 4Q’11 and 4Q’12 repositioning charges. For the LLR, CVA / DVA, and impact of minority investments for each of the periods presented, please refer to both Slides 29 and 30 and Citigroup’s Historical and Fourth Quarter 2012 Quarterly Financial Data Supplements furnished as exhibits to Form 8-K filed with the U.S. Securities and Exchange Commission on March 26, 2012 and January 17, 2013, respectively.
8
($B)
40%
39%
25%
50%
(14)%
FY2012% Total
8
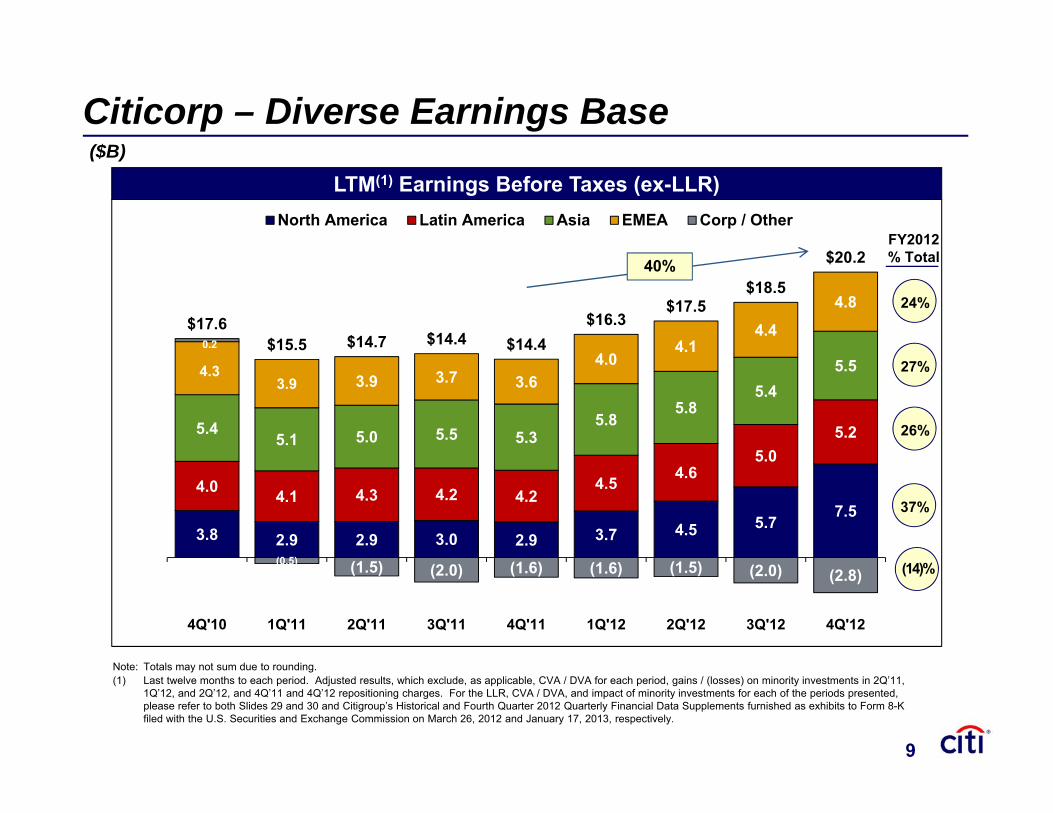
3.8 2.9 2.9 3.0 2.9 3.7 4.5 5.77.5
4.0 4.1 4.3 4.2 4.24.5 4.6
5.05.25.4
5.1 5.0 5.5 5.3 5.8
5.8 5.4
5.5 4.3 3.9 3.9 3.7 3.6
4.0 4.1
4.4
4.8
0.2
(0.5) (1.5) (2.0) (1.6) (1.6) (1.5) (2.0) (2.8)
$17.6$15.5 $14.7 $14.4 $14.4
$16.3$17.5
$18.5
$20.2
4Q'10 1Q'11 2Q'11 3Q'11 4Q'11 1Q'12 2Q'12 3Q'12 4Q'12
North America Latin America Asia EMEA Corp / Other
LTM(1) Earnings Before Taxes (ex-LLR)
Citicorp – Diverse Earnings Base
Note: Totals may not sum due to rounding.(1) Last twelve months to each period. Adjusted results, which exclude, as applicable, CVA / DVA for each period, gains / (losses) on minority investments in 2Q’11,
1Q’12, and 2Q’12, and 4Q’11 and 4Q’12 repositioning charges. For the LLR, CVA / DVA, and impact of minority investments for each of the periods presented, please refer to both Slides 29 and 30 and Citigroup’s Historical and Fourth Quarter 2012 Quarterly Financial Data Supplements furnished as exhibits to Form 8-K filed with the U.S. Securities and Exchange Commission on March 26, 2012 and January 17, 2013, respectively.
9
($B)
40%
24%
27%
26%
(14)%
FY2012% Total
37%
9
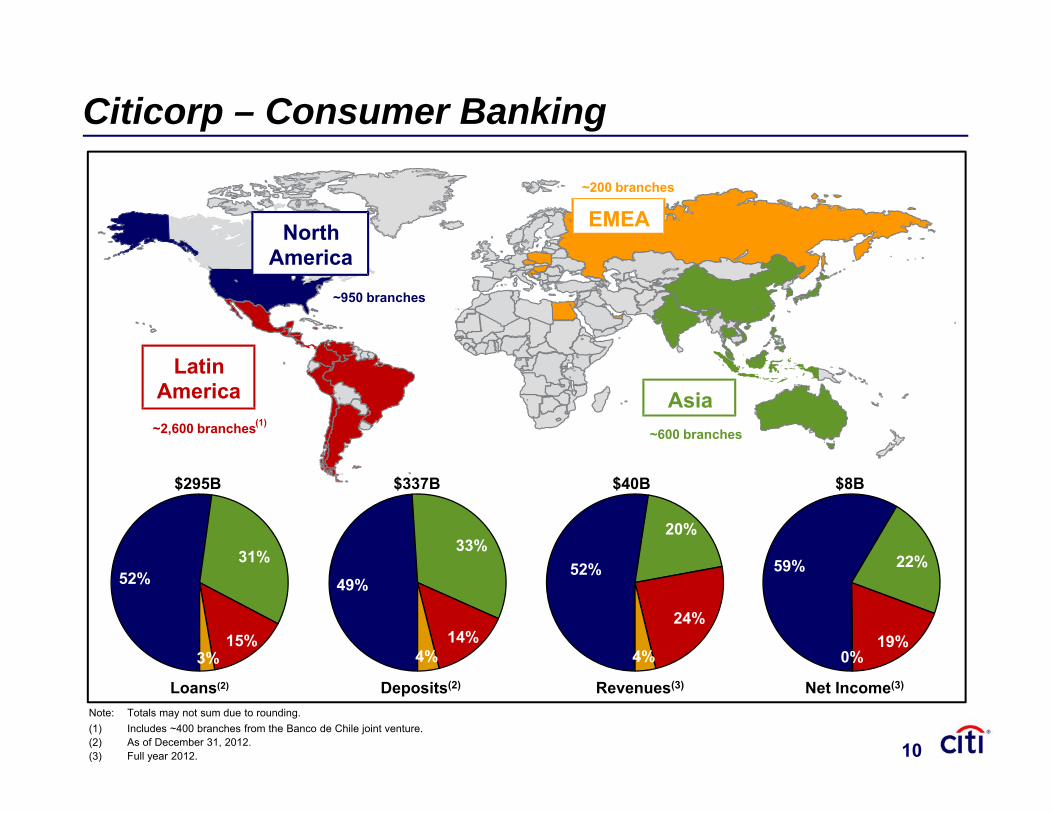
Citicorp – Consumer Banking
$337B$295B $40B $8B
52%
20%
24%
4%
Revenues(3)
59% 22%
19%0%
Net Income(3)
52%31%
15%3%
Loans(2)
49%
33%
14%4%
Deposits(2)
Note: Totals may not sum due to rounding. (1) Includes ~400 branches from the Banco de Chile joint venture.(2) As of December 31, 2012.(3) Full year 2012.
Asia
EMEA
Latin America
North America
~950 branches
~2,600 branches(1)~600 branches
~200 branches
10
10
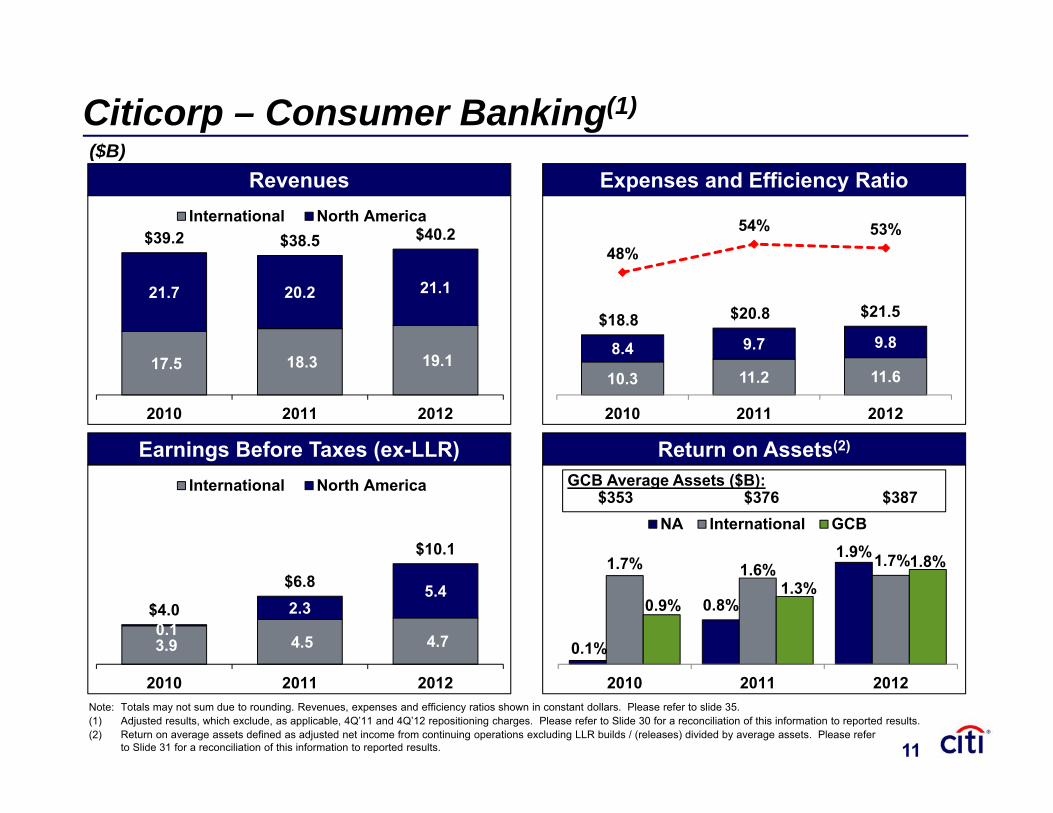
Note: Totals may not sum due to rounding. Revenues, expenses and efficiency ratios shown in constant dollars. Please refer to slide 35. (1) Adjusted results, which exclude, as applicable, 4Q’11 and 4Q’12 repositioning charges. Please refer to Slide 30 for a reconciliation of this information to reported results. (2) Return on average assets defined as adjusted net income from continuing operations excluding LLR builds / (releases) divided by average assets. Please refer
to Slide 31 for a reconciliation of this information to reported results.
0.1%
0.8%
1.9%1.7% 1.6% 1.7%
0.9%1.3%
1.8%
2010 2011 2012
NA International GCB
Revenues
Citicorp – Consumer Banking(1)
Earnings Before Taxes (ex-LLR)
($B)Expenses and Efficiency Ratio
17.5 18.3 19.1
21.7 20.2 21.1
$39.2 $38.5 $40.2
2010 2011 2012
International North America
Return on Assets(2)
10.3 11.2 11.6
8.4 9.7 9.8$18.8 $20.8 $21.5
48%
54% 53%
2010 2011 2012
GCB Average Assets ($B):$353 $376 $387
3.9 4.5 4.7 0.1
2.35.4
$4.0
$6.8
$10.1
2010 2011 2012
International North America
11
11
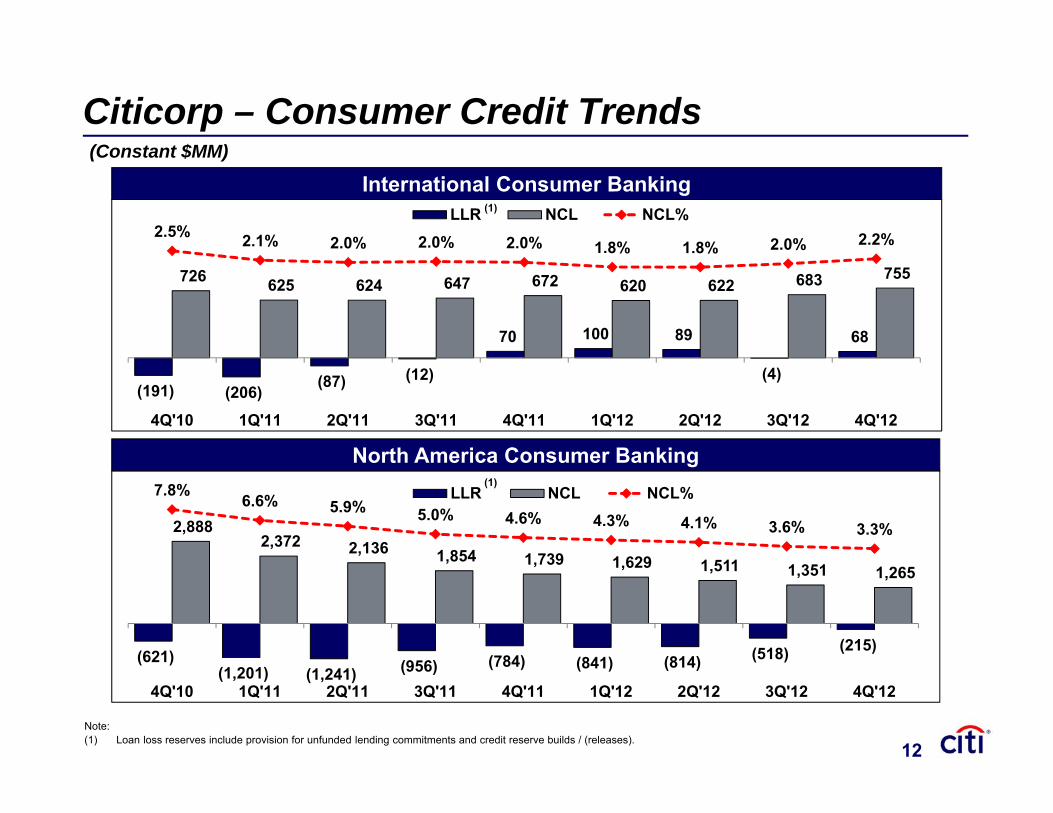
Citicorp – Consumer Credit Trends (Constant $MM)
(191) (206) (87) (12)
70 100 89
(4)
68
726 625 624 647 672 620 622 683 755
2.5% 2.1% 2.0% 2.0% 2.0% 1.8% 1.8% 2.0% 2.2%
4Q'10 1Q'11 2Q'11 3Q'11 4Q'11 1Q'12 2Q'12 3Q'12 4Q'12
LLR NCL NCL%
International Consumer Banking
(621)(1,201) (1,241) (956) (784) (841) (814) (518) (215)
2,888 2,372 2,136 1,854 1,739 1,629 1,511 1,351 1,265
7.8% 6.6% 5.9% 5.0% 4.6% 4.3% 4.1% 3.6% 3.3%
4Q'10 1Q'11 2Q'11 3Q'11 4Q'11 1Q'12 2Q'12 3Q'12 4Q'12
LLR NCL NCL%
North America Consumer Banking
Note:(1) Loan loss reserves include provision for unfunded lending commitments and credit reserve builds / (releases).
(1)
(1)
12
12
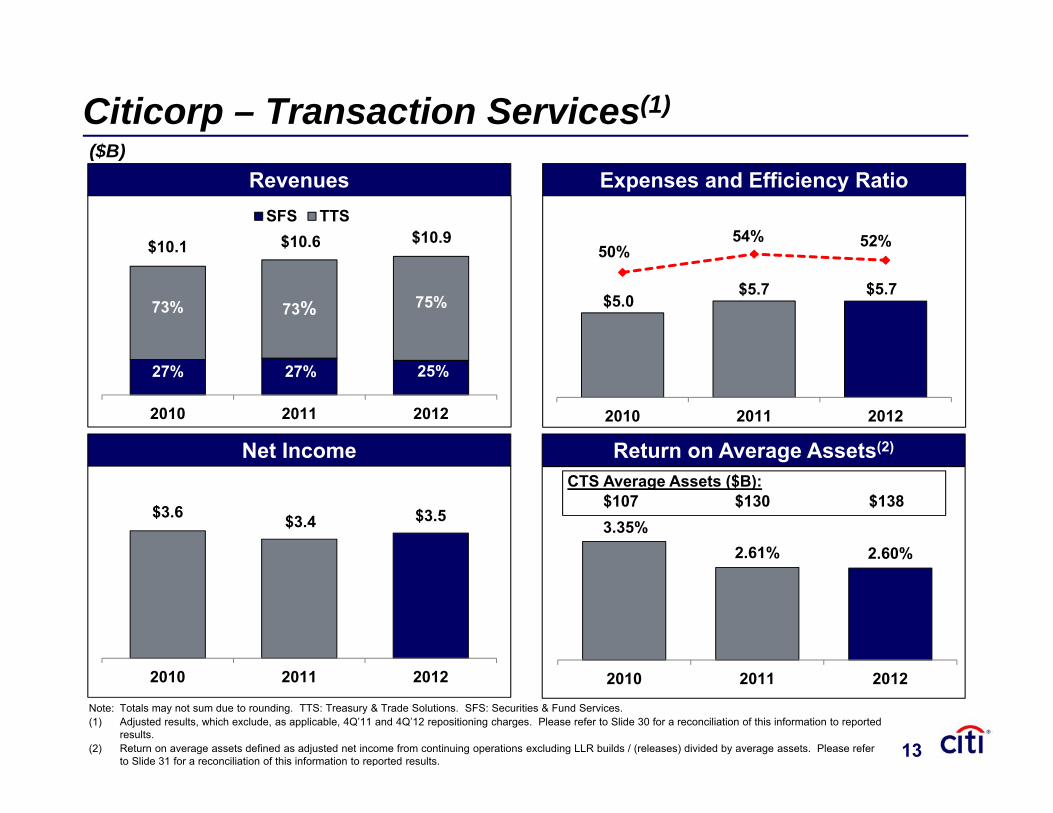
$5.0$5.7 $5.7
50%54% 52%
2010 2011 20122010 2011 2012
SFS TTS
Citicorp – Transaction Services(1)
$3.6 $3.4 $3.5
2010 2011 2012
Net Income
Revenues
25%27%
75%73%
$10.1 $10.6 $10.9
27%
73%
($B)
Return on Average Assets(2)
3.35%2.61% 2.60%
2010 2011 2012
CTS Average Assets ($B):$107 $130 $138
Note: Totals may not sum due to rounding. TTS: Treasury & Trade Solutions. SFS: Securities & Fund Services.(1) Adjusted results, which exclude, as applicable, 4Q’11 and 4Q’12 repositioning charges. Please refer to Slide 30 for a reconciliation of this information to reported
results. (2) Return on average assets defined as adjusted net income from continuing operations excluding LLR builds / (releases) divided by average assets. Please refer
to Slide 31 for a reconciliation of this information to reported results.
Expenses and Efficiency Ratio
13
13
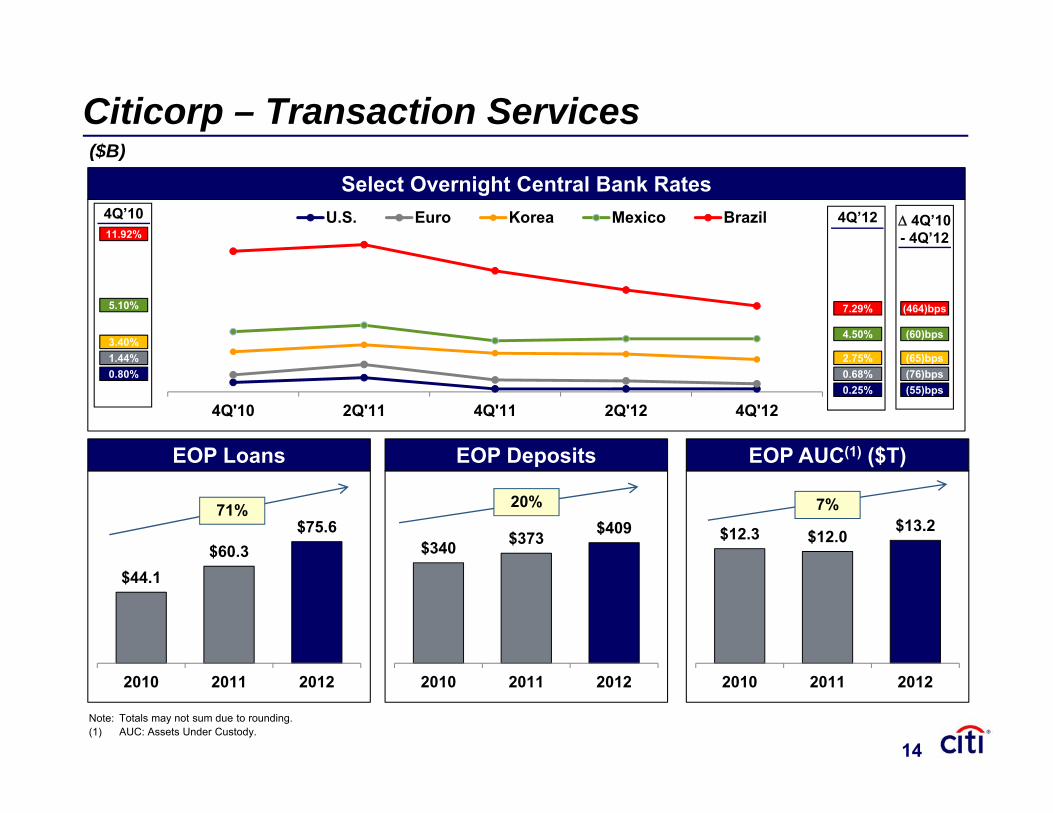
4Q'10 2Q'11 4Q'11 2Q'12 4Q'12
U.S. Euro Korea Mexico Brazil 4Q’1211.92%
3.40%
5.10%
1.44%0.80%
7.29%
2.75%
4.50%
0.68%0.25%
4Q’10 4Q’10- 4Q’12
(464)bps
(65)bps
(60)bps
(76)bps(55)bps
Citicorp – Transaction Services
$44.1$60.3
$75.6
2010 2011 2012
EOP Loans
Select Overnight Central Bank Rates($B)
Note: Totals may not sum due to rounding.(1) AUC: Assets Under Custody.
$340 $373 $409
2010 2011 2012
20%
EOP Deposits
$12.3 $12.0 $13.2
2010 2011 2012
7%
EOP AUC(1) ($T)
71%
14
14
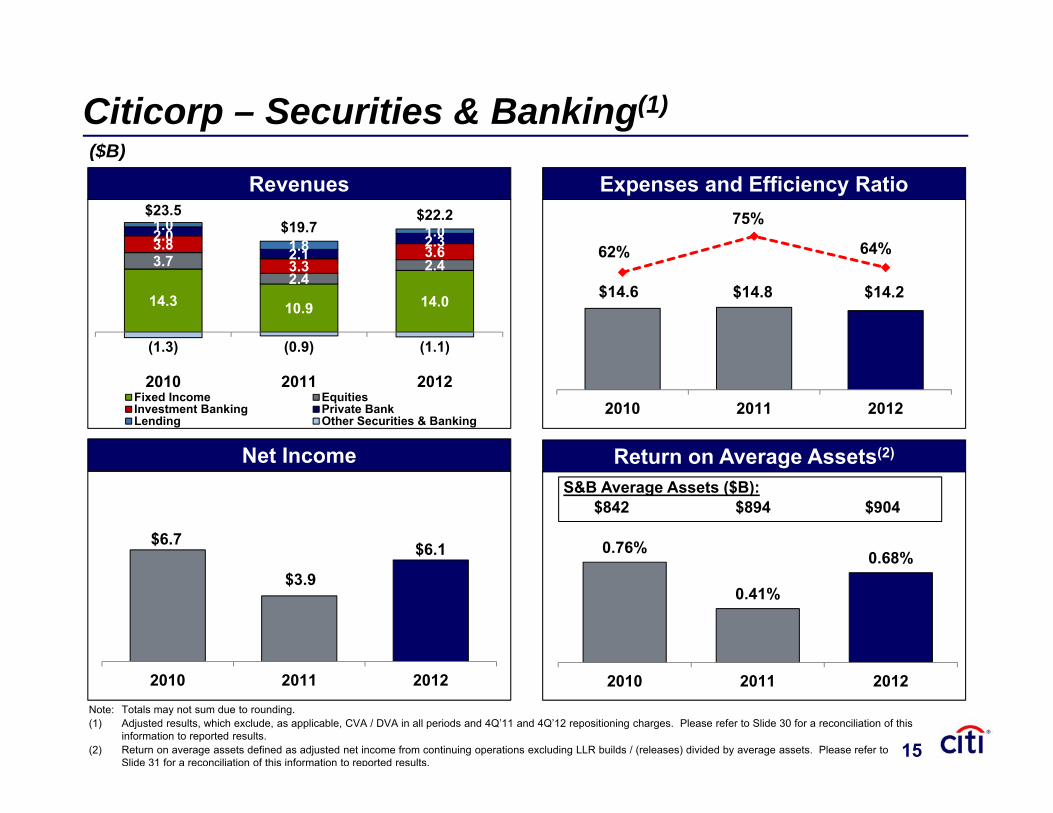
$14.6 $14.8 $14.2
62%
75%
64%
2010 2011 2012
0.76%
0.41%
0.68%
2010 2011 2012
S&B Average Assets ($B): $842 $894 $904
14.3 10.9 14.0
3.7 2.4
2.4 3.8
3.3 3.6
2.0 2.1
2.3 1.0
1.8 1.0
(1.3) (0.9) (1.1)
$23.5$19.7
$22.2
2010 2011 2012Fixed Income EquitiesInvestment Banking Private BankLending Other Securities & Banking
Citicorp – Securities & Banking(1)
$6.7
$3.9
$6.1
2010 2011 2012
Net Income
Revenues($B)
Return on Average Assets(2)
Note: Totals may not sum due to rounding.(1) Adjusted results, which exclude, as applicable, CVA / DVA in all periods and 4Q’11 and 4Q’12 repositioning charges. Please refer to Slide 30 for a reconciliation of this
information to reported results. (2) Return on average assets defined as adjusted net income from continuing operations excluding LLR builds / (releases) divided by average assets. Please refer to
Slide 31 for a reconciliation of this information to reported results.
Expenses and Efficiency Ratio
15
15
2012 Results
Citicorp
Citi Holdings
Expenses and Capital
Conclusions
Agenda
16
16
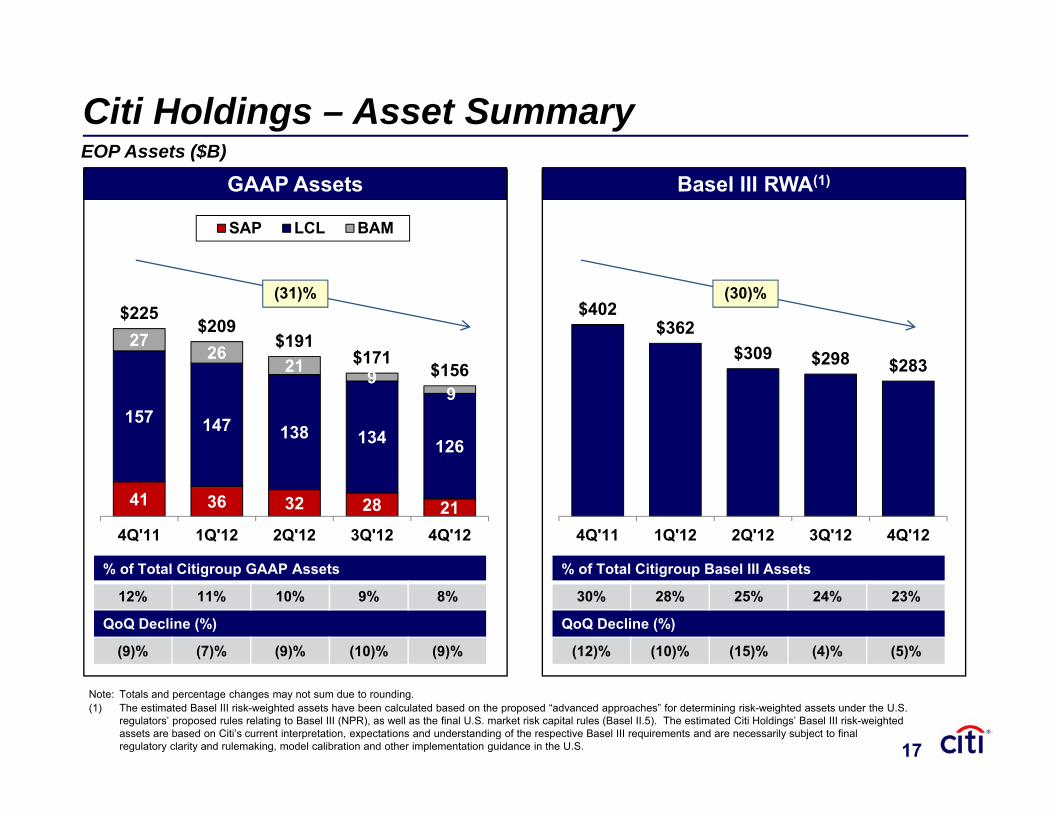
Note: Totals and percentage changes may not sum due to rounding. (1) The estimated Basel III risk-weighted assets have been calculated based on the proposed “advanced approaches” for determining risk-weighted assets under the U.S.
regulators’ proposed rules relating to Basel III (NPR), as well as the final U.S. market risk capital rules (Basel II.5). The estimated Citi Holdings’ Basel III risk-weighted assets are based on Citi’s current interpretation, expectations and understanding of the respective Basel III requirements and are necessarily subject to final regulatory clarity and rulemaking, model calibration and other implementation guidance in the U.S.
Citi Holdings – Asset Summary EOP Assets ($B)
% of Total Citigroup GAAP Assets
12% 11% 10% 9% 8%
QoQ Decline (%)
(9)% (7)% (9)% (10)% (9)%
41 36 32 28 21
157 147 138 134 126
27 26
21 9 9
$225$209
$191$171
$156
4Q'11 1Q'12 2Q'12 3Q'12 4Q'12
SAP LCL BAM
(31)%
GAAP Assets
% of Total Citigroup Basel III Assets
30% 28% 25% 24% 23%
QoQ Decline (%)
(12)% (10)% (15)% (4)% (5)%
$402$362
$309 $298 $283
4Q'11 1Q'12 2Q'12 3Q'12 4Q'12
(30)%
Basel III RWA(1)
17
17
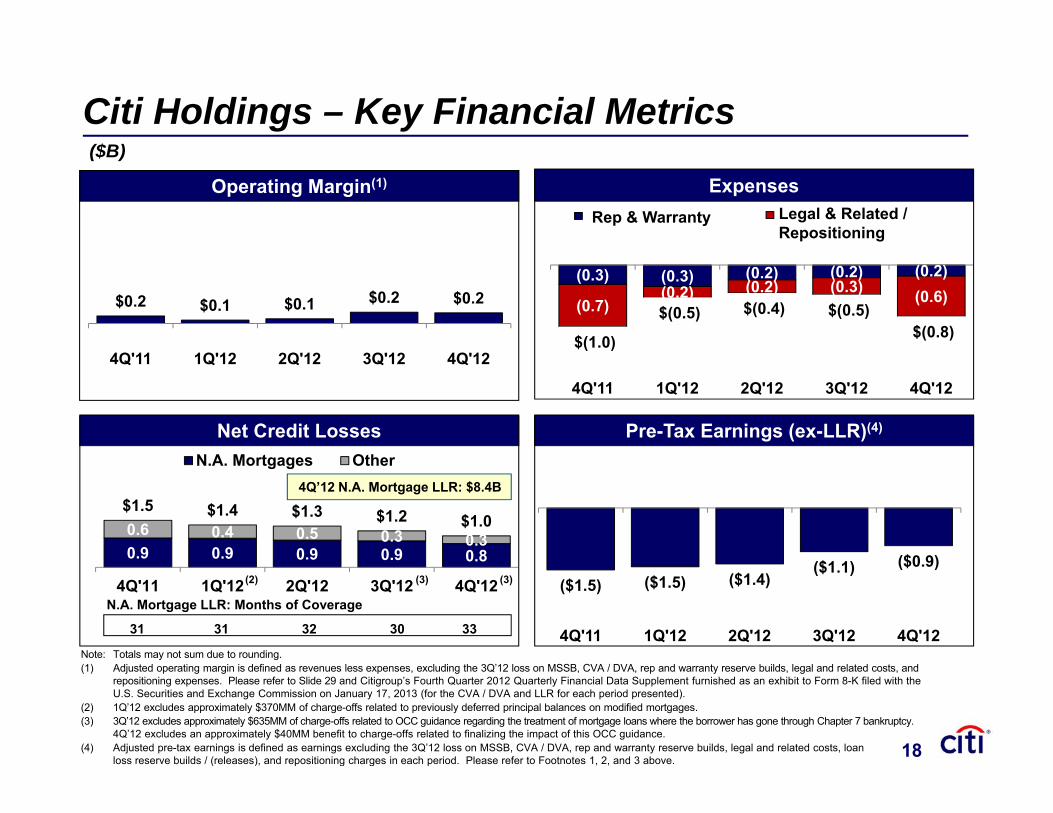
Note: Totals may not sum due to rounding.(1) Adjusted operating margin is defined as revenues less expenses, excluding the 3Q’12 loss on MSSB, CVA / DVA, rep and warranty reserve builds, legal and related costs, and
repositioning expenses. Please refer to Slide 29 and Citigroup’s Fourth Quarter 2012 Quarterly Financial Data Supplement furnished as an exhibit to Form 8-K filed with the U.S. Securities and Exchange Commission on January 17, 2013 (for the CVA / DVA and LLR for each period presented).
(2) 1Q’12 excludes approximately $370MM of charge-offs related to previously deferred principal balances on modified mortgages.(3) 3Q’12 excludes approximately $635MM of charge-offs related to OCC guidance regarding the treatment of mortgage loans where the borrower has gone through Chapter 7 bankruptcy.
4Q’12 excludes an approximately $40MM benefit to charge-offs related to finalizing the impact of this OCC guidance.(4) Adjusted pre-tax earnings is defined as earnings excluding the 3Q’12 loss on MSSB, CVA / DVA, rep and warranty reserve builds, legal and related costs, loan
loss reserve builds / (releases), and repositioning charges in each period. Please refer to Footnotes 1, 2, and 3 above.
$0.2 $0.1 $0.1 $0.2 $0.2
4Q'11 1Q'12 2Q'12 3Q'12 4Q'12
($1.5) ($1.5) ($1.4)($1.1) ($0.9)
4Q'11 1Q'12 2Q'12 3Q'12 4Q'12
Citi Holdings – Key Financial Metrics ($B)
Net Credit Losses Pre-Tax Earnings (ex-LLR)(4)
Expenses
0.9 0.9 0.9 0.9 0.8 0.6 0.4 0.5 0.3 0.3
$1.5 $1.4 $1.3 $1.2 $1.0
4Q'11 1Q'12 2Q'12 3Q'12 4Q'12
N.A. Mortgages Other
N.A. Mortgage LLR: Months of Coverage
(2)
4Q’12 N.A. Mortgage LLR: $8.4B
(3)
31 31 32 30 33
(3)
Operating Margin(1)
(0.3) (0.3) (0.2) (0.2) (0.2)
(0.7)(0.2) (0.2) (0.3) (0.6)
$(1.0)
$(0.5) $(0.4) $(0.5)$(0.8)
4Q'11 1Q'12 2Q'12 3Q'12 4Q'12
Rep & Warranty Legal & Related / Repositioning
18
18
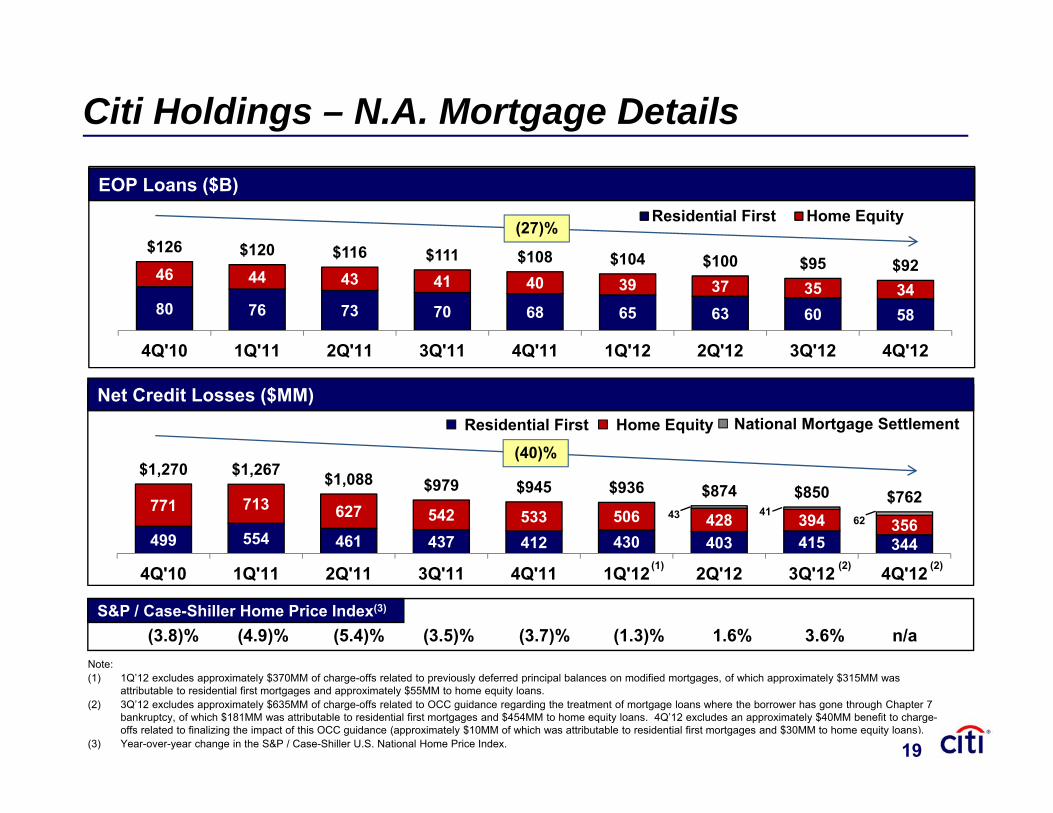
Note:(1) 1Q’12 excludes approximately $370MM of charge-offs related to previously deferred principal balances on modified mortgages, of which approximately $315MM was
attributable to residential first mortgages and approximately $55MM to home equity loans. (2) 3Q’12 excludes approximately $635MM of charge-offs related to OCC guidance regarding the treatment of mortgage loans where the borrower has gone through Chapter 7
bankruptcy, of which $181MM was attributable to residential first mortgages and $454MM to home equity loans. 4Q’12 excludes an approximately $40MM benefit to charge-offs related to finalizing the impact of this OCC guidance (approximately $10MM of which was attributable to residential first mortgages and $30MM to home equity loans).
(3) Year-over-year change in the S&P / Case-Shiller U.S. National Home Price Index.
499 554 461 437 412 430 403 415 344
771 713 627 542 533 506 428 394 356 43 41
62
$1,270 $1,267 $1,088 $979 $945 $936 $874 $850 $762
4Q'10 1Q'11 2Q'11 3Q'11 4Q'11 1Q'12 2Q'12 3Q'12 4Q'12
(3.8)% (4.9)% (5.4)% (3.5)% (3.7)% (1.3)% 1.6% 3.6% n/a
Citi Holdings – N.A. Mortgage Details
S&P / Case-Shiller Home Price Index(3)
80 76 73 70 68 65 63 60 58
46 44 43 41 40 39 37 35 34
$126 $120 $116 $111 $108 $104 $100 $95 $92
4Q'10 1Q'11 2Q'11 3Q'11 4Q'11 1Q'12 2Q'12 3Q'12 4Q'12
Residential First Home Equity
EOP Loans ($B)
(2)
National Mortgage SettlementResidential First Home Equity
(1)
(40)%
(2)
Net Credit Losses ($MM)
(27)%
19
19
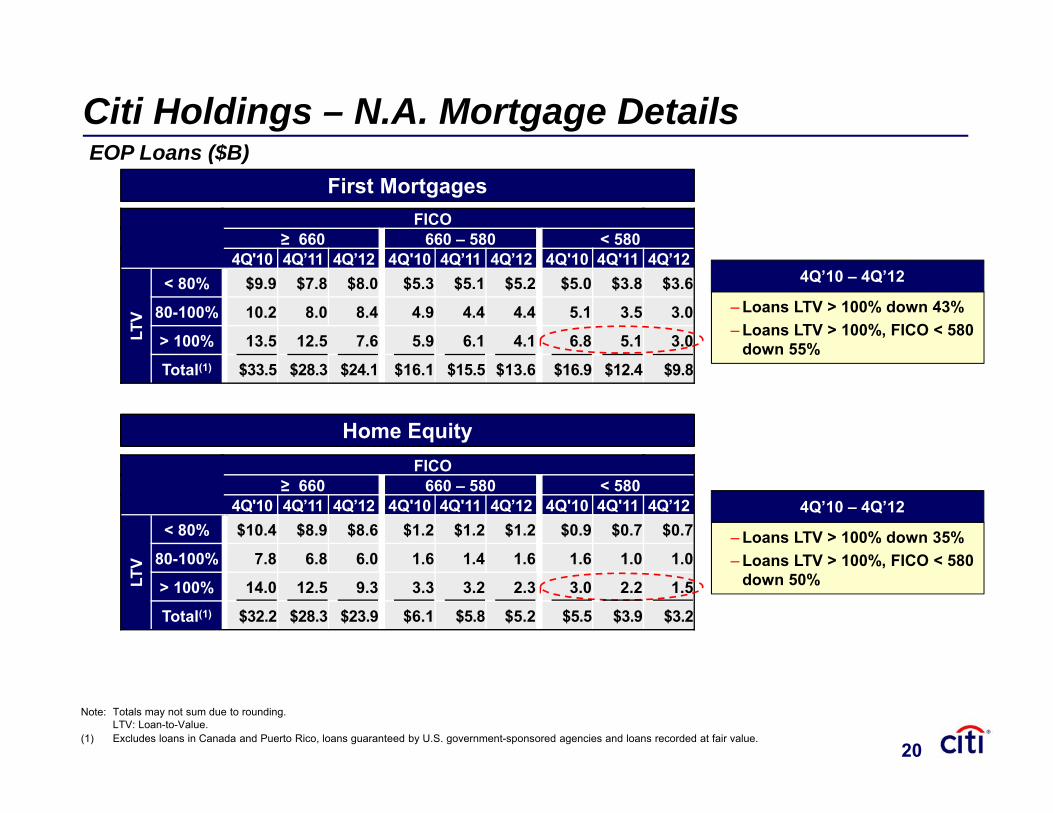
Citi Holdings – N.A. Mortgage Details
Note: Totals may not sum due to rounding. LTV: Loan-to-Value.
(1) Excludes loans in Canada and Puerto Rico, loans guaranteed by U.S. government-sponsored agencies and loans recorded at fair value.
FICO≥ 660 660 – 580 < 580
4Q'10 4Q’11 4Q’12 4Q'10 4Q’11 4Q’12 4Q'10 4Q'11 4Q’12
LTV
< 80% $9.9 $7.8 $8.0 $5.3 $5.1 $5.2 $5.0 $3.8 $3.6
80-100% 10.2 8.0 8.4 4.9 4.4 4.4 5.1 3.5 3.0
> 100% 13.5 12.5 7.6 5.9 6.1 4.1 6.8 5.1 3.0
Total(1) $33.5 $28.3 $24.1 $16.1 $15.5 $13.6 $16.9 $12.4 $9.8
First Mortgages
Home Equity
‒Loans LTV > 100% down 35% ‒Loans LTV > 100%, FICO < 580
down 50%
4Q’10 – 4Q’12
EOP Loans ($B)
FICO≥ 660 660 – 580 < 580
4Q'10 4Q’11 4Q’12 4Q'10 4Q'11 4Q’12 4Q'10 4Q'11 4Q’12
LTV
< 80% $10.4 $8.9 $8.6 $1.2 $1.2 $1.2 $0.9 $0.7 $0.7
80-100% 7.8 6.8 6.0 1.6 1.4 1.6 1.6 1.0 1.0
> 100% 14.0 12.5 9.3 3.3 3.2 2.3 3.0 2.2 1.5
Total(1) $32.2 $28.3 $23.9 $6.1 $5.8 $5.2 $5.5 $3.9 $3.2
‒Loans LTV > 100% down 43% ‒Loans LTV > 100%, FICO < 580
down 55%
4Q’10 – 4Q’12
20
20
2012 Results
Citicorp
Citi Holdings
Expenses and Capital
Conclusions
Agenda
21
21
FY'11 FY'11 Legal &Related and
Repositioning
FX FY'11 OperatingConstant $
Citicorp Citi Holdings FY'12 Operating FY'12 Legal &Related and
Repositioning
FY'12
Legal & Related Repositioning
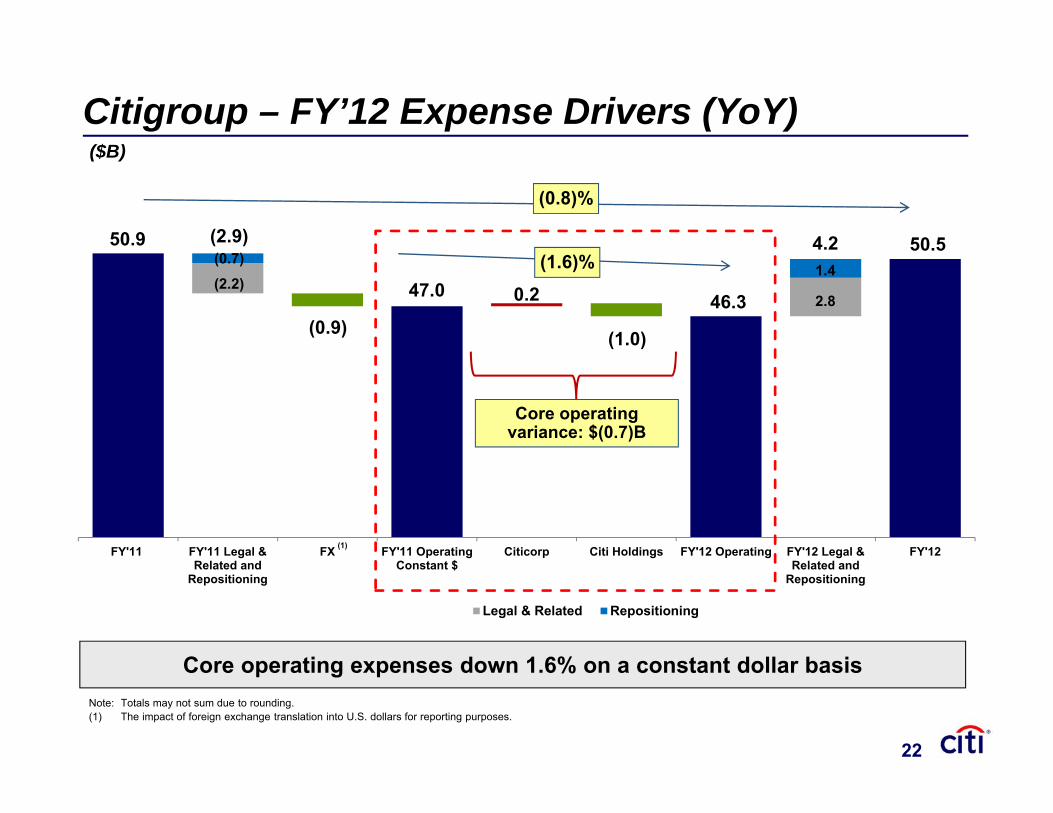
Citigroup – FY’12 Expense Drivers (YoY)
Core operating variance: $(0.7)B
Core operating expenses down 1.6% on a constant dollar basisNote: Totals may not sum due to rounding.(1) The impact of foreign exchange translation into U.S. dollars for reporting purposes.
(1.6)%
($B)
(1)
(0.8)%
(2.9) 4.2
(0.9)
(2.2)(0.7)
1.4
2.80.2
(1.0)
50.9
47.0 46.3
50.5
22
22
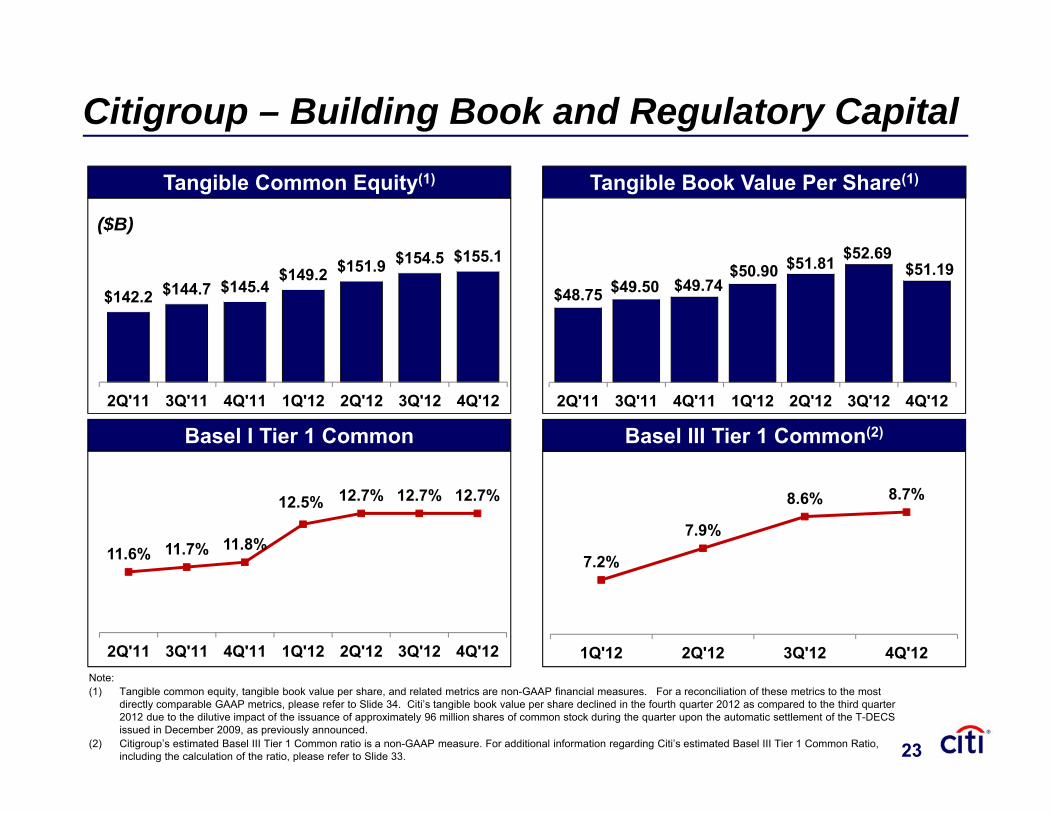
7.2%
7.9%
8.6% 8.7%
1Q'12 2Q'12 3Q'12 4Q'12
$142.2 $144.7 $145.4 $149.2 $151.9 $154.5 $155.1
2Q'11 3Q'11 4Q'11 1Q'12 2Q'12 3Q'12 4Q'12
Basel I Tier 1 Common Basel III Tier 1 Common(2)
($B)
Tangible Book Value Per Share(1)Tangible Common Equity(1)
Citigroup – Building Book and Regulatory Capital
11.6% 11.7% 11.8%
12.5% 12.7% 12.7% 12.7%
2Q'11 3Q'11 4Q'11 1Q'12 2Q'12 3Q'12 4Q'12
$48.75 $49.50 $49.74$50.90 $51.81 $52.69
$51.19
2Q'11 3Q'11 4Q'11 1Q'12 2Q'12 3Q'12 4Q'12
Note:(1) Tangible common equity, tangible book value per share, and related metrics are non-GAAP financial measures. For a reconciliation of these metrics to the most
directly comparable GAAP metrics, please refer to Slide 34. Citi’s tangible book value per share declined in the fourth quarter 2012 as compared to the third quarter 2012 due to the dilutive impact of the issuance of approximately 96 million shares of common stock during the quarter upon the automatic settlement of the T-DECS issued in December 2009, as previously announced.
(2) Citigroup’s estimated Basel III Tier 1 Common ratio is a non-GAAP measure. For additional information regarding Citi’s estimated Basel III Tier 1 Common Ratio, including the calculation of the ratio, please refer to Slide 33. 23
23
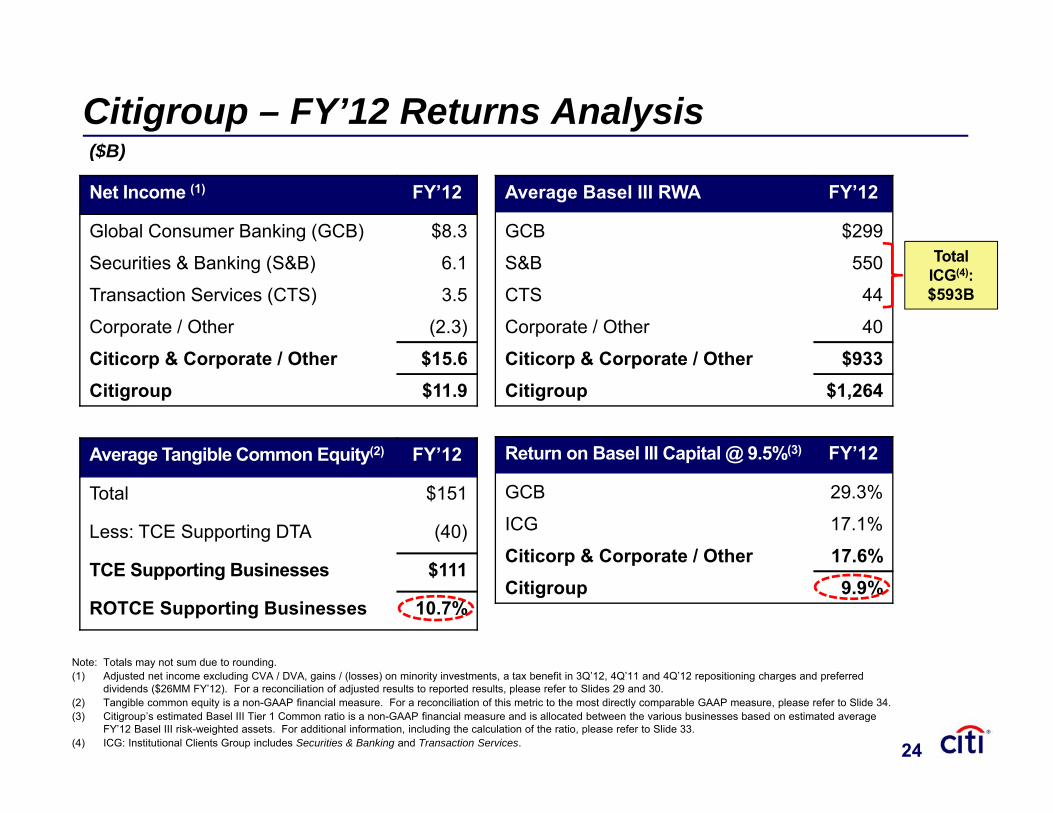
Average Tangible Common Equity(2) FY’12
Total $151
Less: TCE Supporting DTA (40)
TCE Supporting Businesses $111
ROTCE Supporting Businesses 10.7%
Citigroup – FY’12 Returns Analysis
Note: Totals may not sum due to rounding. (1) Adjusted net income excluding CVA / DVA, gains / (losses) on minority investments, a tax benefit in 3Q’12, 4Q’11 and 4Q’12 repositioning charges and preferred
dividends ($26MM FY’12). For a reconciliation of adjusted results to reported results, please refer to Slides 29 and 30.(2) Tangible common equity is a non-GAAP financial measure. For a reconciliation of this metric to the most directly comparable GAAP measure, please refer to Slide 34.(3) Citigroup’s estimated Basel III Tier 1 Common ratio is a non-GAAP financial measure and is allocated between the various businesses based on estimated average
FY’12 Basel III risk-weighted assets. For additional information, including the calculation of the ratio, please refer to Slide 33.(4) ICG: Institutional Clients Group includes Securities & Banking and Transaction Services.
Net Income (1) FY’12
Global Consumer Banking (GCB) $8.3
Securities & Banking (S&B) 6.1
Transaction Services (CTS) 3.5
Corporate / Other (2.3)
Citicorp & Corporate / Other $15.6Citigroup $11.9
Return on Basel III Capital @ 9.5%(3) FY’12
GCB 29.3%
ICG 17.1%
Citicorp & Corporate / Other 17.6%Citigroup 9.9%
Average Basel III RWA FY’12
GCB $299
S&B 550
CTS 44
Corporate / Other 40
Citicorp & Corporate / Other $933Citigroup $1,264
($B)
Total ICG(4):$593B
24
24
2012 Results
Citicorp
Citi Holdings
Expenses and Capital
Conclusions
Agenda
25
25
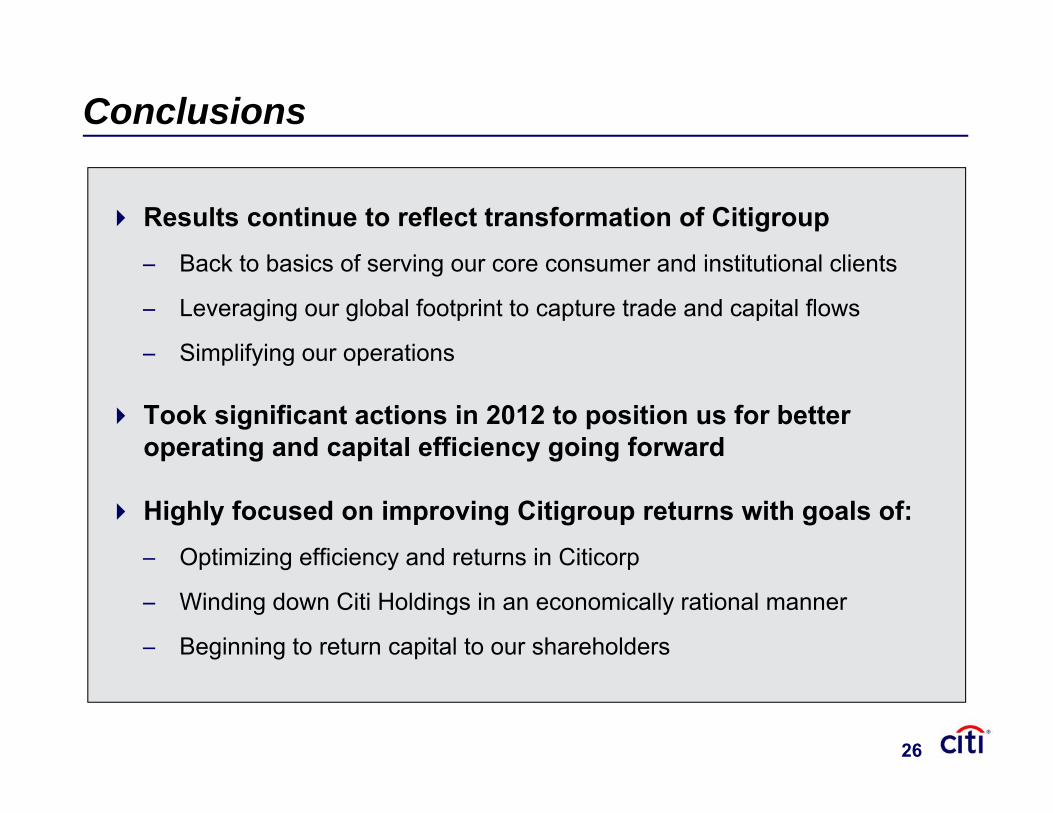
Conclusions
Results continue to reflect transformation of Citigroup– Back to basics of serving our core consumer and institutional clients
– Leveraging our global footprint to capture trade and capital flows
– Simplifying our operations
Took significant actions in 2012 to position us for better operating and capital efficiency going forward
Highly focused on improving Citigroup returns with goals of:– Optimizing efficiency and returns in Citicorp
– Winding down Citi Holdings in an economically rational manner
– Beginning to return capital to our shareholders
26
26
Certain statements in this document are “forward-looking statements” within the meaning of the
rules and regulations of the U.S. Securities and Exchange Commission. These statements are
based on management’s current expectations and are subject to uncertainty and changes in
circumstances. These statements are not guarantees of future results or occurrences. Actual
results and capital and other financial condition may differ materially from those included in
these statements due to a variety of factors, including the precautionary statements included in
this document and those contained in Citigroup’s filings with the U.S. Securities and Exchange
Commission, including without limitation the “Risk Factors” section of Citigroup’s 2011 Form
10-K. Any forward-looking statements made by or on behalf of Citigroup speak only as to the
date they are made, and Citi does not undertake to update forward-looking statements to
reflect the impact of circumstances or events that arise after the date the forward-looking
statements were made.
27
John GerspachChief Financial Officer
February 12, 2013
Credit Suisse Financial Services Forum
28
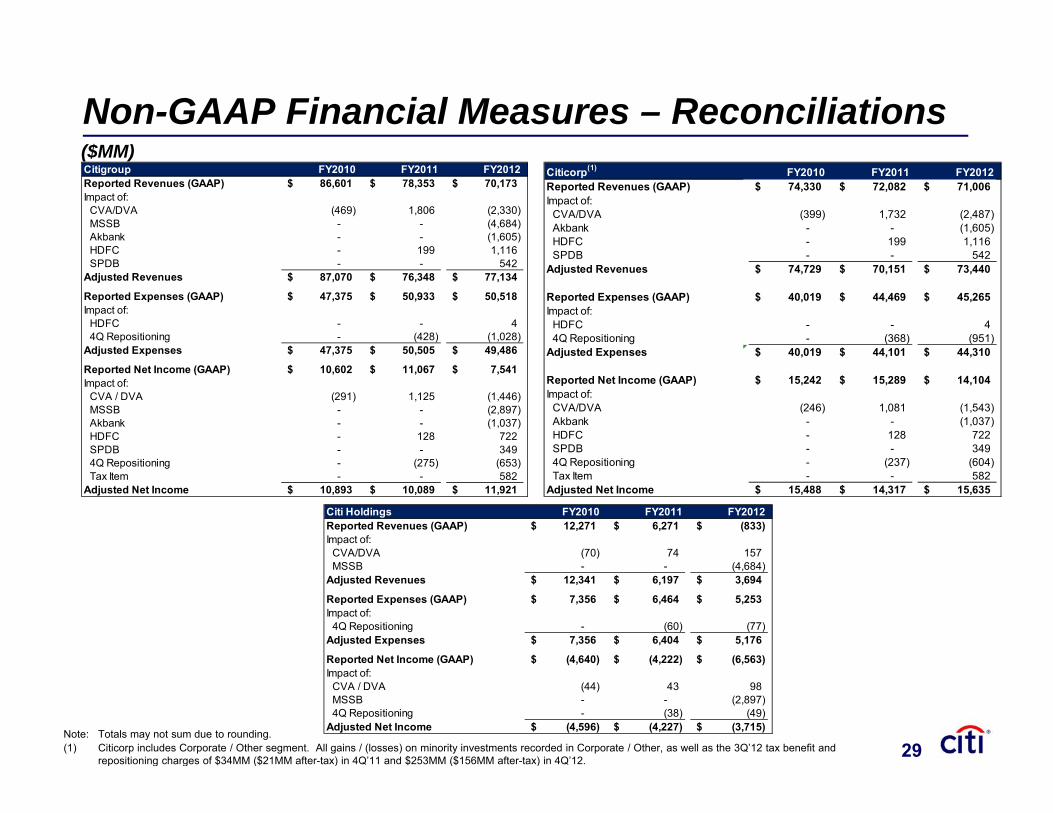
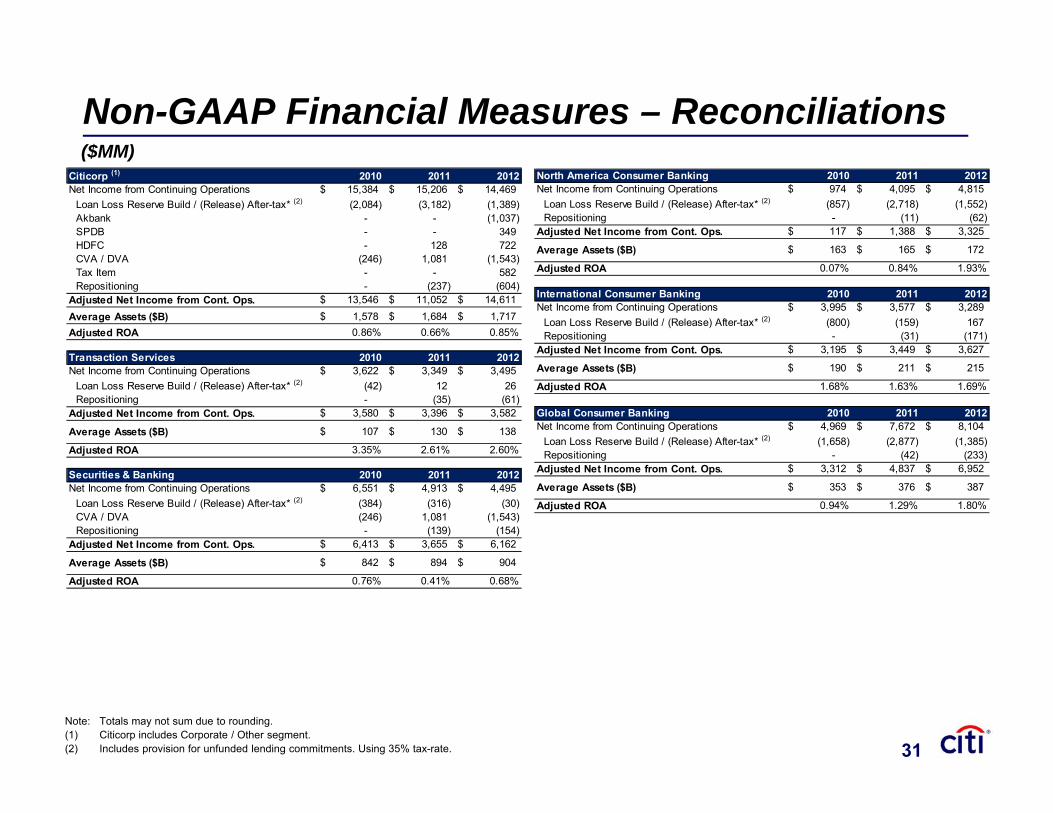
Non-GAAP Financial Measures – Reconciliations($MM)
Note: Totals may not sum due to rounding. (1) Citicorp includes Corporate / Other segment. All gains / (losses) on minority investments recorded in Corporate / Other, as well as the 3Q’12 tax benefit and
repositioning charges of $34MM ($21MM after-tax) in 4Q’11 and $253MM ($156MM after-tax) in 4Q’12.29
Citigroup FY2010 FY2011 FY2012Reported Revenues (GAAP) 86,601$ 78,353$ 70,173$ Impact of:
CVA/DVA (469) 1,806 (2,330) MSSB - - (4,684) Akbank - - (1,605) HDFC - 199 1,116 SPDB - - 542
Adjusted Revenues 87,070$ 76,348$ 77,134$
Reported Expenses (GAAP) 47,375$ 50,933$ 50,518$ Impact of:
HDFC - - 4 4Q Repositioning - (428) (1,028)
Adjusted Expenses 47,375$ 50,505$ 49,486$
Reported Net Income (GAAP) 10,602$ 11,067$ 7,541$ Impact of:
CVA / DVA (291) 1,125 (1,446) MSSB - - (2,897) Akbank - - (1,037) HDFC - 128 722 SPDB - - 349 4Q Repositioning - (275) (653) Tax Item - - 582
Adjusted Net Income 10,893$ 10,089$ 11,921$
Citicorp(1) FY2010 FY2011 FY2012Reported Revenues (GAAP) 74,330$ 72,082$ 71,006$ Impact of:
CVA/DVA (399) 1,732 (2,487) Akbank - - (1,605) HDFC - 199 1,116 SPDB - - 542
Adjusted Revenues 74,729$ 70,151$ 73,440$
Reported Expenses (GAAP) 40,019$ 44,469$ 45,265$ Impact of:
HDFC - - 4 4Q Repositioning - (368) (951)
Adjusted Expenses 40,019$ 44,101$ 44,310$
Reported Net Income (GAAP) 15,242$ 15,289$ 14,104$ Impact of:
CVA/DVA (246) 1,081 (1,543) Akbank - - (1,037) HDFC - 128 722 SPDB - - 349 4Q Repositioning - (237) (604) Tax Item - - 582
Adjusted Net Income 15,488$ 14,317$ 15,635$
Citi Holdings FY2010 FY2011 FY2012Reported Revenues (GAAP) 12,271$ 6,271$ (833)$ Impact of:
CVA/DVA (70) 74 157 MSSB - - (4,684)
Adjusted Revenues 12,341$ 6,197$ 3,694$
Reported Expenses (GAAP) 7,356$ 6,464$ 5,253$ Impact of:
4Q Repositioning - (60) (77) Adjusted Expenses 7,356$ 6,404$ 5,176$
Reported Net Income (GAAP) (4,640)$ (4,222)$ (6,563)$ Impact of:
CVA / DVA (44) 43 98 MSSB - - (2,897) 4Q Repositioning - (38) (49)
Adjusted Net Income (4,596)$ (4,227)$ (3,715)$
29
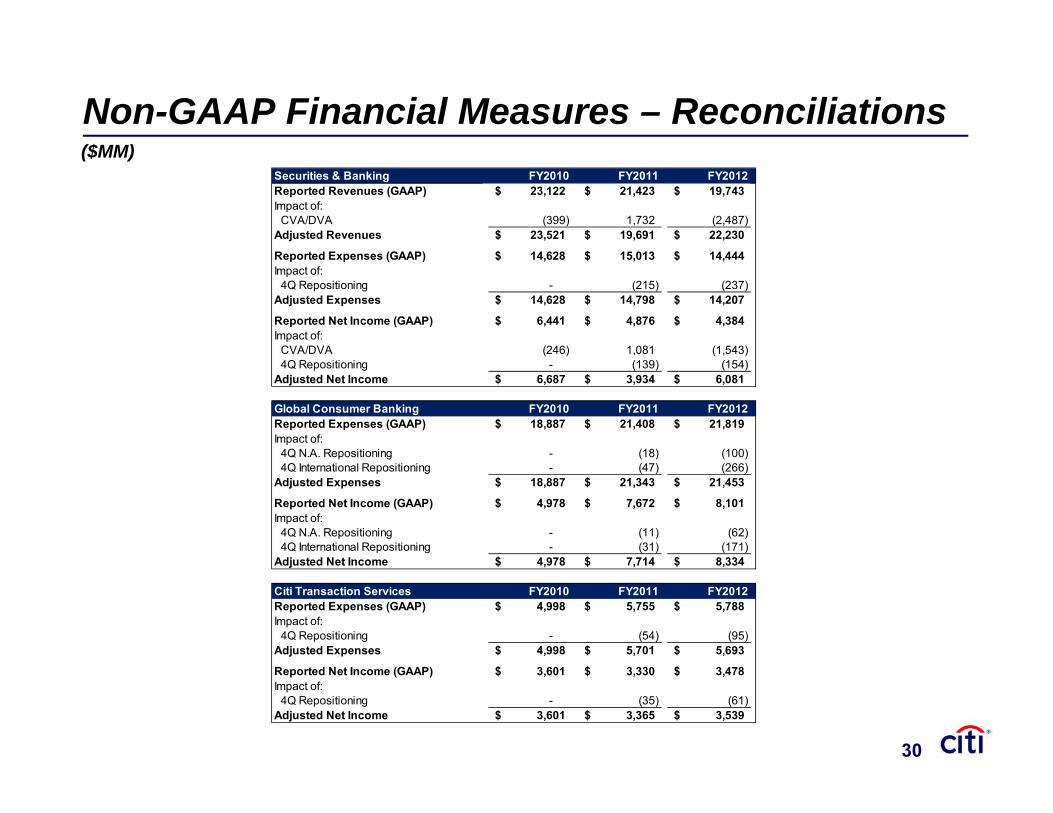
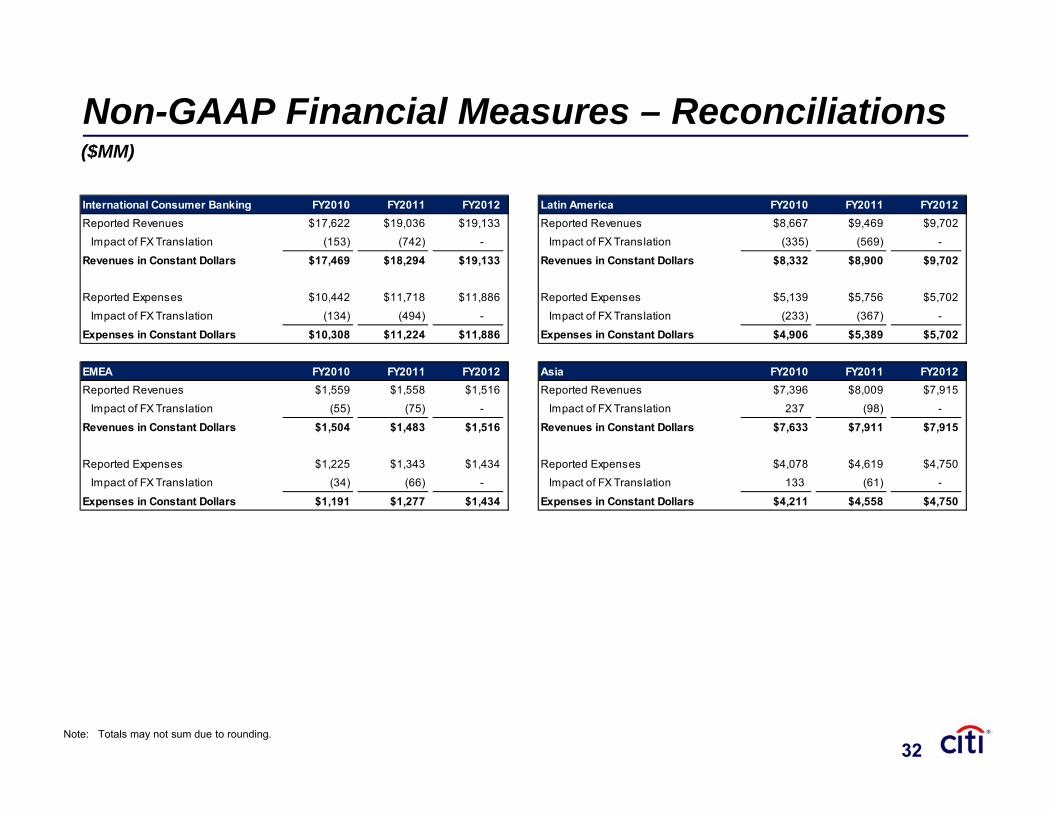
Non-GAAP Financial Measures – Reconciliations($MM)
30
Securities & Banking FY2010 FY2011 FY2012Reported Revenues (GAAP) 23,122$ 21,423$ 19,743$ Impact of:
CVA/DVA (399) 1,732 (2,487) Adjusted Revenues 23,521$ 19,691$ 22,230$
Reported Expenses (GAAP) 14,628$ 15,013$ 14,444$ Impact of:
4Q Repositioning - (215) (237) Adjusted Expenses 14,628$ 14,798$ 14,207$
Reported Net Income (GAAP) 6,441$ 4,876$ 4,384$ Impact of:
CVA/DVA (246) 1,081 (1,543) 4Q Repositioning - (139) (154)
Adjusted Net Income 6,687$ 3,934$ 6,081$
Global Consumer Banking FY2010 FY2011 FY2012Reported Expenses (GAAP) 18,887$ 21,408$ 21,819$ Impact of:
4Q N.A. Repositioning - (18) (100) 4Q International Repositioning - (47) (266)
Adjusted Expenses 18,887$ 21,343$ 21,453$
Reported Net Income (GAAP) 4,978$ 7,672$ 8,101$ Impact of:
4Q N.A. Repositioning - (11) (62) 4Q International Repositioning - (31) (171)
Adjusted Net Income 4,978$ 7,714$ 8,334$
Citi Transaction Services FY2010 FY2011 FY2012Reported Expenses (GAAP) 4,998$ 5,755$ 5,788$ Impact of:
4Q Repositioning - (54) (95) Adjusted Expenses 4,998$ 5,701$ 5,693$
Reported Net Income (GAAP) 3,601$ 3,330$ 3,478$ Impact of:
4Q Repositioning - (35) (61) Adjusted Net Income 3,601$ 3,365$ 3,539$
30Note: Totals may not sum due to rounding. (1) Citicorp includes Corporate / Other segment. (2) Includes provision for unfunded lending commitments. Using 35% tax-rate.
Non-GAAP Financial Measures – Reconciliations($MM)
North America Consumer Banking 2010 2011 2012Net Income from Continuing Operations 974$ 4,095$ 4,815$
Loan Loss Reserve Build / (Release) After-tax* (2) (857) (2,718) (1,552) Repositioning - (11) (62)
Adjusted Net Income from Cont. Ops. 117$ 1,388$ 3,325$
Average Assets ($B) 163$ 165$ 172$
Adjusted ROA 0.07% 0.84% 1.93%
International Consumer Banking 2010 2011 2012Net Income from Continuing Operations 3,995$ 3,577$ 3,289$
Loan Loss Reserve Build / (Release) After-tax* (2) (800) (159) 167 Repositioning - (31) (171)
Adjusted Net Income from Cont. Ops. 3,195$ 3,449$ 3,627$
Average Assets ($B) 190$ 211$ 215$
Adjusted ROA 1.68% 1.63% 1.69%
Global Consumer Banking 2010 2011 2012Net Income from Continuing Operations 4,969$ 7,672$ 8,104$
Loan Loss Reserve Build / (Release) After-tax* (2) (1,658) (2,877) (1,385) Repositioning - (42) (233)
Adjusted Net Income from Cont. Ops. 3,312$ 4,837$ 6,952$
Average Assets ($B) 353$ 376$ 387$
Adjusted ROA 0.94% 1.29% 1.80%
Citicorp (1) 2010 2011 2012Net Income from Continuing Operations 15,384$ 15,206$ 14,469$
Loan Loss Reserve Build / (Release) After-tax* (2) (2,084) (3,182) (1,389) Akbank - - (1,037) SPDB - - 349 HDFC - 128 722 CVA / DVA (246) 1,081 (1,543) Tax Item - - 582 Repositioning - (237) (604)
Adjusted Net Income from Cont. Ops. 13,546$ 11,052$ 14,611$ Average Assets ($B) 1,578$ 1,684$ 1,717$ Adjusted ROA 0.86% 0.66% 0.85%
Transaction Services 2010 2011 2012Net Income from Continuing Operations 3,622$ 3,349$ 3,495$
Loan Loss Reserve Build / (Release) After-tax* (2) (42) 12 26 Repositioning - (35) (61)
Adjusted Net Income from Cont. Ops. 3,580$ 3,396$ 3,582$
Average Assets ($B) 107$ 130$ 138$
Adjusted ROA 3.35% 2.61% 2.60%
Securities & Banking 2010 2011 2012Net Income from Continuing Operations 6,551$ 4,913$ 4,495$
Loan Loss Reserve Build / (Release) After-tax* (2) (384) (316) (30) CVA / DVA (246) 1,081 (1,543) Repositioning - (139) (154)
Adjusted Net Income from Cont. Ops. 6,413$ 3,655$ 6,162$
Average Assets ($B) 842$ 894$ 904$
Adjusted ROA 0.76% 0.41% 0.68%
31
31
Non-GAAP Financial Measures – Reconciliations($MM)
Note: Totals may not sum due to rounding.
Latin America FY2010 FY2011 FY2012Reported Revenues $8,667 $9,469 $9,702
Impact of FX Translation (335) (569) -
Revenues in Constant Dollars $8,332 $8,900 $9,702
Reported Expenses $5,139 $5,756 $5,702
Impact of FX Translation (233) (367) -
Expenses in Constant Dollars $4,906 $5,389 $5,702
Asia FY2010 FY2011 FY2012Reported Revenues $7,396 $8,009 $7,915
Impact of FX Translation 237 (98) -
Revenues in Constant Dollars $7,633 $7,911 $7,915
Reported Expenses $4,078 $4,619 $4,750
Impact of FX Translation 133 (61) -
Expenses in Constant Dollars $4,211 $4,558 $4,750
International Consumer Banking FY2010 FY2011 FY2012Reported Revenues $17,622 $19,036 $19,133
Impact of FX Translation (153) (742) -
Revenues in Constant Dollars $17,469 $18,294 $19,133
Reported Expenses $10,442 $11,718 $11,886
Impact of FX Translation (134) (494) -
Expenses in Constant Dollars $10,308 $11,224 $11,886
EMEA FY2010 FY2011 FY2012Reported Revenues $1,559 $1,558 $1,516
Impact of FX Translation (55) (75) -
Revenues in Constant Dollars $1,504 $1,483 $1,516
Reported Expenses $1,225 $1,343 $1,434
Impact of FX Translation (34) (66) -
Expenses in Constant Dollars $1,191 $1,277 $1,434
32
32
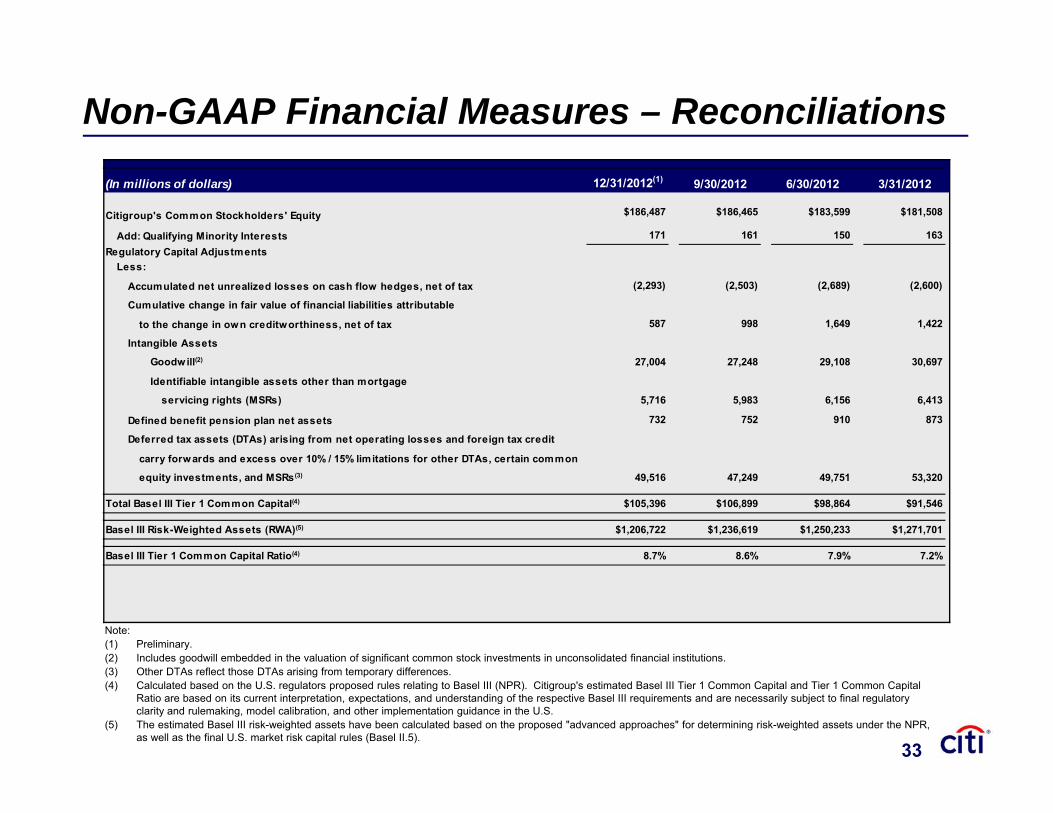
Note:(1) Preliminary.(2) Includes goodwill embedded in the valuation of significant common stock investments in unconsolidated financial institutions.(3) Other DTAs reflect those DTAs arising from temporary differences.(4) Calculated based on the U.S. regulators proposed rules relating to Basel III (NPR). Citigroup's estimated Basel III Tier 1 Common Capital and Tier 1 Common Capital
Ratio are based on its current interpretation, expectations, and understanding of the respective Basel III requirements and are necessarily subject to final regulatory clarity and rulemaking, model calibration, and other implementation guidance in the U.S.
(5) The estimated Basel III risk-weighted assets have been calculated based on the proposed "advanced approaches" for determining risk-weighted assets under the NPR, as well as the final U.S. market risk capital rules (Basel II.5).
Non-GAAP Financial Measures – Reconciliations
33
(In millions of dollars) 12/31/2012(1) 9/30/2012 6/30/2012 3/31/2012
Citigroup's Common Stockholders' Equity $186,487 $186,465 $183,599 $181,508
Add: Qualifying Minority Interests 171 161 150 163Regulatory Capital Adjustments
Less:
Accumulated net unrealized losses on cash flow hedges, net of tax (2,293) (2,503) (2,689) (2,600)
Cumulative change in fair value of financial liabilities attributable
to the change in own creditworthiness, net of tax 587 998 1,649 1,422
Intangible Assets
Goodwill(2) 27,004 27,248 29,108 30,697
Identifiable intangible assets other than mortgage
servicing rights (MSRs) 5,716 5,983 6,156 6,413
Defined benefit pension plan net assets 732 752 910 873
Deferred tax assets (DTAs) arising from net operating losses and foreign tax credit
carry forwards and excess over 10% / 15% limitations for other DTAs, certain common
equity investments, and MSRs(3) 49,516 47,249 49,751 53,320
Total Basel III Tier 1 Common Capital(4) $105,396 $106,899 $98,864 $91,546
Basel III Risk-Weighted Assets (RWA)(5) $1,206,722 $1,236,619 $1,250,233 $1,271,701
Basel III Tier 1 Common Capital Ratio(4) 8.7% 8.6% 7.9% 7.2%
33
($ millions, except per share amounts) 3Q'10 4Q'10 1Q'11 2Q'11 3Q'11 4Q'11 1Q'12 2Q'12 3Q'12
Citigroup's Total Stockholders' Equity $162,913 $163,468 $171,037 $176,364 $177,372 $177,806 $181,820 $183,911 $186,777 Less: Preferred Stock 312 312 312 312 312 312 312 312 312
Common Stockholders' Equity 162,601 163,156 170,725 176,052 177,060 177,494 181,508 183,599 186,465
Less: Goodwill 25,797 26,152 26,339 26,621 25,496 25,413 25,810 25,483 25,932
Intangible Assets (other than Mortgage Servicing Rights) 7,705 7,504 7,280 7,136 6,800 6,600 6,413 6,156 5,963
Goodwill and Intangible Assets - Recorded as Assets Held for Sale / Assets of Discont. Operations Held for Sale - - 165 - - - - - -
Net Deferred Tax Assets Related to Goodwill and Intangible Assets 59 56 53 50 47 44 41 38 35
Tangible Common Equity (TCE) $129,040 $129,444 $136,888 $142,245 $144,717 $145,437 $149,244 $151,922 $154,535Average Tangible Common Equity $125,169 $129,242 $133,166 $139,567 $143,481 $145,077 $147,341 $150,583 $154,535
Common Shares Outstanding at Quarter-end 2,905 2,906 2,921 2,918 2,924 2,924 2,932 2,933 2,933
Tangible Book Value Per Share $44.42 $44.55 $46.87 $48.75 $49.50 $49.74 $50.90 51.81$ 52.70$
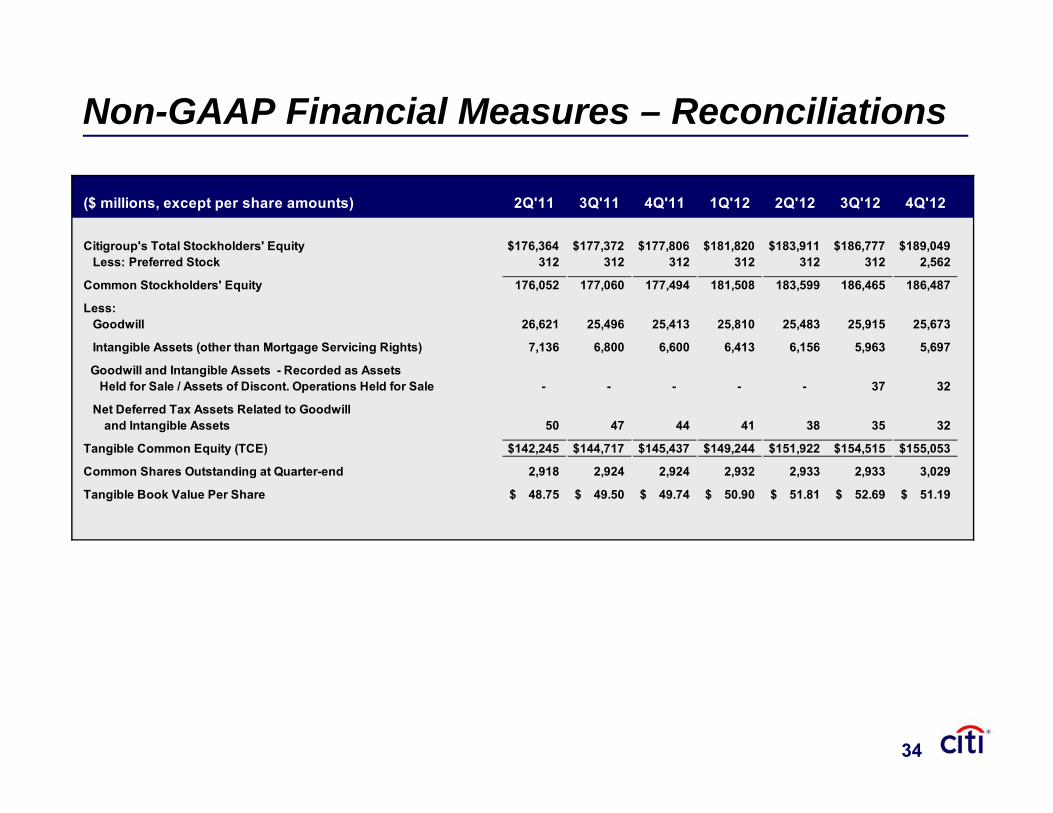
Non-GAAP Financial Measures – Reconciliations
34
($ millions, except per share amounts) 2Q'11 3Q'11 4Q'11 1Q'12 2Q'12 3Q'12 4Q'12
Citigroup's Total Stockholders' Equity $176,364 $177,372 $177,806 $181,820 $183,911 $186,777 $189,049 Less: Preferred Stock 312 312 312 312 312 312 2,562
Common Stockholders' Equity 176,052 177,060 177,494 181,508 183,599 186,465 186,487
Less: Goodwill 26,621 25,496 25,413 25,810 25,483 25,915 25,673
Intangible Assets (other than Mortgage Servicing Rights) 7,136 6,800 6,600 6,413 6,156 5,963 5,697
Goodwill and Intangible Assets - Recorded as Assets Held for Sale / Assets of Discont. Operations Held for Sale - - - - - 37 32
Net Deferred Tax Assets Related to Goodwill and Intangible Assets 50 47 44 41 38 35 32
Tangible Common Equity (TCE) $142,245 $144,717 $145,437 $149,244 $151,922 $154,515 $155,053
Common Shares Outstanding at Quarter-end 2,918 2,924 2,924 2,932 2,933 2,933 3,029
Tangible Book Value Per Share 48.75$ 49.50$ 49.74$ 50.90$ 51.81$ 52.69$ 51.19$