Embed Size (px)
Citation preview

2016 EDITION
FINANCIAL REPORT CRÉDIT MUTUEL GROUPTHE BANK OF THE FUTURE
3
Annual report 2016
MANAGEMENT REPORT OF THE BOARD OF DIRECTORSOF CONFÉDÉRATION NATIONALE DU CRÉDIT MUTUEL P 4
Economic and financial context p 4
The group’s activity and results p 6
Analysis by sector of activity p 8
Results by activity and reporting by country p 9
Shareholders’ equity and risk exposure p 11
FINANCIAL STATEMENTS P 24
Balance sheet p 24
Income statement p 25
Statement of changes in shareholders’ equity p 26
Statement of cash flows p 28
Notes to the financial statements p 30
INDEPENDENT AUDITOR’S REPORTON THE CONSOLIDATED FINANCIAL STATEMENTS P 96
CONTENTS
FINANCIAL REPORTMANAGEMENT REPORT
4
Crédit Mutuel Group
5
Annual report 2016
ECONOMIC AND FINANCIAL Context
GROwTH IN 2016 ROBUST ENOUGH TO wITHSTAND POLITICAL UPHEAvALS
Global growth remained moderate in 2016. It was affected by ongoing challenges in emerging countries while developed countries continued to benefit from cheap oil and very low interest rates. This all changed with the election of Donald Trump as president of the United States and the increase in oil prices throughout the year, setting the stage for an even wider divergence in 2017. Differences are already visible in monetary policy, with the Fed on a tightening path and other major central banks firmly accommodative. RENEwED CONCERNS AT THE START OF THE yEAR
As early as January, the steeper fall in the yuan and in China’s currency reserves, combined with a weak US industrial sector, sparked concerns about global growth. This caused the financial markets to fall and oil prices to plunge, with the WTI price hitting a low of $27 in mid-February. Deflation fears subsequently took hold and were kept alive by the monetary war waged by the central banks, between the Fed’s caution, the ECB’s proactivity and the Bank of Japan’s creativity. In March, the ECB thus announced new measures such as additional cuts to key rates, an increase in monthly asset purchase amounts to €80 billion, the inclusion of non-financial corporate bonds, and a new long-term lending program for banks.
Global growth was more resilient than expected in the second quarter, due mainly to the economic rebound in China. The Chinese authorities proved they were still able to control growth by again employing traditional economic stimulus measures, in particular the use of bank loans and real estate-friendly measures. The acceleration in investment offset the decline in consumption and external trade and halted the slowdown in the eurozone economy. However, uncertainties in the run-up to the Brexit vote clouded the picture by breeding caution, including in the United States and Asia. The Fed was therefore able to justify maintaining its accommodative monetary policy while Japan faced challenges due to the appreciation of the yen, which investors viewed as a safe haven.
ATTENTION FOCUSED ON BRExIT
Starting on June 23, all eyes turned to Europe where the pro-Brexit vote prevailed, posing a challenge to both the United Kingdom and the European project. While economic growth in these two regions remains unaffected (for now), the political uncertainty is real and is stifling investment; this bodes ill for 2017. On top of these political tensions, the Italian banking system is facing difficulties, which poses a challenge to the rules established by the European Union that prevent governments from directly bailing out banks. At the same time, the US economy proved resilient and the Fed began to prepare to normalize its monetary policy. The trend was also positive in emerging countries, and for Brazil and Russia in particular, which were finally able to start to regain some ground due to the rebound in oil prices, while OPEC countries reached an agreement in Algiers at end-September to limit their production.
AT END-2016, THE US ELECTION LED TO RENEwED OPTIMISM ON THE MARkETS
The last quarter was dominated by the surprise election of Donald Trump as president of the United States on November 8. All asset classes were affected by this event, which in particular triggered inflation expectations and lifted US bond yields (with a ripple effect on yields in the rest of the world) and the dollar. The equity markets were not to be outdone and even hit some all-time highs, buoyed by the optimism of investors who had largely incorporated a “soft Trump” scenario (lower taxes and fiscal stimulus without protectionism). Europe also benefited from the return of risk appetite, although growth failed to take off as consumption and investment remained hampered by the high degree of uncertainty. The second event at the end of the year was OPEC’s agreement to reduce oil production from early 2017. This sparked a further rise in oil prices, thereby supporting the major oil-producing emerging countries (mainly Russia and Brazil). Conversely, Europe and China could be adversely affected by the additional challenge of higher oil prices, which will limit household purchasing power. THE FRENCH ECONOMy REACTED TO THE GLOBAL ENvIRONMENT IN 2016, BUT wITH A SLIGHT LAG At the beginning of the year, the French economy benefited from the favorable global environment (low commodity prices and low interest rates). It accelerated sharply on the back of strong household consumption
and the ongoing rebound in investment. The uncertainties surrounding global growth and the rebound in the euro subsequently eroded this surge in internal momentum, which slowed to a standstill in the second and third quarters despite the government’s stimulus measures.
The “El Khomri” law and the extension of the signing bonus and of the extra depreciation mechanism played a role in bolstering French companies. An improvement was also seen in the real estate sector due to ongoing rate cuts, leading to a rebound in existing home transactions. The construction sector benefited from the tax incentives offered by the authorities, which prompted a recovery in housing starts and building permits. As a result, the construction sector’s negative contribution to investment and growth gradually leveled off. Economic signals brightened at the end of the year, although the environment was not as buoyant due to the increase in oil prices and sovereign yields. This improvement can be seen in the positive trend in the business climate, the rebound in industrial output and the decline in the number of category A unemployed (i.e., those required to actively look for work). However, the growth profile is likely to improve only moderately, while a wait-and-see attitude will prevail ahead of the French elections and higher energy prices will erode household purchasing power.
The year therefore ended on a promising note, but uncertainties are particularly high for 2017 whether in the United States, with Trump, in Europe, with a busy election calendar and progress on the Brexit negotiations, and in China, with capital outflows and the ongoing risk of a hard landing. Overall, the most likely scenario nevertheless remains that of a modest acceleration in growth.
MANAGEMENT REPORT of the board of directors of Confédération Nationale du Crédit Mutuel on the 2016 consolidated financial statements
FINANCIAL REPORTMANAGEMENT REPORT
6
Crédit Mutuel Group
7
Annual report 2016
The main changes in the consolidation scope arose from:– the acquisition of Keytrade in Belgium, – the acquisition of General Electric’s leasing and
factoring activities in France and Germany,– the assumption of exclusive control over Targobank
Spain, and– the sale of Banque Pasche and of LFP Nexity Services
Immobiliers.
THE INTEREST MARGIN (€6.899 BILLION) CONTINUED TO FALL (-2.5%) AND DID SO AT A FASTER PACE THAN IN 2015 (-1.7%) DUE TO THE LOw INTEREST RATE ENvIRONMENT AND THE IMPORTANCE OF REGULATED SAvINGS
The net margin on transactions with credit institutions accounted for most of this change and moved into negative territory for the first time (-€50 million versus €210 million in 2015). The low interest rate environment had a significant impact on overnight and futures transactions. The net margin on transactions with customers fell by €149 million to €8.664 billion.
The various components of interest margin are related in particular to changes in the following items:
Customer deposits: €358.195 billion, up 8.9%Changes in customer deposits reflect the economic situation, particularly interest rate conditions:– Current accounts in credit increased by €14.8 billion to
€126.2 billion as a result of the wait-and-see approach taken by account holders in light of interest rates. Deposits excluding current accounts grew by 6.7%;
– Momentum in home savings plans (plans épargne logement - PELs) continued with a €3.9 billion increase to €38.4 billion;
– Ordinary passbooks recorded a 26.0% increase to €35.8 billion;
– Growth in Livret bleu and Livret A passbook savings resumed with a 4.2% increase to €39.5 billion.
Funds collected are centralized at the CDC (€26.1 billion), with 43.8% of all funds centralized in 2016, including popular savings book accounts and capitalization accounts, versus 45% at end-2015.
Customer loans and advances: €415.052 billion, an increase of 7.5% or €29.1 billion
Home loans, representing 50.1% of total loans, rose by 3.8% to €208.1 billion.
Equipment loans were up by 23.1% to €88.4 billion. Factoring loans benefited from the acquisition of the General Electric entities (€6.9 billion) as well as from finance leasing and operating leases (€2.5 billion).
Growth was steady in consumer credit, with a 6.6% increase to €39.9 billion due to strong new lending at the branch networks and specialized subsidiaries.
COMMISSION INCOME ROSE by €59 million, or 1.5%. This performance stemmed mainly from fees for accounts and services, offsetting the decline in loan fees (early repayments) and in financial fees.
Net income on other activities fell by a slight €9 million (down 0.2%) to €4.114 billion, in line with the insurance activities.
INCOME FROM THE FAIR vALUE THROUGH PROFIT OR LOSS AND AFS PORTFOLIOS INCREASED SUBSTANTIALLy
The net gain recognized for these portfolios was €1.872 billion versus €1.240 billion in 2015, mainly as a result of sales of securities (including Visa).
THIS RESULTED IN A 3.1% INCREASE IN NET BANkING INCOME TO €16.8 BILLION.
GENERAL OPERATING ExPENSES INCREASED By €364 million, of which €162 million related to changes in scope.
ThE GROUP’S ACtIVItY AnD ReSULtS The Board of Directors of the Confédération Nationale du Crédit Mutuel opted to prepare consolidated financial statements at the national level in accordance with International Financial Reporting Standards as adopted by the European Commission, even though it is not publicly traded.
The Board of Directors approved the consolidated financial statements for the year ended December 31, 2016 at its meeting on March 7, 2017 and presented them, together with this report, to the General Meeting for its approval.
Payroll costs rose by 1.4% to €6.184 billion, of which €92 million stemmed from changes in scope.
Crédit Mutuel Group employed 81,657 people in 2016 (average level, reasoning on a full-time equivalent basis), which represents a 3.6% increase. This growth was due primarily to the integration of the General Electric, Targobank Spain and Keytrade Bank entities. Excluding these entities, the increase would have been 1.2%.
Other operating expenses rose by €249 million to €3.770 billion, €66 million of which was for changes in scope, €84 million for taxes and levies (contributions to the Single Resolution Fund (SRF) and the Fonds de Garantie des Dépôts et de Résolution (French deposit guarantee and resolution fund, or FGDR)) and €113 million for external services. For French entities and foreign entities, 85% and 100%, respectively, of the contribution to the SRF is recorded under expenses, i.e., €105 million. The remaining 15% is recorded under assets as a collateralized payment commitment.
Depreciation, amortization and provisions rose by €29 million to €721 million.
Overall, the cost-to-income ratio was virtually flat at 63.5% in 2016 versus 63.2% in 2015.
NET ADDITIONS TO/REvERSALS FROM PROvISIONS FOR LOAN LOSSES DECLINED by €39 million, consisting of a €25 million decrease in incurred risk and a €14 million drop in non-incurred risk. Restated for changes in scope, the overall decrease was 14.8%, or -€144 million.
As regards the quality of risks: the proportion of impaired loans was 3.92% compared with 4.08% a year earlier. Excluding collective provisions, the coverage rate for these loans reached 58.8% compared with 60.0% in 2015.
Gains and losses on other assets, standing at a €43 million gain versus a €14 million loss in 2015, resulted from capital gains on the sale of real estate in 2016.
In 2016, the changes in the share of equity-accounted investments and in goodwill related to the Spanish entities.
NET INCOME ATTRIBUTABLE TO OwNERS OF THE COMPANy ROSE SIGNIFICANTLy, UP 7.7% TO €3.253 BILLION…
…. AND THE GROUP’S SHAREHOLDERS’ EqUITy INCREASED FURTHER, UP 5.3% TO €49.540 BILLION
This increase was due mainly to:– a €120 million capital reduction to €9.992 billion; – the transfer to reserves of much of the 2015 annual
net income; – the €3.253 billion in net income generated in 2016; and – the €1.874 billion in net unrealized capital gains at the
group level (down by €269 million from €2.143 billion in 2015), due primarily to Visa Inc.’s definitive acquisition of Visa Europe (-€264 million) and actuarial differences related to employee benefits.
It should be noted that the impact on shareholders’ equity for prudential purposes differs because of the application of the filters imposed by European regulations and the differences in the consolidation methods applied to some entities, notably insurance undertakings.The return on assets, calculated in accordance with the requirements of Article R. 511-16-1 of the Monetary and Financial Code, was 0.41% compared with 0.42% in 2015.
This financial strength was confirmed by Standard & Poor’s, which assigned Crédit Mutuel Group a long-term rating of A with stable outlook.Banque Fédérative du Crédit Mutuel (the holding company of CM11 Group) is rated Aa3 (stable outlook) by Moody’s and A+ (stable outlook) by Fitch.
FINANCIAL REPORTMANAGEMENT REPORT
8
Crédit Mutuel Group
9
Annual report 2016
Retail Banking comprises the networks of Crédit Mutuel’s regional federations and CIC’s regional banks. This segment also includes some of the specialized activities whose products and services are marketed by the networks such as finance leasing, factoring, real estate businesses (investment, land development, real estate management, distribution and property development) and collective management of products distributed by the network.
Insurance is considered a separate segment given its importance in the group’s activities. The group has historically been the leading bank in this area, having started its bankinsurance activity in 1970. The segment covers both life and non-life insurance.
Corporate and Investment Banking covers financing for large corporate and institutional customers, value-added financing activities, private equity, international activities and capital markets activities, whether on the group’s own behalf or on behalf of customers, including stock market intermediation.
Asset Management and Private Banking comprises the subsidiaries that are mainly engaged in private banking, both in France and abroad, together with the asset management and employee savings activities.
Other activities cover all the activities that cannot be assigned to any of the above segments, together with subsidiaries involved purely in logistical support, whose expenses are generally re-billed to the other entities. They include intermediate holding companies, companies owning the property used in the group’s operations, and media and IT subsidiaries.
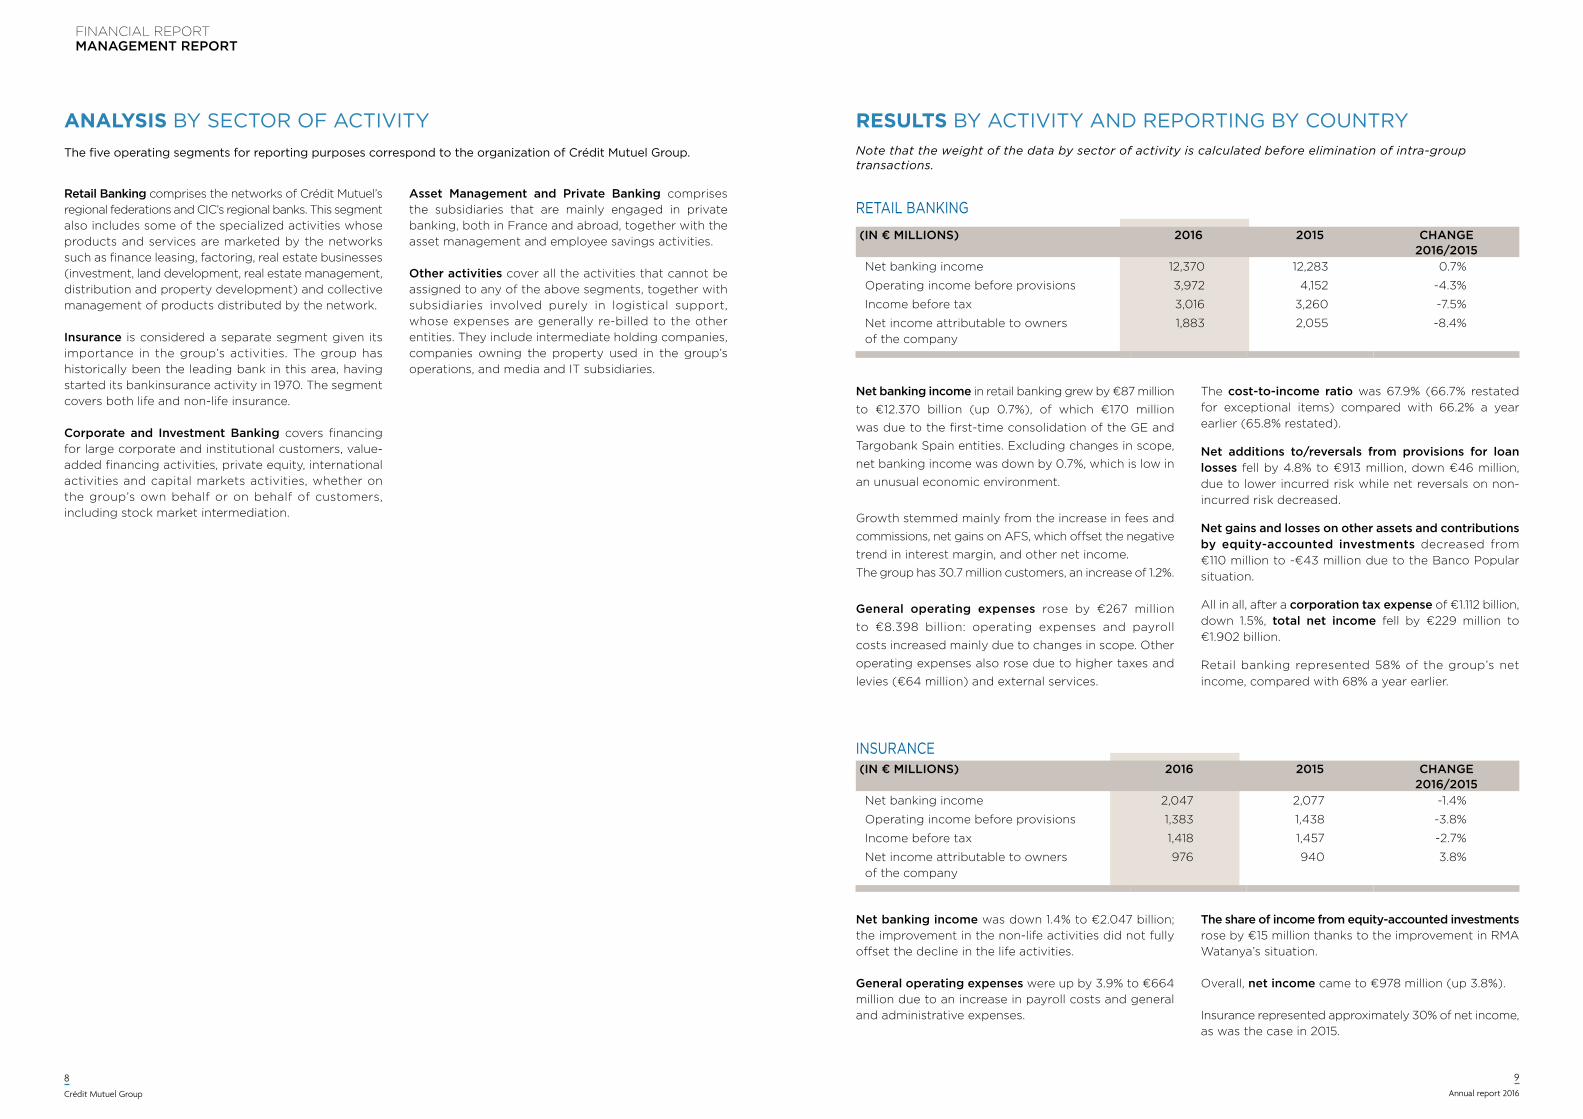
AnALYSIS BY SECTOR OF ACTIVITYThe five operating segments for reporting purposes correspond to the organization of Crédit Mutuel Group.
RETAIL BANKING
(in € millions) 2016 2015 CHAnGE 2016/2015
Net banking income 12,370 12,283 0.7%
Operating income before provisions 3,972 4,152 -4.3%
Income before tax 3,016 3,260 -7.5%
Net income attributable to owners of the company
1,883 2,055 -8.4%
Note that the weight of the data by sector of activity is calculated before elimination of intra-group transactions.
ReSULtS BY ACTIVITY AND REPORTING BY COUNTRY
Net banking income in retail banking grew by €87 million
to €12.370 billion (up 0.7%), of which €170 million
was due to the first-time consolidation of the GE and
Targobank Spain entities. Excluding changes in scope,
net banking income was down by 0.7%, which is low in
an unusual economic environment.
Growth stemmed mainly from the increase in fees and
commissions, net gains on AFS, which offset the negative
trend in interest margin, and other net income.
The group has 30.7 million customers, an increase of 1.2%.
General operating expenses rose by €267 million
to €8.398 billion: operating expenses and payroll
costs increased mainly due to changes in scope. Other
operating expenses also rose due to higher taxes and
levies (€64 million) and external services.
The cost-to-income ratio was 67.9% (66.7% restated for exceptional items) compared with 66.2% a year earlier (65.8% restated).
Net additions to/reversals from provisions for loan losses fell by 4.8% to €913 million, down €46 million, due to lower incurred risk while net reversals on non-incurred risk decreased.
Net gains and losses on other assets and contributions by equity-accounted investments decreased from €110 million to -€43 million due to the Banco Popular situation.
All in all, after a corporation tax expense of €1.112 billion, down 1.5%, total net income fell by €229 million to €1.902 billion.
Retail banking represented 58% of the group’s net income, compared with 68% a year earlier.
(in € millions) 2016 2015 CHAnGE 2016/2015
Net banking income 2,047 2,077 -1.4%
Operating income before provisions 1,383 1,438 -3.8%
Income before tax 1,418 1,457 -2.7%
Net income attributable to owners of the company
976 940 3.8%
INSURANCE
Net banking income was down 1.4% to €2.047 billion; the improvement in the non-life activities did not fully offset the decline in the life activities.
General operating expenses were up by 3.9% to €664 million due to an increase in payroll costs and general and administrative expenses.
The share of income from equity-accounted investments rose by €15 million thanks to the improvement in RMA Watanya’s situation.
Overall, net income came to €978 million (up 3.8%).
Insurance represented approximately 30% of net income, as was the case in 2015.
FINANCIAL REPORTMANAGEMENT REPORT
10
Crédit Mutuel Group
11
Annual report 2016
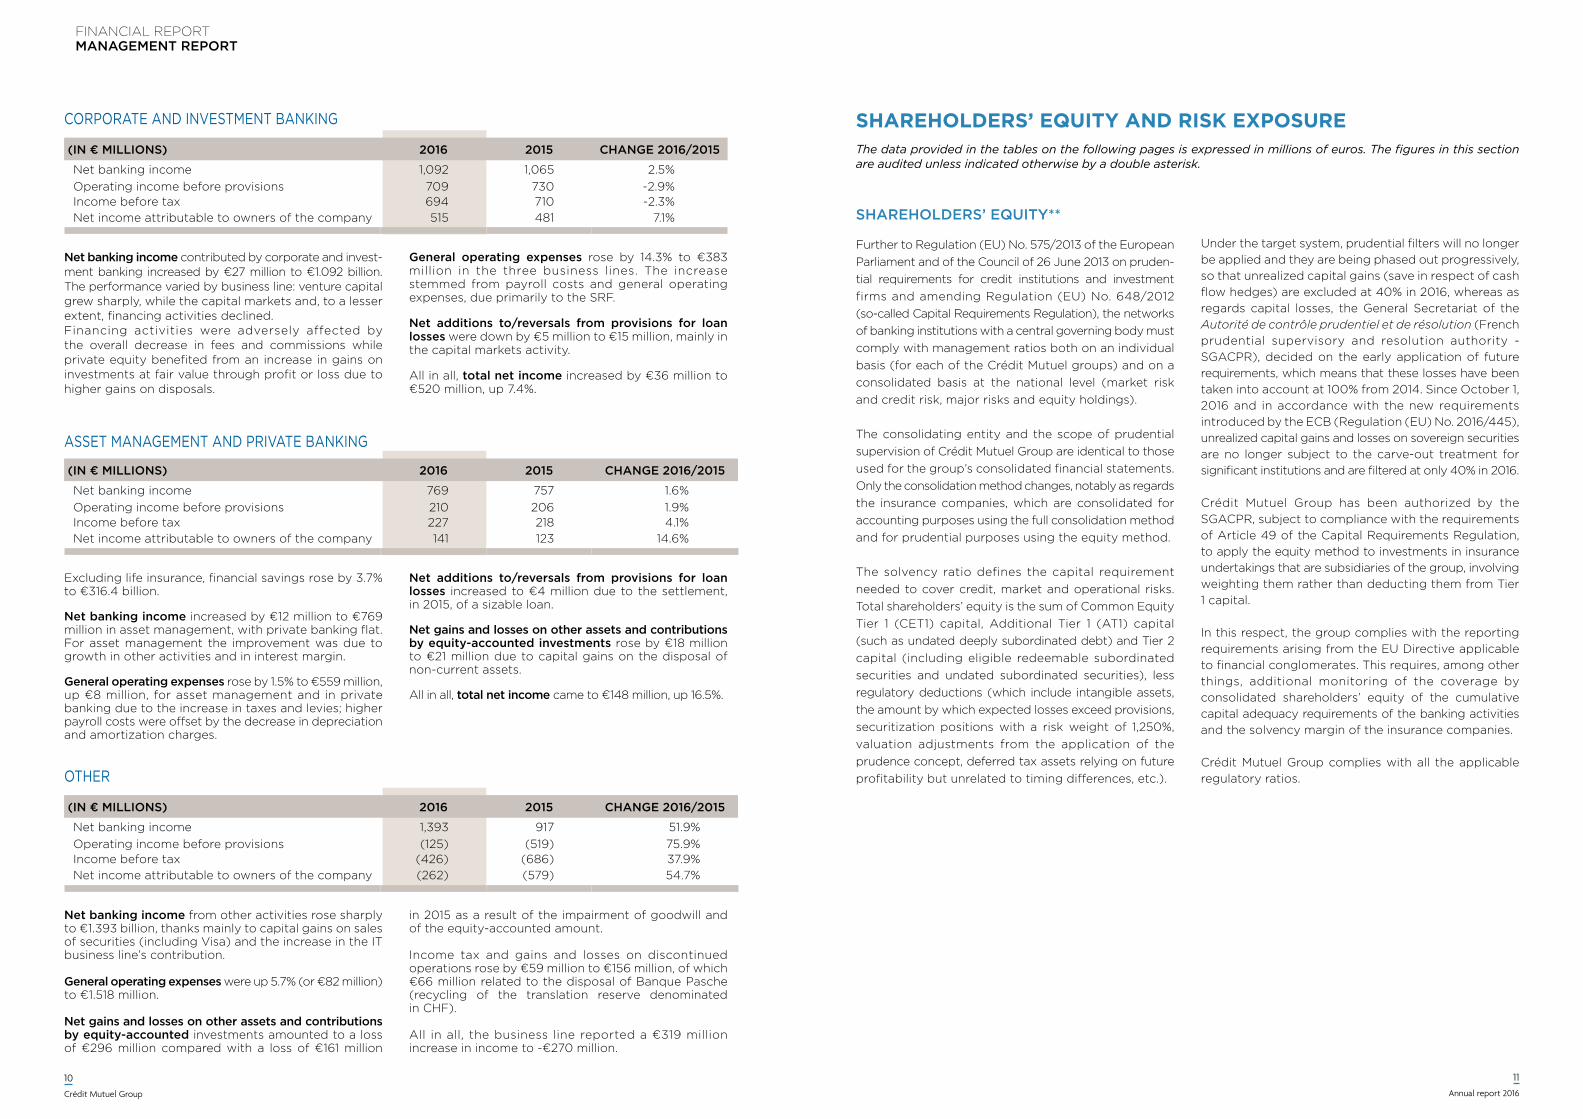
CORPORATE AND INVESTMENT BANKING
(in € millions) 2016 2015 CHAnGE 2016/2015
Net banking income 1,092 1,065 2.5%Operating income before provisions 709 730 -2.9%Income before tax 694 710 -2.3%Net income attributable to owners of the company 515 481 7.1%
Net banking income contributed by corporate and invest-ment banking increased by €27 million to €1.092 billion. The performance varied by business line: venture capital grew sharply, while the capital markets and, to a lesser extent, financing activities declined.Financing activities were adversely affected by the overall decrease in fees and commissions while private equity benefited from an increase in gains on investments at fair value through profit or loss due to higher gains on disposals.
General operating expenses rose by 14.3% to €383 million in the three business lines. The increase stemmed from payroll costs and general operating expenses, due primarily to the SRF.
Net additions to/reversals from provisions for loan losses were down by €5 million to €15 million, mainly in the capital markets activity.
All in all, total net income increased by €36 million to €520 million, up 7.4%.
ASSET MANAGEMENT AND PRIVATE BANKING
Excluding life insurance, financial savings rose by 3.7% to €316.4 billion.
Net banking income increased by €12 million to €769 million in asset management, with private banking flat. For asset management the improvement was due to growth in other activities and in interest margin.
General operating expenses rose by 1.5% to €559 million, up €8 million, for asset management and in private banking due to the increase in taxes and levies; higher payroll costs were offset by the decrease in depreciation and amortization charges.
Net additions to/reversals from provisions for loan losses increased to €4 million due to the settlement, in 2015, of a sizable loan.
Net gains and losses on other assets and contributions by equity-accounted investments rose by €18 million to €21 million due to capital gains on the disposal of non-current assets.
All in all, total net income came to €148 million, up 16.5%.
(in € millions) 2016 2015 CHAnGE 2016/2015
Net banking income 769 757 1.6%Operating income before provisions 210 206 1.9%Income before tax 227 218 4.1%Net income attributable to owners of the company 141 123 14.6%
Net banking income from other activities rose sharply to €1.393 billion, thanks mainly to capital gains on sales of securities (including Visa) and the increase in the IT business line’s contribution.
General operating expenses were up 5.7% (or €82 million) to €1.518 million.
Net gains and losses on other assets and contributions by equity-accounted investments amounted to a loss of €296 million compared with a loss of €161 million
in 2015 as a result of the impairment of goodwill and of the equity-accounted amount.
Income tax and gains and losses on discontinued operations rose by €59 million to €156 million, of which €66 million related to the disposal of Banque Pasche (recycling of the translation reserve denominated in CHF).
All in all, the business line reported a €319 million increase in income to -€270 million.
OThER
(in € millions) 2016 2015 CHAnGE 2016/2015
Net banking income 1,393 917 51.9%Operating income before provisions (125) (519) 75.9%Income before tax (426) (686) 37.9%Net income attributable to owners of the company (262) (579) 54.7%
The data provided in the tables on the following pages is expressed in millions of euros. The figures in this section are audited unless indicated otherwise by a double asterisk.
SHAReHoLDeRS’ eQUItY AnD RISK exPoSURe
SHAREHOLDERS’ EqUITy**
Further to Regulation (EU) No. 575/2013 of the European Parliament and of the Council of 26 June 2013 on pruden-tial requirements for credit institutions and investment firms and amending Regulation (EU) No. 648/2012 (so-called Capital Requirements Regulation), the networks of banking institutions with a central governing body must comply with management ratios both on an individual basis (for each of the Crédit Mutuel groups) and on a consolidated basis at the national level (market risk and credit risk, major risks and equity holdings).
The consolidating entity and the scope of prudential supervision of Crédit Mutuel Group are identical to those used for the group’s consolidated financial statements. Only the consolidation method changes, notably as regards the insurance companies, which are consolidated for accounting purposes using the full consolidation method and for prudential purposes using the equity method.
The solvency ratio defines the capital requirement needed to cover credit, market and operational risks. Total shareholders’ equity is the sum of Common Equity Tier 1 (CET1) capital, Additional Tier 1 (AT1) capital (such as undated deeply subordinated debt) and Tier 2 capital (including eligible redeemable subordinated securities and undated subordinated securities), less regulatory deductions (which include intangible assets, the amount by which expected losses exceed provisions, securitization positions with a risk weight of 1,250%, valuation adjustments from the application of the prudence concept, deferred tax assets relying on future profitability but unrelated to timing differences, etc.).
Under the target system, prudential filters will no longer be applied and they are being phased out progressively, so that unrealized capital gains (save in respect of cash flow hedges) are excluded at 40% in 2016, whereas as regards capital losses, the General Secretariat of the Autorité de contrôle prudentiel et de résolution (French prudential supervisory and resolution authority - SGACPR), decided on the early application of future requirements, which means that these losses have been taken into account at 100% from 2014. Since October 1, 2016 and in accordance with the new requirements introduced by the ECB (Regulation (EU) No. 2016/445), unrealized capital gains and losses on sovereign securities are no longer subject to the carve-out treatment for significant institutions and are filtered at only 40% in 2016.
Crédit Mutuel Group has been authorized by the SGACPR, subject to compliance with the requirements of Article 49 of the Capital Requirements Regulation, to apply the equity method to investments in insurance undertakings that are subsidiaries of the group, involving weighting them rather than deducting them from Tier 1 capital.
In this respect, the group complies with the reporting requirements arising from the EU Directive applicable to financial conglomerates. This requires, among other things, additional monitoring of the coverage by consolidated shareholders’ equity of the cumulative capital adequacy requirements of the banking activities and the solvency margin of the insurance companies.
Crédit Mutuel Group complies with all the applicable regulatory ratios.
FINANCIAL REPORTMANAGEMENT REPORT
12
Crédit Mutuel Group
13
Annual report 2016
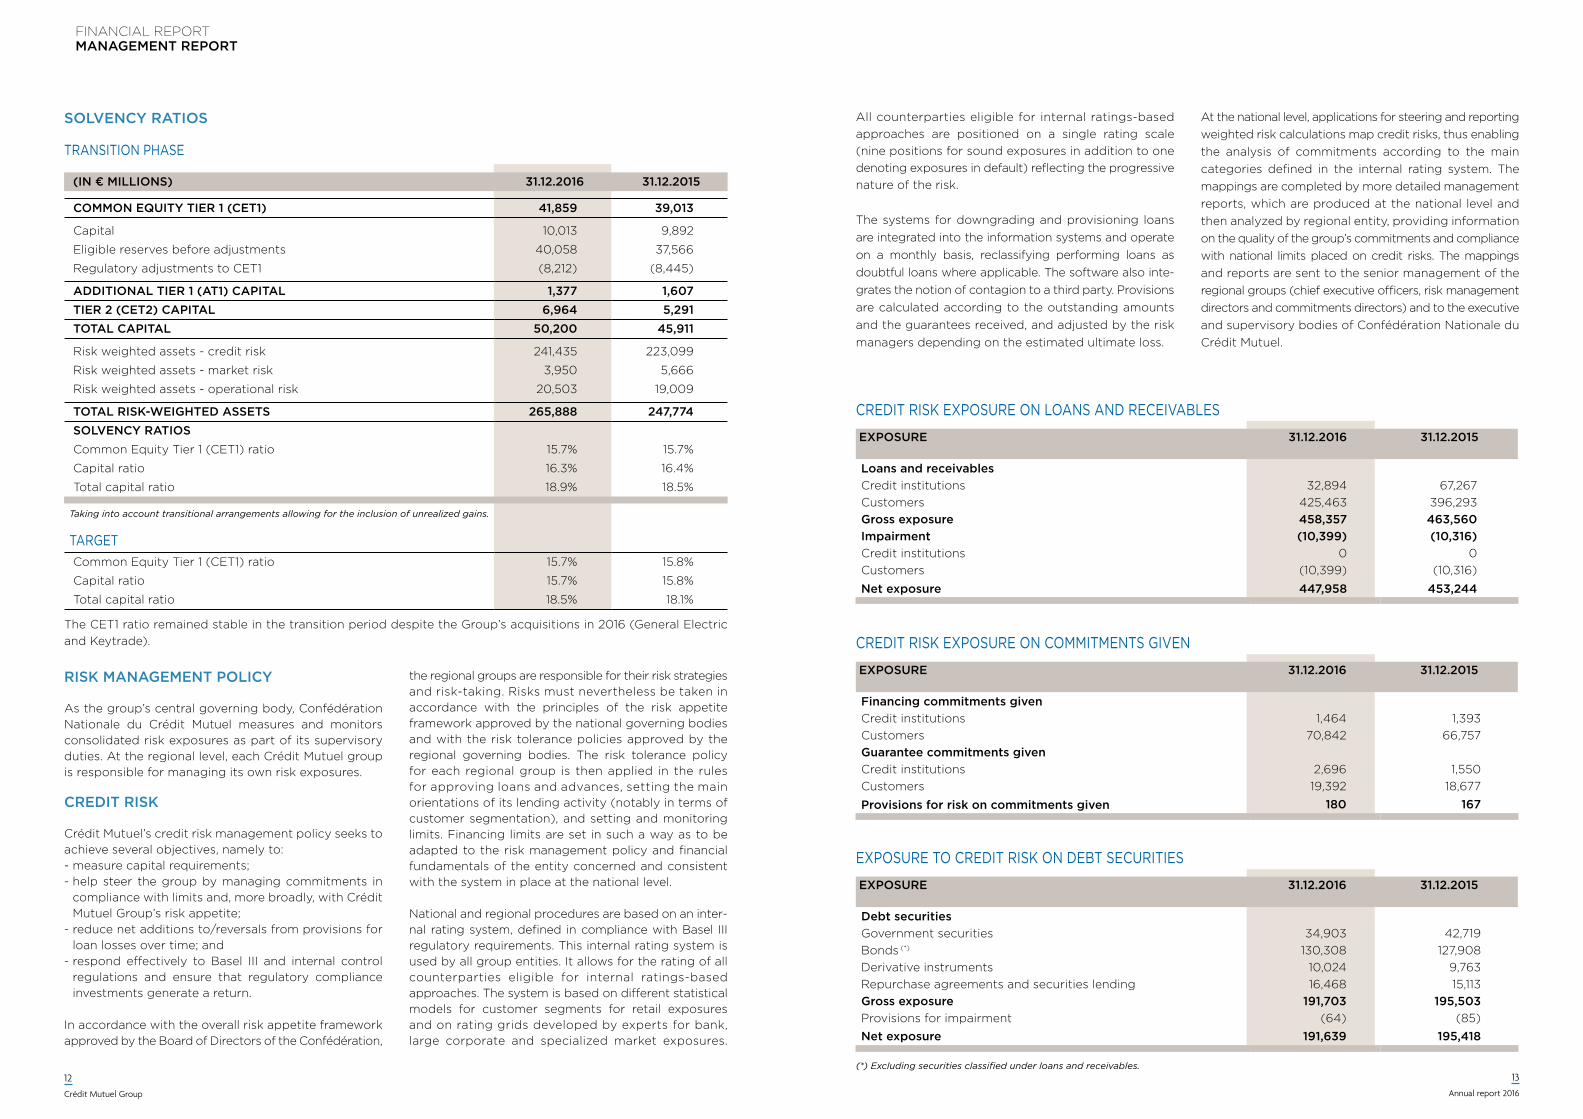
Solvency ratioS
TRANSITION PHASE
RISk MANAGEMENT POLICy
As the group’s central governing body, Confédération Nationale du Crédit Mutuel measures and monitors consolidated risk exposures as part of its supervisory duties. At the regional level, each Crédit Mutuel group is responsible for managing its own risk exposures.
CREDIT RISk
Crédit Mutuel’s credit risk management policy seeks to achieve several objectives, namely to:- measure capital requirements;- help steer the group by managing commitments in
compliance with limits and, more broadly, with Crédit Mutuel Group’s risk appetite;
- reduce net additions to/reversals from provisions for loan losses over time; and
- respond effectively to Basel III and internal control regulations and ensure that regulatory compliance investments generate a return.
In accordance with the overall risk appetite framework approved by the Board of Directors of the Confédération,
the regional groups are responsible for their risk strategies and risk-taking. Risks must nevertheless be taken in accordance with the principles of the risk appetite framework approved by the national governing bodies and with the risk tolerance policies approved by the regional governing bodies. The risk tolerance policy for each regional group is then applied in the rules for approving loans and advances, setting the main orientations of its lending activity (notably in terms of customer segmentation), and setting and monitoring limits. Financing limits are set in such a way as to be adapted to the risk management policy and financial fundamentals of the entity concerned and consistent with the system in place at the national level.
National and regional procedures are based on an inter-nal rating system, defined in compliance with Basel III regulatory requirements. This internal rating system is used by all group entities. It allows for the rating of all counterparties eligible for internal ratings-based approaches. The system is based on different statistical models for customer segments for retail exposures and on rating grids developed by experts for bank, large corporate and specialized market exposures.
(in € millions) 31.12.2016 31.12.2015
Common EQUiTY TiER 1 (CET1) 41,859 39,013
Capital 10,013 9,892
Eligible reserves before adjustments 40,058 37,566
Regulatory adjustments to CET1 (8,212) (8,445)
ADDiTionAl TiER 1 (AT1) CAPiTAl 1,377 1,607TiER 2 (CET2) CAPiTAl 6,964 5,291ToTAl CAPiTAl 50,200 45,911
Risk weighted assets - credit risk 241,435 223,099
Risk weighted assets - market risk 3,950 5,666
Risk weighted assets - operational risk 20,503 19,009
ToTAl RisK-WEiGHTED AssETs 265,888 247,774solVEnCY RATios Common Equity Tier 1 (CET1) ratio 15.7% 15.7%
Capital ratio 16.3% 16.4%
Total capital ratio 18.9% 18.5%
Taking into account transitional arrangements allowing for the inclusion of unrealized gains.
TARGETCommon Equity Tier 1 (CET1) ratio 15.7% 15.8%
Capital ratio 15.7% 15.8%
Total capital ratio 18.5% 18.1%
The CET1 ratio remained stable in the transition period despite the Group’s acquisitions in 2016 (General Electric and Keytrade).
All counterparties eligible for internal ratings-based approaches are positioned on a single rating scale (nine positions for sound exposures in addition to one denoting exposures in default) reflecting the progressive nature of the risk.
The systems for downgrading and provisioning loans are integrated into the information systems and operate on a monthly basis, reclassifying performing loans as doubtful loans where applicable. The software also inte-grates the notion of contagion to a third party. Provisions are calculated according to the outstanding amounts and the guarantees received, and adjusted by the risk managers depending on the estimated ultimate loss.
At the national level, applications for steering and reporting weighted risk calculations map credit risks, thus enabling the analysis of commitments according to the main categories defined in the internal rating system. The mappings are completed by more detailed management reports, which are produced at the national level and then analyzed by regional entity, providing information on the quality of the group’s commitments and compliance with national limits placed on credit risks. The mappings and reports are sent to the senior management of the regional groups (chief executive officers, risk management directors and commitments directors) and to the executive and supervisory bodies of Confédération Nationale du Crédit Mutuel.
CREDIT RISK ExPOSURE ON LOANS AND RECEIVABLES
ExposurE 31.12.2016 31.12.2015
Loans and receivables Credit institutions 32,894 67,267Customers 425,463 396,293Gross exposure 458,357 463,560Impairment (10,399) (10,316)Credit institutions 0 0Customers (10,399) (10,316)
Net exposure 447,958 453,244
CREDIT RISK ExPOSURE ON COMMITMENTS GIVEN
ExposurE 31.12.2016 31.12.2015
Financing commitments given Credit institutions 1,464 1,393Customers 70,842 66,757Guarantee commitments givenCredit institutions 2,696 1,550Customers 19,392 18,677
provisions for risk on commitments given 180 167
ExPOSURE TO CREDIT RISK ON DEBT SECURITIES
ExposurE 31.12.2016 31.12.2015
Debt securities Government securities 34,903 42,719Bonds (*) 130,308 127,908Derivative instruments 10,024 9,763Repurchase agreements and securities lending 16,468 15,113Gross exposure 191,703 195,503Provisions for impairment (64) (85)
Net exposure 191,639 195,418
(*) Excluding securities classified under loans and receivables.
FINANCIAL REPORTMANAGEMENT REPORT
14
Crédit Mutuel Group
15
Annual report 2016
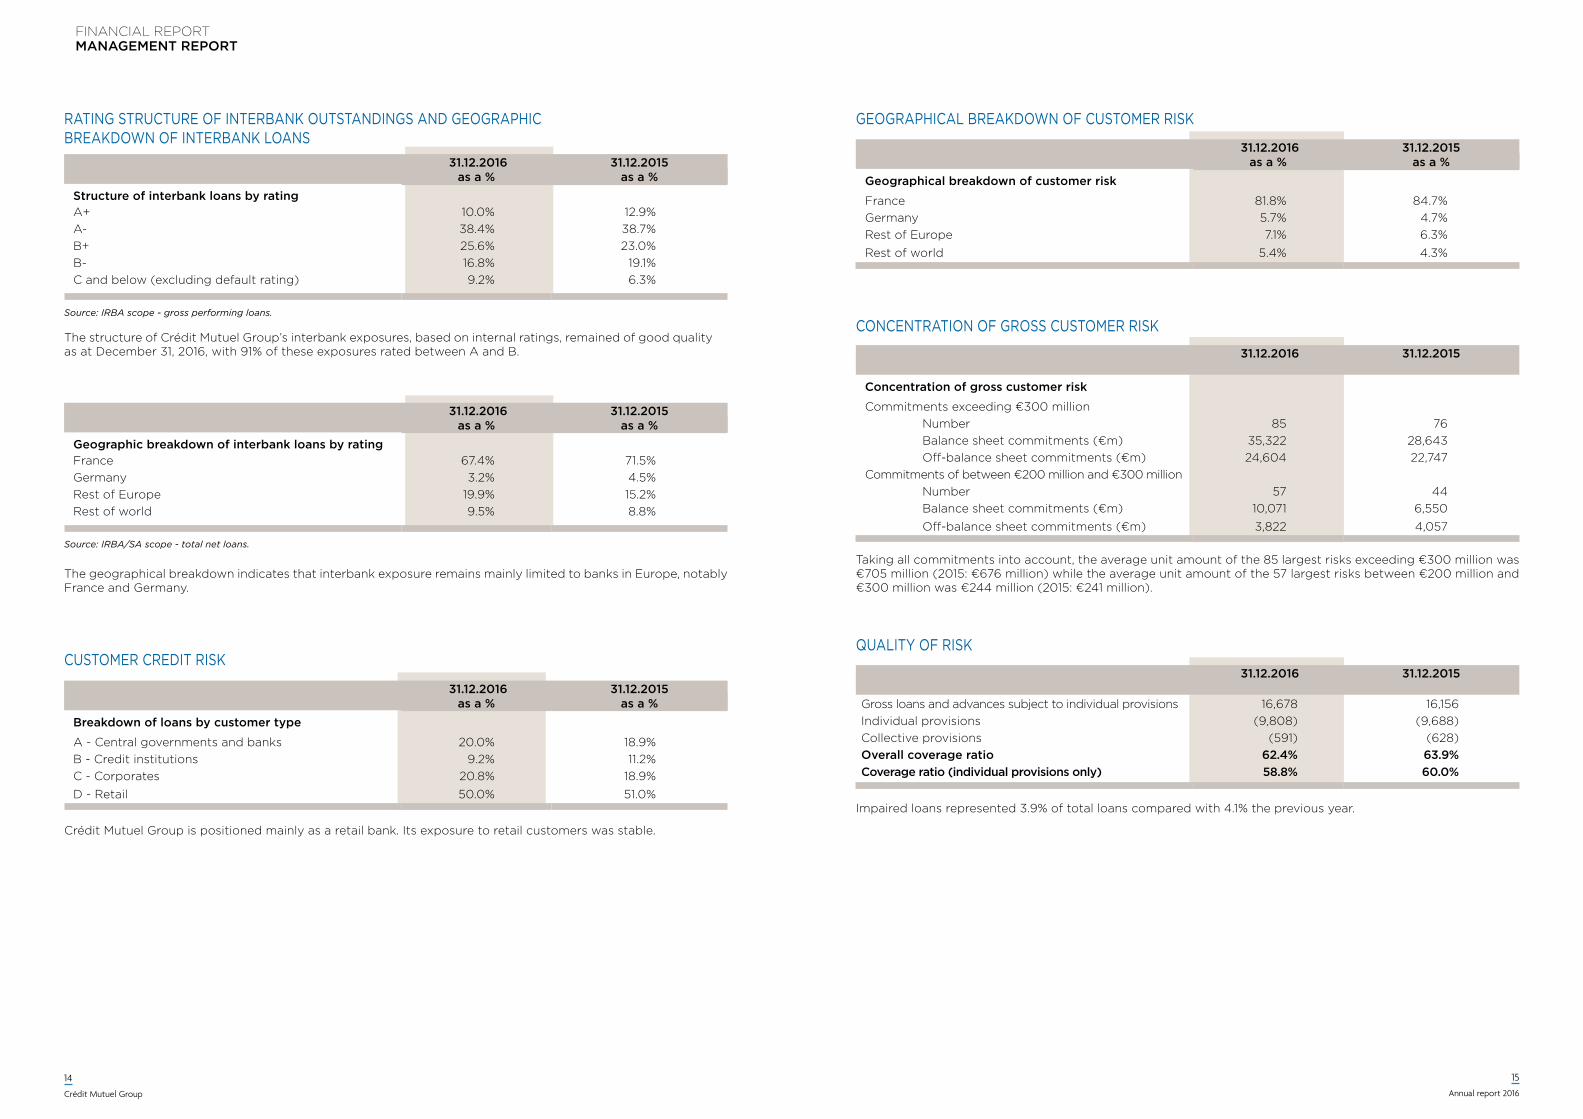
CUSTOMER CREDIT RISK
The structure of Crédit Mutuel Group’s interbank exposures, based on internal ratings, remained of good quality as at December 31, 2016, with 91% of these exposures rated between A and B.
Crédit Mutuel Group is positioned mainly as a retail bank. Its exposure to retail customers was stable.
RATING STRUCTURE OF INTERBANK OUTSTANDINGS AND GEOGRAPhIC BREAKDOwN OF INTERBANK LOANS
31.12.2016as a %
31.12.2015as a %
Structure of interbank loans by ratingA+ 10.0% 12.9%A- 38.4% 38.7%B+ 25.6% 23.0%B- 16.8% 19.1%C and below (excluding default rating) 9.2% 6.3%
Source: IRBA scope - gross performing loans.
31.12.2016as a %
31.12.2015as a %
Breakdown of loans by customer type
A - Central governments and banks 20.0% 18.9%B - Credit institutions 9.2% 11.2%C - Corporates 20.8% 18.9%
D - Retail 50.0% 51.0%
The geographical breakdown indicates that interbank exposure remains mainly limited to banks in Europe, notably France and Germany.
31.12.2016as a %
31.12.2015as a %
Geographic breakdown of interbank loans by rating France 67.4% 71.5%Germany 3.2% 4.5%Rest of Europe 19.9% 15.2%Rest of world 9.5% 8.8%
Source: IRBA/SA scope - total net loans.
GEOGRAPhICAL BREAKDOwN OF CUSTOMER RISK
CONCENTRATION OF GROSS CUSTOMER RISK
Taking all commitments into account, the average unit amount of the 85 largest risks exceeding €300 million was €705 million (2015: €676 million) while the average unit amount of the 57 largest risks between €200 million and €300 million was €244 million (2015: €241 million).
QUALITY OF RISK
31.12.2016as a %
31.12.2015as a %
Geographical breakdown of customer risk
France 81.8% 84.7%Germany 5.7% 4.7%Rest of Europe 7.1% 6.3%
Rest of world 5.4% 4.3%
31.12.2016 31.12.2015
Gross loans and advances subject to individual provisions 16,678 16,156Individual provisions (9,808) (9,688)Collective provisions (591) (628)Overall coverage ratio 62.4% 63.9%Coverage ratio (individual provisions only) 58.8% 60.0%
31.12.2016 31.12.2015
Concentration of gross customer risk
Commitments exceeding €300 million Number 85 76 Balance sheet commitments (€m) 35,322 28,643 Off-balance sheet commitments (€m) 24,604 22,747Commitments of between €200 million and €300 million Number 57 44 Balance sheet commitments (€m) 10,071 6,550
Off-balance sheet commitments (€m) 3,822 4,057
Impaired loans represented 3.9% of total loans compared with 4.1% the previous year.
FINANCIAL REPORTMANAGEMENT REPORT
16
Crédit Mutuel Group
17
Annual report 2016
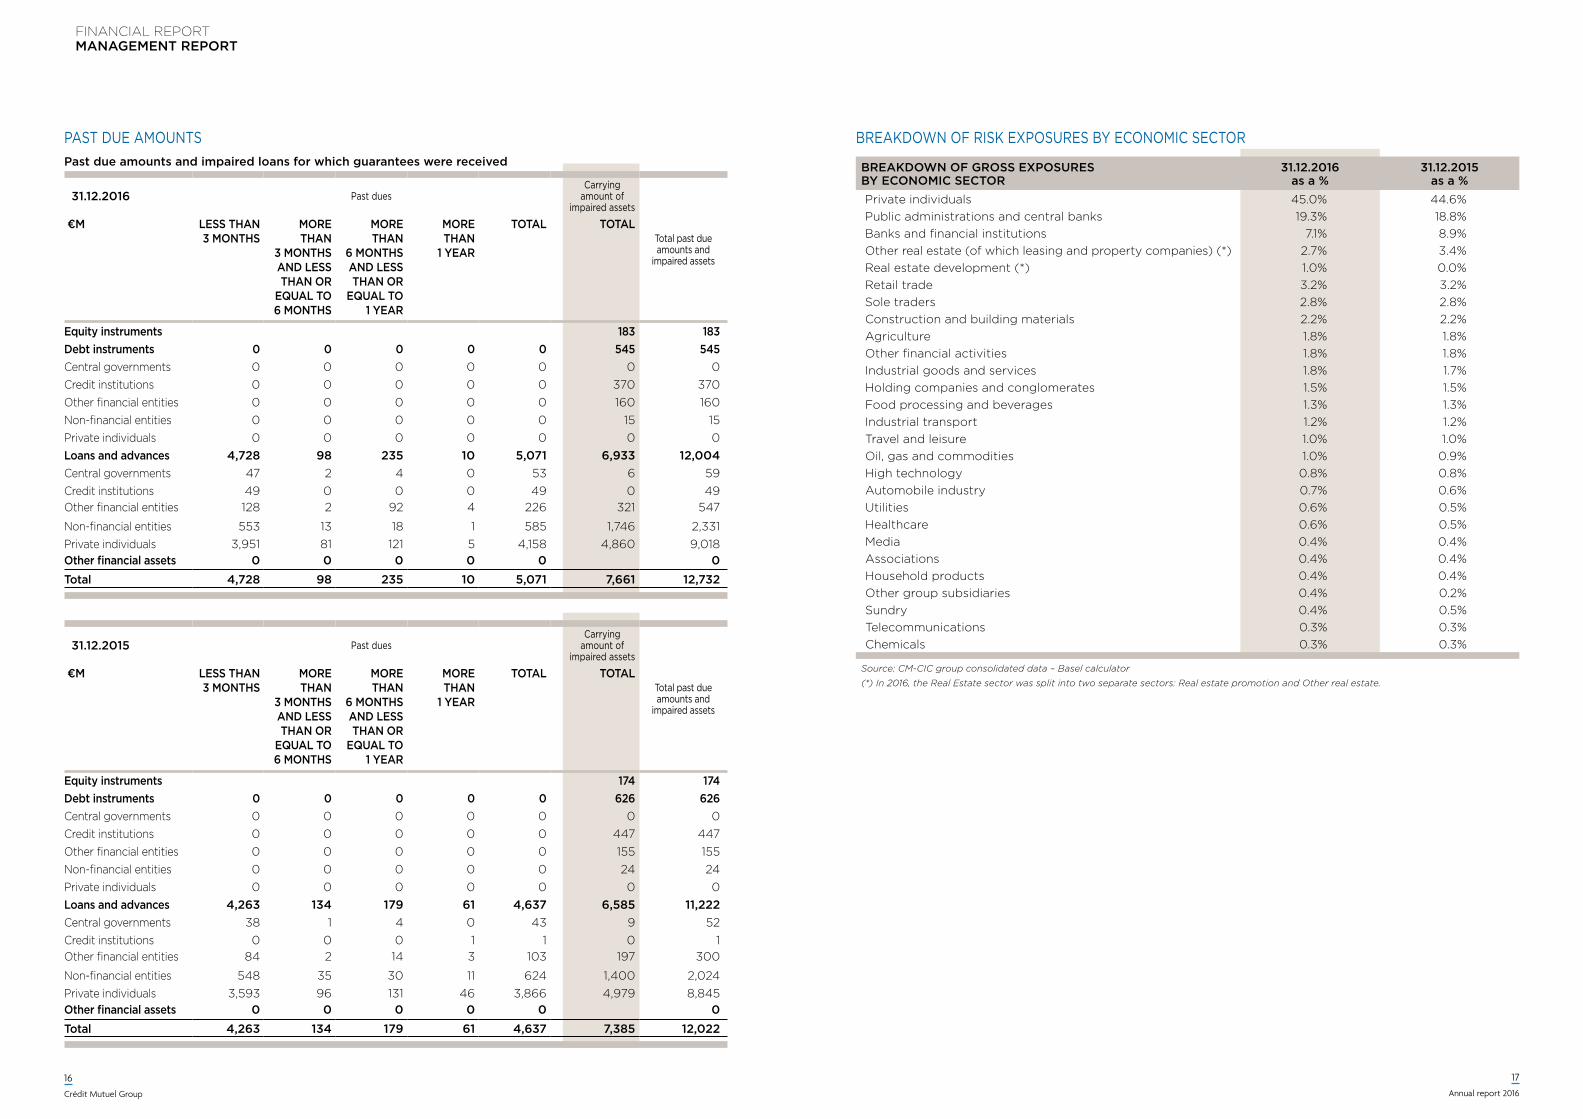
PAST DUE AMOUNTSPast due amounts and impaired loans for which guarantees were received
31.12.2016 Past duesCarrying
amount of impaired assets
Total past due amounts and
impaired assets
€M Less than 3 Months
More than
3 Months and Less than or
equaL to 6 Months
More than
6 Months and Less than or
equaL to 1 year
More than
1 year
totaL totaL
equity instruments 183 183debt instruments 0 0 0 0 0 545 545Central governments 0 0 0 0 0 0 0Credit institutions 0 0 0 0 0 370 370Other financial entities 0 0 0 0 0 160 160Non-financial entities 0 0 0 0 0 15 15Private individuals 0 0 0 0 0 0 0Loans and advances 4,728 98 235 10 5,071 6,933 12,004Central governments 47 2 4 0 53 6 59Credit institutions 49 0 0 0 49 0 49Other financial entities 128 2 92 4 226 321 547
Non-financial entities 553 13 18 1 585 1,746 2,331Private individuals 3,951 81 121 5 4,158 4,860 9,018other financial assets 0 0 0 0 0 0total 4,728 98 235 10 5,071 7,661 12,732
31.12.2015 Past duesCarrying
amount of impaired assets
Total past due amounts and
impaired assets
€M Less than 3 Months
More than
3 Months and Less than or
equaL to 6 Months
More than
6 Months and Less than or
equaL to 1 year
More than
1 year
totaL totaL
equity instruments 174 174debt instruments 0 0 0 0 0 626 626Central governments 0 0 0 0 0 0 0Credit institutions 0 0 0 0 0 447 447Other financial entities 0 0 0 0 0 155 155Non-financial entities 0 0 0 0 0 24 24Private individuals 0 0 0 0 0 0 0Loans and advances 4,263 134 179 61 4,637 6,585 11,222Central governments 38 1 4 0 43 9 52Credit institutions 0 0 0 1 1 0 1Other financial entities 84 2 14 3 103 197 300
Non-financial entities 548 35 30 11 624 1,400 2,024Private individuals 3,593 96 131 46 3,866 4,979 8,845other financial assets 0 0 0 0 0 0total 4,263 134 179 61 4,637 7,385 12,022
BREAKDOwN OF RISK ExPOSURES BY ECONOMIC SECTOR
Breakdown of gross exposures By economic sector
31.12.2016 as a %
31.12.2015 as a %
Private individuals 45.0% 44.6%Public administrations and central banks 19.3% 18.8%Banks and financial institutions 7.1% 8.9%Other real estate (of which leasing and property companies) (*) 2.7% 3.4%Real estate development (*) 1.0% 0.0%Retail trade 3.2% 3.2%Sole traders 2.8% 2.8%Construction and building materials 2.2% 2.2%Agriculture 1.8% 1.8%Other financial activities 1.8% 1.8%Industrial goods and services 1.8% 1.7%Holding companies and conglomerates 1.5% 1.5%Food processing and beverages 1.3% 1.3%Industrial transport 1.2% 1.2%Travel and leisure 1.0% 1.0%Oil, gas and commodities 1.0% 0.9%High technology 0.8% 0.8%Automobile industry 0.7% 0.6%Utilities 0.6% 0.5%Healthcare 0.6% 0.5%Media 0.4% 0.4%Associations 0.4% 0.4%Household products 0.4% 0.4%Other group subsidiaries 0.4% 0.2%Sundry 0.4% 0.5%Telecommunications 0.3% 0.3%Chemicals 0.3% 0.3%
Source: CM-CIC group consolidated data – Basel calculator
(*) In 2016, the Real Estate sector was split into two separate sectors: Real estate promotion and Other real estate.
FINANCIAL REPORTMANAGEMENT REPORT
18
Crédit Mutuel Group
19
Annual report 2016
BASEL III FRAMEwORk – CREDIT RISk
To better take into account the quality of the borrower, capital rules, including notably the implementation of an internal system of ratings specific to each institution, have been instituted by the Basel Committee on Banking Supervision and by the European Commission. European Regulation No. 575/2013 of 26 June 2013 concerning prudential requirements applicable to credit institutions and investment companies is based on these rules.
These rules are based on the three pillars– Pillar I introduces new minimum capital requirements,
with the calculation of a solvency ratio for credit, market and operational risks;
– Pillar II requires banks to perform their own assessment to determine whether they have adequate capital to support all the risks in their business and to perform stress tests to assess their capital requirements in the event of a deterioration in the economic environment; and
– Pillar III tightens up market discipline by requiring more extensive disclosure and transparency regarding the risk profile of banks governed by the new framework. To this end, each year Crédit Mutuel Group publishes a specific report that can be consulted on its institutional website
Regarding the minimal capital requirements of Pillar I, the major changes compared with the Cooke ratio as regards credit risk concern the modification of the calculation of risk-weighted assets relative to unexpected losses (UL) included in the ratio’s denominator and the possibility of adjusting the capital on the basis of the differential between expected losses (EL) and provisions included in the ratio’s numerator.
To measure credit risk, banks must choose between three approaches of increasing risk sensitivity subject to the authorization and under the control of their national supervisory bodies: standardized approach, foundation internal ratings-based approach, and advanced internal ratings-based approach. Each banking institution is required to adopt the approach best suited to the stage of development of its activities and of its organization. The use of so-called internal ratings-based approaches requires prior authorization by France’s supervisory authority.
STANDARDIzED APPROACH
The so-called standardized approach is similar to the Basel I Framework insofar as it is based on the application of fixed risk weightings to the different categories
of exposures as defined by the regulations. The main modifications result from the possibility to adjust the risk weightings applicable on the basis of credit ratings provided by recognized external institutions and from the broader range of sureties, guarantees and credit derivatives that may be taken into account by banks.
With the agreement of the ACPR, Crédit Mutuel Group will continue to measure claims on sovereign governments and local authorities using the standardized method over the foreseeable future.
INTERNAL RATINGS-BASED APPROACHES
These approaches are more sophisticated. Credit risk is a function of the characteristics of each exposure (or pool of exposures) based on the four following parameters: probability of default (PD) by the debtor over a one-year horizon, loss given default (LGD), credit conversion factor (CCF) for off-balance sheet exposures, and effective maturity(1). The use of these approaches is subject to compliance with a number of quantitative and qualitative requirements that seek to ensure the integrity of the process as well as the estimate of the parameters used to calculate regulatory capital.
There are two main approaches:– Foundation internal ratings-based approach (F-IRB),
under which banks provide their own internal estimates for the probability of default. Other risk components (LGD, CCF and M) are defined in the regulations.
– Advanced internal ratings-based approach (A-IRB), under which banks provide their own internal estimates for the PD, CCF, LGD and M risk components. This approach requires records stretching back over a long enough period of time for statistical purposes.
Crédit Mutuel Group has opted to apply the most sophisticated approaches of Basel III, focusing first on retail customers, which represent its core business.
The ACPR has authorized Crédit Mutuel to use its internal rating system to calculate its regulatory capital requirements with respect to credit risk as follows:– Advanced internal ratings-based approach, from
June 30, 2008, for exposures to retail customers;– Foundation internal ratings-based approach, from
December 31, 2008, then the advanced internal ratings-based approach, from December 31, 2012, for exposures to credit institutions; and
– Advanced internal ratings-based approach, from December 31, 2012, for exposures to corporate customers.
(1) Parameter used exclusively for exposures to central governments, institutions and corporates for which the advanced internal ratings-based approach is used.
As a cooperative bank owned by its members and customers, Crédit Mutuel Group is not focused on redistributing any capital gain to its shareholders. By opting for an internal ratings-based approach for most of its exposures, the group has:– complied with requirements laid down in the regulations
and by the supervisory body;– adopted a national framework that helps standardize
practices;– improved its customer risk segmentation, thus helping
to fine-tune its management and steering; and– brought up to standard its information systems and
work methods at all levels of its organization given the obligation to use ratings in its management.
Overall, Crédit Mutuel has structured its credit risk measurement and management system by capitalizing on the Basel III Framework, based on:– a single counterparty rating system;– a harmonized definition of default that is consistent
with the accounting approach;– the use of national parameters incorporating a margin
of prudence; and– significant investments in its information systems.
INTEREST RATE RISk
Interest rate risk arises from the bank’s commercial activities. It results from differences in interest rates and benchmark indices for customer loans and advances on the one hand and customer deposits on the other hand, based on a prospective analysis of expected changes in these components, taking into account embedded options (notably early loan repayments, extensions and drawdowns against confirmed credit lines).
The regional groups are responsible for defining their interest rate risk management and hedging strategies. As required by the regulations (Decree of November 3, 2014), CNCM’s Risk Management department is responsible for the consolidated and homogeneous measurement of this risk by coordinating methodologies and by regular measurement of overall risk at the group level.
Crédit Mutuel Group has established harmonized national risk agreements and limits, which are set out in the “Group asset and liability management guidelines.”
Measurement and supervision of interest rate risk is carried out at the regional level by the Crédit Mutuel regional groups and at the national level by CNCM.
At the regional level
Each of the Crédit Mutuel regional groups has an asset/liability management (ALM) unit dedicated to monitoring overall interest rate exposure.
The Crédit Mutuel Group entities all use a common base for measuring overall interest rate risk (application of methodological rules for run-off standards, scenarios and early repayment), excluding the trading book, which is monitored at the level of the dealing room.
Group entities have introduced systems of limits that are consistent with the national system. Management and hedging decisions are made by regional committees.
Interest rate risk is analyzed and hedged globally, if appropriate, by entering into so-called macro-hedging transactions. These transactions are accounted for in accordance with IAS 39 as adopted by the European Union, i.e. in accordance with the carved out version. High-value or special-purpose customer transactions may be hedged separately.
At the national level
Interest rate risk is measured by two indicators: – risk relating to future income, analyzed in terms of the
sensitivity of the margin over the short- to medium-term (one to five years); and
– risk relating to the instant value of the entity, measured as the sensitivity of net present value over a long-term horizon.
At the national level, the sensitivity limit for net banking income over one or two years includes new loan production based on a scenario of moderate changes in interest rates (+/- 1% for variable rates and +/- 0.5% for regulated interest rates).
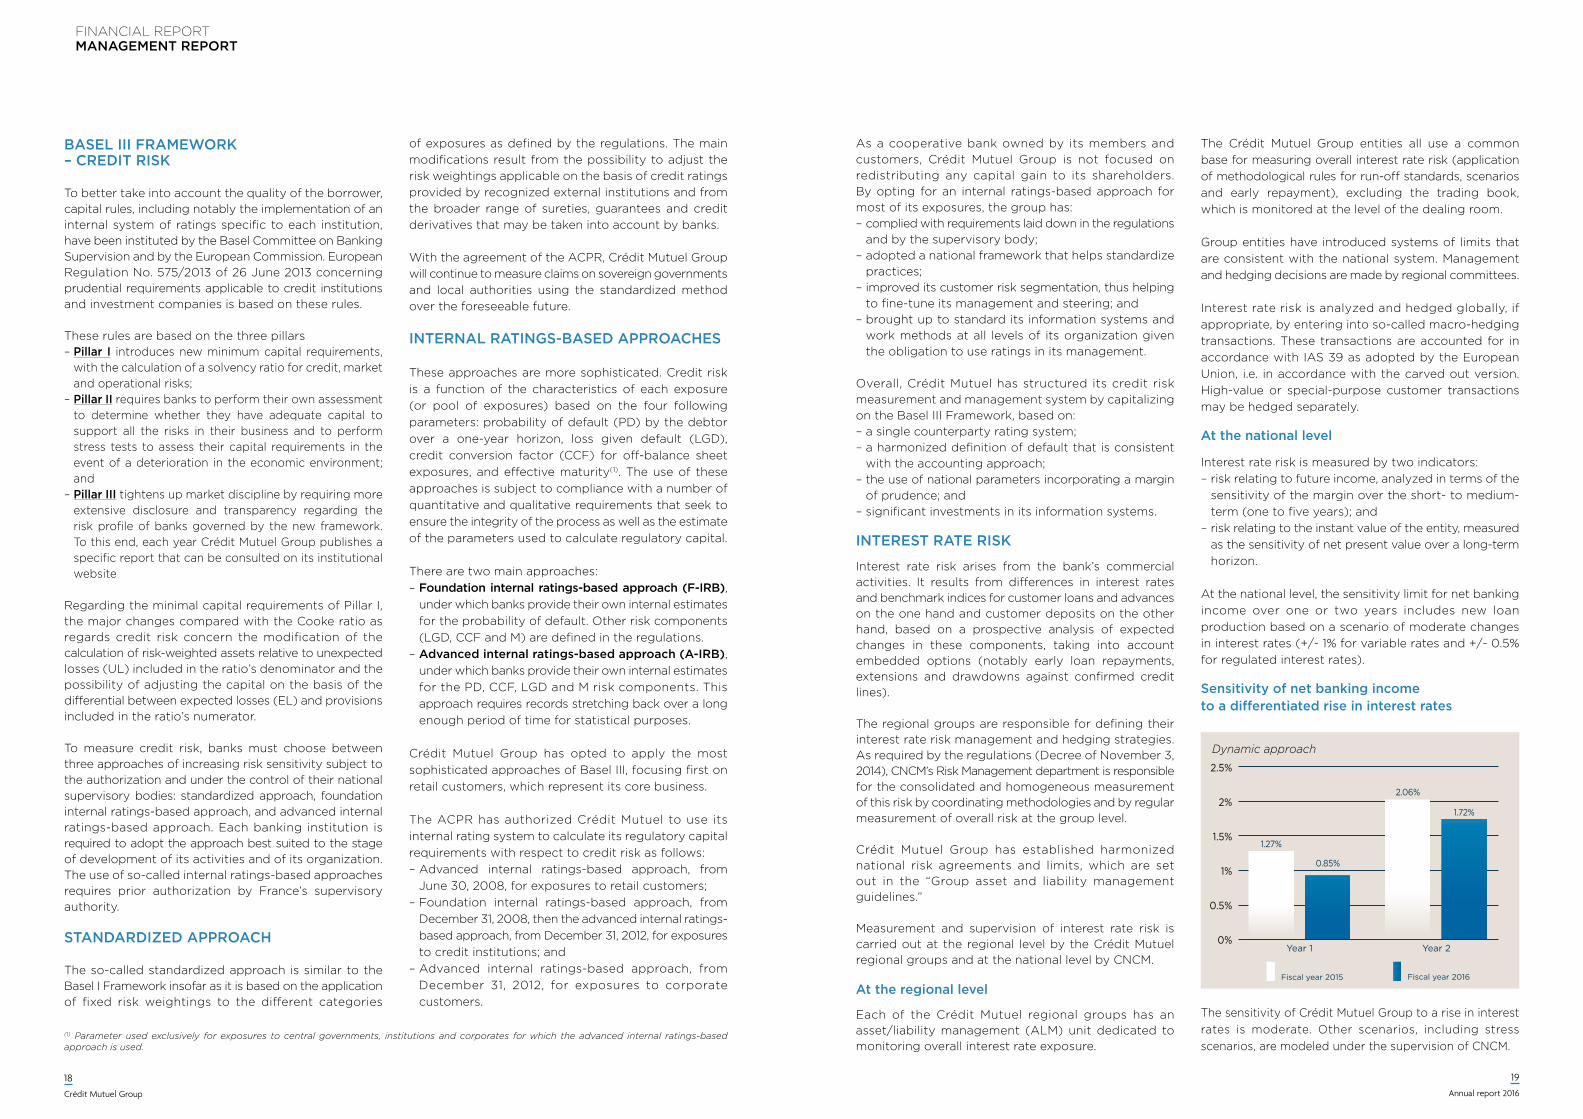
Sensitivity of net banking income to a differentiated rise in interest rates
Dynamic approach
2.5%
2%
1.5%
1%
0.5%
0%
Fiscal year 2015 Fiscal year 2016
Year 1
0.85%
1.72%
1.27%
2.06%
Year 2
The sensitivity of Crédit Mutuel Group to a rise in interest rates is moderate. Other scenarios, including stress scenarios, are modeled under the supervision of CNCM.
FINANCIAL REPORTMANAGEMENT REPORT
20
Crédit Mutuel Group
21
Annual report 2016
LIqUIDITy RISk
Liquidity risk arises from a mismatch in the maturity of the applications of funds and the sources of funds. In its most extreme form, the risk is that an entity will be unable to meet its obligations.
The federal banks of the Crédit Mutuel groups each have an ALM unit or committee tasked notably with managing assets and liabilities to ensure there is sufficient liquidity to meet their commitments.
Liquidity risk is monitored by the regional groups using the following indicators in particular:– liquidity monitoring ratios and regulatory reports
(LCR, NSFR, ALMM).
Some of the group’s regional federations and federal banks apply limits that are stricter than those required by the regulations;– a medium- to long-term liquidity indicator defined at
the national level, the general principle being to run-off all assets and all liabilities and to measure the ratio of coverage of applications by resources of equivalent duration at different maturities. A system of related limits has been put into place; along with
– liquidity reserves and recourse to the 3G pool;– three-year financing plans;– liquidity and refinancing costs; and– liquidity crisis simulations.
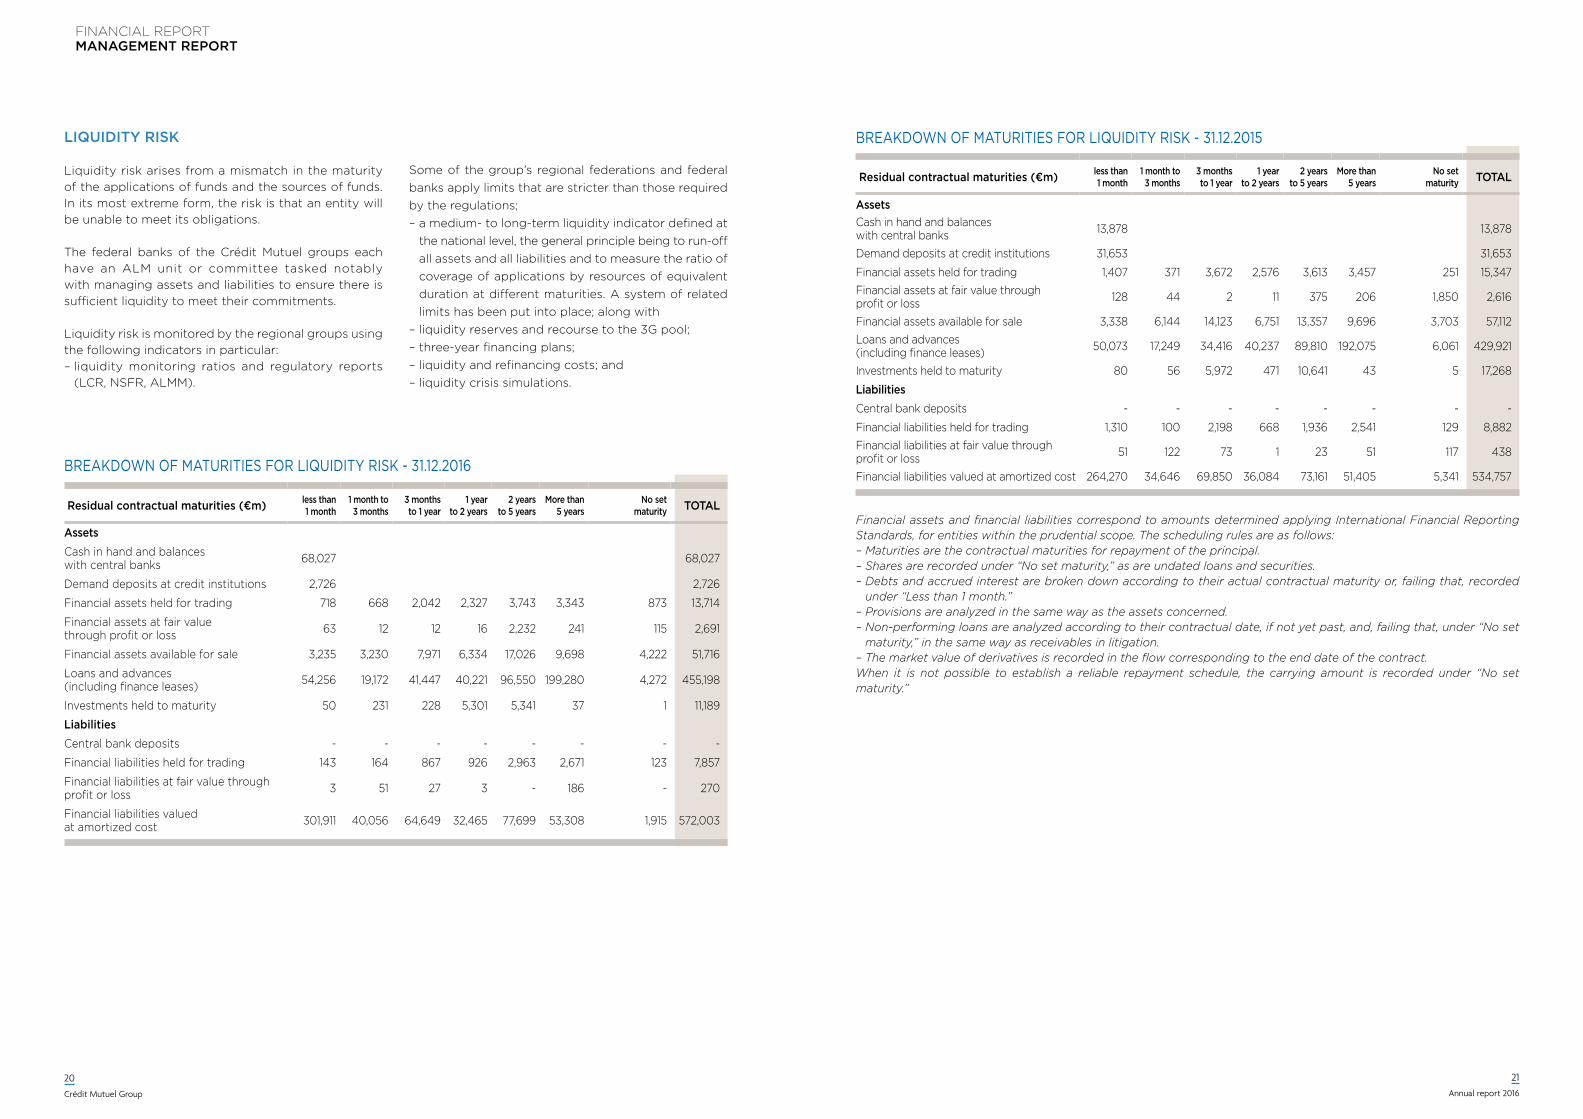
BREAKDOwN OF MATURITIES FOR LIQUIDITY RISK - 31.12.2016
Residual contractual maturities (€m) less than1 month
1 month to 3 months
3 months to 1 year
1 year to 2 years
2 years to 5 years
More than 5 years
No set maturity ToTal
assetsCash in hand and balances with central banks 13,878 13,878
Demand deposits at credit institutions 31,653 31,653
Financial assets held for trading 1,407 371 3,672 2,576 3,613 3,457 251 15,347 Financial assets at fair value through profit or loss 128 44 2 11 375 206 1,850 2,616
Financial assets available for sale 3,338 6,144 14,123 6,751 13,357 9,696 3,703 57,112 Loans and advances (including finance leases) 50,073 17,249 34,416 40,237 89,810 192,075 6,061 429,921
Investments held to maturity 80 56 5,972 471 10,641 43 5 17,268
liabilitiesCentral bank deposits - - - - - - - -
Financial liabilities held for trading 1,310 100 2,198 668 1,936 2,541 129 8,882 Financial liabilities at fair value through profit or loss 51 122 73 1 23 51 117 438
Financial liabilities valued at amortized cost 264,270 34,646 69,850 36,084 73,161 51,405 5,341 534,757
BREAKDOwN OF MATURITIES FOR LIQUIDITY RISK - 31.12.2015
Financial assets and financial liabilities correspond to amounts determined applying International Financial Reporting Standards, for entities within the prudential scope. The scheduling rules are as follows:– Maturities are the contractual maturities for repayment of the principal.– Shares are recorded under “No set maturity,” as are undated loans and securities.– Debts and accrued interest are broken down according to their actual contractual maturity or, failing that, recorded
under “Less than 1 month.”– Provisions are analyzed in the same way as the assets concerned.– Non-performing loans are analyzed according to their contractual date, if not yet past, and, failing that, under “No set
maturity,” in the same way as receivables in litigation.– The market value of derivatives is recorded in the flow corresponding to the end date of the contract.When it is not possible to establish a reliable repayment schedule, the carrying amount is recorded under “No set maturity.”
Residual contractual maturities (€m) less than1 month
1 month to 3 months
3 months to 1 year
1 year to 2 years
2 years to 5 years
More than 5 years
No set maturity ToTal
assets
Cash in hand and balances with central banks 68,027 68,027
Demand deposits at credit institutions 2,726 2,726
Financial assets held for trading 718 668 2,042 2,327 3,743 3,343 873 13,714
Financial assets at fair value through profit or loss 63 12 12 16 2,232 241 115 2,691
Financial assets available for sale 3,235 3,230 7,971 6,334 17,026 9,698 4,222 51,716
Loans and advances (including finance leases) 54,256 19,172 41,447 40,221 96,550 199,280 4,272 455,198
Investments held to maturity 50 231 228 5,301 5,341 37 1 11,189
liabilities
Central bank deposits - - - - - - - -
Financial liabilities held for trading 143 164 867 926 2,963 2,671 123 7,857
Financial liabilities at fair value through profit or loss 3 51 27 3 - 186 - 270
Financial liabilities valued at amortized cost 301,911 40,056 64,649 32,465 77,699 53,308 1,915 572,003
FINANCIAL REPORTMANAGEMENT REPORT
22
Crédit Mutuel Group
23
Annual report 2016
FOREIGN ExCHANGE RISk
Each bank hedges the currency risk on customer transactions. This risk is not material at the Crédit Mutuel group level.
RISqUES DE MARCHÉ
The main Crédit Mutuel Group entity engaged in market activities is Crédit Mutuel-CM11 Group, which trades on its own account and on behalf of the other federations. Crédit Mutuel-CM11 Group’s activities include refinancing the local mutual banks’ activities, securities portfolio management and commercial activities for corporate customers (foreign exchange transactions, interest rate and foreign exchange risk hedging).
The dealing room activities are the subject of reports at regular intervals covering risks as well as financial and accounting performances.
The permitted activities and procedures for capital markets activities are included in each regional group’s internal regulations. At the operational level, they are analyzed by the various committees involved and reported upon regularly to the boards of directors concerned.
At the national level, reports produced in respect of market activities are used to monitor the main risk indicators and compliance with the national system of limits. They are supplemented with regular monitoring of the results of historical and hypothetical stress on the capital markets activities of all Crédit Mutuel groups.
OPERATIONAL RISk
Methods used by Crédit Mutuel GroupCrédit Mutuel Group is authorized to use its advanced measurement approach (AMA) to calculate regulatory capital requirements in respect of operational risk, save for the deduction of expected losses from capital requirements, as indicated below:– authorization given since January 1, 2010 for all entities
included in the consolidation scope other than the foreign subsidiaries, Cofidis Group and CM-CIC Factor;
– authorization extended to CM-CIC Factor since January 1, 2012;
– authorization extended to Banque de Luxembourg since September 30, 2013; and
– authorization extended to Cofidis France since September 30, 2014.
The deduction of insurance as a risk-mitigating factor for capital requirements in respect of operational risk under the advanced measurement approach (AMA) has been authorized by the ACPR and was applied for the first time in the interim financial statements for the six months to June 30, 2012.
General frameworkThe system for measuring and controlling operational risk (progressively implemented since 2002) rests on foundations common to the entire Crédit Mutuel group
and common quantitative measurement methods. Risk mappings are performed for each business line, activity group and risk type in close collaboration with the functional departments. These departments define a standardized framework for analyzing losses and draw up expert-based modeling for comparison against scenario-based, probabilistic estimates.
For its modeling, the group relies notably on a national database of internal loss events, in addition to which it has access to an external database on a subscription basis. It also relies on the scenarios developed during the mapping process and in the statistical studies drawn up in compliance with common procedures and regulatory requirements.
Main objectivesThe operational risk management policy implemented by the group is designed to achieve the following: – improve group management by controlling risks and
related costs;– at the human level: protect people, foster individual
responsibility, autonomy and controls, and capitalize on the skills within the group;
– at the economic level: preserve margins by managing risks close to the ground in all activities;
– at the regulatory level: comply effectively with the Basel III regulations and with requests from supervisory authorities.
Structure and organizationThe group has a clearly identified function responsible specifically for the management of operational risk, which coordinates and consolidates the entire system and its implementation at the level of each entity. In this respect, it:– defines and manages the reference databases as well
as the risk measurement methods and models;– organizes the reporting of loss events and key risk
indicators (KRI);– draws up the mappings and produces the modeling;– defines group methodologies;– directs action plans for mitigating risks; and– manages financing plans.
This function is coordinated by the operational risk managers (one at each regional group and at each large entity). Their work is coordinated by the national function under the responsibility of the Risk Management department of Confédération Nationale du Crédit Mutuel.
Reporting and general oversightlThe reporting and general oversight of operational risks are based on the following principles:– providing information at regular intervals to the
Board of Directors covering incurred losses;– providing ad hoc reports to the national management
teams setting out the risk profile analyzed according to the risk structure defined by the group, capital requirements, losses and provisions in respect of loss events.
FINANCIAL CONGLOMERATES
Confédération Nationale du Crédit Mutuel (CNCM) was designated as a financial conglomerate by the Autorité de Contrôle Prudentiel in a letter dated December 16, 2005. Further to the Order of September 19, 2005 issued by the Advisory Committee on Financial Legislation and Regulation (Comité Consultatif de la Législation et de la Réglementation Financières - CCLRF), institutions that own more than 20% of the capital of undertakings belonging to the insurance sector must deduct their investment as well as any subordinated loans from their prudential own funds. However, said institutions have the possibility not to deduct from own funds investments in undertakings belonging to the insurance sector, but if so they have an additional requirement in
terms of capital adequacy determined applying the so-called accounting consolidation method.
CNCM’s activity as a financial conglomerate is undertaken through Groupe des Assurances du Crédit Mutuel, a subsidiary of CM11-CIC Group, Suravenir (life insurance) and Suravenir Assurances (non-life insurance), which are both subsidiaries of CM Arkéa, and Nord Europe Assurance, a subsidiary of CMNE Group. These subsidiaries market an extensive range of life insurance, property insurance, casualty insurance and third-party liability insurance products, predominantly through the banking networks of Crédit Mutuel Group.
At December 31, 2016, coverage of the solvency requirements related to banking activities or investment and insurance services by the own funds of Crédit Mutuel Group acting as financial conglomerate was 176%.
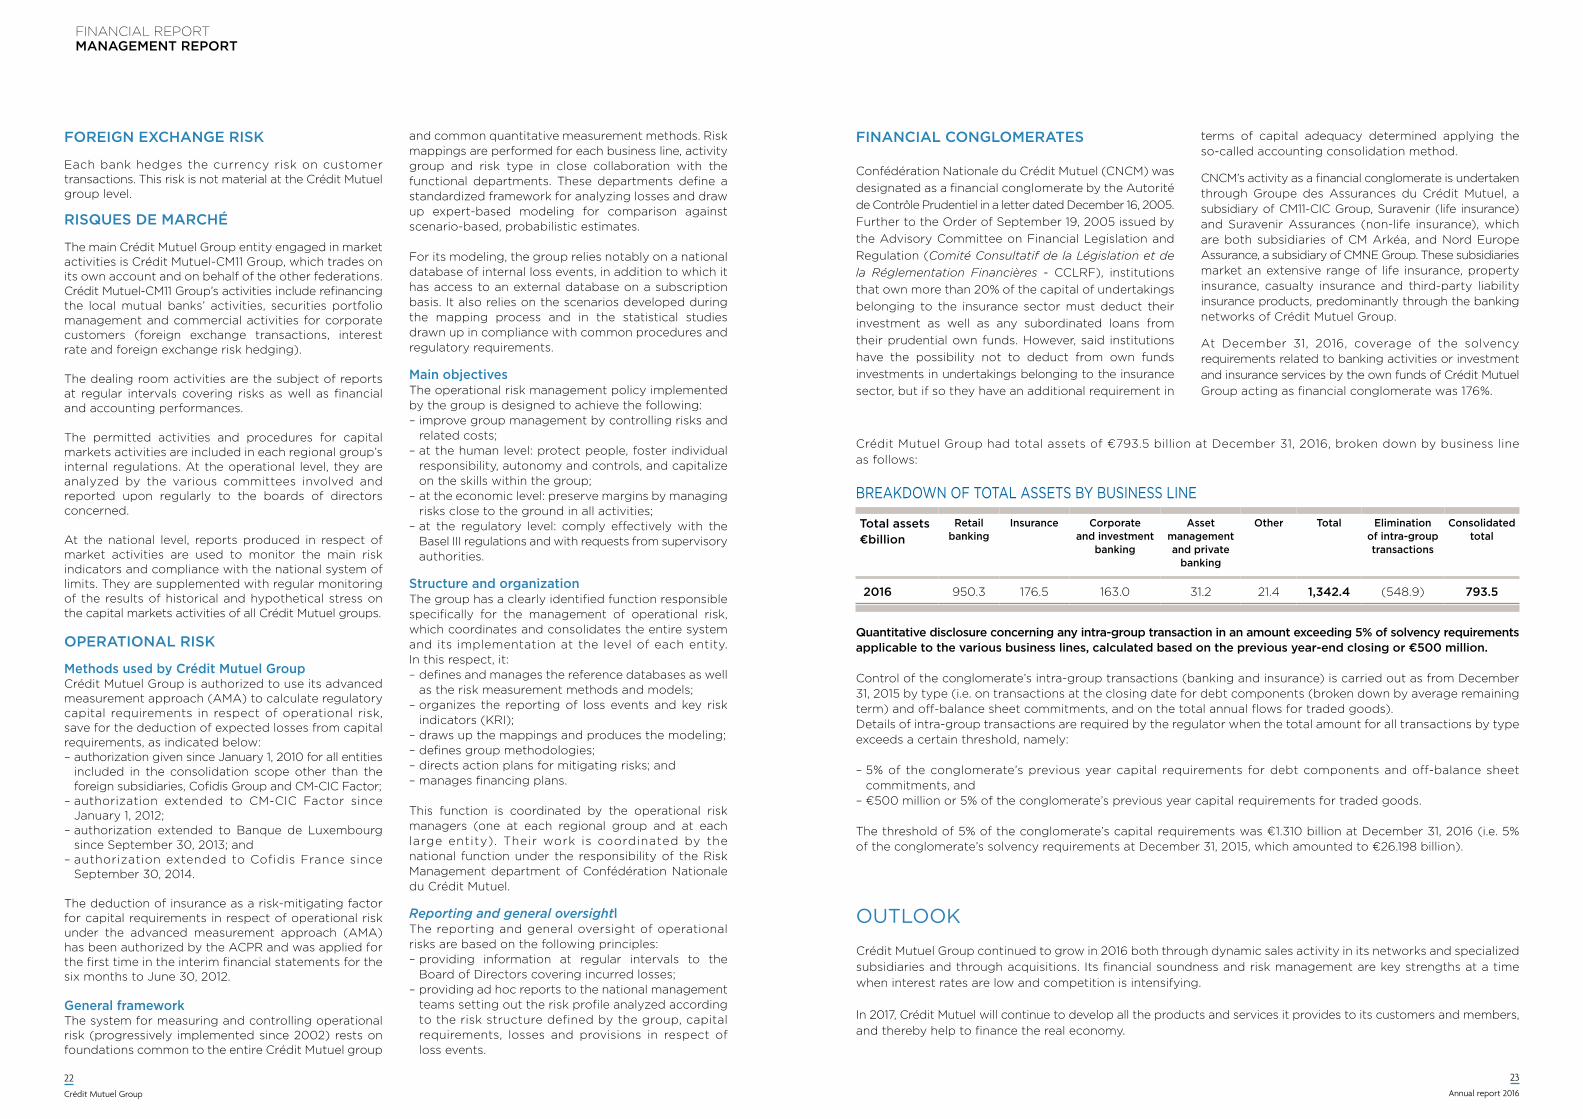
Crédit Mutuel Group had total assets of €793.5 billion at December 31, 2016, broken down by business line as follows:
quantitative disclosure concerning any intra-group transaction in an amount exceeding 5% of solvency requirements applicable to the various business lines, calculated based on the previous year-end closing or €500 million.
Control of the conglomerate’s intra-group transactions (banking and insurance) is carried out as from December 31, 2015 by type (i.e. on transactions at the closing date for debt components (broken down by average remaining term) and off-balance sheet commitments, and on the total annual flows for traded goods). Details of intra-group transactions are required by the regulator when the total amount for all transactions by type exceeds a certain threshold, namely:
– 5% of the conglomerate’s previous year capital requirements for debt components and off-balance sheet commitments, and
– €500 million or 5% of the conglomerate’s previous year capital requirements for traded goods.
The threshold of 5% of the conglomerate’s capital requirements was €1.310 billion at December 31, 2016 (i.e. 5% of the conglomerate’s solvency requirements at December 31, 2015, which amounted to €26.198 billion).
Crédit Mutuel Group continued to grow in 2016 both through dynamic sales activity in its networks and specialized subsidiaries and through acquisitions. Its financial soundness and risk management are key strengths at a time when interest rates are low and competition is intensifying.
In 2017, Crédit Mutuel will continue to develop all the products and services it provides to its customers and members, and thereby help to finance the real economy.
OUTLOOK
Total assets €billion
Retail banking
Insurance Corporate and investment
banking
Asset management and private
banking
Other Total Elimination of intra-group transactions
Consolidated total
2016 950.3 176.5 163.0 31.2 21.4 1,342.4 (548.9) 793.5
BREAKDOwN OF TOTAL ASSETS BY BUSINESS LINE
24
Crédit Mutuel Group
25
Annual report 2016
FInAnCIAL StAtementS
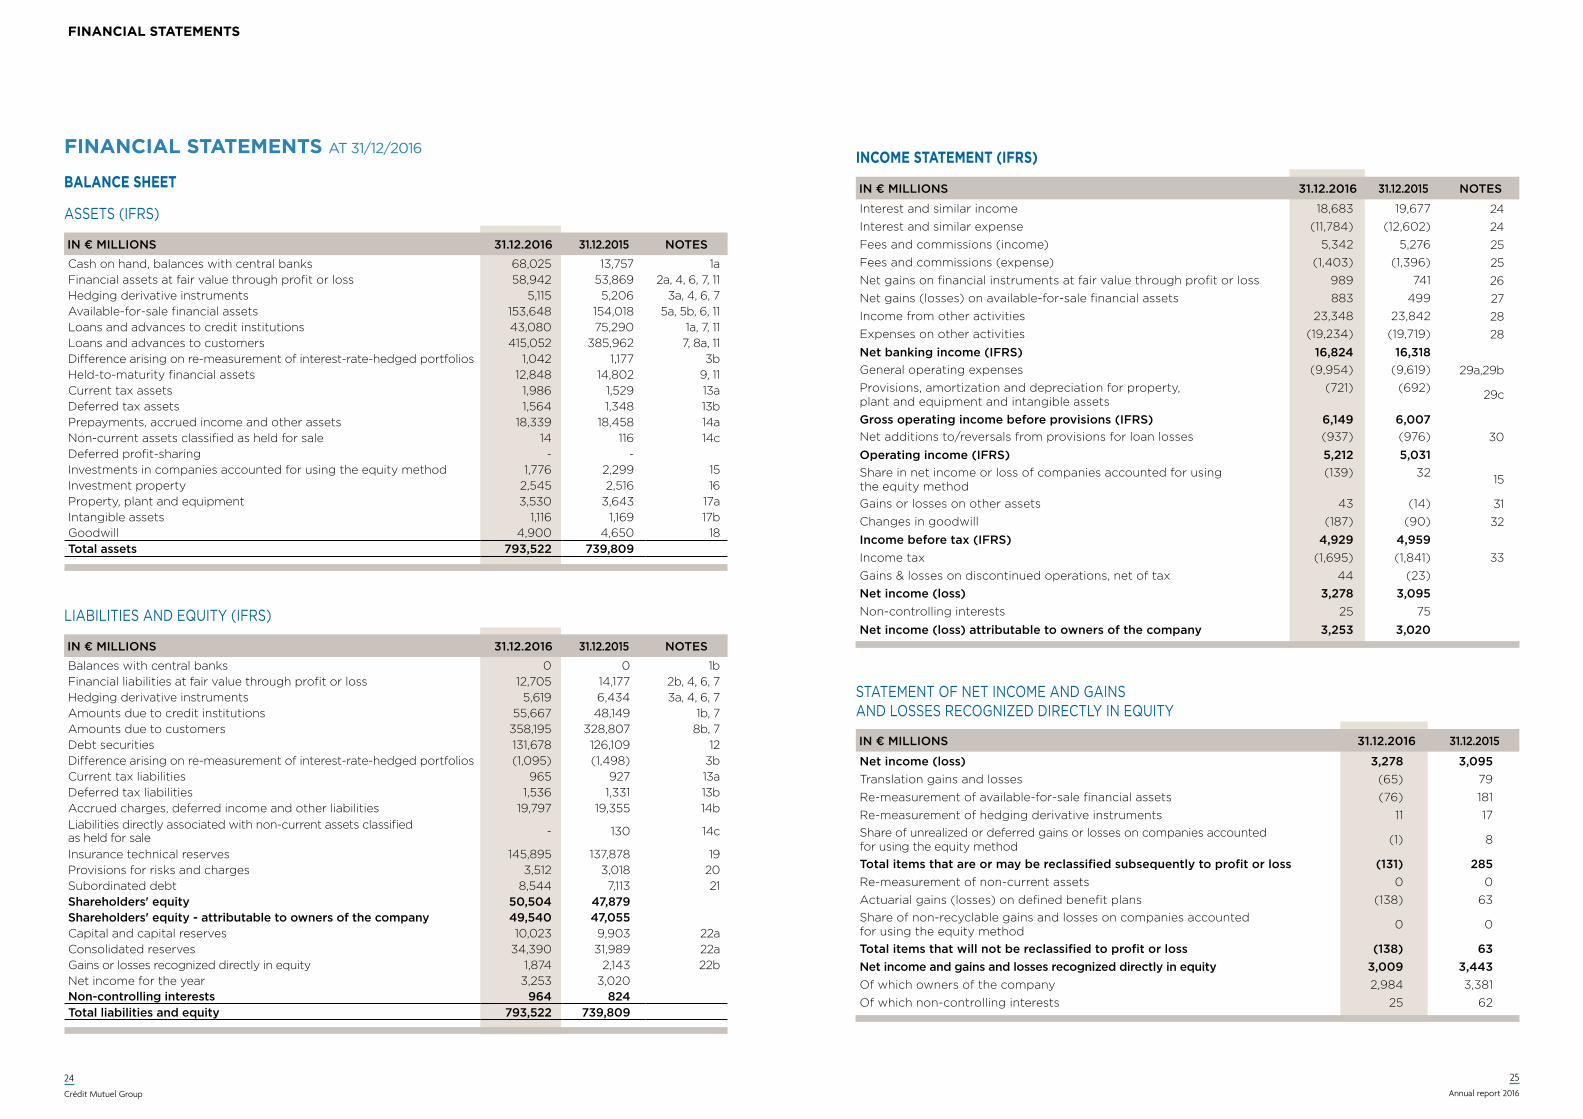
BALAnCe SHeet in € millions 31.12.2016 31.12.2015 notes
Interest and similar income 18,683 19,677 24Interest and similar expense (11,784) (12,602) 24Fees and commissions (income) 5,342 5,276 25Fees and commissions (expense) (1,403) (1,396) 25Net gains on financial instruments at fair value through profit or loss 989 741 26Net gains (losses) on available-for-sale financial assets 883 499 27Income from other activities 23,348 23,842 28Expenses on other activities (19,234) (19,719) 28net banking income (iFRs) 16,824 16,318General operating expenses (9,954) (9,619) 29a,29bProvisions, amortization and depreciation for property, plant and equipment and intangible assets
(721) (692) 29c
Gross operating income before provisions (iFRs) 6,149 6,007 Net additions to/reversals from provisions for loan losses (937) (976) 30operating income (iFRs) 5,212 5,031Share in net income or loss of companies accounted for using the equity method
(139) 32 15
Gains or losses on other assets 43 (14) 31Changes in goodwill (187) (90) 32income before tax (iFRs) 4,929 4,959 Income tax (1,695) (1,841) 33Gains & losses on discontinued operations, net of tax 44 (23) net income (loss) 3,278 3,095 Non-controlling interests 25 75
net income (loss) attributable to owners of the company 3,253 3,020
InCome StAtement (IFRS)FInAnCIAL StAtementS AT 31/12/2016
ASSETS (IFRS)
in € millions 31.12.2016 31.12.2015 notes
Cash on hand, balances with central banks 68,025 13,757 1aFinancial assets at fair value through profit or loss 58,942 53,869 2a, 4, 6, 7, 11Hedging derivative instruments 5,115 5,206 3a, 4, 6, 7Available-for-sale financial assets 153,648 154,018 5a, 5b, 6, 11Loans and advances to credit institutions 43,080 75,290 1a, 7, 11Loans and advances to customers 415,052 385,962 7, 8a, 11Difference arising on re-measurement of interest-rate-hedged portfolios 1,042 1,177 3bHeld-to-maturity financial assets 12,848 14,802 9, 11Current tax assets 1,986 1,529 13aDeferred tax assets 1,564 1,348 13bPrepayments, accrued income and other assets 18,339 18,458 14aNon-current assets classified as held for sale 14 116 14cDeferred profit-sharing - - Investments in companies accounted for using the equity method 1,776 2,299 15Investment property 2,545 2,516 16Property, plant and equipment 3,530 3,643 17aIntangible assets 1,116 1,169 17bGoodwill 4,900 4,650 18total assets 793,522 739,809
LIABILITIES AND EQUITY (IFRS)
in € millions 31.12.2016 31.12.2015 notes
Balances with central banks 0 0 1bFinancial liabilities at fair value through profit or loss 12,705 14,177 2b, 4, 6, 7Hedging derivative instruments 5,619 6,434 3a, 4, 6, 7Amounts due to credit institutions 55,667 48,149 1b, 7Amounts due to customers 358,195 328,807 8b, 7Debt securities 131,678 126,109 12Difference arising on re-measurement of interest-rate-hedged portfolios (1,095) (1,498) 3bCurrent tax liabilities 965 927 13aDeferred tax liabilities 1,536 1,331 13bAccrued charges, deferred income and other liabilities 19,797 19,355 14bLiabilities directly associated with non-current assets classified as held for sale - 130 14c
Insurance technical reserves 145,895 137,878 19Provisions for risks and charges 3,512 3,018 20Subordinated debt 8,544 7,113 21shareholders' equity 50,504 47,879 shareholders' equity - attributable to owners of the company 49,540 47,055 Capital and capital reserves 10,023 9,903 22aConsolidated reserves 34,390 31,989 22aGains or losses recognized directly in equity 1,874 2,143 22bNet income for the year 3,253 3,020 non-controlling interests 964 824 total liabilities and equity 793,522 739,809
STATEMENT OF NET INCOME AND GAINS AND LOSSES RECOGNIzED DIRECTLY IN EQUITY
in € millions 31.12.2016 31.12.2015
net income (loss) 3,278 3,095Translation gains and losses (65) 79Re-measurement of available-for-sale financial assets (76) 181Re-measurement of hedging derivative instruments 11 17Share of unrealized or deferred gains or losses on companies accounted for using the equity method (1) 8
Total items that are or may be reclassified subsequently to profit or loss (131) 285Re-measurement of non-current assets 0 0Actuarial gains (losses) on defined benefit plans (138) 63Share of non-recyclable gains and losses on companies accounted for using the equity method 0 0
Total items that will not be reclassified to profit or loss (138) 63net income and gains and losses recognized directly in equity 3,009 3,443Of which owners of the company 2,984 3,381Of which non-controlling interests 25 62
26
Crédit Mutuel Group
27
Annual report 2016
FInAnCIAL StAtementS
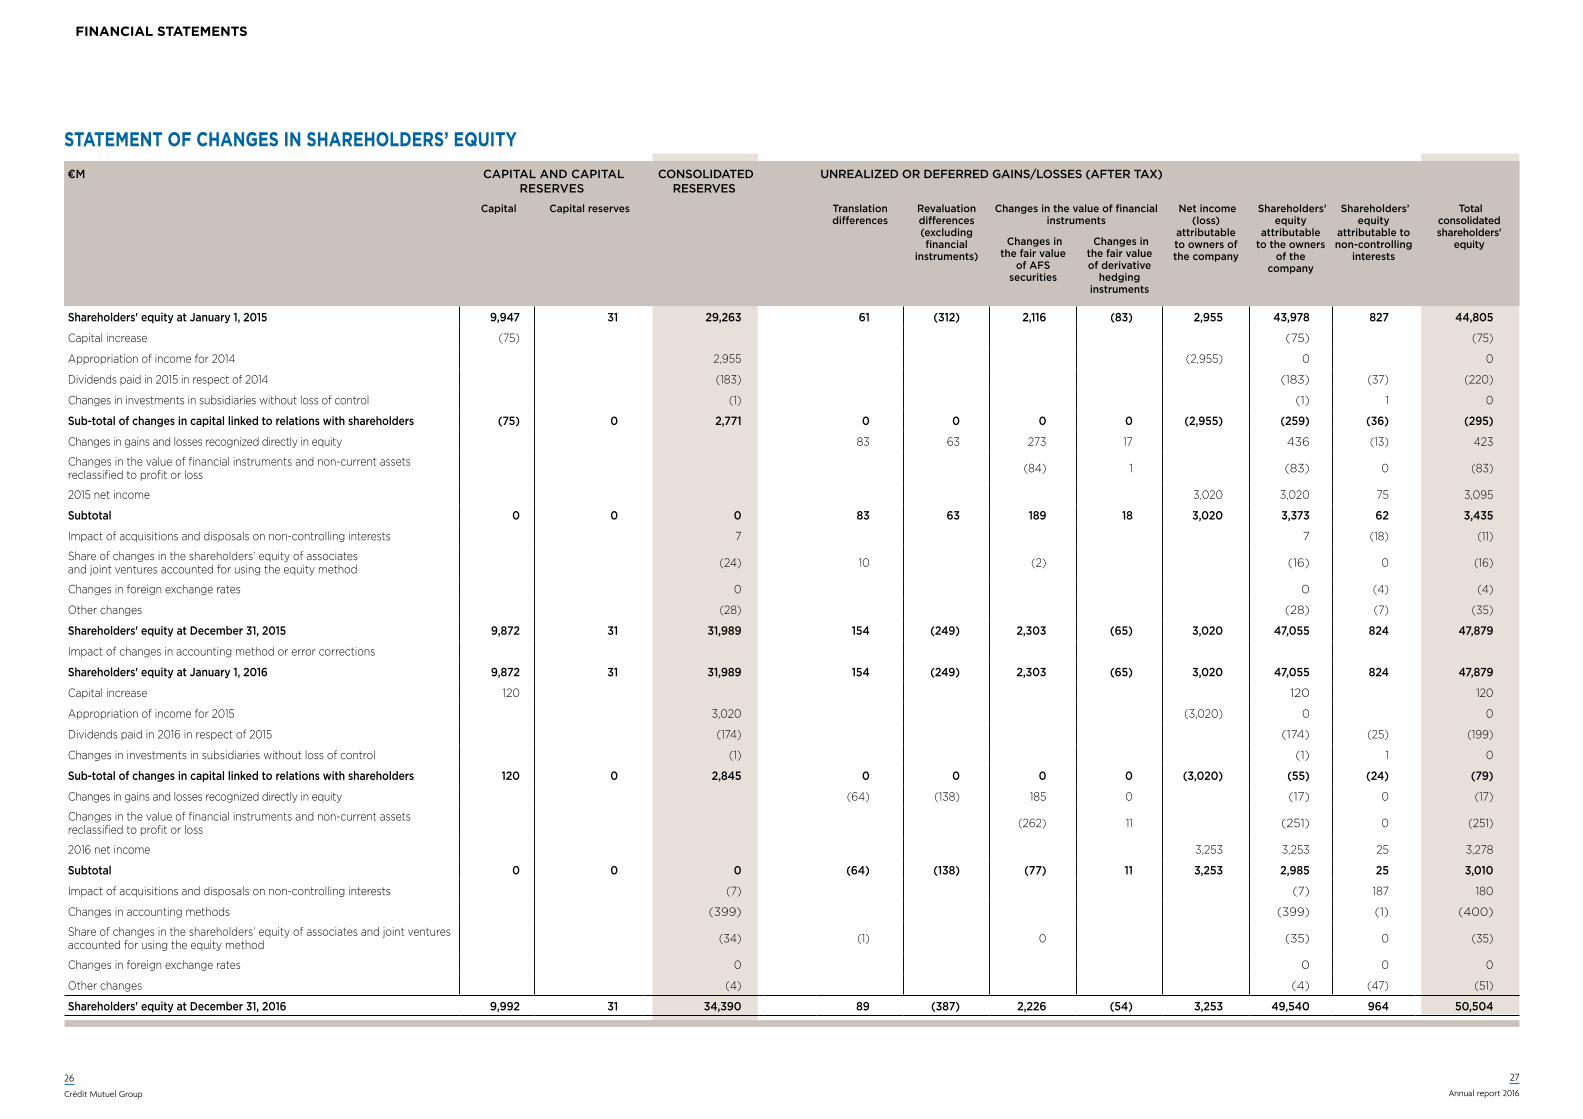
€m Capital and Capital reserves
Consolidated reserves
Unrealized or deferred gains/losses (after tax)
Capital Capital reserves translation differences
revaluation differences (excluding financial
instruments)
Changes in the value of financial instruments
net income (loss)
attributable to owners of the company
shareholders’ equity
attributable to the owners
of the company
shareholders’ equity
attributable to non-controlling
interests
total consolidated shareholders'
equity Changes in the fair value
of afs securities
Changes in the fair value of derivative
hedging instruments
shareholders' equity at January 1, 2015 9,947 31 29,263 61 (312) 2,116 (83) 2,955 43,978 827 44,805
Capital increase (75) (75) (75)
Appropriation of income for 2014 2,955 (2,955) 0 0
Dividends paid in 2015 in respect of 2014 (183) (183) (37) (220)
Changes in investments in subsidiaries without loss of control (1) (1) 1 0
sub-total of changes in capital linked to relations with shareholders (75) 0 2,771 0 0 0 0 (2,955) (259) (36) (295)
Changes in gains and losses recognized directly in equity 83 63 273 17 436 (13) 423
Changes in the value of financial instruments and non-current assets reclassified to profit or loss (84) 1 (83) 0 (83)
2015 net income 3,020 3,020 75 3,095
subtotal 0 0 0 83 63 189 18 3,020 3,373 62 3,435
Impact of acquisitions and disposals on non-controlling interests 7 7 (18) (11)
Share of changes in the shareholders’ equity of associates and joint ventures accounted for using the equity method (24) 10 (2) (16) 0 (16)
Changes in foreign exchange rates 0 0 (4) (4)
Other changes (28) (28) (7) (35)
shareholders' equity at december 31, 2015 9,872 31 31,989 154 (249) 2,303 (65) 3,020 47,055 824 47,879
Impact of changes in accounting method or error corrections
shareholders' equity at January 1, 2016 9,872 31 31,989 154 (249) 2,303 (65) 3,020 47,055 824 47,879
Capital increase 120 120 120
Appropriation of income for 2015 3,020 (3,020) 0 0
Dividends paid in 2016 in respect of 2015 (174) (174) (25) (199)
Changes in investments in subsidiaries without loss of control (1) (1) 1 0
sub-total of changes in capital linked to relations with shareholders 120 0 2,845 0 0 0 0 (3,020) (55) (24) (79)
Changes in gains and losses recognized directly in equity (64) (138) 185 0 (17) 0 (17)
Changes in the value of financial instruments and non-current assets reclassified to profit or loss (262) 11 (251) 0 (251)
2016 net income 3,253 3,253 25 3,278
subtotal 0 0 0 (64) (138) (77) 11 3,253 2,985 25 3,010
Impact of acquisitions and disposals on non-controlling interests (7) (7) 187 180
Changes in accounting methods (399) (399) (1) (400)
Share of changes in the shareholders’ equity of associates and joint ventures accounted for using the equity method (34) (1) 0 (35) 0 (35)
Changes in foreign exchange rates 0 0 0 0
Other changes (4) (4) (47) (51)
shareholders' equity at december 31, 2016 9,992 31 34,390 89 (387) 2,226 (54) 3,253 49,540 964 50,504
StAtement oF CHAnGeS In SHAReHoLDeRS’ eQUItY
28
Crédit Mutuel Group
29
Annual report 2016
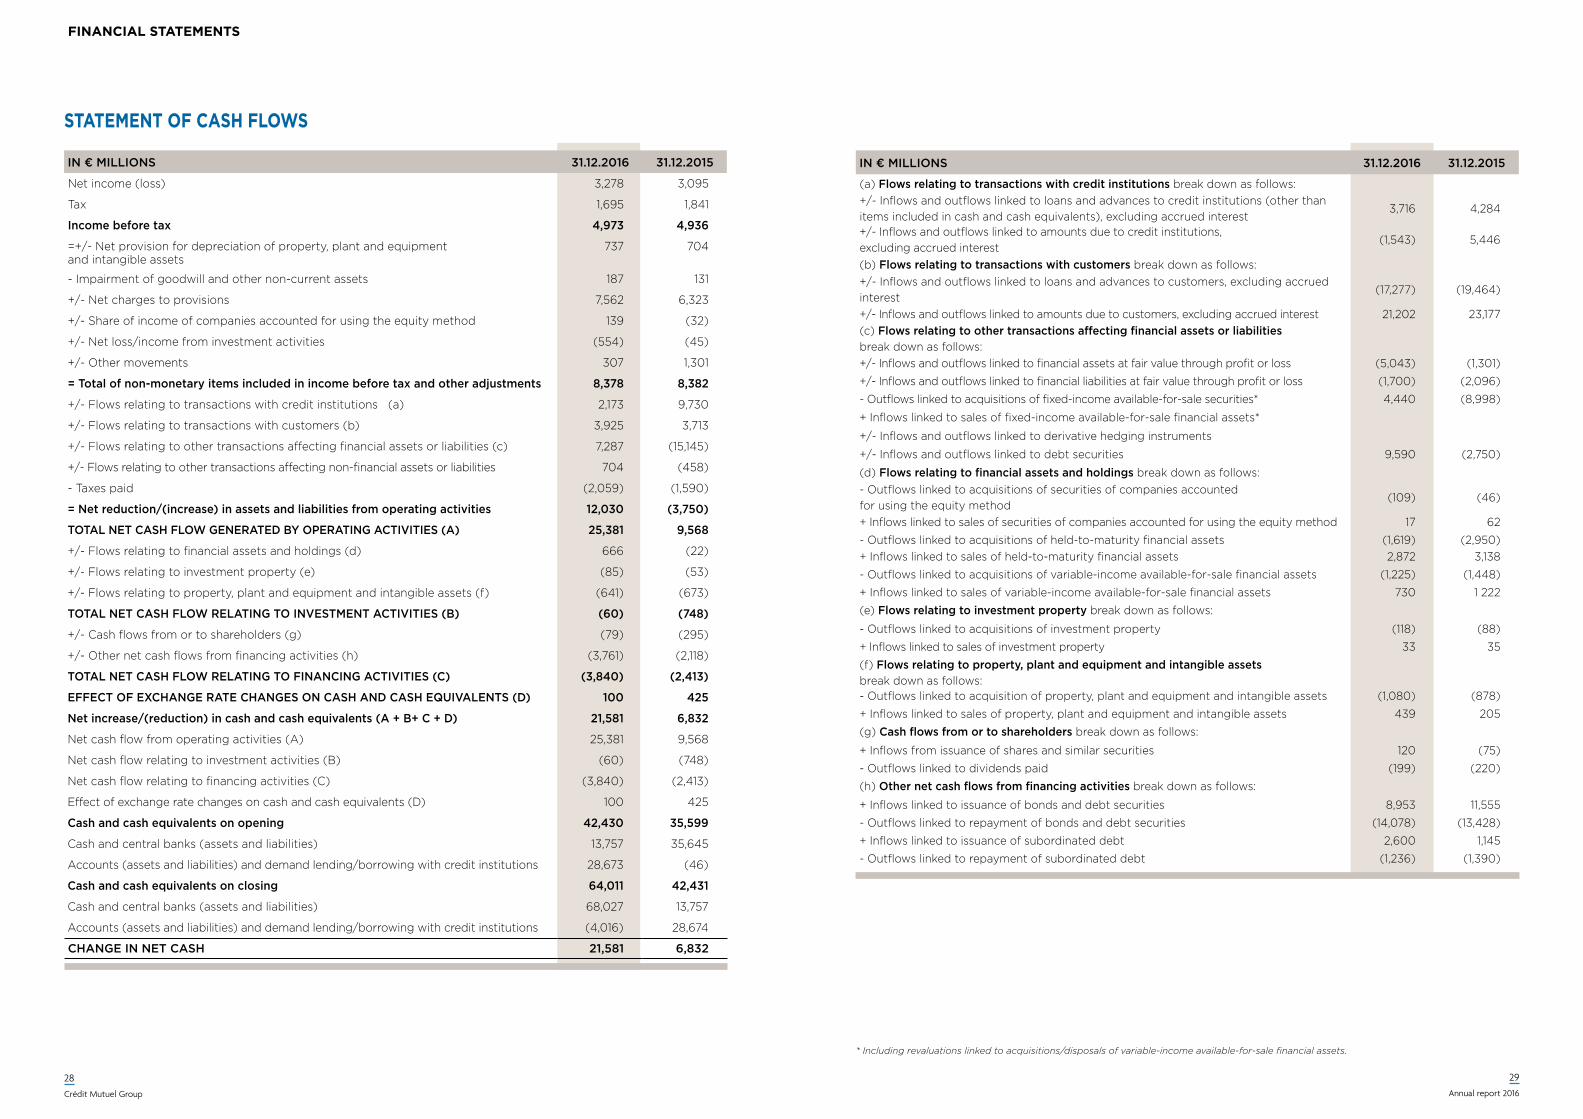
in € millions 31.12.2016 31.12.2015
(a) Flows relating to transactions with credit institutions break down as follows:+/- Inflows and outflows linked to loans and advances to credit institutions (other than items included in cash and cash equivalents), excluding accrued interest
3,716 4,284
+/- Inflows and outflows linked to amounts due to credit institutions, excluding accrued interest
(1,543) 5,446
(b) Flows relating to transactions with customers break down as follows:+/- Inflows and outflows linked to loans and advances to customers, excluding accrued interest
(17,277) (19,464)
+/- Inflows and outflows linked to amounts due to customers, excluding accrued interest 21,202 23,177(c) Flows relating to other transactions affecting financial assets or liabilities break down as follows:+/- Inflows and outflows linked to financial assets at fair value through profit or loss (5,043) (1,301)
+/- Inflows and outflows linked to financial liabilities at fair value through profit or loss (1,700) (2,096)
- Outflows linked to acquisitions of fixed-income available-for-sale securities* 4,440 (8,998)
+ Inflows linked to sales of fixed-income available-for-sale financial assets*
+/- Inflows and outflows linked to derivative hedging instruments
+/- Inflows and outflows linked to debt securities 9,590 (2,750)
(d) Flows relating to financial assets and holdings break down as follows:- Outflows linked to acquisitions of securities of companies accounted for using the equity method
(109) (46)
+ Inflows linked to sales of securities of companies accounted for using the equity method 17 62
- Outflows linked to acquisitions of held-to-maturity financial assets (1,619) (2,950)+ Inflows linked to sales of held-to-maturity financial assets 2,872 3,138
- Outflows linked to acquisitions of variable-income available-for-sale financial assets (1,225) (1,448)
+ Inflows linked to sales of variable-income available-for-sale financial assets 730 1 222
(e) Flows relating to investment property break down as follows:
- Outflows linked to acquisitions of investment property (118) (88)
+ Inflows linked to sales of investment property 33 35
(f) Flows relating to property, plant and equipment and intangible assets break down as follows:- Outflows linked to acquisition of property, plant and equipment and intangible assets (1,080) (878)
+ Inflows linked to sales of property, plant and equipment and intangible assets 439 205
(g) Cash flows from or to shareholders break down as follows:
+ Inflows from issuance of shares and similar securities 120 (75)
- Outflows linked to dividends paid (199) (220)
(h) other net cash flows from financing activities break down as follows:
+ Inflows linked to issuance of bonds and debt securities 8,953 11,555
- Outflows linked to repayment of bonds and debt securities (14,078) (13,428)
+ Inflows linked to issuance of subordinated debt 2,600 1,145
- Outflows linked to repayment of subordinated debt (1,236) (1,390)
in € millions 31.12.2016 31.12.2015
Net income (loss) 3,278 3,095
Tax 1,695 1,841
income before tax 4,973 4,936
=+/- Net provision for depreciation of property, plant and equipment and intangible assets
737 704
- Impairment of goodwill and other non-current assets 187 131
+/- Net charges to provisions 7,562 6,323
+/- Share of income of companies accounted for using the equity method 139 (32)
+/- Net loss/income from investment activities (554) (45)
+/- Other movements 307 1,301
= Total of non-monetary items included in income before tax and other adjustments 8,378 8,382
+/- Flows relating to transactions with credit institutions (a) 2,173 9,730
+/- Flows relating to transactions with customers (b) 3,925 3,713
+/- Flows relating to other transactions affecting financial assets or liabilities (c) 7,287 (15,145)
+/- Flows relating to other transactions affecting non-financial assets or liabilities 704 (458)
- Taxes paid (2,059) (1,590)
= net reduction/(increase) in assets and liabilities from operating activities 12,030 (3,750)
ToTAl nET CAsH FloW GEnERATED BY oPERATinG ACTiViTiEs (A) 25,381 9,568
+/- Flows relating to financial assets and holdings (d) 666 (22)
+/- Flows relating to investment property (e) (85) (53)
+/- Flows relating to property, plant and equipment and intangible assets (f) (641) (673)
ToTAl nET CAsH FloW RElATinG To inVEsTmEnT ACTiViTiEs (B) (60) (748)
+/- Cash flows from or to shareholders (g) (79) (295)
+/- Other net cash flows from financing activities (h) (3,761) (2,118)
ToTAl nET CAsH FloW RElATinG To FinAnCinG ACTiViTiEs (C) (3,840) (2,413)
EFFECT oF EXCHAnGE RATE CHAnGEs on CAsH AnD CAsH EQUiVAlEnTs (D) 100 425
net increase/(reduction) in cash and cash equivalents (A + B+ C + D) 21,581 6,832
Net cash flow from operating activities (A) 25,381 9,568
Net cash flow relating to investment activities (B) (60) (748)
Net cash flow relating to financing activities (C) (3,840) (2,413)
Effect of exchange rate changes on cash and cash equivalents (D) 100 425
Cash and cash equivalents on opening 42,430 35,599
Cash and central banks (assets and liabilities) 13,757 35,645
Accounts (assets and liabilities) and demand lending/borrowing with credit institutions 28,673 (46)
Cash and cash equivalents on closing 64,011 42,431
Cash and central banks (assets and liabilities) 68,027 13,757
Accounts (assets and liabilities) and demand lending/borrowing with credit institutions (4,016) 28,674
CHAnGE in nET CAsH 21,581 6,832
StAtement oF CASH FLoWS
* Including revaluations linked to acquisitions/disposals of variable-income available-for-sale financial assets.
FInAnCIAL StAtementS
FINANCIAL STATEMENTSNOTES
30
Crédit Mutuel Group
31
Annual report 2016
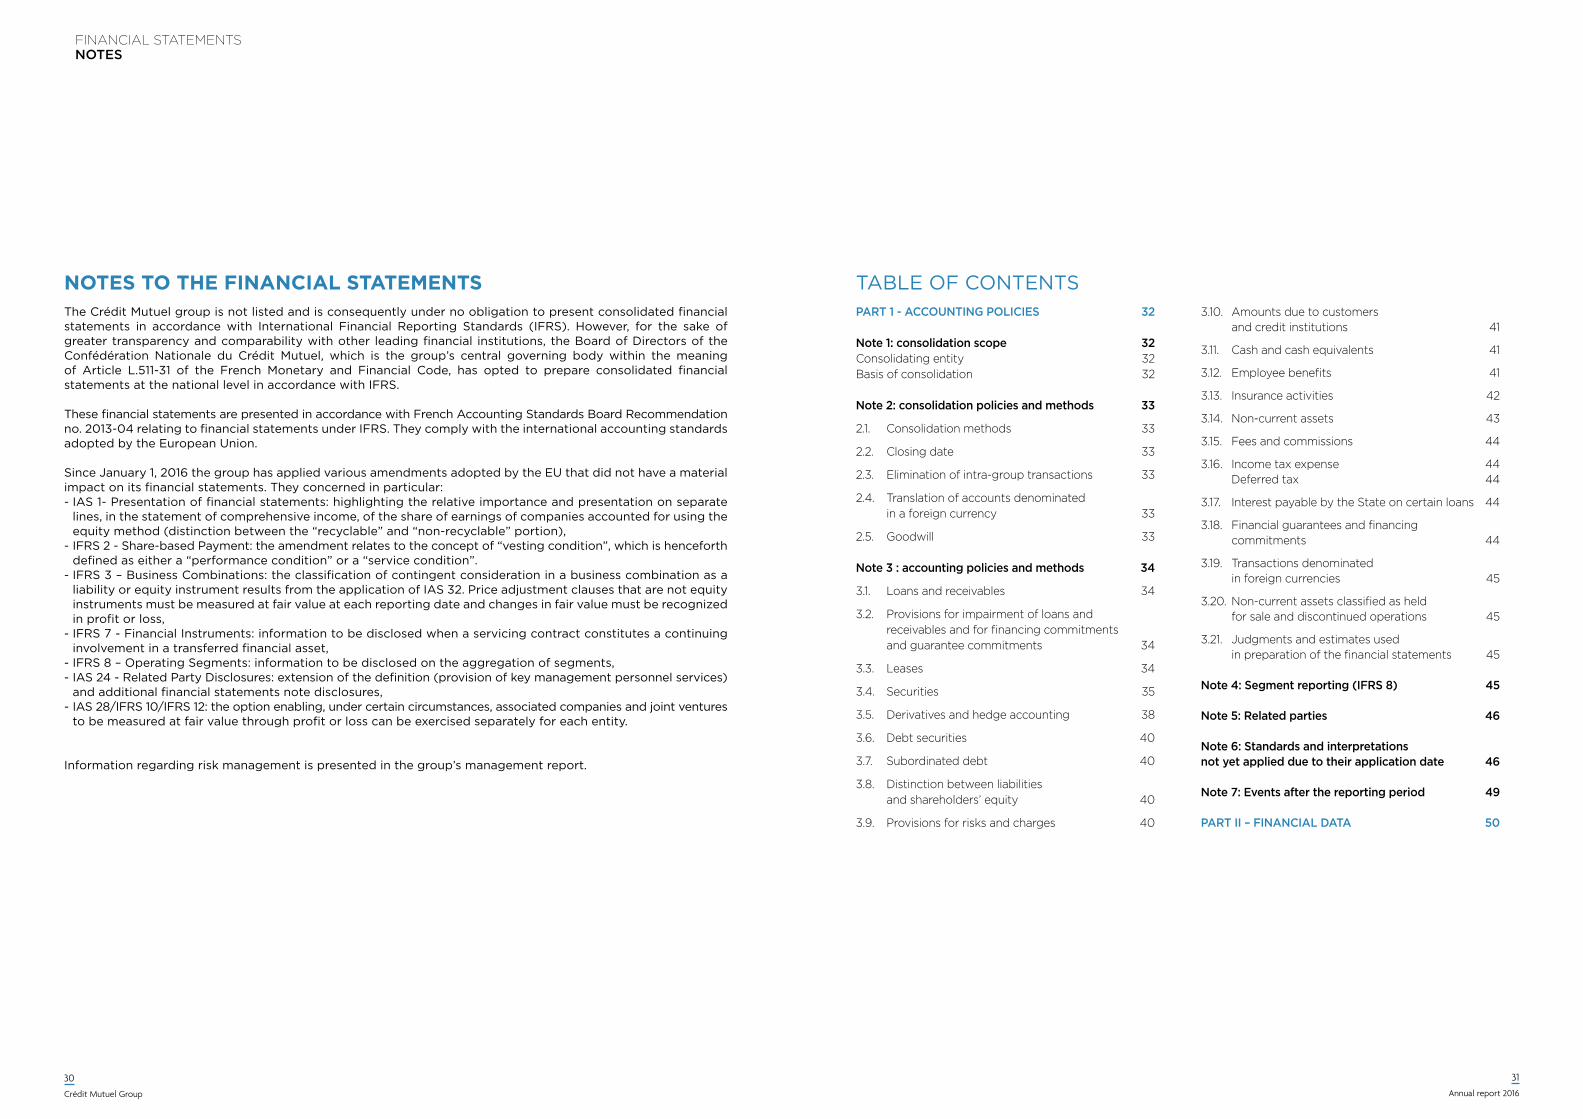
The Crédit Mutuel group is not listed and is consequently under no obligation to present consolidated financial statements in accordance with International Financial Reporting Standards (IFRS). however, for the sake of greater transparency and comparability with other leading financial institutions, the Board of Directors of the Confédération Nationale du Crédit Mutuel, which is the group’s central governing body within the meaning of Article L.511-31 of the French Monetary and Financial Code, has opted to prepare consolidated financial statements at the national level in accordance with IFRS.
These financial statements are presented in accordance with French Accounting Standards Board Recommendation no. 2013-04 relating to financial statements under IFRS. They comply with the international accounting standards adopted by the European Union.
Since January 1, 2016 the group has applied various amendments adopted by the EU that did not have a material impact on its financial statements. They concerned in particular:- IAS 1- Presentation of financial statements: highlighting the relative importance and presentation on separate
lines, in the statement of comprehensive income, of the share of earnings of companies accounted for using the equity method (distinction between the “recyclable” and “non-recyclable” portion),
- IFRS 2 - Share-based Payment: the amendment relates to the concept of “vesting condition”, which is henceforth defined as either a “performance condition” or a “service condition”.
- IFRS 3 – Business Combinations: the classification of contingent consideration in a business combination as a liability or equity instrument results from the application of IAS 32. Price adjustment clauses that are not equity instruments must be measured at fair value at each reporting date and changes in fair value must be recognized in profit or loss,
- IFRS 7 - Financial Instruments: information to be disclosed when a servicing contract constitutes a continuing involvement in a transferred financial asset,
- IFRS 8 – Operating Segments: information to be disclosed on the aggregation of segments,- IAS 24 - Related Party Disclosures: extension of the definition (provision of key management personnel services)
and additional financial statements note disclosures,- IAS 28/IFRS 10/IFRS 12: the option enabling, under certain circumstances, associated companies and joint ventures
to be measured at fair value through profit or loss can be exercised separately for each entity.
Information regarding risk management is presented in the group’s management report.
PART 1 - ACCOUNTING POLICIES 32
Note 1: consolidation scope 32Consolidating entity 32Basis of consolidation 32
Note 2: consolidation policies and methods 33
2.1. Consolidation methods 33
2.2. Closing date 33
2.3. Elimination of intra-group transactions 33
2.4. Translation of accounts denominated in a foreign currency 33
2.5. Goodwill 33
Note 3 : accounting policies and methods 34
3.1. Loans and receivables 34
3.2. Provisions for impairment of loans and receivables and for financing commitments and guarantee commitments 34
3.3. Leases 34
3.4. Securities 35
3.5. Derivatives and hedge accounting 38
3.6. Debt securities 40
3.7. Subordinated debt 40
3.8. Distinction between liabilities and shareholders’ equity 40
3.9. Provisions for risks and charges 40
3.10. Amounts due to customers and credit institutions 41
3.11. Cash and cash equivalents 41
3.12. Employee benefits 41
3.13. Insurance activities 42
3.14. Non-current assets 43
3.15. Fees and commissions 44
3.16. Income tax expense 44 Deferred tax 44
3.17. Interest payable by the State on certain loans 44
3.18. Financial guarantees and financing commitments 44
3.19. Transactions denominated in foreign currencies 45
3.20. Non-current assets classified as held for sale and discontinued operations 45
3.21. Judgments and estimates used in preparation of the financial statements 45
Note 4: Segment reporting (IFRS 8) 45
Note 5: Related parties 46
Note 6: Standards and interpretations not yet applied due to their application date 46
Note 7: Events after the reporting period 49
PART II – FINANCIAL DATA 50
TABLE OF CONTENTSnoteS to tHe FInAnCIAL StAtementS
FINANCIAL STATEMENTSNOTES
32
Crédit Mutuel Group
33
Annual report 2016
I/ ACCOUNTING PoLICIeS
NOTE 1:CONSOLIDATION SCOPE
Crédit Mutuel is a co-operative bank governed by the Law of September 10, 1947. It is owned solely by its members, who hold member shares (‘A’ shares). Members are each entitled to one vote at general meetings, where their powers include the election of directors.
The three levels of organization - local, regional and national - operate on a decentralized basis in accordance with the principle of subsidiarity. The local mutual banks, which are in closest contact with members and customers, carry out all the principal functions of bank branch offices, with the other two levels exercising only those functions that the local entities are not in a position to carry out alone.
Under Article L.511-30 of the French Monetary and Financial Code, the Confédération Nationale is the central governing body for the group. As such it is responsible for:- ensuring the liquidity and solvency of the Crédit Mutuel
network,- representing Crédit Mutuel before the public authori-
ties and defending and promoting its interests,- and, more generally, ensuring the overall cohesion of
the network and overseeing its functioning and busi-ness development while at the same time exercising administrative, technical and financial control over the regional groups and their subsidiaries.
The method for consolidating a group with such a dis-tinctive capital ownership structure is based on deter-mining a consolidating entity that reflects the commu-nity of members linked by shared financial solidarity and governance.
• Consolidating entity
The consolidating entity for the Crédit Mutuel group is composed of all the local mutual banks, the federal banks (general purpose and farming/rural), the regional federations, Caisse Centrale du Crédit Mutuel, the Confédération Nationale du Crédit Mutuel, and Fédération du Crédit Mutuel Agricole et Rural.
The capital of the consolidating entity is thus owned exclusively by all the members of the local mutual banks.
• Basis of consolidation
The general principles for the inclusion of an entity within the consolidation scope are as defined in IFRS 10, IFRS 11 and IAS 28 (revised).
All the entities included in the consolidation scopes
of the regional groups are included in the national
consolidation scope. Jointly-held companies, not
consolidated at regional level, are excluded from the
national consolidation scope if their total assets or
earnings have an impact of 1% or less on the consolidated
equivalent. However, an entity that does not reach this
threshold may be consolidated if its activity or intended
development result in it being considered a strategic
investment.
The consolidation scope comprises:
- Entities controlled exclusively: exclusive control is
presumed to exist when the group investor has power
over and is exposed, or has rights, to variable returns
from its involvement with the investee and has the
ability to affect those returns through its power over
the investee. The financial statements of entities
controlled exclusively are fully consolidated.
- Entities controlled jointly: joint control is the contractually
agreed sharing of control of an entity, which exists
only when decisions about the relevant activities
require the unanimous consent of the parties sharing
control. When two parties or more exercise joint
control, this amounts to a joint arrangement, which is
considered either a joint operation or a joint venture:
• a joint operation is a joint arrangement whereby the
parties that have joint control of the arrangement
have rights to the assets, and obligations for the
liabilities, relating to the entity. The joint operator
recognizes its assets, liabilities, revenue and expenses
in relation to its interest in the joint operation.
• a joint venture is a joint arrangement whereby the
parties that have joint control of the arrangement
have rights to the entity’s net assets. The joint venturer
recognizes its interest in the entity using the equity
method.
All entities over which the group exercises joint control
are joint ventures within the meaning of IFRS 11.
- Entities over which significant influence is exercised:
these are entities over whose financial and operational
policies the group exercises significant influence but
does not have control. Entities over which the group
exercises significant influence are consolidated using
the equity method.
Holdings belonging to private equity companies and
over which the group exercises joint control or significant
influence are recognized at fair value by option.
NOTE 2: CONSOLIDATION POLICIES AND METHODS
2.1 CONSOLIDATION METHODS
The following consolidation methods have been used:
• Full consolidation
This method consists of substituting the various assets and liabilities of the subsidiary concerned for the value of the securities held and of recognizing the share of non-controlling interests in shareholders’ equity and net profit. It is applied to all exclusively-controlled entities, including those with a different accounts structure, regardless of whether or not the activity concerned forms part of the consolidating entity’s activities.
Non-controlling interests correspond to participating interests not resulting in control being exercised as defined by IFRS 10 and include instruments constituting present ownership interests and conferring rights to a share of the net assets in the event of liquidation and other capital instruments issued by the subsidiary but not held by the group.
UCITS, notably those representing unit-linked policies of insurance undertakings, are recognized at fair value through profit or loss. The amounts corresponding to non-controlling interests are recognized under “Other liabilities”.
• Equity method of consolidation
The equity method of consolidation consists of substituting the group’s share of the shareholders’ equity and net profit of the entity concerned for the value of the securities held. It is applied to all entities determined to be joint ventures or over which significant influence is exercised.
2.2 CLOSING DATE
All the companies included in the group’s consolidation scope close their accounts on December 31 of each year.
2.3 ELIMINATION OF INTRA-GROUP TRANSACTIONS
Intra-group accounts and any effects resulting from intra-group transfers that would have a material impact on the consolidated financial statements are eliminated.
2.4 TRANSLATION OF ACCOUNTS DENOMINATED IN A FOREIGN CURRENCy
Concerning foreign entities whose accounts are denominated in a foreign currency, the balance sheet is translated using the official exchange rate on the closing date. The translation difference arising on the capital, reserves and retained earnings is recognized in shareholders’ equity, under “Translation reserves”. The income statement is translated using the average exchange rate for the year. The resulting translation differences are recognized directly in “Translation reserves”. Such differences are transferred to profit and loss in the event of the disposal or liquidation of all or part of the holding in the foreign entity.
2.5 GOODwILL
• Fair value adjustments
On the date that control of a new entity is acquired, the assets, liabilities and contingent operating liabilities are measured at their fair value. Fair value adjustments, corresponding to the difference between the carrying amount and fair value, are recognized in the consolidated financial statements.
• Goodwill
In compliance with IFRS 3 (revised), on the date that control of a new entity is acquired, those identifiable assets, liabilities and contingent liabilities of the acquiree meeting criteria for recognition under IFRS are measured at fair value on the date of acquisition, except for non-current assets classified as assets held for sale, which are recognized at the lowest of fair value less costs to sell and carrying amount. IFRS 3 (revised) permits goodwill to be recognized on a full basis or on a proportional basis, the choice being available for each business combination. In the case of full goodwill, non-controlling interests are measured at fair value, whereas in the case of partial goodwill, they are measured based on their share of the values attributed to the assets and liabilities of the acquired entity. If goodwill is positive, it is recognized as an asset and, if negative, it is recognized immediately in the income statement under “Changes in value of goodwill”.
If there is an increase (decrease) in the group’s percentage holding in a controlled entity, the difference between the acquisition cost (sale price) of the securities and the share of consolidated shareholders’ equity represented by such securities on the date of acquisition (date of sale) is recognized in shareholders’ equity.
The group regularly (at least once each year) tests goodwill for impairment. These tests are intended to ensure that goodwill has not experienced any impairment.
FINANCIAL STATEMENTSNOTES
34
Crédit Mutuel Group
35
Annual report 2016
3.3 LEASES
A lease is an agreement under which the lessor grants to the lessee, for a pre-determined period, the right to use an asset in exchange for a payment or series of payments.
A finance lease is a lease under which virtually all of the risks and benefits inherent in the ownership of an asset are transferred to the lessee. Ownership of the asset may or may not eventually be transferred.
An operating lease is any lease that is not a finance lease.
• Finance leases – lessor
In accordance with IAS 17, finance lease transactions with non-group companies are reported on the consolidated balance sheet at their financial accounting amount.
Analysis of the economic substance of transactions results, in the accounts of the lessor, in: - recognition of a financial receivable due from the
customer, amortized by the lease payments received;- breakdown of the lease payments between interest
and the amortization of the principal, known as financial amortization;
- recognition of a net unrealized reserve, equal to the difference between:• the net financial outstanding: the amount due by
the lessee, comprising the remaining principal due and accrued interest at the closing date;
• the net carrying amount of the leased non-current assets;
• the deferred tax provision.
• Finance leases – lessee
In accordance with IAS 17, the non-current assets concerned are recorded on the balance sheet as assets and the borrowing from credit institutions is recorded as a liability. Lease payments are broken down between interest expense and repayment of principal.
3.4 SECURITIES
• Determination of fair value of financial instruments
Fair value is the amount for which an asset could be sold, or a liability transferred, between knowledgeable, willing parties in an arm’s length transaction.
On initial recognition of a financial instrument, fair value is generally the transaction price.
When measured subsequently, fair value must be determined. The measurement method applied varies depending on whether the financial instrument is traded in a market considered as active or not.
• Financial instruments traded in an active market
When financial instruments are traded in an active market, fair value is determined by reference to their quoted price as this represents the best possible estimate of fair value. A financial instrument is regarded as quoted in an active market if quoted prices are readily and regularly available from an exchange, dealer, broker or pricing service, and those prices represent actual market transactions regularly occurring on an arm’s length basis.
• Financial instruments not traded in an active market
Observable market data is used when this data reflects the reality of a transaction in an arm’s length exchange on the valuation date and there is no need for material adjustments to the valuation obtained in this way. Otherwise, the group uses non-observable data, applying a mark-to-model approach.
When there is no observable data or when adjustments to market prices require reliance to be placed on non-observable data, the entity may use internal assumptions regarding future cash flows and discount rates, comprising adjustments for risks in the same way as the market would. These valuation adjustments are used, notably, to integrate risks that would not be captured by the model, liquidity risks associated with the instrument or parameter concerned, and specific risk premiums intended to offset any additional costs resulting from a dynamic management strategy associated with the model in certain market conditions. When determining valuation adjustments, each risk factor is considered individually, without allowance for any diversification effect for risks, parameters or models of a different nature. A portfolio approach is most often used often used for a given risk factor.
In all instances, the adjustments made by the group are reasonable and appropriate, with reliance placed on judgment.
• Fair value hierarchy
A three-level hierarchy is used for fair value measurement:- Level 1: quoted prices in active markets for identical
assets or liabilities; this notably concerns debt securities quoted by at least three contributors, and derivatives quoted on an organized market;
If the recoverable amount of the cash-generating unit (CGU) to which goodwill has been allocated is less than its carrying amount, an impairment loss is recognized for the amount of the difference. This impairment loss, recognized in profit and loss, is irreversible. In practice, cash-generating units are defined on the basis of the group’s business lines.
NOTE 3: ACCOUNTING POLICIES AND METHODS
3.1 LOANS AND RECEIvABLES
Loans and receivables are fixed or determinable- income financial assets not listed on an active market, which are not intended for sale when acquired or granted. They include loans granted directly or the bank’s share of syndicated loans, loans acquired and unlisted debt securities. When first recorded on the balance sheet, they are recognized at their fair value, which is generally the net amount disbursed. The interest rates applied to loans granted are deemed to represent market rates, since they are constantly adjusted in line with the interest rates applied by the vast majority of competitor banks. At subsequent period ends, the outstandings are measured at their amortized cost using the effective interest rate method (other than those recognized using the fair value by option method).
Commissions received or paid that are directly related to setting up the loan and are treated as an additional component of interest are recognized over the life of the loan using the effective interest rate method and are shown under interest items in the income statement.Commissions received in connection with the commercial renegotiation of loans are recognized over more than one period. Renegotiation involves an amendment to or the derecognition of the original loan.
The restructuring of a loan due to the borrowers’ financial problems requires novation of the contract. Following the definition of this concept by the European Banking Authority, the group has integrated it into its information systems to ensure consistency between the accounting and prudential definitions. The relevant financial information is included in the management report.
The fair value of loans and receivables is disclosed in the notes to the financial statements on each closing date: it comprises the present value of projected future cash flows discounted using a zero-coupon interest rate curve, which includes the issuer cost inherent to the debtor.
3.2 PROvISIONS FOR IMPAIRMENT OF LOANS AND RECEIvABLES AND FOR FINANCING COMMITMENTS AND GUARANTEE COMMITMENTS
• Individual provisions for impairment of loans and receivables
Impairment is recognized once there is objective evidence of the existence of an event or events occurring subsequent to the granting of the loan – or group of loans – and likely to generate a loss. An analysis is performed on a contract-by-contract basis at each period end. The amount of impairment is equal to the difference between the carrying amount and the present value of the projected future cash flows discounted at the original effective interest rate on the loan, taking into account any guarantees. For variable-rate loans, the last known contractual rate is used.The existence of unpaid past due amounts for more than three months or of current accounts that have been non-compliant for more than three months represents objective evidence of a loss event. Similarly, an objective indication of loss is identified when it is probable that the debtor will not be able to repay all the amounts due, when a default event has taken place or in the event of a court-ordered liquidation.Impairment losses and provisions are recognized as a component of the cost of risk. When reversed, impairment losses and provisions are treated as a reduction in the cost of risk for the portion relating to the change in risk, while the portion relating to the impact of the passage of time is recognized in the interest margin. The provision is deducted from loans and receivables when it relates to impaired assets and recognized as a liability under provisions for risks when it relates to financing and guarantee commitments (see Note 3.9).Irrecoverable receivables are written off and the corresponding impairment losses and provisions are written back.
• Collective provisions for impairment of loans and receivables
All loans to customers not written down for impairment on an individual basis are grouped together into homogeneous pools of exposures. Exposures at risk are subject to an impairment provision based on the actual loss rate and the probability of default to maturity observed internally or externally, applied to the loan outstandings. This provision is recognized as a deduction from the corresponding assets in the balance sheet and changes during the period are recognized in the cost of risk in profit or loss.
FINANCIAL STATEMENTSNOTES
36
Crédit Mutuel Group
37
Annual report 2016
If there is a transfer to one of the other three categories, the financial asset’s fair value on the transfer date is treated subsequently as representing cost or amortized cost. No gain or loss recognized prior to transfer may be reversed.
Available-for-sale financial assets
• Classification criteria and transfer rules
Available-for-sale financial assets comprise financial assets not classified as loans and receivables or held-to-maturity financial assets, nor as at fair value through profit or loss.Fixed income securities may be reclassified as:- held-to-maturity financial assets if there is a change
in management intention, providing these assets meet the classification criteria for this category;
- loans and receivables if there is a change in management intention and an ability to hold these securities over the foreseeable future or until their maturity, providing these assets meet the classification criteria for this category.
There has been no reclassification since 2008.
• Basis for measurement and recognition of income and charges
These assets are recognized on the balance sheet at fair value when they are acquired and at subsequent balance sheet dates until such time as they are disposed of. Changes in fair value are recorded in shareholders’ equity under a specific heading entitled “Unrealized or deferred gains or losses”, excluding accrued income. Unrealized gains or losses recognized in equity are recognized in profit or loss only when the assets are disposed of or when evidence of permanent impairment is observed. On disposal, the unrealized gains or losses previously recognized in equity are transferred to profit or loss under “Net gains (losses) on available-for-sale financial assets”, together with the gain or loss on disposal. Purchases and sales of securities are recognized on the settlement date.If securities with a fixed maturity are transferred from available-for-sale financial assets to held-to-maturity financial assets or to loans and receivables, and in the absence of impairment losses, unrealized gains or losses previously recognized directly to equity are reversed over the residual life of the asset. If securities with no fixed maturity are transferred to loans and receivables, unrealized gains or losses previously recognized directly to equity are maintained in equity until the sale of the securities.
Income accrued or received on fixed-income securities is recognized in profit or loss under “Interest and similar income”, using the effective interest rate method.
Dividends received on variable-yield securities are recorded in profit or loss under “Net gains (losses) on available-for-sale financial assets”.
• Impairment and credit risk
a) Lasting diminution in the value of shares and other equity instruments
Impairment losses are recognized in respect of variable-income financial assets classified as available for sale in the event of a prolonged or material decline in fair value relative to cost.
In the case of variable-income securities, at Crédit Mutuel a loss in the value of an instrument relative to its acquisition cost of 50% or more or over a period of 36 consecutive months triggers the recognition of an impairment loss. Impairment testing is carried out on a line-by-line basis. Judgment is also exercised for securities not meeting the aforementioned criteria when management estimates that the recovery of the amount invested cannot reasonably be expected in the near future. The loss is recognized in profit and loss under “Net gains (losses) on available-for-sale financial assets”.
Any subsequent impairment is also recognized in profit and loss.Losses for permanent impairment of shares and other equity instruments recorded in profit and loss may not be reversed as long as the instrument is carried on the balance sheet. In the event of a subsequent appreciation in value, this will be recognized in equity within “Unrealized or deferred gains and losses”.
b) Impairment losses in respect of credit risk
Impairment losses relating to fixed-income available-for-sale securities (mainly bonds) are recognized under “Cost of risk”. The existence of a credit risk alone justifies recognizing impairment losses against fixed-income securities; a decline in value due simply to an increase in interest rates does not. In the event an impairment loss is recognized, all accumulated unrealized losses taken to equity must be reversed to profit or loss. Impairment losses may be reversed. Any subsequent appreciation resulting from an event occurring since the recognition of the impairment loss is also recognized in profit or loss under “Cost of risk” when there has been an improvement in the borrower’s credit situation.
Held-to-maturity financial assets
• Classification criteria and transfer rules
Held-to-maturity financial assets are securities with fixed or determinable payments and a fixed maturity,
- Level 2: inputs other than quoted prices included within level 1 that are observable for the asset or liability in question, either directly (i.e. as prices) or indirectly (i.e. derived from prices); this level includes notably interest rate swaps for which fair value is determined with the help of yield curves produced on the basis of market interest rates at the balance sheet date; and
- Level 3: inputs for the asset or liability that are not based on observable market data (unobservable inputs); this category includes notably unconsolidated participating interests held (via venture capital entities or not) as part of the capital markets activities, debt securities quoted by a sole contributor and derivatives valued using mainly non-observable data.
The instrument is classified at the same level of the hierarchy as the lowest level of the input having an important bearing on fair value considered as a whole. Given the diverse nature and quantity of the instruments valued as Level 3, the calculation of fair value sensitivity to changes in the valuation parameters would not provide meaningful information.
• Accounting classification of securities
Securities may be classified in one of the following categories:- financial assets at fair value through profit or loss;- available-for-sale financial assets;- held-to-maturity financial assets; or- loans and receivables.
Classification in one or other of these categories reflects the group’s management intention and determines how a particular instrument is recognized and measured in the financial statements.
Financial assets and financial liabilities at fair value through profit or loss
• Classification criteria and transfer rules
Securities are classified in this category when acquired for the purpose of selling them in the near term or because, upon initial recognition, they were designated as at fair value through profit or loss.
a) Instruments held for trading:
Securities are classified as held for trading if they were acquired principally for the purpose of selling them in the near term or if they are part of a globally managed portfolio for which there is evidence of a recent actual pattern of short-term profit-taking.Market conditions may prompt the Crédit Mutuel group to review the investment strategy and management intention for these securities. When it would be untimely to sell securities purchased initially for the purpose of
selling them in the near term, these securities may be reclassified in accordance with the provisions of the amendments to IAS 39 issued in October 2008. Transfers to available-for-sale financial assets or to held-to- maturity financial assets are permitted in exceptional circumstances. Transfers to loans and receivables are permitted when the group has the positive intention and ability to hold these securities over the foreseeable future or until their maturity, and when the assets transferred meet the criteria for recognition as loans and receivables, in particular the requirement that they not be quoted in an active market. No transfer of this type has occurred since 2008, but when such a transfer is made this aims to better reflect the current management intention for these instruments and to reflect more faithfully their impact on the group’s results.
b) Instruments designated as at fair value through profit or loss:
Financial instruments may be designated as at fair value through profit or loss upon initial recognition. Once designated as such, financial instruments cannot be reclassified. This classification is permitted in the following circumstances:- financial instruments containing one or several
separable embedded derivatives,- instruments for which the accounting treatment
would be inconsistent with that applied to another related instrument, were the fair value option not applied, and
- instruments belonging to a pool of financial assets measured and accounted for at fair value.
The group has used this option in particular for unit-linked insurance policies, for consistency with the treatment applied to liabilities, and for private equity securities and certain debts issued that contain embedded derivatives.
• Basis for measurement and recognition of income and charges
Securities classified as assets and liabilities at fair value through profit or loss are recognized on the balance sheet at fair value when they are first recorded and at all subsequent balance sheet dates until such time as they are disposed of. Changes in fair value and income received or accrued on fixed income securities classified in this category are recorded in profit or loss under “Net gains (losses) on financial instruments at fair value through profit or loss”. Purchases and sales of securities measured at fair value through profit or loss are recognized on the settlement date. Changes in fair value between the transaction and settlement dates are recognized in profit or loss.
FINANCIAL STATEMENTSNOTES
38
Crédit Mutuel Group
39
Annual report 2016
• Classification of derivatives and hedge accounting
Derivatives classified as financial assets or financial liabilities at fair value through profit or loss
All derivatives not designated as hedging instruments under IFRS are automatically classified as financial assets or financial liabilities at fair value through profit or loss, even when for financial purposes they were entered into to hedge one or more risks.
• Embedded derivatives
An embedded derivative is a component of a hybrid instrument that, when separated from its host contract, meets the definition criteria for a derivative. It has the effect, notably, of changing certain cash flows in a manner analogous to that of a stand-alone derivative. The derivative is detached from the host contract and recognized separately as a derivative instrument at fair value through profit or loss only if all of the following conditions are satisfied:- they meet the definition of a derivative;- the hybrid instrument hosting the embedded derivative
is not measured at fair value through profit or loss;- the economic characteristics of the derivative and
the associated risks are not considered as being closely related to those of the host contract; and
- separate measurement of the embedded derivative is sufficiently reliable to provide relevant information.
• Accounting
Realized and unrealized gains and losses are recognized in profit or loss under “Gains and losses on financial instruments at fair value through profit or loss”.
Hedge accounting
IAS 39 provides for three types of hedging relationship. The choice of the hedging relationship is made according to the nature of the risk being hedged.
• A fair value hedge is a hedge of the exposure to changes in the fair value of financial assets or financial liabilities.
• A cash flow hedge is a hedge of the exposure to the variability in cash flows of financial assets or financial liabilities, firm commitments or forward transactions.
• Hedges of net investments in foreign operations, which are accounted for in the same way as cash flow hedges, have not been used by the group to date.
Hedging derivatives must meet the criteria stipulated by IAS 39 to be designated as hedging instruments for accounting purposes. In particular:
the hedging instrument and the hedged item must both qualify for hedge accounting.- The relationship between the hedged item and the
hedging instrument must be documented formally immediately upon inception of the hedging relationship. This documentation sets outs notably the risk management objectives of the hedging relationship, as determined by management, the nature of the risk hedged, the underlying strategy, and the methods used to measure the effectiveness of the hedge.
- Hedge effectiveness must be proved immediately upon inception of the hedging relationship and subsequently throughout its life, at the very least at each balance sheet date. Changes in the fair value or cash flows of the hedging instrument must approximately offset changes in the fair value or cash flows of the hedged item. Actual results must be within a range of 80% to 125%.
If this is not the case, hedge accounting is discontinued prospectively.
• Fair value hedge of identified financial assets or liabilities
In the case of a fair value hedge, derivatives are remeasured at their fair value, with any change being recognized in profit or loss under “Net gains (losses) on financial instruments at fair value through profit or loss”. The revaluation of the hedged items, in connection with the hedged risk, is treated in the same way and results in a charge or credit to profit or loss. This rule is also applied if the hedged item is recognized at its amortized cost or in the case of a financial asset classified as available for sale. Changes in the fair value of the hedging instrument and hedged risk component will offset each other partially or totally; only the ineffective portion of the hedge is recognized in profit or loss.
The portion corresponding to the rediscounting of the derivative financial instrument is recognized in profit or loss under “Interest income and charges”. The same treatment is applied to the interest income or charges for the hedged item.
If the hedging relationship is interrupted or the effectiveness criteria are not met, hedge accounting is discontinued on a prospective basis. The hedging derivatives are transferred to financial assets or financial liabilities at fair value through profit or loss and are accounted for in accordance with the principles applicable to this category. The carrying amount of the hedged item is subsequently no longer adjusted to reflect changes in fair value. In the case of initially hedged identified interest rate instruments, valuation adjustments are amortized over their remaining life. If
and which the Crédit Mutuel group has the positive intention and ability to hold to maturity.Transactions to hedge the interest rate risk in respect of this category of securities are not eligible for hedge accounting under IAS 39.Moreover, possibilities for selling or transferring held-to-maturity securities are extremely restricted under IAS 39 which, on failure to comply and depending on the circumstances, may require the entire portfolio to be reclassified at the level of the group and prohibit the use of this category for two years.
• Basis for measurement and recognition of income and chargess
Held-to-maturity securities are recognized at fair value when acquired. Subsequently they are measured at amortized cost using the effective interest rate method, which factors in the amortization of any premiums, discounts and, if material, acquisition costs.Purchases and sales of securities are recognized on the settlement date.Income received from these securities is recorded under “Interest and similar income” in profit or loss.
• Credit risk
An impairment loss is recognized when there is objective evidence that the asset is impaired as a result of one or more events having occurred after initial recognition of the asset and when this could generate a loss (proven credit risk). Impairment testing is carried out at each balance sheet date for each security in turn. The amount of the loss is measured as the difference between the asset’s carrying amount and the present value of estimated cash flows discounted at the asset’s original interest rate, taking into account any guarantees. The impairment loss is recognized in profit or loss under “Cost of risk”. Any subsequent appreciation resulting from an event having occurred since the recognition of the impairment loss is also taken to profit or loss under “Cost of risk”.
• Loans and receivables
• Classification criteria and transfer rules
IAS 39 authorizes certain securities to be classified as loans and receivables when they have fixed or determinable payments and are not quoted in an active market.Classification as loans and receivables may take place upon initial recognition of the securities or upon their transfer from financial assets at fair value through profit or loss or from available-for-sale securities, pursuant to the amendment to IAS 39 of October 2008. There has been no reclassification since 2008.
• Basis for measurement and recognition of income and charges
Loans and receivables are recognized initially at fair value. Subsequently they are accounted for and measured in accordance with the rules applied to loans and receivables described in Note 3.1 dealing with loans and receivables.
• Credit risk
An impairment loss is recognized when there is objective evidence that the asset is impaired as a result of one or more events having occurred after initial recognition of the asset and when this could generate a loss (proven credit risk). The amount of the loss is measured as the difference between the asset’s carrying amount and the present value of estimated cash flows discounted at the asset’s effective interest rate, taking into account any guarantees. The impairment loss is recognized in profit or loss under “Cost of risk”. Any subsequent appreciation resulting from an event having occurred since the recognition of the impairment loss is also taken to profit or loss under “Cost of risk”.
3.5 DERIvATIvES AND HEDGE ACCOUNTING
• Determination of fair value of derivatives
The majority of over-the-counter derivatives, swaps, forward rate agreements, caps, floors and vanilla options are valued using standard, generally accepted models (discounted cash flow method, Black and Scholes model, interpolation techniques), based on observable market data such as yield curves. The valuations given by these models are adjusted to take into account the liquidity risk and the credit risk associated with the instrument or parameter concerned, and specific risk premiums intended to offset any additional costs resulting from a dynamic management strategy associated with the model in certain market conditions, as well as the counterparty risk captured by the positive fair value of over-the-counter derivatives. The latter includes the specific counterparty risk in the negative fair value of the over-the-counter derivatives.
When determining valuation adjustments, each risk factor is considered individually, without allowance for any diversification effect for risks, parameters or models of a different nature. A portfolio approach is most often used for a given risk factor.
Derivatives are recognized as financial assets when their market value is positive and as financial liabilities when their market value is negative.
FINANCIAL STATEMENTSNOTES
40
Crédit Mutuel Group
41
Annual report 2016
- litigation risk and guarantee commitments given; - tax risks; - risks related to home savings (see Note 3.10).
3.10 AMOUNTS DUE TO CUSTOMERS AND CREDIT INSTITUTIONS
These are fixed- or determinable-rate financial liabilities. They are initially recognized at fair value and measured at subsequent balance sheet dates at amortized cost using the effective interest rate method, except in the case of those recognized at fair value by option.
• Regulated savings contracts
Home savings accounts (Comptes Épargne Logement - CEL) and home savings schemes (Plans Épargne Logement - PEL) are French regulated products available to individual customers. These products provide retail investors with interest-bearing savings vehicles during a first phase, and grant them access to a mortgage during a second phase. They generate two kinds of commitment for the banks that distribute them:• a commitment to pay a fixed rate of interest in the
future on the savings (solely for home savings schemes, as the interest rate on home savings accounts is equivalent to a variable rate and is periodically revised in accordance with an indexation formula);
• a commitment to extend a loan based on pre- determined conditions to customers who request one (both products).
These commitments are estimated on the basis of customer behavioral statistics and market data. A provision is recognized on the liability side of the balance sheet to cover future charges related to the potentially disadvantageous conditions of these products in comparison with the interest rates offered to individual customers for products that are similar but whose remuneration is not regulated. This approach is managed based on generations of regulated PEL and CEL savings products with similar characteristics. The impact on profit or loss is recorded as interest paid to customers.
3.11 CASH AND CASH EqUIvALENTS
Cash and cash equivalents comprise cash in hand, deposits and demand loans and borrowings with central banks and credit institutions.For cash flow statement purposes, UCITS are classified as an “operating” activity and are not therefore reclassified as cash.
3.12 EMPLOyEE BENEFITS
Where applicable, provisions are recognized in respect of employee obligations under “Provisions for risks and charges”. Any movements in the provision are taken to income within “Payroll costs”, with the exception of the portion resulting from actuarial differences, which is recognized in unrealized or deferred gains and losses recognized in equity.
• Post-employment defined benefit plans
These comprise retirement, early retirement and supplementary retirement plans under which the group has a formal or implicit obligation to provide employees with pre-defined benefits.These obligations are calculated using the projected unit credit method, which involves allocating entitlement to benefits to periods of service by applying the contractual formula for calculating plan benefits. Such entitlements are then discounted using demographic and financial assumptions such as:- a discount rate, determined by reference to the rate
on long-term private-sector borrowings consistent with the term of the commitments;
- the salary increase rate, assessed in accordance with age brackets, manager/non-manager classification and regional characteristics;
- inflation rates, estimated by comparing French treasury bond rates and inflation-linked French treasury bond rates at different maturities;
- staff turnover rates, determined by age bracket, using the three-year average for the ratio of resignations and dismissals relative to the year-end number of employees with permanent contracts;
- retirement ages: estimated on a case-by-case basis using the actual or estimated date of commencement of full-time employment and the assumptions set out in the law reforming pensions, with a ceiling set at 67 years of age; and
- life expectancy rates set out in INSEE table TH/TF 00-02.
Differences arising from changes in these assumptions and from differences between previous assumptions and actual experience constitute actuarial differences. When the plan is funded by assets, these are measured at fair value and recognized in the income statement for their expected yield. Differences between actual and expected yields also constitute actuarial differences. Actuarial differences are recognized in equity, within unrealized or deferred gains and losses. Any plan curtailments or terminations generate a change in the obligation, which is recognized in profit or loss when it occurs.
the hedged item has been derecognized, due notably to early repayments, the cumulative adjustments are recognized immediately in profit or loss.
• Macro-hedging deriva
The group has availed itself of the possibilities offered by the European Commission as regards accounting for macro-hedging transactions. The European Union’s so-called carve out amendment to IAS 39 enables customer demand deposits to be included in hedged fixed-rate liability portfolios with no effectiveness measurement if under-hedged. Demand deposits are included based on of the run-off rules defined for asset-liability management purposes.
For each portfolio of fixed-rate financial assets or liabilities, the maturity schedule of the hedging derivatives is reconciled with thatof the hedged items to ensure that there is no over-hedging.The accounting method for fair value macro-hedging derivatives is similar to that used for fair value hedging derivatives. Changes in the fair value of the hedged portfolios are recorded in a specific line of the balance sheet, “Remeasurement adjustment on portfolios hedged for interest rate risk”, the other side of the entry being to profit or loss.
• Cash flow hedgesIn the case of a cash flow hedge, derivatives held in the balance sheet are remeasured at their fair value, with any change being recognized in equity as regards the effective portion while the portion considered as ineffective is recognized in profit or loss under “Net gains (losses) on financial instruments at fair value through profit or loss”.Amounts recognized in shareholders’ equity are reclassified to profit or loss under “Interest income and charges” in the same period or periods during which the cash flows attributable to the hedged item affect profit or loss.The hedged items continue to be recognized in accordance with the rules specific to their accounting category. If the hedging relationship is broken or no longer fulfills the hedge effectiveness criteria, hedge accounting is discontinued. The cumulative amounts recorded in shareholders’ equity for the re-measurement of the hedging derivative are maintained in shareholders’ equity until such time as the hedged transaction itself impacts profit or loss or until the transaction is no longer expected to occur, at which point said amounts are transferred to profit or loss.If the hedged item has been derecognized, the cumulative amounts recorded in shareholders’ equity are immediately transferred to profit or loss.
3.6 DEBT SECURITIES
Debt securities (certificates of deposit, interbank market securities, bonds, etc.) that are not classified at fair value through profit or loss by option are recognized initially at their issue amount, when applicable net of transaction costs. These securities are subsequently measured at amortized cost using the effective interest rate method.
3.7 SUBORDINATED DEBT
Both dated and undated subordinated debt is separated from other debt securities as, in the event of the issuer’s liquidation, it is repaid only after claims by other creditors have been extinguished. Subordinated debt is measured at amortized cost. 3.8 DISTINCTION BETwEEN LIABILITIES AND SHAREHOLDERS’ EqUITy
In accordance with IFRIC 2, the interests of members are classified as shareholders’ equity if the entity has the unconditional right to refuse to redeem such interests, or if there are legal or statutory provisions that prohibit or significantly limit such redemption. Under existing articles of association and applicable legal provisions, shares issued by the structures making up the consolidating entity of the Crédit Mutuel group are recognized under shareholders’ equity.
The other financial instruments issued by the group qualify for accounting purposes as debt instruments if the group has a contractual obligation to deliver cash to the holders of such instruments. This is the case, in particular, for all the subordinated securities issued by the group.
3.9 PROvISIONS FOR RISkS AND CHARGES
Provisions and reversals of provisions are classified by type under the corresponding item of income or expenditure.A provision is recognized whenever it is probable that an outflow of resources representing economic benefits will be necessary to extinguish an obligation arising from a past event and when the amount of the obligation can be estimated accurately. Where applicable, the net present value of this obligation is calculated to determine the amount of the provision to be set aside.
The provisions constituted by the group cover, in particular:- operating risks;- employee obligations (see Note 3.12);- execution risk on signature commitments;
FINANCIAL STATEMENTSNOTES
42
Crédit Mutuel Group
43
Annual report 2016
This test ensures that the recognized insurance liabilities are adequate to cover estimated future cash flows under insurance contracts. If the test reveals that the technical provisions are inadequate, the deficiency is recognized in the income statement. It may subsequently be reversed, where appropriate.
• Income statement
Income and expenses recognized in respect of the insurance contracts issued by the group are included within “Income from other activities” and “Expenses on other activities”.
Income and expenses arising from proprietary activities carried on by insurance entities are reported under the headings corresponding to the nature of the transactions.
3.14 NON-CURRENT ASSETS
Non-current assets reported on the balance sheet include property, plant and equipment and intangible assets used in operations as well as investment properties. Operating non-current assets are used for the production of services or for administrative purposes. Investment properties are property assets held to generate rental income and/or gains on the invested capital. The historical cost method is used to recognize both operating and investment properties.
Non-current assets are initially recognized at acquisition cost plus any costs directly attributable to bringing the asset to the location and condition necessary for it to be capable of operating in the manner intended by management.
They are subsequently measured at amortized historical cost, i.e. their cost less accumulated depreciation and amortization and any impairment.
When a non-current asset comprises several components likely to be replaced at regular intervals, with different uses or providing economic benefits over differing lengths of time, each component is recognized separately from the outset and is depreciated or amortized in accordance with its own depreciation schedule. The component approach is applied to both operating and investment properties.
The depreciable or amortizable value of a non-current asset is determined after deducting its residual value net of disposal costs. As the useful life of non-current assets is generally equal to their expected economic life, they are presumed not to have a residual value.
Non-current assets are depreciated or amortized over their estimated useful lives at rates reflecting the estimated consumption of the assets’ economic benefits
by the entity owning the assets. Intangible assets with an indefinite useful life are not amortized.Depreciation and amortization charges on operating non-current assets are recognized under “Provisions, amortization and depreciation for operating non-current assets” in profit or loss.
Depreciation charges on investment properties are recognized under “Expenses on other activities” in profit or loss.
The following depreciation and amortization periods are used:
Property, plant and equipment:- Land and network improvements: 15-30 years- Buildings – shell: 20-80 years
(depending on the type of building)- Buildings – equipment: 10-40 years- Fixtures and fittings: 5-15 years- Office furniture and equipment: 5-10 years- Safety equipment: 3-10 years- Vehicles and movable equipment: 3-5 years- IT hardware: 3-5 years
Intangible assets:- Software purchased or developed internally:
1-10 years- Business goodwill acquired: 9-10 years
(if customer contract portfolio acquired)
Depreciable and amortizable assets are tested for impairment when evidence exists at the end of the reporting period that the items may be impaired. Non-depreciable and non-amortizable non-current assets such as lease rights are tested for impairment once a year.If evidence of impairment is found, the asset’s recoverable amount is compared with its net carrying amount. If the asset is found to be impaired, an impairment loss is recognized in profit or loss, and the depreciable amount is adjusted prospectively. Impairment losses are reversed if there is an improvement in the estimated recoverable amount or there is no longer any evidence of impairment. The net carrying amount following the reversal of an impairment provision cannot exceed the net carrying amount that would have been calculated if the impairment had not been recognized.Impairment charges and reversals on operating non-current assets are recognized under “Provisions, amortization and depreciation for operating non- current assets” in profit or loss. Impairment charges and reversals on investment properties are recognized in profit or loss under “Charges on other activities” and “Income from other activities”, respectively.
• Post-employment defined contribution plans
Group entities contribute to various retirement plans managed by independent organizations, to which they have no formal or implicit obligation to make supplementary payments in the event, notably, that the fund’s assets are insufficient to meet its commitments. As such plans do not represent a commitment for the group they are not subject to a provision. The charges are recognized in the period in which the contribution is due.
• Other long-term benefits
These represent benefits other than post-employment benefits and end-of-contract indemnities expected to be paid more than 12 months after the end of the fiscal year in which staff rendered the corresponding service. They include, for example, long-service awards.The group’s commitment in respect of other long-term benefits is measured using the projected unit credit method. However, actuarial differences are recognized immediately in profit or loss.
Certain commitments in respect of long-service awards are covered by insurance policies. Only the portion not covered is provisioned.
• End-of-contract indemnities
These indemnities consist of benefits granted by the group when an employment contract is terminated before the usual retirement age or following the employee’s decision to leave the group voluntarily in exchange for an indemnity.End-of-contract indemnity provisions are discounted if payment is expected to be made more than 12 months after the balance sheet date.
• Short-term benefits
These are benefits, other than end-of-contract indemnities, payable within the 12 months following the reporting date that include salaries, social security contributions and certain bonuses.A charge is recognized in respect of short-term benefits in the period in which the services giving rise to the entitlement to the benefit are provided to the entity.
3.13 INSURANCE ACTIvITIES
The accounting policies and measurement methods specific to assets and liabilities arising on insurance contracts have been drawn up in accordance with IFRS 4. They apply also to reinsurance contracts issued or subscribed, and to financial contracts with a discretionary profit-participation feature.
Other assets held and liabilities issued by insurance companies are accounted for in accordance with the rules applicable to the group’s other assets and liabilities.
• Assets
For financial assets, investment properties and non-current assets, the accounting methods applied are those described in these notes.
However, financial assets representing technical provisions related to unit-linked business are shown in “Financial assets at fair value through profit or loss”.
• Liabilities
Insurance liabilities, which represent commitments to subscribers and beneficiaries, are included under the heading “Technical provisions in respect of insurance contracts”. They continue to be measured, recognized and consolidated in accordance with French accounting standards.
The technical provisions in respect of life insurance contracts consist mainly of mathematical provisions corresponding generally to the contracts’ surrender values. The main risks covered by these contracts are death, disability and industrial disablement (for loan insurance).
The technical provisions related to unit-linked business are measured, at the end of the reporting period, on the basis of the realizable value of the assets underlying these contracts.
The provisions related to non-life insurance contracts correspond to unearned premiums (portion of the premiums issued relating to subsequent periods) and to outstanding claims.
Those insurance contracts with a discretionary profit-participation feature are subject to “shadow accounting”. The provision for deferred profit-sharing resulting from the application of this method represents the share of unrealized gains and losses on assets accruing to the policyholders. Provisions for deferred profit-sharing are shown under assets or liabilities by each legal entity and are not netted off between entities in the consolidation scope. When on the asset side, they are reported under a separate heading.
At the end of the reporting period, an adequacy test is performed on the liabilities recognized on these contracts (net of related other assets and liabilities such as deferred acquisition costs and acquired portfolios).
FINANCIAL STATEMENTSNOTES
44
Crédit Mutuel Group
45
Annual report 2016
Financing commitments that are not considered as derivatives within the meaning of IAS 39 are not shown on the balance sheet. However, they give rise to provisions in accordance with the provisions of IAS 37.
3.19 TRANSACTIONS DENOMINATED IN FOREIGN CURRENCIES
Financial assets and financial liabilities denominated in a currency other than the local currency are translated at the year-end exchange rate.
• Monetary financial assets and liabilities
Foreign exchange gains and losses arising on the translation of monetary assets and liabilities are recognized in profit or loss under “Net gains (losses) on portfolios at fair value through profit or loss”.
• Non-monetary financial assets and liabilities
Foreign exchange gains and losses arising on the translation of non-monetary assets and liabilities are recognized in profit or loss under “Net gains (losses) on portfolios at fair value through profit or loss” if the item is classified as at fair value through profit or loss, or under “Unrealized or deferred gains or losses” if the item is classified under available-for-sale financial assets.
3.20 NON-CURRENT ASSETS CLASSIFIED AS HELD FOR SALE AND DISCONTINUED OPERATIONS
Non-current assets, or groups of assets, are classified as held for sale if they are available for sale and provided a sale is highly probable and likely to be completed within the next 12 months. The related assets and liabilities are shown separately in the balance sheet, on the lines “Non-current assets held for sale” and “Liabilities associated with non-current assets held for sale”. They are recognized at the lower of their carrying amount and their fair value less the costs to sell, and are no longer depreciated or amortized.
Any recognized impairment loss on such assets and liabilities is recognized in profit or loss.
Discontinued operations are a component of an entity that either has ceased to trade or is classified as held for sale, or correspond to a subsidiary acquired exclusively with a view to resale. All gains and losses related to discontinued operations are shown separately in the income statement, on the line “Post-tax gain/(loss) on discontinued operations and assets held for sale”.
3.21 JUDGMENTS AND ESTIMATES USED IN PREPARATION OF THE FINANCIAL STATEMENTS
The preparation of the group’s financial statements necessitates the formulation of assumptions in order to effect the required measurements, which carries risks and uncertainties concerning these assumptions’ future realization.
The future outcome of such assumptions may be influenced by several factors, in particular:- the activities of national and international markets,- changes in interest rates and foreign exchange rates,- economic and political conditions in certain business
sectors or countries, and- regulatory and legislative changes.
Accounting estimates requiring the formulation of assumptions are used mainly for measurement of the following items:- fair value of financial instruments not quoted on an
active market. The definition of a forced transaction and the definition of observable data require the exercise of judgment (see Note 3.4 Securities),
- retirement plans and other future employee benefits,- permanent impairment losses,- impairment of receivables,- provisions,- impairment of intangible assets and goodwill, and- deferred tax assets.
NOTE 4: SEGMENT REPORTING
In terms of segment reporting, the group has two levels of disclosure that are based on the group’s own internal reporting system. Data by sector of activity is the primary level and data by geographic area is the secondary level.
• Segment reporting by activity (primary level)
Sector data for the Crédit Mutuel group is organized into five operating segments:- Retail Banking,- Corporate and Investment Banking,- Insurance,- Asset Management and Private Banking, and- Other.
Retail Banking covers the network of Crédit Mutuel’s local mutual banks, CIC’s regional banks as well as all the specialized activities whose products are marketed through the network: all business banking (i.e. micro-enterprises, small and medium-sized enterprises and companies, excluding large corporates), finance and property leasing, factoring, real estate, etc.
Capital gains or losses on disposals of operating non-current assets are recorded in profit or loss on the line “Net gains (losses) on other assets”. Gains and losses on disposals of investment property are shown in the income statement under “Income from other activities” or “Expense on other activities”.The fair value of investment properties is disclosed in the notes to the financial statements at the end of each reporting period. It is based on the buildings’ market value as appraised by independent valuers (Level 2).
3.15 FEES AND COMMISSIONS
Fees and commissions in respect of services are recorded as income and charges according to the nature of the services involved. Fees and commissions linked directly to the grant of a loan are spread (see Note 3.1).Fees and commissions remunerating a service provided on a continuous basis are recognized in profit or loss over the period during which the service is provided. Fees and commissions remunerating a significant service are recognized in profit or loss in full upon execution of the service.
3.16 INCOME TAx ExPENSE
The income tax expense includes all tax, both current and deferred, chargeable in respect of the income for the period under review.Current income taxes are determined in accordance with applicable tax regulations.
The Territorial Economic Contribution (Contribution Economique Territoriale – CET), which is composed of the Business Real Property Contribution (Cotisation Foncière des Entreprises - CFE) and the Business Contribution on Added Value (Cotisation sur la Valeur Ajoutée des Entreprises - CVAE), is treated as an operating charge and, accordingly, the group does not recognize any deferred taxes in the consolidated financial statements.
• Deferred tax
As required by IAS 12, deferred taxes are recognized in respect of temporary differences between the carrying amount on the consolidated balance sheet of an asset or liability and its tax value, with the exception of goodwill.
Deferred taxes are calculated using the liability method, applying the corporation tax rate known at the end of the period and applicable to subseqDeferred tax assets net of deferred tax liabilities are recognized only when there is a high probability that they will be
utilized. Current or deferred tax is recognized as income or a charge, except for that relating to unrealized or deferred gains or losses recognized in equity, for which the deferred tax is allocated directly to equity.
Deferred tax assets and liabilities are netted if they arise in the same entity or in the same tax group, are subject to the same tax authority and there is a legal right of set off.
Deferred tax is not discounted.
3.17 INTEREST PAyABLE By THE STATE ON CERTAIN LOANS
In the context of government measures to assist the agricultural and rural sector, and to assist with home purchases, certain group entities grant loans at reduced interest rates that are set by the State. Such entities therefore receive State subsidies equivalent to the differential between the interest rate granted to the customer and a pre-determined benchmark rate. Accordingly, no discount is applied to these subsidized loans.
The terms and conditions of this compensation mechanism are periodically reviewed by the State.
The State subsidies received are recognized under “Interest and similar income” and spread over the term of the relevant loans, in accordance with IAS 20.
3.18 FINANCIAL GUARANTEES AND FINANCING COMMITMENTS
A financial guarantee is treated as an insurance policy if it provides for a specific payment to be made to reimburse the holder of the guarantee for a loss incurred as the result of the failure of a specific debtor to make a payment on maturity of a debt instrument.
In accordance with IFRS 4, such financial guarantees continue to be measured using French accounting standards, i.e. they are treated as off-balance sheet items, until such time as the current standards are revised. Accordingly, they are subject to a provision for liabilities if an outflow of resources is probable.
By contrast, financial guarantees that provide for payments in response to changes in a financial variable (price, credit rating or index, etc.) or a non-financial variable, provided that in this event the variable is not specific to one of the parties to the agreement, fall within the scope of application of IAS 39. These guarantees are thus treated as derivatives.
FINANCIAL STATEMENTSNOTES
46
Crédit Mutuel Group
47
Annual report 2016
Corporate and Investment Banking comprises the following activities:- corporate banking, which covers banking and related
services provided to large companies through a specific sales department or subsidiary; and
- investment banking, which covers capital markets activities, merchant banking, venture capital, private equity, financial intermediation and mergers and acquisitions.
Insurance comprises the life and non-life insurance activities (life insurance, property and casualty insurance and insurance brokerage).
Asset Management and Private Banking comprises two activities:- asset management: fund management (UCITS, real
estate funds), employees savings schemes, custody and depositary services for its own customer base, as opposed to that of the network; and
- private banking: wealth management and estate planning.
Other Activities comprise technical support subsidiaries that cannot be included in the retail banking segment (technology, electronic payments, training, media and travel).
Transactions between the different operating segments are carried out at market conditions.
• Segment reporting by geographic area (secondary level)
For the Crédit Mutuel group, three geographic areas have been defined for this secondary level of reporting:- France,- Rest of Europe, and- Rest of world.
The geographic analysis of assets and earnings is based on the country in which the activities are recorded for accounting purposes.
NOTE 5: RELATED PARTIES
Parties related to the Crédit Mutuel group are the consoli-dated companies, including companies accounted for using the equity method, and the third-level administrative entities (Caisse Centrale du Crédit Mutuel and the Confédération Nationale du Crédit Mutuel).Transactions between the Crédit Mutuel group and related parties are carried out at the normal market conditions prevailing at the time of the transaction.
A list of the group’s consolidated companies is provided in Note 0 in the financial data section below. As transactions carried out and any outstandings at the end of the period between group companies consolidated using the full method are totally eliminated on consolidation, only transactions between companies over which the group exercises joint control or significant influence (and which are consolidated using the equity method) are included in the tables in the notes for the portion not eliminated on consolidation.
NOTE 6: STANDARDS AND INTERPRETATIONS NOT yET APPLIED
STANDARDS AND INTERPRETATIONS ADOPTED By THE EUROPEAN UNION AND NOT yET APPLIED
IFRS 9 – Financial Instruments
IFRS 9 is to replace IAS 39 Financial Instruments: Recognition and Measurement. It defines new rules concerning:- classifying and measuring financial instruments
(phase 1), - impairment provisions for expected credit losses on
financial assets (phase 2), and- hedge accounting, excluding macro-hedging (phase 3).
Its application will become mandatory as from January 1, 2018. The classification and measurement provisions, as well as the new IFRS 9 impairment model, are to be applied retrospectively by adjusting the opening balance sheet on the date of first application. There is no obligation to restate the fiscal years shown by way of comparison. The group will, therefore, present its 2018 financial statements without adjusting the com-parative figures to comply with the IFRS 9 format: the explanation of the transition of the portfolios from IAS 39 to IFRS 9 and the impacts on equity will be provided in the notes to the financial statements.
In the second quarter of 2015, the group launched an initiative, currently at the project stage. It brings together the various departments concerned (finance, risk, IT, etc.), and is structured around the “National consolidation” steering committee coordinated by the Financial management department of Confédération Nationale du Crédit Mutuel (CNCM). The project is organized into working groups, to cover the various phases and instruments (loans, securities and derivatives); the CNCM Risk department has overall responsibility for the work on the impairment models. Work began in 2016 on the changes that will need to be made to the IT systems. This work is continuing in 2017.
This initiative covers all the group’s activities concerned, including insurance. The amendment to IFRS 4, published in September 2016, allows such entities to defer the first-time application of IFRS 9 (the “deferral approach”). However, at this stage, bank insurers are not permitted to apply the deferral approach. Given the standard’s implementation timetable and the fact that discussions on this matter are in progress at international and European levels, the group’s insurance entities will apply IFRS 9 as from January 1, 2018.
Information for each of the initiative’s phases is presented below.
Phase 1 - Classification and measurement
Under IFRS 9, the classification and measurement of financial assets will depend on the business model and the contractual characteristics of the instruments, which could result in the classification and/or measurement of certain financial assets being different from that under IAS 39.
Loans, receivables and debt securities acquired will be classified:- at amortized cost, if the objective of the entity’s
business model is to hold the financial asset to collect the contractual cash flows, and if the cash flows consist solely of payments of principal and interest on the principal amount outstanding (analysis carried out via the solely payments of principal and interest (SPPI) test),
- at fair value through equity, if the financial asset is held within a business model whose objective is achieved by both collecting contractual cash flows and selling financial assets, depending on the circumstances, and if the cash flows are solely payments of principal and interest on the principal amount outstanding. If such instruments are sold, the unrealized gains or losses previously recognized in equity will be recognized in profit or loss, as is currently the case under IAS 39 when an instrument is classified as available for sale (AFS),
- at fair value through profit or loss, if they are not eligible to be classified within the two aforementioned categories or if the group chooses to classify them as such, in order to reduce an accounting mismatch.
Equity instruments acquired (shares, in particular) will be classified:- at fair value through profit or loss, or- at fair value through equity, if the election for such
treatment is made. In the event of the sale of such instruments, the unrealized gains or losses previously recognized in equity will not be recycled to profit or loss, contrary to current practice when instruments are classified as available for sale (AFS). Only dividends will be recognized in profit or loss.
It should be noted that:- embedded derivatives in financial assets may no longer
be recognized separately from the host contract,- the IAS 39 provisions relating to the derecognition of
financial assets are replicated in IFRS 9 without amendment,
- the same will apply to the provisions relating to financial liabilities, except the recognition of changes in fair value, resulting from the credit risk specific to the liabilities for which the entity has elected for recognition at fair value through profit or loss. These changes are no longer to be recognized in profit in loss: instead, they are to be recognized in unrealized or deferred gains and losses within equity. The issue of own credit risk has very little impact on the group.
The objectives of the work carried out within the group during 2016 were to:- finalize the mapping of the instruments, as regards
both the rates and the various contractual provisions,- define and start the SPPI tests for those rates identified
as high-risk (averaged, decorrelated),- launch the project to draw up documentation on the
various instruments, at national and regional levels, on both the characteristics of the instruments and on the business models.
At this stage, the main reclassifications into the fair value through profit or loss category will be units in UCITS or UCIs and certain convertible or structured bonds: these reclassifications will have only a modest impact. Work is in progress to finalize the position concerning certain loans and securitization tranches.
Crédit Mutuel did not wish to issue “group” principles covering:- the use of the fair value through equity option for
equity instruments,- the classification at amortized cost, or at fair value
through equity, of the debt instruments included in the liquidity portfolio; each group will classify its instruments in accordance with its own business model.
Phase 2 – Impairment
The section of IFRS 9 relating to credit risk impairment responds to the criticisms raised concerning the incurred credit loss model under IAS 39, i.e. that it causes accounting for credit losses to be delayed and the amounts of the credit losses recognized to be too low. IFRS 9 allows provisioning for incurred credit loss to be replaced by provisioning for expected credit losses. Impairment provisions will be recognized, as regards financial assets for which there are no objective indications of losses on an individual basis, based not only on past losses observed but also on reasonable and justifiable cash flows forecasts.
FINANCIAL STATEMENTSNOTES
48
Crédit Mutuel Group
49
Annual report 2016
This more forward-looking approach to credit risk is already taken into account, in part, when collective provisions are currently recognized on portfolios of financial assets with similar characteristics, pursuant to IAS 39.
Therefore, the new impairment model introduced by IFRS 9 will apply to all debt instruments measured at amortized cost or at fair value through equity. Such instruments will be divided into three categories:- Bucket 1: loss allowance provided for on the basis of
the 12-month expected credit losses (resulting from the default risks over the following 12 months) as from initial recognition of the financial assets, provided that the credit risk has not increased significantly since initial recognition,
- Bucket 2: loss allowance provided for on the basis of the lifetime expected credit losses (resulting from the default risks over the entire residual life of the instrument) if the credit risk has increased significantly since initial recognition, and
- Bucket 3: category comprising credit-impaired financial assets for which there is an objective indication of loss of value related to an event that has occurred since the loan was granted. This category is the same as the scope of the loans currently provided for on an individual basis under IAS 39.
The assessment as to whether there has been a significant increase in the credit risk will be carried out by:- taking into account all reasonable and justifiable
information, and- comparing the risk of default on the financial instrument
as of the reporting date with the risk of default as of the initial recognition date.
For the group, this involves measuring the risk at the level of the borrower, but also assessing the change in the risk at the level of each contract.
The main objectives of the work carried out within the group during 2016 were to define the frontier between buckets 1 and 2:- the group will use the models developed for prudential
purposes and the assessment of the 12-month default risk (represented by a rating or default rate), as authorized by the standard.
- As well as this quantitative data, it will use qualitative criteria such as installments that are unpaid or overdue by more than 30 days, the concept of restructured loans, etc.
- Less complex methods will be used for those entities or small portfolios that are classified for prudential purposes under the standardized approach and do not have a rating system.
The group is currently considering the method for taking forward-looking information into account in the parameters.
At this stage, the group considers that the quantitative impacts cannot be reasonably assessed, but that the level of impairment, under IFRS 9, of buckets 1 and 2 will be significantly higher than the collective provisions currently recognized under IAS 39.
Phase 3 – Hedge accounting
IFRS 9 allows entities to choose, on first-time application, whether to apply the new provisions concerning hedge accounting or to retain those of IAS 39. The Crédit Mutuel group has elected to continue to apply the current provisions. Additional information will, however, be disclosed in the notes to the financial statements on risk management and the effects of hedge accounting on the financial statements, in accordance with revised IFRS 7.
It should be noted in addition that the provisions stipulated in IAS 39 concerning the fair value hedge of interest rate risk associated with a portfolio of financial assets or financial liabilities, as adopted by the European Union, will continue to apply.
IFRS 15 – Revenue from Contracts with Customers
This standard will replace several standards and inter-pretations relating to revenue recognition (in particular IAS 18 - Revenue and IAS 11 - Construction Contracts). It will not, however, affect revenue from leases, insurance contracts or financial instruments.
- The recognition of revenue from contracts must reflect the transfer of control of the good (or service) to a customer, for the amount to which the vendor expects to be entitled. To this end, the standard has developed a five-stage model enabling the entity to determine when and in what amount the revenue from its ordinary activities must be recognIdentify the contract(s) with a customer,
- Identify the performance obligations in the contract,- Determine the transaction price, - Allocate the transaction price to the performance
obligations in the contract, and- Recognize revenue when (or as) the entity satisfies a
performance obligation.
Application of the standard will become mandatory for accounting periods beginning on or after January 1, 2018.
An analysis of the standard and an initial identification of its potential effects were carried out in 2016. This work was carried out by a dedicated confederal working group, of which the various CM groups were members, as were some subsidiaries, where relevant.
The main business lines/products to be analyzed were the packaged banking services, asset management (performance fees), telephony and IT activities.
At this stage, the impacts are expected to be limited.
STANDARDS AND INTERPRETATIONS NOT yET ADOPTED By THE EUROPEAN UNION
The following are of particular note:- IFRS 16 - Leases, first-time application of which is
scheduled for January 1, 2019, subject to its adoption by the European Union,
- the amendments to IFRS 4 linked to IFRS 9 (scheduled application date: January 1, 2018): see section above on IFRS 9.
IFRS 16 – Leases
IFRS 16 will replace IAS 17 and the interpretations relating to lease accounting.
Pursuant to IFRS 16, for a contract to qualify as a lease, there must be both the identification of an asset and control by the lessee of the right to use said asset.
From the lessor’s point of view, the impact is expected to be limited since the provisions adopted remain substantially the same as those of the current IAS 17.
From the lessee’s point of view, in respect of all operating leases, the following must be recognized:- in property, plant and equipment: an asset representing
the right to use the leased asset (“right-of-use asset”), - in liabilities, a liability representing the obligation to
make lease payments throughout the lease term, and- in the income statement, the expense related to the
straight-line depreciation of the asset, separately from the interest expense calculated on an actuarial basis, on the financial liability.
By way of reminder, under IAS 17, the standard currently in force, no amount is recognized in the balance sheet and lease costs are recognized as operating expenses.
The group has begun to analyze the impacts of this standard and, in particular, has started the process of identifying its leases, both of property and of equipment (IT equipment, car fleet, etc.).
NOTE 7: EvENTS AFTER THE REPORTING PERIOD
None.
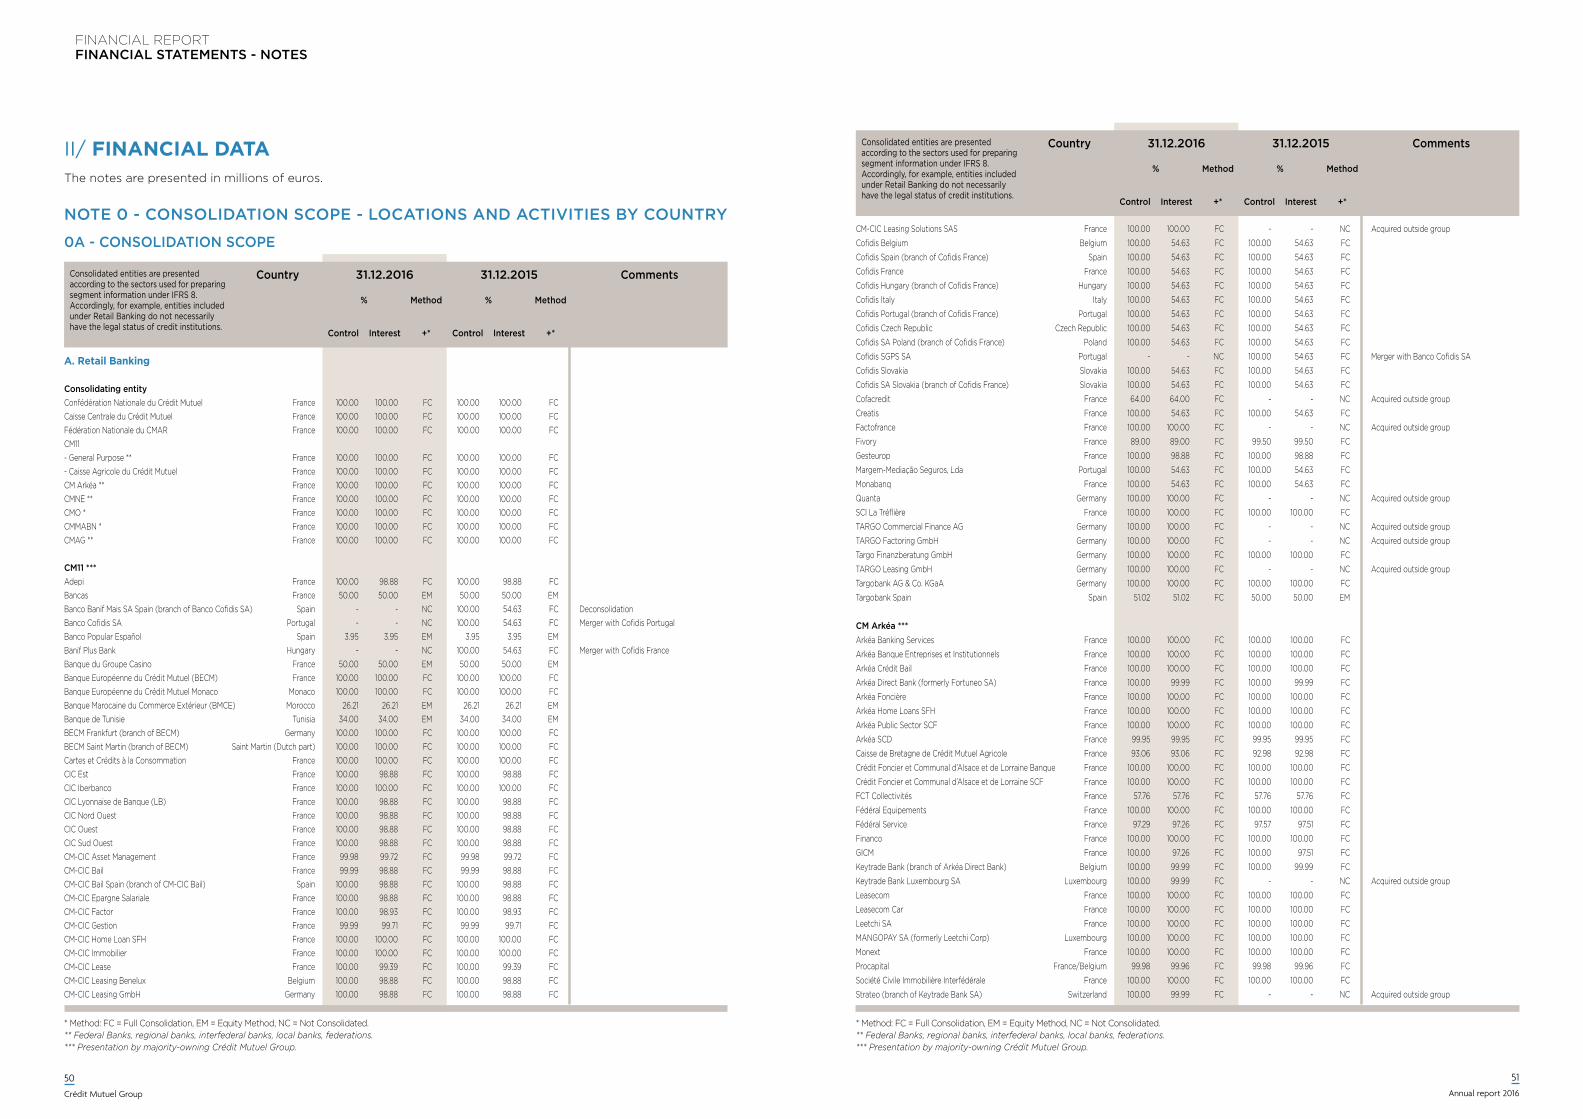
FINANCIAL REPORTFINANCIAL STATEMENTS - NOTES
50
Crédit Mutuel Group
51
Annual report 2016
0A - CONSOLIDATION SCOPE
Consolidated entities are presented according to the sectors used for preparing segment information under IFRS 8. Accordingly, for example, entities included under Retail Banking do not necessarily have the legal status of credit institutions.
Country 31.12.2016 31.12.2015 Comments
% Method % Method
Control Interest +* Control Interest +*
A. Retail Banking Consolidating entity Confédération Nationale du Crédit Mutuel France 100.00 100.00 FC 100.00 100.00 FCCaisse Centrale du Crédit Mutuel France 100.00 100.00 FC 100.00 100.00 FCFédération Nationale du CMAR France 100.00 100.00 FC 100.00 100.00 FCCM11 - General Purpose ** France 100.00 100.00 FC 100.00 100.00 FC- Caisse Agricole du Crédit Mutuel France 100.00 100.00 FC 100.00 100.00 FCCM Arkéa ** France 100.00 100.00 FC 100.00 100.00 FCCMNE ** France 100.00 100.00 FC 100.00 100.00 FCCMO * France 100.00 100.00 FC 100.00 100.00 FCCMMABN * France 100.00 100.00 FC 100.00 100.00 FCCMAG ** France 100.00 100.00 FC 100.00 100.00 FC CM11 *** Adepi France 100.00 98.88 FC 100.00 98.88 FC Bancas France 50.00 50.00 EM 50.00 50.00 EM Banco Banif Mais SA Spain (branch of Banco Cofidis SA) Spain - - NC 100.00 54.63 FC DeconsolidationBanco Cofidis SA Portugal - - NC 100.00 54.63 FC Merger with Cofidis Portugal Banco Popular Español Spain 3.95 3.95 EM 3.95 3.95 EM Banif Plus Bank Hungary - - NC 100.00 54.63 FC Merger with Cofidis FranceBanque du Groupe Casino France 50.00 50.00 EM 50.00 50.00 EM Banque Européenne du Crédit Mutuel (BECM) France 100.00 100.00 FC 100.00 100.00 FC Banque Européenne du Crédit Mutuel Monaco Monaco 100.00 100.00 FC 100.00 100.00 FC Banque Marocaine du Commerce Extérieur (BMCE) Morocco 26.21 26.21 EM 26.21 26.21 EM Banque de Tunisie Tunisia 34.00 34.00 EM 34.00 34.00 EM BECM Frankfurt (branch of BECM) Germany 100.00 100.00 FC 100.00 100.00 FC BECM Saint Martin (branch of BECM) Saint Martin (Dutch part) 100.00 100.00 FC 100.00 100.00 FC Cartes et Crédits à la Consommation France 100.00 100.00 FC 100.00 100.00 FC CIC Est France 100.00 98.88 FC 100.00 98.88 FC CIC Iberbanco France 100.00 100.00 FC 100.00 100.00 FC CIC Lyonnaise de Banque (LB) France 100.00 98.88 FC 100.00 98.88 FC CIC Nord Ouest France 100.00 98.88 FC 100.00 98.88 FC CIC Ouest France 100.00 98.88 FC 100.00 98.88 FC CIC Sud Ouest France 100.00 98.88 FC 100.00 98.88 FC CM-CIC Asset Management France 99.98 99.72 FC 99.98 99.72 FC CM-CIC Bail France 99.99 98.88 FC 99.99 98.88 FC CM-CIC Bail Spain (branch of CM-CIC Bail) Spain 100.00 98.88 FC 100.00 98.88 FC CM-CIC Epargne Salariale France 100.00 98.88 FC 100.00 98.88 FC CM-CIC Factor France 100.00 98.93 FC 100.00 98.93 FC CM-CIC Gestion France 99.99 99.71 FC 99.99 99.71 FC CM-CIC Home Loan SFH France 100.00 100.00 FC 100.00 100.00 FC CM-CIC Immobilier France 100.00 100.00 FC 100.00 100.00 FC CM-CIC Lease France 100.00 99.39 FC 100.00 99.39 FC CM-CIC Leasing Benelux Belgium 100.00 98.88 FC 100.00 98.88 FC CM-CIC Leasing GmbH Germany 100.00 98.88 FC 100.00 98.88 FC
Consolidated entities are presented according to the sectors used for preparing segment information under IFRS 8. Accordingly, for example, entities included under Retail Banking do not necessarily have the legal status of credit institutions.
Country 31.12.2016 31.12.2015 Comments
% Method % Method
Control Interest +* Control Interest +*
CM-CIC Leasing Solutions SAS France 100.00 100.00 FC - - NC Acquired outside group
Cofidis Belgium Belgium 100.00 54.63 FC 100.00 54.63 FC
Cofidis Spain (branch of Cofidis France) Spain 100.00 54.63 FC 100.00 54.63 FC
Cofidis France France 100.00 54.63 FC 100.00 54.63 FC
Cofidis Hungary (branch of Cofidis France) Hungary 100.00 54.63 FC 100.00 54.63 FC
Cofidis Italy Italy 100.00 54.63 FC 100.00 54.63 FC
Cofidis Portugal (branch of Cofidis France) Portugal 100.00 54.63 FC 100.00 54.63 FC
Cofidis Czech Republic Czech Republic 100.00 54.63 FC 100.00 54.63 FC
Cofidis SA Poland (branch of Cofidis France) Poland 100.00 54.63 FC 100.00 54.63 FC
Cofidis SGPS SA Portugal - - NC 100.00 54.63 FC Merger with Banco Cofidis SA
Cofidis Slovakia Slovakia 100.00 54.63 FC 100.00 54.63 FC
Cofidis SA Slovakia (branch of Cofidis France) Slovakia 100.00 54.63 FC 100.00 54.63 FC
Cofacredit France 64.00 64.00 FC - - NC Acquired outside group
Creatis France 100.00 54.63 FC 100.00 54.63 FC
Factofrance France 100.00 100.00 FC - - NC Acquired outside group
Fivory France 89.00 89.00 FC 99.50 99.50 FC
Gesteurop France 100.00 98.88 FC 100.00 98.88 FC
Margem-Mediação Seguros, Lda Portugal 100.00 54.63 FC 100.00 54.63 FC
Monabanq France 100.00 54.63 FC 100.00 54.63 FC
Quanta Germany 100.00 100.00 FC - - NC Acquired outside group
SCI La Tréflière France 100.00 100.00 FC 100.00 100.00 FC
TARGO Commercial Finance AG Germany 100.00 100.00 FC - - NC Acquired outside group
TARGO Factoring GmbH Germany 100.00 100.00 FC - - NC Acquired outside group
Targo Finanzberatung GmbH Germany 100.00 100.00 FC 100.00 100.00 FC
TARGO Leasing GmbH Germany 100.00 100.00 FC - - NC Acquired outside group
Targobank AG & Co. KGaA Germany 100.00 100.00 FC 100.00 100.00 FC
Targobank Spain Spain 51.02 51.02 FC 50.00 50.00 EM
CM Arkéa *** Arkéa Banking Services France 100.00 100.00 FC 100.00 100.00 FC
Arkéa Banque Entreprises et Institutionnels France 100.00 100.00 FC 100.00 100.00 FC
Arkéa Crédit Bail France 100.00 100.00 FC 100.00 100.00 FC
Arkéa Direct Bank (formerly Fortuneo SA) France 100.00 99.99 FC 100.00 99.99 FC
Arkéa Foncière France 100.00 100.00 FC 100.00 100.00 FC
Arkéa Home Loans SFH France 100.00 100.00 FC 100.00 100.00 FC
Arkéa Public Sector SCF France 100.00 100.00 FC 100.00 100.00 FC
Arkéa SCD France 99.95 99.95 FC 99.95 99.95 FC
Caisse de Bretagne de Crédit Mutuel Agricole France 93.06 93.06 FC 92.98 92.98 FC
Crédit Foncier et Communal d’Alsace et de Lorraine Banque France 100.00 100.00 FC 100.00 100.00 FC
Crédit Foncier et Communal d’Alsace et de Lorraine SCF France 100.00 100.00 FC 100.00 100.00 FC
FCT Collectivités France 57.76 57.76 FC 57.76 57.76 FC
Fédéral Equipements France 100.00 100.00 FC 100.00 100.00 FC
Fédéral Service France 97.29 97.26 FC 97.57 97.51 FC
Financo France 100.00 100.00 FC 100.00 100.00 FC
GICM France 100.00 97.26 FC 100.00 97.51 FC
Keytrade Bank (branch of Arkéa Direct Bank) Belgium 100.00 99.99 FC 100.00 99.99 FC
Keytrade Bank Luxembourg SA Luxembourg 100.00 99.99 FC - - NC Acquired outside group
Leasecom France 100.00 100.00 FC 100.00 100.00 FC
Leasecom Car France 100.00 100.00 FC 100.00 100.00 FC
Leetchi SA France 100.00 100.00 FC 100.00 100.00 FC
MANGOPAY SA (formerly Leetchi Corp) Luxembourg 100.00 100.00 FC 100.00 100.00 FC
Monext France 100.00 100.00 FC 100.00 100.00 FC
Procapital France/Belgium 99.98 99.96 FC 99.98 99.96 FC
Société Civile Immobilière Interfédérale France 100.00 100.00 FC 100.00 100.00 FC
Strateo (branch of Keytrade Bank SA) Switzerland 100.00 99.99 FC - - NC Acquired outside group
NOTE 0 - CONSOLIDATION SCOPE - LOCATIONS AND ACTIvITIES By COUNTRy
The notes are presented in millions of euros.
II/ FInAnCIAL DAtA
* Method: FC = Full Consolidation, EM = Equity Method, NC = Not Consolidated. ** Federal Banks, regional banks, interfederal banks, local banks, federations.*** Presentation by majority-owning Crédit Mutuel Group.
* Method: FC = Full Consolidation, EM = Equity Method, NC = Not Consolidated. ** Federal Banks, regional banks, interfederal banks, local banks, federations.*** Presentation by majority-owning Crédit Mutuel Group.
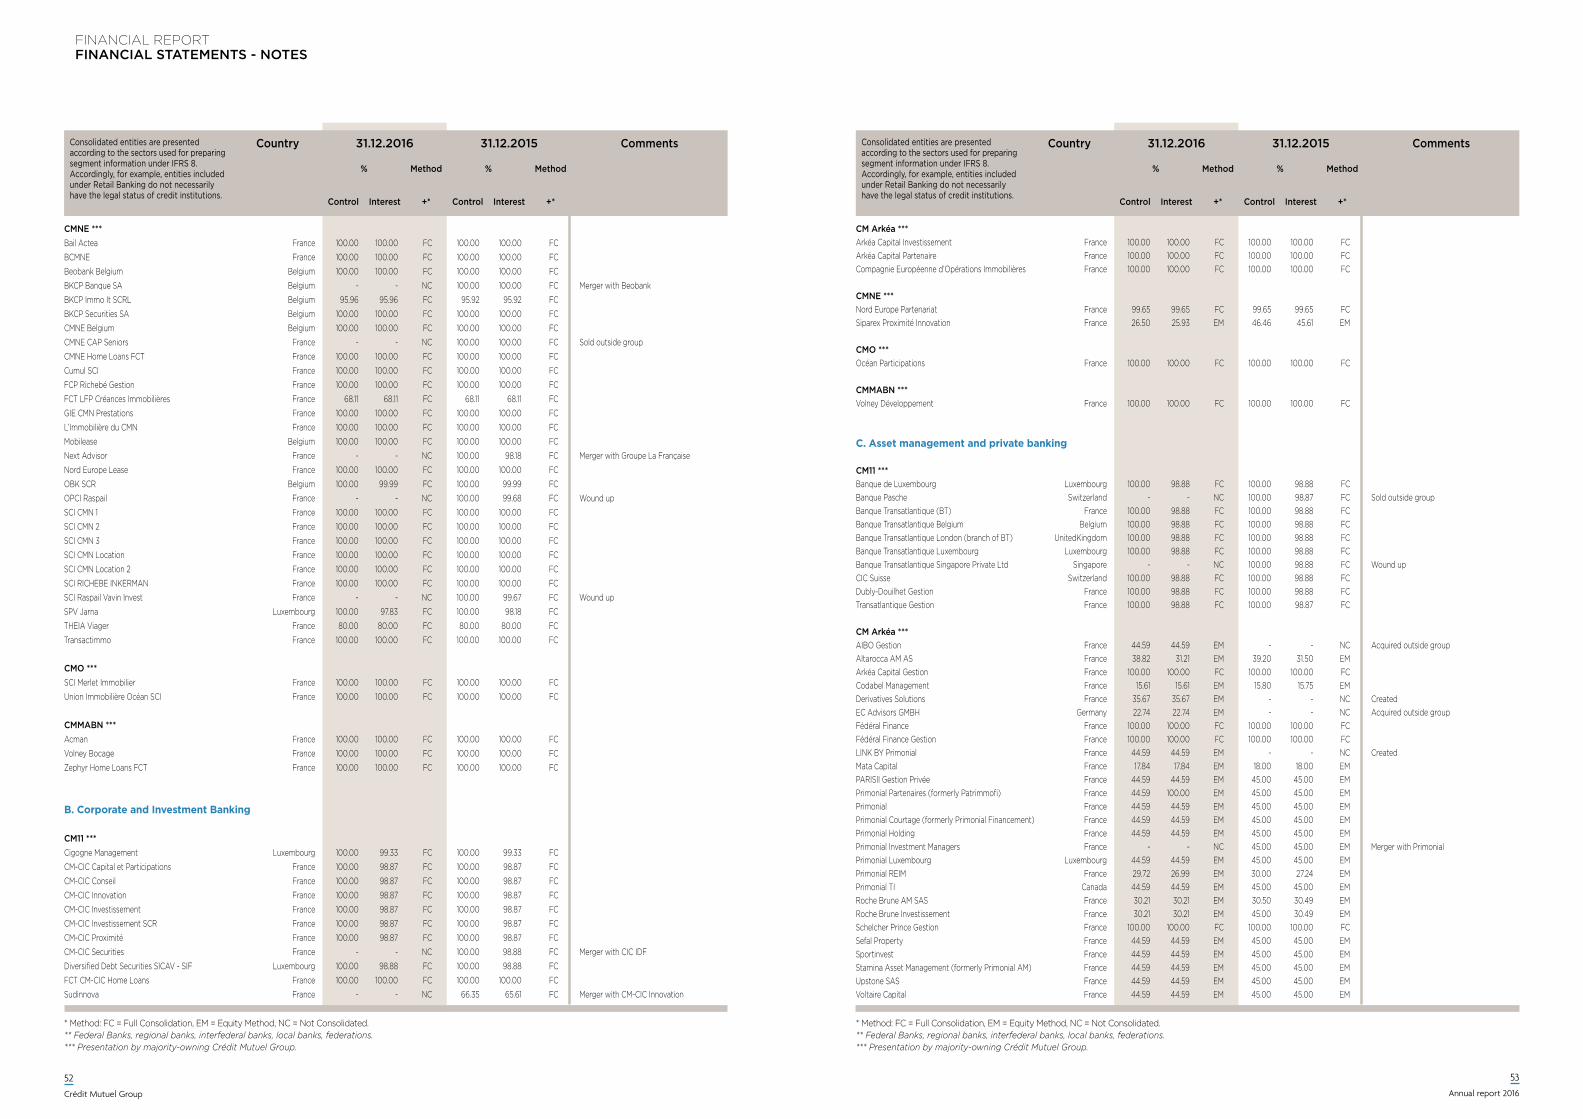
FINANCIAL REPORTFINANCIAL STATEMENTS - NOTES
52
Crédit Mutuel Group
53
Annual report 2016
Consolidated entities are presented according to the sectors used for preparing segment information under IFRS 8. Accordingly, for example, entities included under Retail Banking do not necessarily have the legal status of credit institutions.
Country 31.12.2016 31.12.2015 Comments
% Method % Method
Control Interest +* Control Interest +*
CM Arkéa *** Arkéa Capital Investissement France 100.00 100.00 FC 100.00 100.00 FCArkéa Capital Partenaire France 100.00 100.00 FC 100.00 100.00 FCCompagnie Européenne d’Opérations Immobilières France 100.00 100.00 FC 100.00 100.00 FC CMNE *** Nord Europe Partenariat France 99.65 99.65 FC 99.65 99.65 FCSiparex Proximité Innovation France 26.50 25.93 EM 46.46 45.61 EM CMO *** Océan Participations France 100.00 100.00 FC 100.00 100.00 FC CMMABN *** Volney Développement France 100.00 100.00 FC 100.00 100.00 FC
C. Asset management and private banking
CM11 *** Banque de Luxembourg Luxembourg 100.00 98.88 FC 100.00 98.88 FC Banque Pasche Switzerland - - NC 100.00 98.87 FC Sold outside groupBanque Transatlantique (BT) France 100.00 98.88 FC 100.00 98.88 FC Banque Transatlantique Belgium Belgium 100.00 98.88 FC 100.00 98.88 FC Banque Transatlantique London (branch of BT) UnitedKingdom 100.00 98.88 FC 100.00 98.88 FC Banque Transatlantique Luxembourg Luxembourg 100.00 98.88 FC 100.00 98.88 FC Banque Transatlantique Singapore Private Ltd Singapore - - NC 100.00 98.88 FC Wound up CIC Suisse Switzerland 100.00 98.88 FC 100.00 98.88 FC Dubly-Douilhet Gestion France 100.00 98.88 FC 100.00 98.88 FC Transatlantique Gestion France 100.00 98.88 FC 100.00 98.87 FC CM Arkéa *** AIBO Gestion France 44.59 44.59 EM - - NC Acquired outside groupAltarocca AM AS France 38.82 31.21 EM 39.20 31.50 EM Arkéa Capital Gestion France 100.00 100.00 FC 100.00 100.00 FC Codabel Management France 15.61 15.61 EM 15.80 15.75 EM Derivatives Solutions France 35.67 35.67 EM - - NC CreatedEC Advisors GMBH Germany 22.74 22.74 EM - - NC Acquired outside groupFédéral Finance France 100.00 100.00 FC 100.00 100.00 FC Fédéral Finance Gestion France 100.00 100.00 FC 100.00 100.00 FC LINK BY Primonial France 44.59 44.59 EM - - NC CreatedMata Capital France 17.84 17.84 EM 18.00 18.00 EM PARISII Gestion Privée France 44.59 44.59 EM 45.00 45.00 EM Primonial Partenaires (formerly Patrimmofi) France 44.59 100.00 EM 45.00 45.00 EM Primonial France 44.59 44.59 EM 45.00 45.00 EM Primonial Courtage (formerly Primonial Financement) France 44.59 44.59 EM 45.00 45.00 EM Primonial Holding France 44.59 44.59 EM 45.00 45.00 EM Primonial Investment Managers France - - NC 45.00 45.00 EM Merger with Primonial Primonial Luxembourg Luxembourg 44.59 44.59 EM 45.00 45.00 EM Primonial REIM France 29.72 26.99 EM 30.00 27.24 EM Primonial TI Canada 44.59 44.59 EM 45.00 45.00 EM Roche Brune AM SAS France 30.21 30.21 EM 30.50 30.49 EM Roche Brune Investissement France 30.21 30.21 EM 45.00 30.49 EM Schelcher Prince Gestion France 100.00 100.00 FC 100.00 100.00 FC Sefal Property France 44.59 44.59 EM 45.00 45.00 EM Sportinvest France 44.59 44.59 EM 45.00 45.00 EM Stamina Asset Management (formerly Primonial AM) France 44.59 44.59 EM 45.00 45.00 EM Upstone SAS France 44.59 44.59 EM 45.00 45.00 EM Voltaire Capital France 44.59 44.59 EM 45.00 45.00 EM
CMNE *** Bail Actea France 100.00 100.00 FC 100.00 100.00 FC
BCMNE France 100.00 100.00 FC 100.00 100.00 FC
Beobank Belgium Belgium 100.00 100.00 FC 100.00 100.00 FC
BKCP Banque SA Belgium - - NC 100.00 100.00 FC Merger with Beobank
BKCP Immo It SCRL Belgium 95.96 95.96 FC 95.92 95.92 FC
BKCP Securities SA Belgium 100.00 100.00 FC 100.00 100.00 FC
CMNE Belgium Belgium 100.00 100.00 FC 100.00 100.00 FC
CMNE CAP Seniors France - - NC 100.00 100.00 FC Sold outside group
CMNE Home Loans FCT France 100.00 100.00 FC 100.00 100.00 FC
Cumul SCI France 100.00 100.00 FC 100.00 100.00 FC
FCP Richebé Gestion France 100.00 100.00 FC 100.00 100.00 FC
FCT LFP Créances Immobilières France 68.11 68.11 FC 68.11 68.11 FC
GIE CMN Prestations France 100.00 100.00 FC 100.00 100.00 FC
L’Immobilière du CMN France 100.00 100.00 FC 100.00 100.00 FC
Mobilease Belgium 100.00 100.00 FC 100.00 100.00 FC
Next Advisor France - - NC 100.00 98.18 FC Merger with Groupe La Française
Nord Europe Lease France 100.00 100.00 FC 100.00 100.00 FC
OBK SCR Belgium 100.00 99.99 FC 100.00 99.99 FC
OPCI Raspail France - - NC 100.00 99.68 FC Wound up
SCI CMN 1 France 100.00 100.00 FC 100.00 100.00 FC
SCI CMN 2 France 100.00 100.00 FC 100.00 100.00 FC
SCI CMN 3 France 100.00 100.00 FC 100.00 100.00 FC
SCI CMN Location France 100.00 100.00 FC 100.00 100.00 FC
SCI CMN Location 2 France 100.00 100.00 FC 100.00 100.00 FC
SCI RICHEBE INKERMAN France 100.00 100.00 FC 100.00 100.00 FC
SCI Raspail Vavin Invest France - - NC 100.00 99.67 FC Wound up
SPV Jarna Luxembourg 100.00 97.83 FC 100.00 98.18 FC
THEIA Viager France 80.00 80.00 FC 80.00 80.00 FC
Transactimmo France 100.00 100.00 FC 100.00 100.00 FC
CMO *** SCI Merlet Immobilier France 100.00 100.00 FC 100.00 100.00 FC
Union Immobilière Océan SCI France 100.00 100.00 FC 100.00 100.00 FC
CMMABN *** Acman France 100.00 100.00 FC 100.00 100.00 FC
Volney Bocage France 100.00 100.00 FC 100.00 100.00 FC
Zephyr Home Loans FCT France 100.00 100.00 FC 100.00 100.00 FC
B. Corporate and Investment Banking
CM11 *** Cigogne Management Luxembourg 100.00 99.33 FC 100.00 99.33 FC
CM-CIC Capital et Participations France 100.00 98.87 FC 100.00 98.87 FC
CM-CIC Conseil France 100.00 98.87 FC 100.00 98.87 FC
CM-CIC Innovation France 100.00 98.87 FC 100.00 98.87 FC
CM-CIC Investissement France 100.00 98.87 FC 100.00 98.87 FC
CM-CIC Investissement SCR France 100.00 98.87 FC 100.00 98.87 FC
CM-CIC Proximité France 100.00 98.87 FC 100.00 98.87 FC
CM-CIC Securities France - - NC 100.00 98.88 FC Merger with CIC IDF
Diversified Debt Securities SICAV - SIF Luxembourg 100.00 98.88 FC 100.00 98.88 FC
FCT CM-CIC Home Loans France 100.00 100.00 FC 100.00 100.00 FC
Sudinnova France - - NC 66.35 65.61 FC Merger with CM-CIC Innovation
* Method: FC = Full Consolidation, EM = Equity Method, NC = Not Consolidated. ** Federal Banks, regional banks, interfederal banks, local banks, federations.*** Presentation by majority-owning Crédit Mutuel Group.
* Method: FC = Full Consolidation, EM = Equity Method, NC = Not Consolidated. ** Federal Banks, regional banks, interfederal banks, local banks, federations.*** Presentation by majority-owning Crédit Mutuel Group.
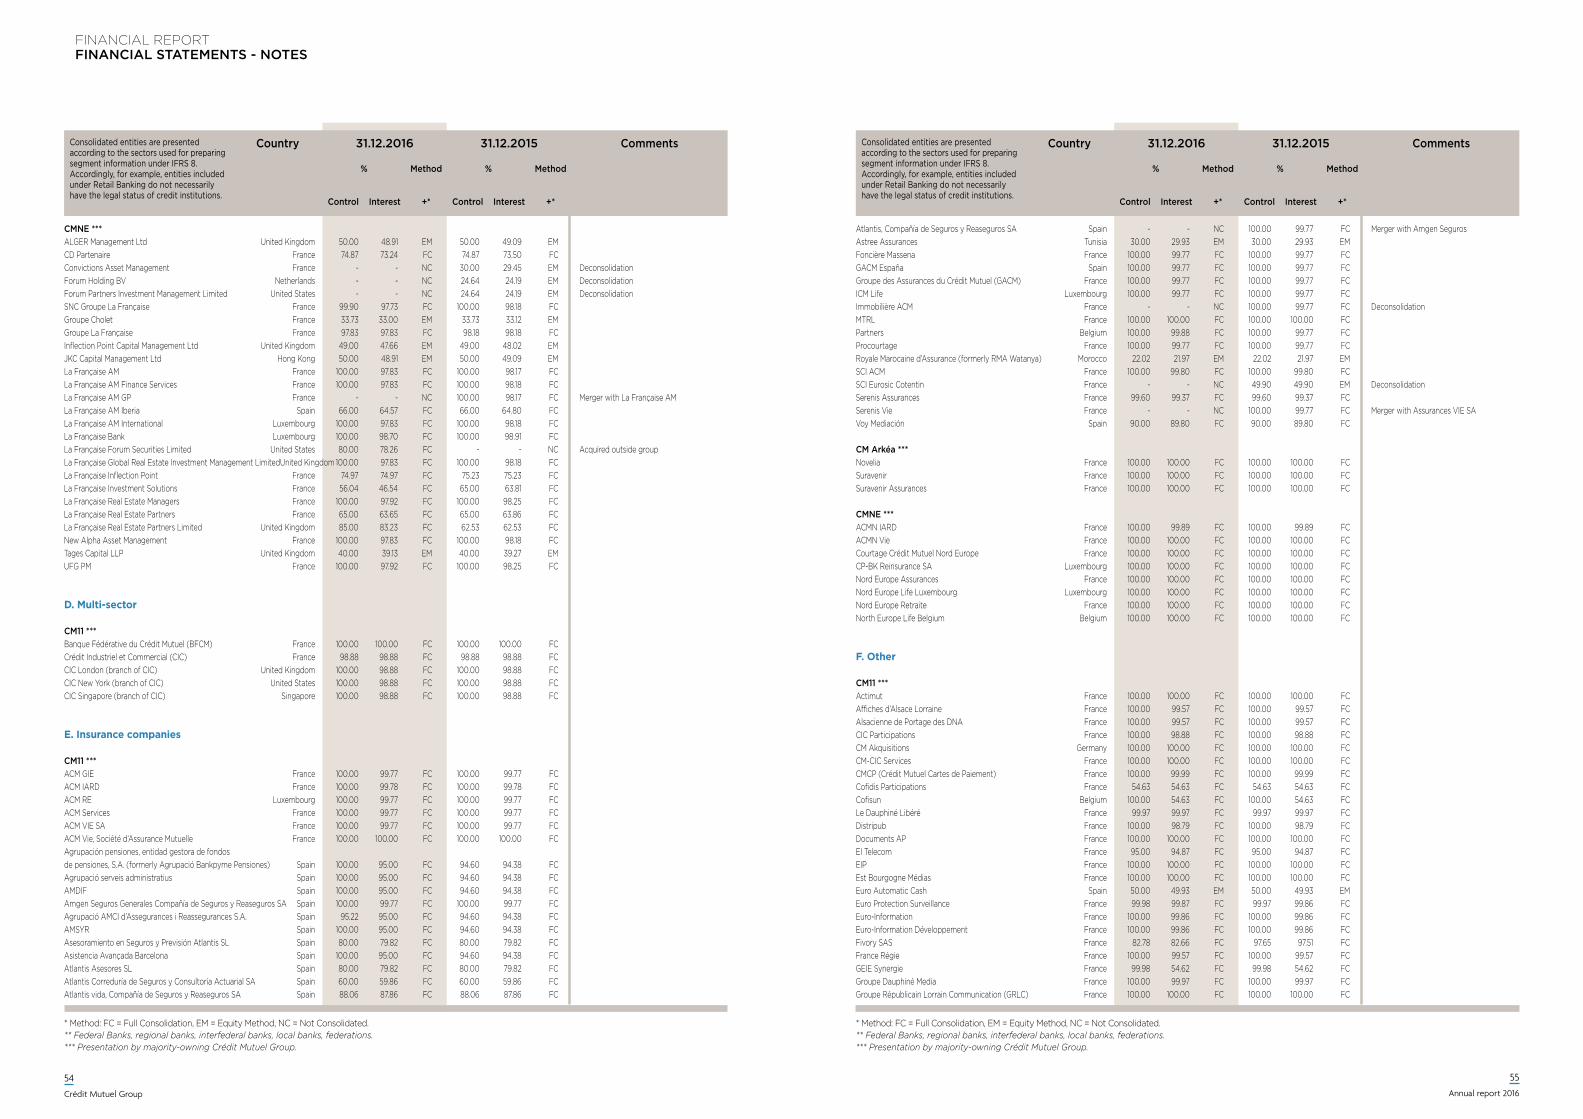
FINANCIAL REPORTFINANCIAL STATEMENTS - NOTES
54
Crédit Mutuel Group
55
Annual report 2016
Consolidated entities are presented according to the sectors used for preparing segment information under IFRS 8. Accordingly, for example, entities included under Retail Banking do not necessarily have the legal status of credit institutions.
Country 31.12.2016 31.12.2015 Comments
% Method % Method
Control Interest +* Control Interest +*
Consolidated entities are presented according to the sectors used for preparing segment information under IFRS 8. Accordingly, for example, entities included under Retail Banking do not necessarily have the legal status of credit institutions.
Country 31.12.2016 31.12.2015 Comments
% Method % Method
Control Interest +* Control Interest +*
Atlantis, Compañía de Seguros y Reaseguros SA Spain - - NC 100.00 99.77 FC Merger with Amgen Seguros Astree Assurances Tunisia 30.00 29.93 EM 30.00 29.93 EM Foncière Massena France 100.00 99.77 FC 100.00 99.77 FC GACM España Spain 100.00 99.77 FC 100.00 99.77 FC Groupe des Assurances du Crédit Mutuel (GACM) France 100.00 99.77 FC 100.00 99.77 FC ICM Life Luxembourg 100.00 99.77 FC 100.00 99.77 FC Immobilière ACM France - - NC 100.00 99.77 FC Deconsolidation MTRL France 100.00 100.00 FC 100.00 100.00 FC Partners Belgium 100.00 99.88 FC 100.00 99.77 FC Procourtage France 100.00 99.77 FC 100.00 99.77 FC Royale Marocaine d’Assurance (formerly RMA Watanya) Morocco 22.02 21.97 EM 22.02 21.97 EM SCI ACM France 100.00 99.80 FC 100.00 99.80 FC SCI Eurosic Cotentin France - - NC 49.90 49.90 EM Deconsolidation Serenis Assurances France 99.60 99.37 FC 99.60 99.37 FC Serenis Vie France - - NC 100.00 99.77 FC Merger with Assurances VIE SA Voy Mediación Spain 90.00 89.80 FC 90.00 89.80 FC
CM Arkéa *** Novelia France 100.00 100.00 FC 100.00 100.00 FCSuravenir France 100.00 100.00 FC 100.00 100.00 FCSuravenir Assurances France 100.00 100.00 FC 100.00 100.00 FC
CMNE *** ACMN IARD France 100.00 99.89 FC 100.00 99.89 FCACMN Vie France 100.00 100.00 FC 100.00 100.00 FCCourtage Crédit Mutuel Nord Europe France 100.00 100.00 FC 100.00 100.00 FCCP-BK Reinsurance SA Luxembourg 100.00 100.00 FC 100.00 100.00 FCNord Europe Assurances France 100.00 100.00 FC 100.00 100.00 FCNord Europe Life Luxembourg Luxembourg 100.00 100.00 FC 100.00 100.00 FCNord Europe Retraite France 100.00 100.00 FC 100.00 100.00 FCNorth Europe Life Belgium Belgium 100.00 100.00 FC 100.00 100.00 FC
F. other
CM11 *** Actimut France 100.00 100.00 FC 100.00 100.00 FC Affiches d’Alsace Lorraine France 100.00 99.57 FC 100.00 99.57 FC Alsacienne de Portage des DNA France 100.00 99.57 FC 100.00 99.57 FC CIC Participations France 100.00 98.88 FC 100.00 98.88 FC CM Akquisitions Germany 100.00 100.00 FC 100.00 100.00 FC CM-CIC Services France 100.00 100.00 FC 100.00 100.00 FC CMCP (Crédit Mutuel Cartes de Paiement) France 100.00 99.99 FC 100.00 99.99 FC Cofidis Participations France 54.63 54.63 FC 54.63 54.63 FC Cofisun Belgium 100.00 54.63 FC 100.00 54.63 FC Le Dauphiné Libéré France 99.97 99.97 FC 99.97 99.97 FC Distripub France 100.00 98.79 FC 100.00 98.79 FC Documents AP France 100.00 100.00 FC 100.00 100.00 FC EI Telecom France 95.00 94.87 FC 95.00 94.87 FC EIP France 100.00 100.00 FC 100.00 100.00 FC Est Bourgogne Médias France 100.00 100.00 FC 100.00 100.00 FC Euro Automatic Cash Spain 50.00 49.93 EM 50.00 49.93 EM Euro Protection Surveillance France 99.98 99.87 FC 99.97 99.86 FC Euro-Information France 100.00 99.86 FC 100.00 99.86 FC Euro-Information Développement France 100.00 99.86 FC 100.00 99.86 FC Fivory SAS France 82.78 82.66 FC 97.65 97.51 FC France Régie France 100.00 99.57 FC 100.00 99.57 FC GEIE Synergie France 99.98 54.62 FC 99.98 54.62 FC Groupe Dauphiné Media France 100.00 99.97 FC 100.00 99.97 FC Groupe Républicain Lorrain Communication (GRLC) France 100.00 100.00 FC 100.00 100.00 FC
CMNE *** ALGER Management Ltd United Kingdom 50.00 48.91 EM 50.00 49.09 EM CD Partenaire France 74.87 73.24 FC 74.87 73.50 FC Convictions Asset Management France - - NC 30.00 29.45 EM DeconsolidationForum Holding BV Netherlands - - NC 24.64 24.19 EM DeconsolidationForum Partners Investment Management Limited United States - - NC 24.64 24.19 EM DeconsolidationSNC Groupe La Française France 99.90 97.73 FC 100.00 98.18 FC Groupe Cholet France 33.73 33.00 EM 33.73 33.12 EM Groupe La Française France 97.83 97.83 FC 98.18 98.18 FC Inflection Point Capital Management Ltd United Kingdom 49.00 47.66 EM 49.00 48.02 EM JKC Capital Management Ltd Hong Kong 50.00 48.91 EM 50.00 49.09 EM La Française AM France 100.00 97.83 FC 100.00 98.17 FC La Française AM Finance Services France 100.00 97.83 FC 100.00 98.18 FC La Française AM GP France - - NC 100.00 98.17 FC Merger with La Française AMLa Française AM Iberia Spain 66.00 64.57 FC 66.00 64.80 FC La Française AM International Luxembourg 100.00 97.83 FC 100.00 98.18 FC La Française Bank Luxembourg 100.00 98.70 FC 100.00 98.91 FC La Française Forum Securities Limited United States 80.00 78.26 FC - - NC Acquired outside groupLa Française Global Real Estate Investment Management Limited United Kingdom 100.00 97.83 FC 100.00 98.18 FC La Française Inflection Point France 74.97 74.97 FC 75.23 75.23 FC La Française Investment Solutions France 56.04 46.54 FC 65.00 63.81 FC La Française Real Estate Managers France 100.00 97.92 FC 100.00 98.25 FC La Française Real Estate Partners France 65.00 63.65 FC 65.00 63.86 FC La Française Real Estate Partners Limited United Kingdom 85.00 83.23 FC 62.53 62.53 FC New Alpha Asset Management France 100.00 97.83 FC 100.00 98.18 FC Tages Capital LLP United Kingdom 40.00 39.13 EM 40.00 39.27 EM UFG PM France 100.00 97.92 FC 100.00 98.25 FC
D. multi-sector
CM11 *** Banque Fédérative du Crédit Mutuel (BFCM) France 100.00 100.00 FC 100.00 100.00 FCCrédit Industriel et Commercial (CIC) France 98.88 98.88 FC 98.88 98.88 FCCIC London (branch of CIC) United Kingdom 100.00 98.88 FC 100.00 98.88 FCCIC New York (branch of CIC) United States 100.00 98.88 FC 100.00 98.88 FCCIC Singapore (branch of CIC) Singapore 100.00 98.88 FC 100.00 98.88 FC
e. Insurance companies
CM11 *** ACM GIE France 100.00 99.77 FC 100.00 99.77 FC ACM IARD France 100.00 99.78 FC 100.00 99.78 FC ACM RE Luxembourg 100.00 99.77 FC 100.00 99.77 FC ACM Services France 100.00 99.77 FC 100.00 99.77 FC ACM VIE SA France 100.00 99.77 FC 100.00 99.77 FC ACM Vie, Société d’Assurance Mutuelle France 100.00 100.00 FC 100.00 100.00 FC Agrupación pensiones, entidad gestora de fondos de pensiones, S.A. (formerly Agrupació Bankpyme Pensiones) Spain 100.00 95.00 FC 94.60 94.38 FC Agrupació serveis administratius Spain 100.00 95.00 FC 94.60 94.38 FC AMDIF Spain 100.00 95.00 FC 94.60 94.38 FC Amgen Seguros Generales Compañía de Seguros y Reaseguros SA Spain 100.00 99.77 FC 100.00 99.77 FC Agrupació AMCI d’Assegurances i Reassegurances S.A. Spain 95.22 95.00 FC 94.60 94.38 FC AMSYR Spain 100.00 95.00 FC 94.60 94.38 FC Asesoramiento en Seguros y Previsión Atlantis SL Spain 80.00 79.82 FC 80.00 79.82 FC Asistencia Avançada Barcelona Spain 100.00 95.00 FC 94.60 94.38 FC Atlantis Asesores SL Spain 80.00 79.82 FC 80.00 79.82 FC Atlantis Correduría de Seguros y Consultoría Actuarial SA Spain 60.00 59.86 FC 60.00 59.86 FC Atlantis vida, Compañía de Seguros y Reaseguros SA Spain 88.06 87.86 FC 88.06 87.86 FC
* Method: FC = Full Consolidation, EM = Equity Method, NC = Not Consolidated. ** Federal Banks, regional banks, interfederal banks, local banks, federations.*** Presentation by majority-owning Crédit Mutuel Group.
* Method: FC = Full Consolidation, EM = Equity Method, NC = Not Consolidated. ** Federal Banks, regional banks, interfederal banks, local banks, federations.*** Presentation by majority-owning Crédit Mutuel Group.
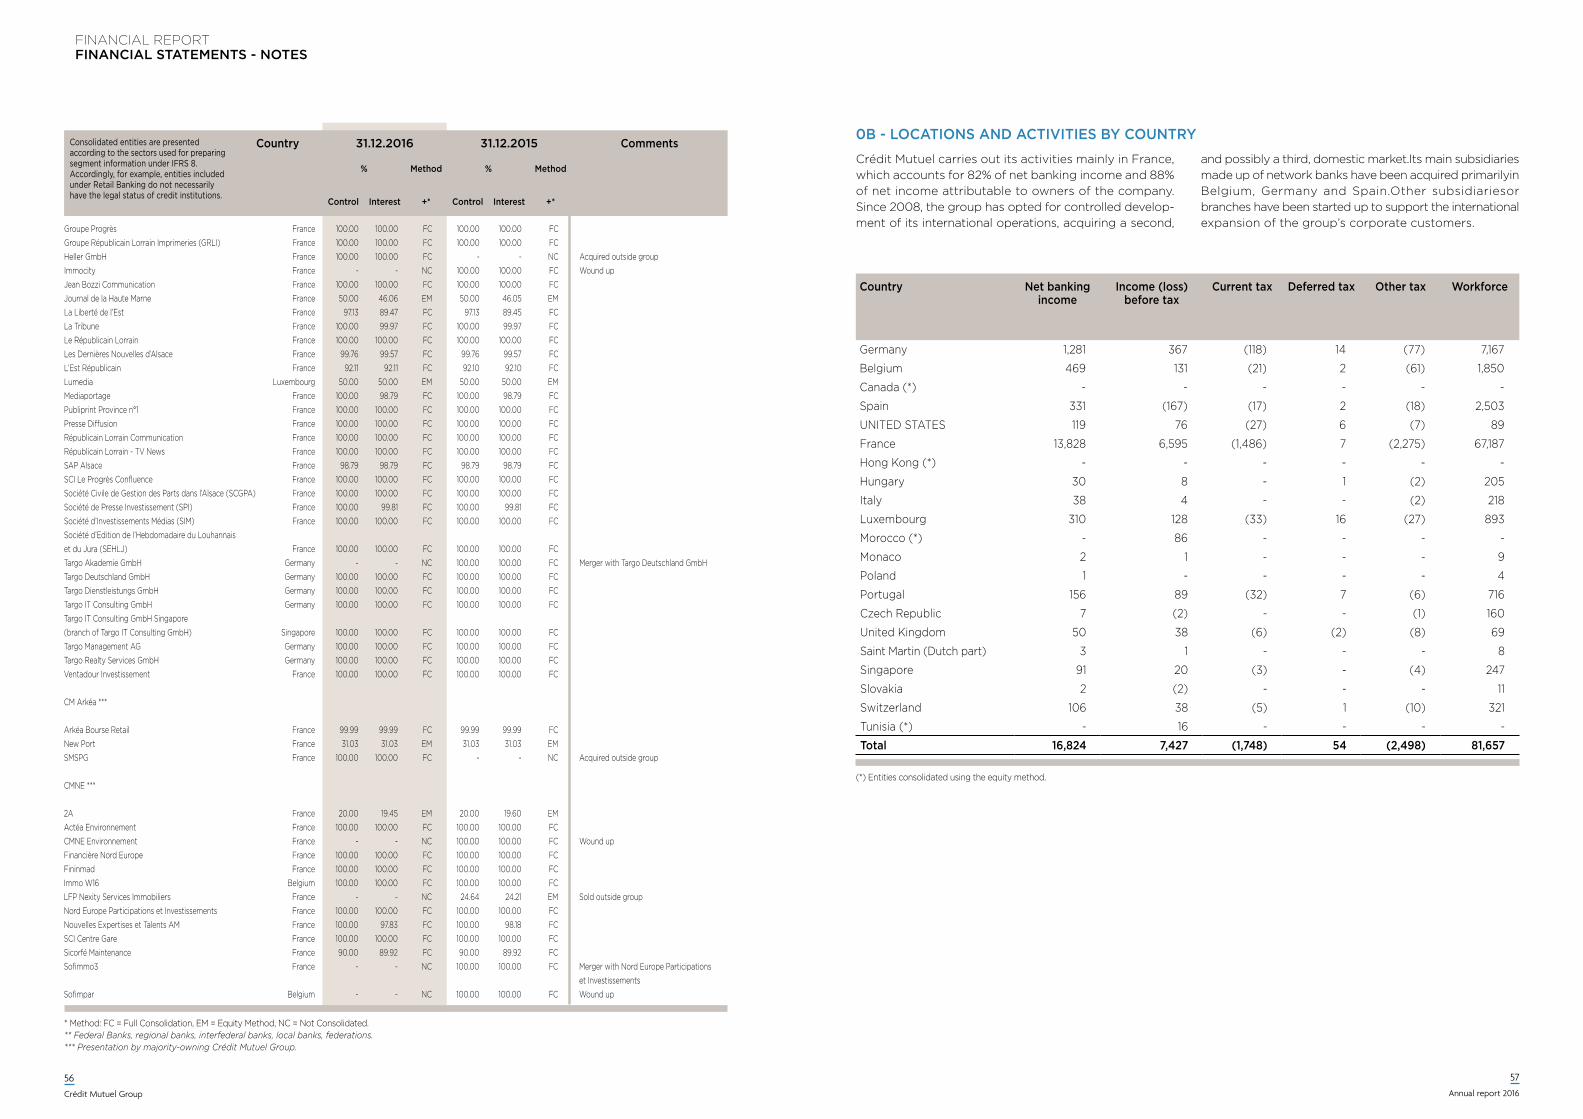
FINANCIAL REPORTFINANCIAL STATEMENTS - NOTES
56
Crédit Mutuel Group
57
Annual report 2016
Consolidated entities are presented according to the sectors used for preparing segment information under IFRS 8. Accordingly, for example, entities included under Retail Banking do not necessarily have the legal status of credit institutions.
Country 31.12.2016 31.12.2015 Comments
% Method % Method
Control Interest +* Control Interest +*
Groupe Progrès France 100.00 100.00 FC 100.00 100.00 FC Groupe Républicain Lorrain Imprimeries (GRLI) France 100.00 100.00 FC 100.00 100.00 FC Heller GmbH France 100.00 100.00 FC - - NC Acquired outside groupImmocity France - - NC 100.00 100.00 FC Wound upJean Bozzi Communication France 100.00 100.00 FC 100.00 100.00 FC Journal de la Haute Marne France 50.00 46.06 EM 50.00 46.05 EM La Liberté de l’Est France 97.13 89.47 FC 97.13 89.45 FC La Tribune France 100.00 99.97 FC 100.00 99.97 FC Le Républicain Lorrain France 100.00 100.00 FC 100.00 100.00 FC Les Dernières Nouvelles d’Alsace France 99.76 99.57 FC 99.76 99.57 FC L’Est Républicain France 92.11 92.11 FC 92.10 92.10 FC Lumedia Luxembourg 50.00 50.00 EM 50.00 50.00 EM Mediaportage France 100.00 98.79 FC 100.00 98.79 FC Publiprint Province n°1 France 100.00 100.00 FC 100.00 100.00 FC Presse Diffusion France 100.00 100.00 FC 100.00 100.00 FC Républicain Lorrain Communication France 100.00 100.00 FC 100.00 100.00 FC Républicain Lorrain - TV News France 100.00 100.00 FC 100.00 100.00 FC SAP Alsace France 98.79 98.79 FC 98.79 98.79 FC SCI Le Progrès Confluence France 100.00 100.00 FC 100.00 100.00 FC Société Civile de Gestion des Parts dans l’Alsace (SCGPA) France 100.00 100.00 FC 100.00 100.00 FC Société de Presse Investissement (SPI) France 100.00 99.81 FC 100.00 99.81 FC Société d’Investissements Médias (SIM) France 100.00 100.00 FC 100.00 100.00 FC Société d’Edition de l’Hebdomadaire du Louhannais et du Jura (SEHLJ) France 100.00 100.00 FC 100.00 100.00 FC Targo Akademie GmbH Germany - - NC 100.00 100.00 FC Merger with Targo Deutschland GmbHTargo Deutschland GmbH Germany 100.00 100.00 FC 100.00 100.00 FC Targo Dienstleistungs GmbH Germany 100.00 100.00 FC 100.00 100.00 FC Targo IT Consulting GmbH Germany 100.00 100.00 FC 100.00 100.00 FC Targo IT Consulting GmbH Singapore (branch of Targo IT Consulting GmbH) Singapore 100.00 100.00 FC 100.00 100.00 FC Targo Management AG Germany 100.00 100.00 FC 100.00 100.00 FC Targo Realty Services GmbH Germany 100.00 100.00 FC 100.00 100.00 FC Ventadour Investissement France 100.00 100.00 FC 100.00 100.00 FC CM Arkéa *** Arkéa Bourse Retail France 99.99 99.99 FC 99.99 99.99 FC New Port France 31.03 31.03 EM 31.03 31.03 EM SMSPG France 100.00 100.00 FC - - NC Acquired outside group CMNE *** 2A France 20.00 19.45 EM 20.00 19.60 EM Actéa Environnement France 100.00 100.00 FC 100.00 100.00 FC CMNE Environnement France - - NC 100.00 100.00 FC Wound up Financière Nord Europe France 100.00 100.00 FC 100.00 100.00 FC Fininmad France 100.00 100.00 FC 100.00 100.00 FC Immo W16 Belgium 100.00 100.00 FC 100.00 100.00 FC LFP Nexity Services Immobiliers France - - NC 24.64 24.21 EM Sold outside groupNord Europe Participations et Investissements France 100.00 100.00 FC 100.00 100.00 FC Nouvelles Expertises et Talents AM France 100.00 97.83 FC 100.00 98.18 FC SCI Centre Gare France 100.00 100.00 FC 100.00 100.00 FC Sicorfé Maintenance France 90.00 89.92 FC 90.00 89.92 FC Sofimmo3 France - - NC 100.00 100.00 FC Merger with Nord Europe Participations
et InvestissementsSofimpar Belgium - - NC 100.00 100.00 FC Wound up
* Method: FC = Full Consolidation, EM = Equity Method, NC = Not Consolidated. ** Federal Banks, regional banks, interfederal banks, local banks, federations.*** Presentation by majority-owning Crédit Mutuel Group.
Country Net banking income
Income (loss) before tax
Current tax Deferred tax Other tax Workforce
Germany 1,281 367 (118) 14 (77) 7,167
Belgium 469 131 (21) 2 (61) 1,850
Canada (*) - - - - - -
Spain 331 (167) (17) 2 (18) 2,503
United StateS 119 76 (27) 6 (7) 89
France 13,828 6,595 (1,486) 7 (2,275) 67,187
Hong Kong (*) - - - - - -
Hungary 30 8 - 1 (2) 205
italy 38 4 - - (2) 218
Luxembourg 310 128 (33) 16 (27) 893
Morocco (*) - 86 - - - -
Monaco 2 1 - - - 9
Poland 1 - - - - 4
Portugal 156 89 (32) 7 (6) 716
Czech Republic 7 (2) - - (1) 160
United Kingdom 50 38 (6) (2) (8) 69
Saint Martin (dutch part) 3 1 - - - 8
Singapore 91 20 (3) - (4) 247
Slovakia 2 (2) - - - 11
Switzerland 106 38 (5) 1 (10) 321
tunisia (*) - 16 - - - -
Total 16,824 7,427 (1,748) 54 (2,498) 81,657
(*) entities consolidated using the equity method.
0B - LOCATIONS AND ACTIvITIES By COUNTRy
Crédit Mutuel carries out its activities mainly in France, which accounts for 82% of net banking income and 88% of net income attributable to owners of the company. Since 2008, the group has opted for controlled develop-ment of its international operations, acquiring a second,
and possibly a third, domestic market.Its main subsidiaries made up of network banks have been acquired primarilyin Belgium, Germany and Spain.Other subsidiariesor branches have been started up to support the international expansion of the group’s corporate customers.
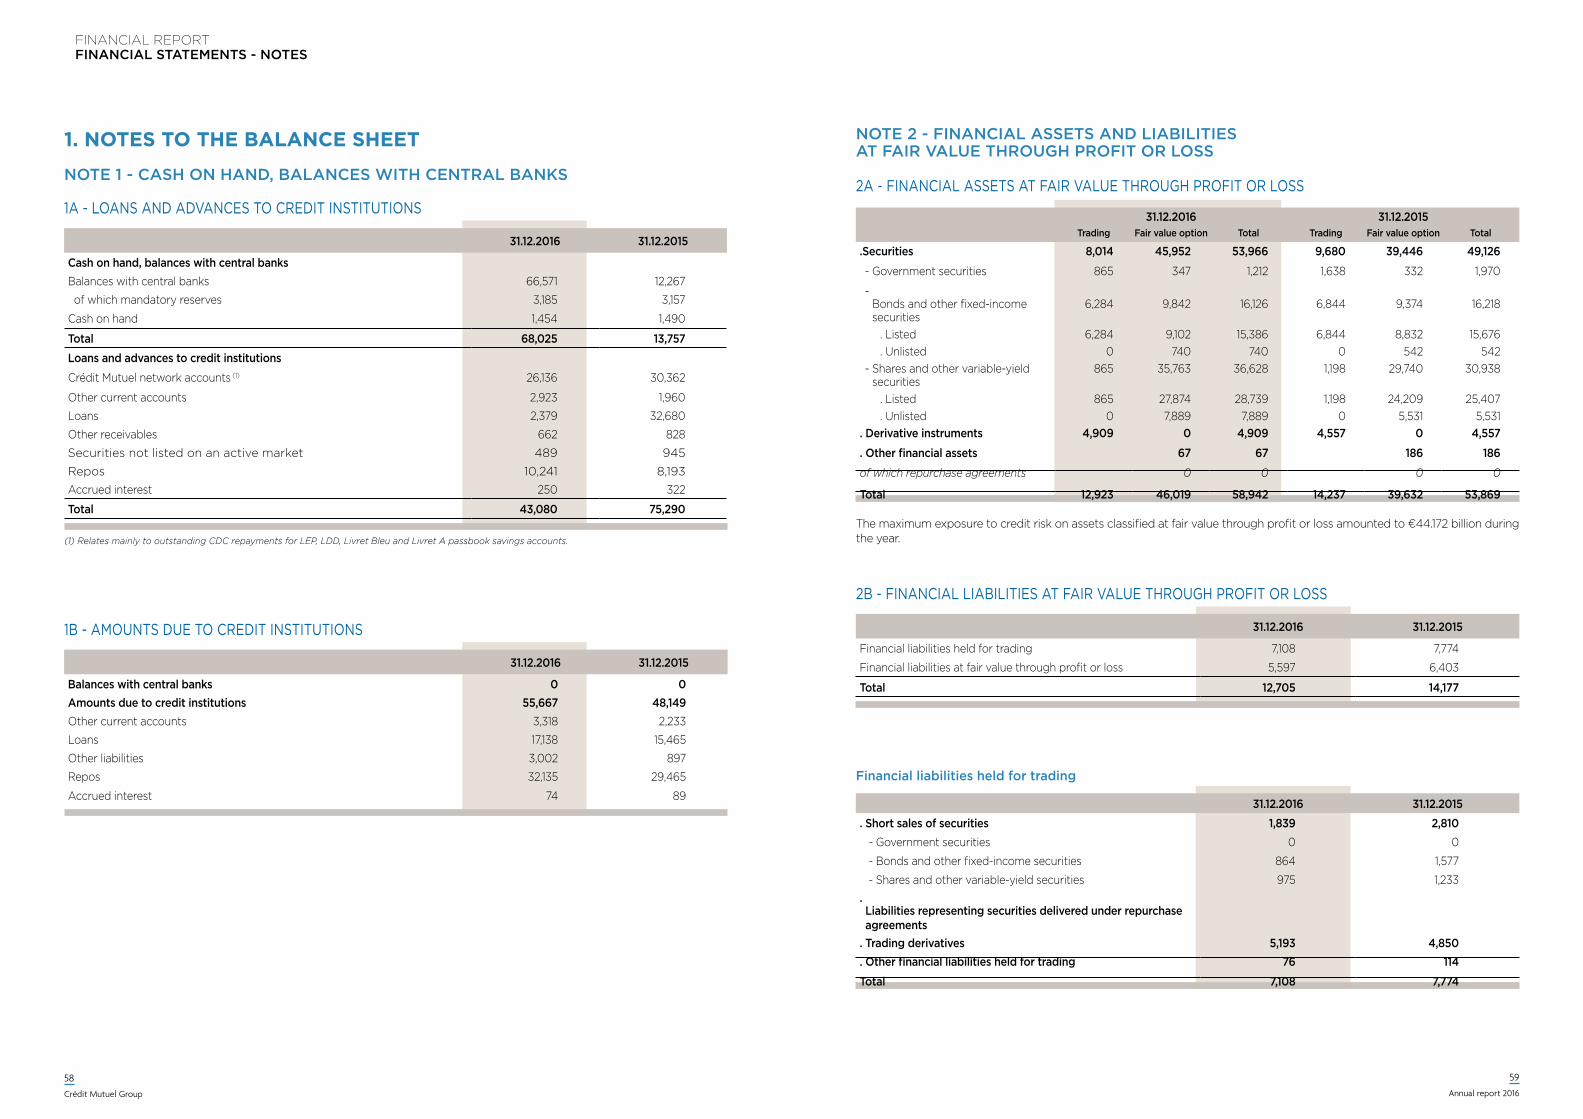
FINANCIAL REPORTFINANCIAL STATEMENTS - NOTES
58
Crédit Mutuel Group
59
Annual report 2016
1. noteS to tHe BALAnCe SHeet
NOTE 1 - CASH ON HAND, BALANCES wITH CENTRAL BANkS
NOTE 2 - FINANCIAL ASSETS AND LIABILITIES AT FAIR vALUE THROUGH PROFIT OR LOSS
1A - LOANS AND ADVANCES TO CREDIT INSTITUTIONS
31.12.2016 31.12.2015
Cash on hand, balances with central banks
Balances with central banks 66,571 12,267
of which mandatory reserves 3,185 3,157
Cash on hand 1,454 1,490
Total 68,025 13,757
Loans and advances to credit institutions
Crédit Mutuel network accounts (1) 26,136 30,362
Other current accounts 2,923 1,960
Loans 2,379 32,680
Other receivables 662 828
Securities not listed on an active market 489 945
Repos 10,241 8,193
Accrued interest 250 322
Total 43,080 75,290
(1) Relates mainly to outstanding CDC repayments for LEP, LDD, Livret Bleu and Livret A passbook savings accounts.
1B - AMOUNTS DUE TO CREDIT INSTITUTIONS
31.12.2016 31.12.2015
Balances with central banks 0 0Amounts due to credit institutions 55,667 48,149Other current accounts 3,318 2,233
Loans 17,138 15,465
Other liabilities 3,002 897
Repos 32,135 29,465
Accrued interest 74 89
2B - FINANCIAL LIABILITIES AT FAIR VALUE ThROUGh PROFIT OR LOSS
31.12.2016 31.12.2015
Financial liabilities held for trading 7,108 7,774
Financial liabilities at fair value through profit or loss 5,597 6,403
Total 12,705 14,177
Financial liabilities held for trading
31.12.2016 31.12.2015
. Short sales of securities 1,839 2,810 - Government securities 0 0
- Bonds and other fixed-income securities 864 1,577
- Shares and other variable-yield securities 975 1,233. Liabilities representing securities delivered under repurchase agreements
. Trading derivatives 5,193 4,850
. Other financial liabilities held for trading 76 114
Total 7,108 7,774
2A - FINANCIAL ASSETS AT FAIR VALUE ThROUGh PROFIT OR LOSS
31.12.2016 31.12.2015Trading Fair value option Total Trading Fair value option Total
.Securities 8,014 45,952 53,966 9,680 39,446 49,126
- Government securities 865 347 1,212 1,638 332 1,970
- Bonds and other fixed-income securities
6,284 9,842 16,126 6,844 9,374 16,218
. Listed 6,284 9,102 15,386 6,844 8,832 15,676 . Unlisted 0 740 740 0 542 542 - Shares and other variable-yield
securities865 35,763 36,628 1,198 29,740 30,938
. Listed 865 27,874 28,739 1,198 24,209 25,407 . Unlisted 0 7,889 7,889 0 5,531 5,531. Derivative instruments 4,909 0 4,909 4,557 0 4,557
. Other financial assets 67 67 186 186
of which repurchase agreements 0 0 0 0
Total 12,923 46,019 58,942 14,237 39,632 53,869 The maximum exposure to credit risk on assets classified at fair value through profit or loss amounted to €44.172 billion during the year.
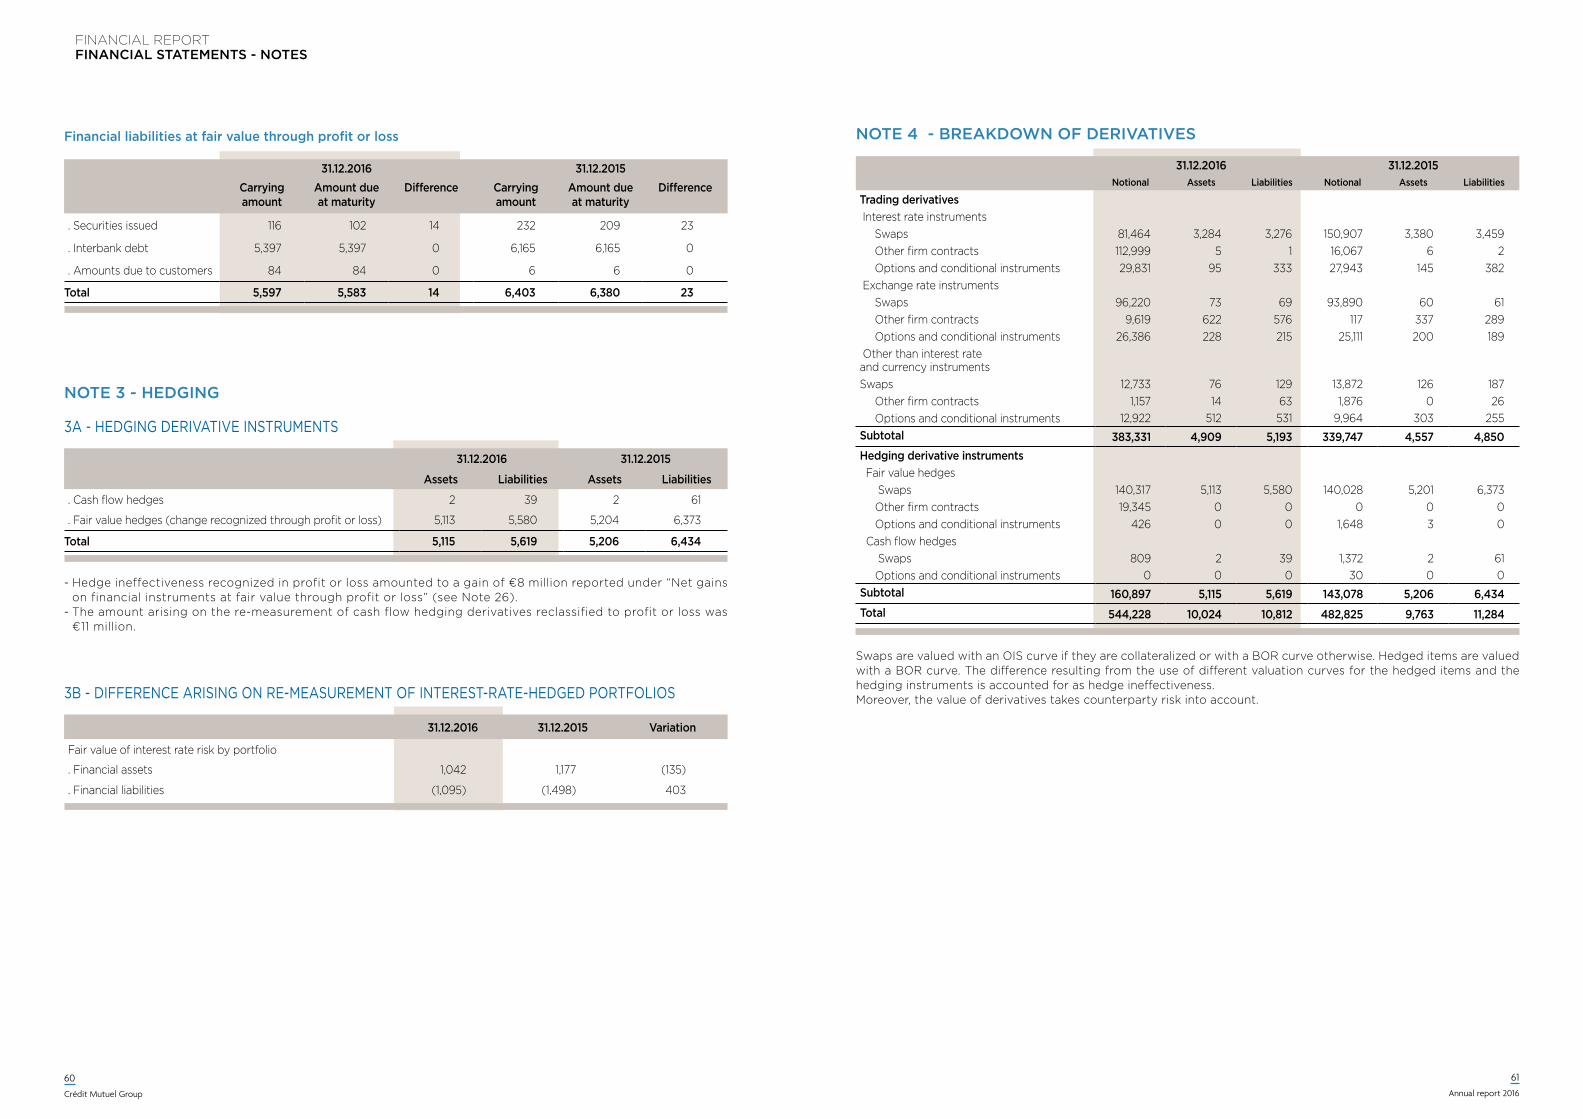
FINANCIAL REPORTFINANCIAL STATEMENTS - NOTES
60
Crédit Mutuel Group
61
Annual report 2016
Financial liabilities at fair value through profit or loss
31.12.2016 31.12.2015Carrying amount
Amount due at maturity
Difference Carrying amount
Amount due at maturity
Difference
. Securities issued 116 102 14 232 209 23
. Interbank debt 5,397 5,397 0 6,165 6,165 0
. Amounts due to customers 84 84 0 6 6 0
Total 5,597 5,583 14 6,403 6,380 23
NOTE 3 - HEDGING
3A - hEDGING DERIVATIVE INSTRUMENTS
31.12.2016 31.12.2015
Assets Liabilities Assets Liabilities
. Cash flow hedges 2 39 2 61
. Fair value hedges (change recognized through profit or loss) 5,113 5,580 5,204 6,373
Total 5,115 5,619 5,206 6,434
3B - DIFFERENCE ARISING ON RE-MEASUREMENT OF INTEREST-RATE-hEDGED PORTFOLIOS
31.12.2016 31.12.2015 Variation
Fair value of interest rate risk by portfolio
. Financial assets 1,042 1,177 (135)
. Financial liabilities (1,095) (1,498) 403
NOTE 4 - BREAkDOwN OF DERIvATIvES
31.12.2016 31.12.2015Notional Assets Liabilities Notional Assets Liabilities
Trading derivatives Interest rate instruments Swaps 81,464 3,284 3,276 150,907 3,380 3,459 Other firm contracts 112,999 5 1 16,067 6 2 Options and conditional instruments 29,831 95 333 27,943 145 382 Exchange rate instruments Swaps 96,220 73 69 93,890 60 61 Other firm contracts 9,619 622 576 117 337 289 Options and conditional instruments 26,386 228 215 25,111 200 189 Other than interest rate and currency instrumentsSwaps 12,733 76 129 13,872 126 187 Other firm contracts 1,157 14 63 1,876 0 26 Options and conditional instruments 12,922 512 531 9,964 303 255Subtotal 383,331 4,909 5,193 339,747 4,557 4,850Hedging derivative instruments Fair value hedges Swaps 140,317 5,113 5,580 140,028 5,201 6,373 Other firm contracts 19,345 0 0 0 0 0 Options and conditional instruments 426 0 0 1,648 3 0 Cash flow hedges Swaps 809 2 39 1,372 2 61 Options and conditional instruments 0 0 0 30 0 0Subtotal 160,897 5,115 5,619 143,078 5,206 6,434Total 544,228 10,024 10,812 482,825 9,763 11,284
Swaps are valued with an OIS curve if they are collateralized or with a BOR curve otherwise. Hedged items are valued with a BOR curve. The difference resulting from the use of different valuation curves for the hedged items and the hedging instruments is accounted for as hedge ineffectiveness.Moreover, the value of derivatives takes counterparty risk into account.
- Hedge ineffectiveness recognized in profit or loss amounted to a gain of €8 million reported under “Net gains on financial instruments at fair value through profit or loss” (see Note 26).
- The amount arising on the re-measurement of cash flow hedging derivatives reclassified to profit or loss was €11 million.
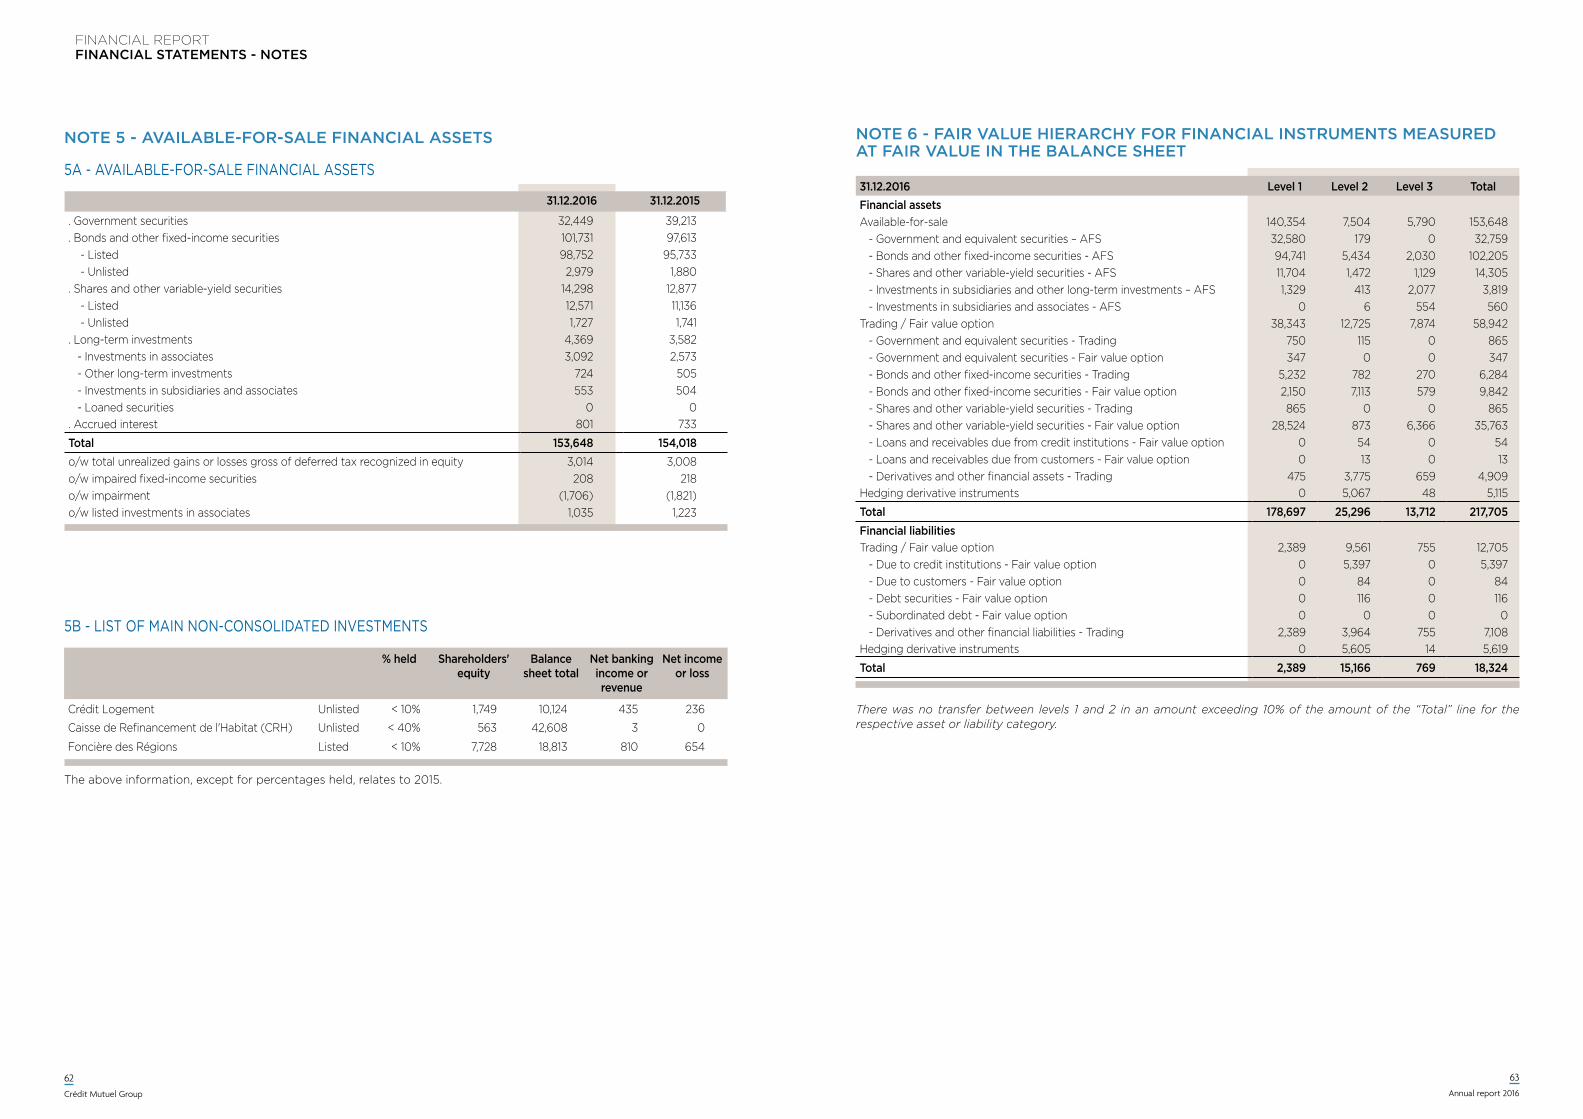
FINANCIAL REPORTFINANCIAL STATEMENTS - NOTES
62
Crédit Mutuel Group
63
Annual report 2016
NOTE 5 - AvAILABLE-FOR-SALE FINANCIAL ASSETS
5A - AVAILABLE-FOR-SALE FINANCIAL ASSETS
31.12.2016 31.12.2015
. Government securities 32,449 39,213
. Bonds and other fixed-income securities 101,731 97,613 - Listed 98,752 95,733 - Unlisted 2,979 1,880. Shares and other variable-yield securities 14,298 12,877 - Listed 12,571 11,136 - Unlisted 1,727 1,741. Long-term investments 4,369 3,582 - Investments in associates 3,092 2,573 - Other long-term investments 724 505 - Investments in subsidiaries and associates 553 504 - Loaned securities 0 0. Accrued interest 801 733
Total 153,648 154,018o/w total unrealized gains or losses gross of deferred tax recognized in equity 3,014 3,008o/w impaired fixed-income securities 208 218o/w impairment (1,706) (1,821)o/w listed investments in associates 1,035 1,223
5B - LIST OF MAIN NON-CONSOLIDATED INVESTMENTS
% held Shareholders' equity
Balance sheet total
Net banking income or revenue
Net income or loss
Crédit Logement Unlisted < 10% 1,749 10,124 435 236
Caisse de Refinancement de l'Habitat (CRH) Unlisted < 40% 563 42,608 3 0
Foncière des Régions Listed < 10% 7,728 18,813 810 654
The above information, except for percentages held, relates to 2015.
NOTE 6 - FAIR vALUE HIERARCHy FOR FINANCIAL INSTRUMENTS MEASURED AT FAIR vALUE IN THE BALANCE SHEET
31.12.2016 Level 1 Level 2 Level 3 TotalFinancial assetsAvailable-for-sale 140,354 7,504 5,790 153,648 - Government and equivalent securities – AFS 32,580 179 0 32,759 - Bonds and other fixed-income securities - AFS 94,741 5,434 2,030 102,205 - Shares and other variable-yield securities - AFS 11,704 1,472 1,129 14,305 - Investments in subsidiaries and other long-term investments – AFS 1,329 413 2,077 3,819 - Investments in subsidiaries and associates - AFS 0 6 554 560Trading / Fair value option 38,343 12,725 7,874 58,942 - Government and equivalent securities - Trading 750 115 0 865 - Government and equivalent securities - Fair value option 347 0 0 347 - Bonds and other fixed-income securities - Trading 5,232 782 270 6,284 - Bonds and other fixed-income securities - Fair value option 2,150 7,113 579 9,842 - Shares and other variable-yield securities - Trading 865 0 0 865 - Shares and other variable-yield securities - Fair value option 28,524 873 6,366 35,763 - Loans and receivables due from credit institutions - Fair value option 0 54 0 54 - Loans and receivables due from customers - Fair value option 0 13 0 13 - Derivatives and other financial assets - Trading 475 3,775 659 4,909Hedging derivative instruments 0 5,067 48 5,115
Total 178,697 25,296 13,712 217,705Financial liabilities Trading / Fair value option 2,389 9,561 755 12,705 - Due to credit institutions - Fair value option 0 5,397 0 5,397 - Due to customers - Fair value option 0 84 0 84 - Debt securities - Fair value option 0 116 0 116 - Subordinated debt - Fair value option 0 0 0 0 - Derivatives and other financial liabilities - Trading 2,389 3,964 755 7,108Hedging derivative instruments 0 5,605 14 5,619
Total 2,389 15,166 769 18,324
There was no transfer between levels 1 and 2 in an amount exceeding 10% of the amount of the “Total” line for the respective asset or liability category.
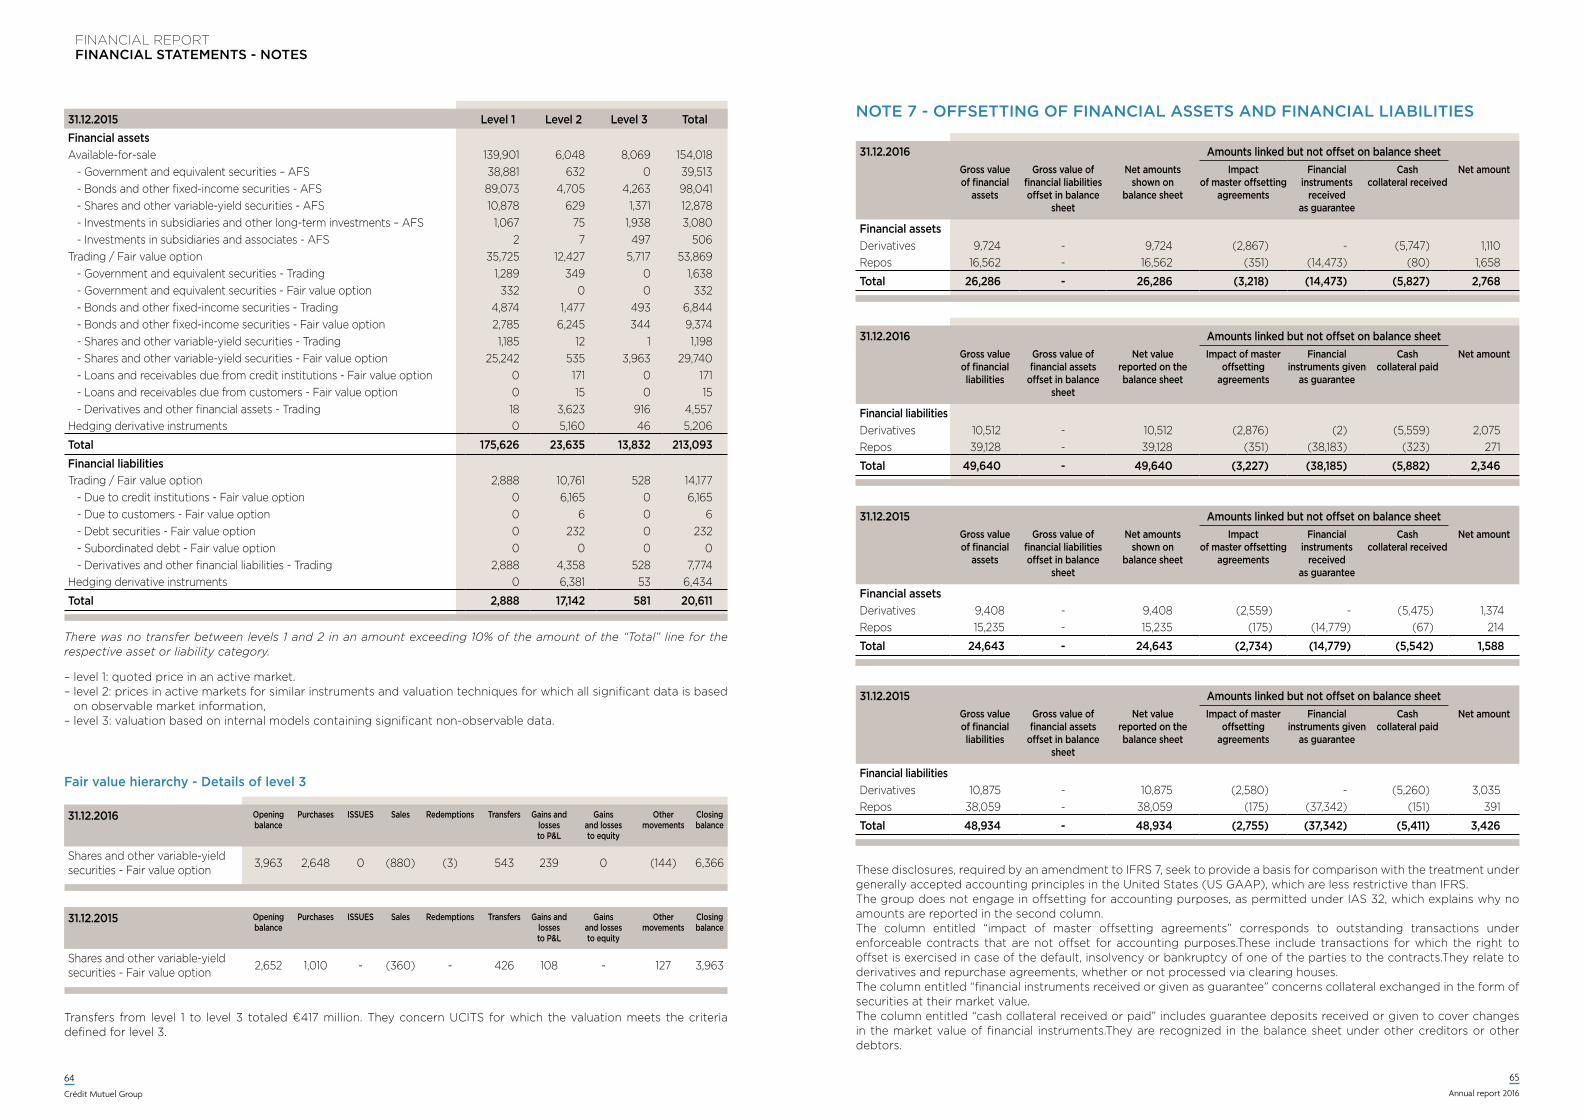
FINANCIAL REPORTFINANCIAL STATEMENTS - NOTES
64
Crédit Mutuel Group
65
Annual report 2016
31.12.2015 Level 1 Level 2 Level 3 TotalFinancial assetsAvailable-for-sale 139,901 6,048 8,069 154,018 - Government and equivalent securities – AFS 38,881 632 0 39,513 - Bonds and other fixed-income securities - AFS 89,073 4,705 4,263 98,041 - Shares and other variable-yield securities - AFS 10,878 629 1,371 12,878 - Investments in subsidiaries and other long-term investments – AFS 1,067 75 1,938 3,080 - Investments in subsidiaries and associates - AFS 2 7 497 506Trading / Fair value option 35,725 12,427 5,717 53,869 - Government and equivalent securities - Trading 1,289 349 0 1,638 - Government and equivalent securities - Fair value option 332 0 0 332 - Bonds and other fixed-income securities - Trading 4,874 1,477 493 6,844 - Bonds and other fixed-income securities - Fair value option 2,785 6,245 344 9,374 - Shares and other variable-yield securities - Trading 1,185 12 1 1,198 - Shares and other variable-yield securities - Fair value option 25,242 535 3,963 29,740 - Loans and receivables due from credit institutions - Fair value option 0 171 0 171 - Loans and receivables due from customers - Fair value option 0 15 0 15 - Derivatives and other financial assets - Trading 18 3,623 916 4,557Hedging derivative instruments 0 5,160 46 5,206
Total 175,626 23,635 13,832 213,093Financial liabilities Trading / Fair value option 2,888 10,761 528 14,177 - Due to credit institutions - Fair value option 0 6,165 0 6,165 - Due to customers - Fair value option 0 6 0 6 - Debt securities - Fair value option 0 232 0 232 - Subordinated debt - Fair value option 0 0 0 0 - Derivatives and other financial liabilities - Trading 2,888 4,358 528 7,774Hedging derivative instruments 0 6,381 53 6,434
Total 2,888 17,142 581 20,611
There was no transfer between levels 1 and 2 in an amount exceeding 10% of the amount of the “Total” line for the respective asset or liability category.
– level 1: quoted price in an active market.– level 2: prices in active markets for similar instruments and valuation techniques for which all significant data is based
on observable market information,– level 3: valuation based on internal models containing significant non-observable data.
Fair value hierarchy - Details of level 3
31.12.2016 Opening balance
Purchases Issues sales Redemptions Transfers Gains and losses to P&L
Gains and losses to equity
Other movements
Closing balance
Shares and other variable-yield securities - Fair value option 3,963 2,648 0 (880) (3) 543 239 0 (144) 6,366
31.12.2015 Opening balance
Purchases Issues sales Redemptions Transfers Gains and losses to P&L
Gains and losses to equity
Other movements
Closing balance
Shares and other variable-yield securities - Fair value option 2,652 1,010 - (360) - 426 108 - 127 3,963
Transfers from level 1 to level 3 totaled €417 million. They concern UCITS for which the valuation meets the criteria defined for level 3.
NOTE 7 - OFFSETTING OF FINANCIAL ASSETS AND FINANCIAL LIABILITIES
31.12.2016 Amounts linked but not offset on balance sheetGross value of financial
assets
Gross value of financial liabilities offset in balance
sheet
Net amounts shown on
balance sheet
Impact of master offsetting
agreements
Financial instruments
received as guarantee
Cash collateral received
Net amount
Financial assetsDerivatives 9,724 - 9,724 (2,867) - (5,747) 1,110Repos 16,562 - 16,562 (351) (14,473) (80) 1,658
Total 26,286 - 26,286 (3,218) (14,473) (5,827) 2,768
31.12.2016 Amounts linked but not offset on balance sheetGross value of financial liabilities
Gross value of financial assets
offset in balance sheet
Net value reported on the balance sheet
Impact of master offsetting
agreements
Financial instruments given
as guarantee
Cash collateral paid
Net amount
Financial liabilitiesDerivatives 10,512 - 10,512 (2,876) (2) (5,559) 2,075Repos 39,128 - 39,128 (351) (38,183) (323) 271
Total 49,640 - 49,640 (3,227) (38,185) (5,882) 2,346
31.12.2015 Amounts linked but not offset on balance sheetGross value of financial liabilities
Gross value of financial assets
offset in balance sheet
Net value reported on the balance sheet
Impact of master offsetting
agreements
Financial instruments given
as guarantee
Cash collateral paid
Net amount
Financial liabilitiesDerivatives 10,875 - 10,875 (2,580) - (5,260) 3,035Repos 38,059 - 38,059 (175) (37,342) (151) 391
Total 48,934 - 48,934 (2,755) (37,342) (5,411) 3,426
31.12.2015 Amounts linked but not offset on balance sheetGross value of financial
assets
Gross value of financial liabilities offset in balance
sheet
Net amounts shown on
balance sheet
Impact of master offsetting
agreements
Financial instruments
received as guarantee
Cash collateral received
Net amount
Financial assetsDerivatives 9,408 - 9,408 (2,559) - (5,475) 1,374Repos 15,235 - 15,235 (175) (14,779) (67) 214
Total 24,643 - 24,643 (2,734) (14,779) (5,542) 1,588
These disclosures, required by an amendment to IFRS 7, seek to provide a basis for comparison with the treatment under generally accepted accounting principles in the United States (US GAAP), which are less restrictive than IFRS.The group does not engage in offsetting for accounting purposes, as permitted under IAS 32, which explains why no amounts are reported in the second column.The column entitled “impact of master offsetting agreements” corresponds to outstanding transactions under enforceable contracts that are not offset for accounting purposes.These include transactions for which the right to offset is exercised in case of the default, insolvency or bankruptcy of one of the parties to the contracts.They relate to derivatives and repurchase agreements, whether or not processed via clearing houses.The column entitled “financial instruments received or given as guarantee” concerns collateral exchanged in the form of securities at their market value.The column entitled “cash collateral received or paid” includes guarantee deposits received or given to cover changes in the market value of financial instruments.They are recognized in the balance sheet under other creditors or other debtors.
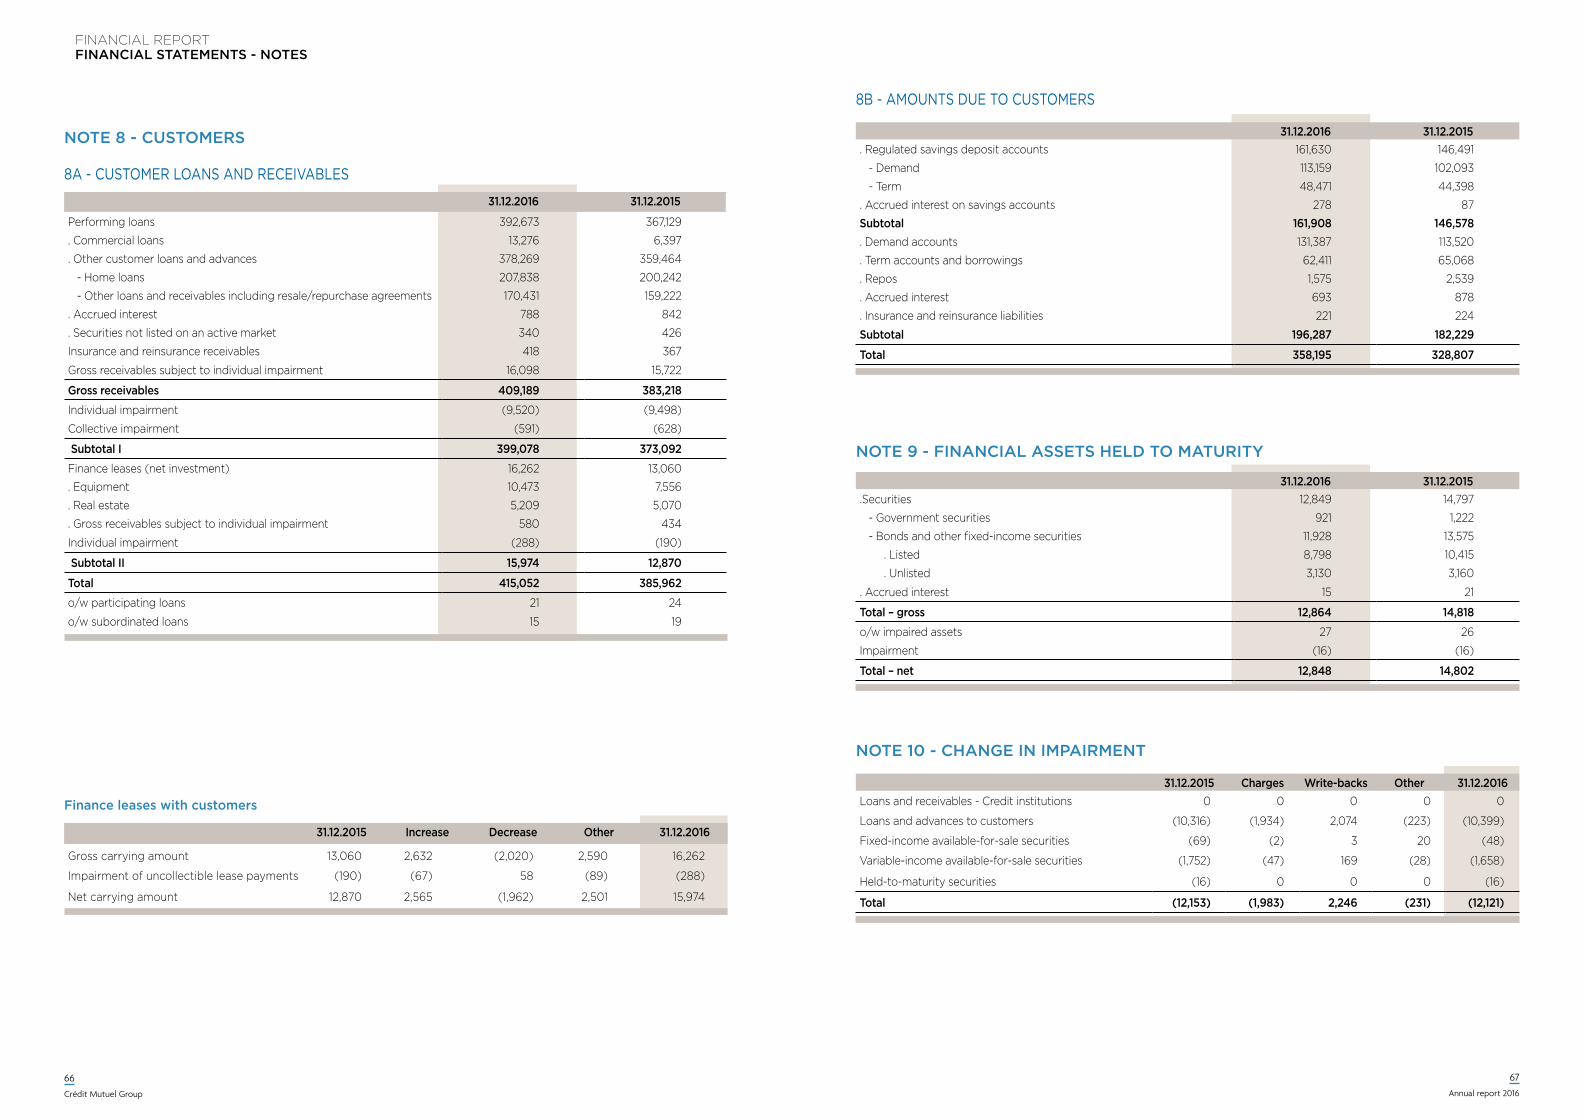
FINANCIAL REPORTFINANCIAL STATEMENTS - NOTES
66
Crédit Mutuel Group
67
Annual report 2016
NOTE 8 - CUSTOMERS
NOTE 9 - FINANCIAL ASSETS HELD TO MATURITy
NOTE 10 - CHANGE IN IMPAIRMENT
8A - CUSTOMER LOANS AND RECEIVABLES
31.12.2016 31.12.2015
Performing loans 392,673 367,129
. Commercial loans 13,276 6,397
. Other customer loans and advances 378,269 359,464
- Home loans 207,838 200,242
- Other loans and receivables including resale/repurchase agreements 170,431 159,222
. Accrued interest 788 842
. Securities not listed on an active market 340 426
Insurance and reinsurance receivables 418 367
Gross receivables subject to individual impairment 16,098 15,722
Gross receivables 409,189 383,218
Individual impairment (9,520) (9,498)
Collective impairment (591) (628)
Subtotal I 399,078 373,092
Finance leases (net investment) 16,262 13,060
. Equipment 10,473 7,556
. Real estate 5,209 5,070
. Gross receivables subject to individual impairment 580 434
Individual impairment (288) (190)
Subtotal II 15,974 12,870
Total 415,052 385,962
o/w participating loans 21 24
o/w subordinated loans 15 19
Finance leases with customers
31.12.2015 Increase Decrease Other 31.12.2016
Gross carrying amount 13,060 2,632 (2,020) 2,590 16,262
Impairment of uncollectible lease payments (190) (67) 58 (89) (288)
Net carrying amount 12,870 2,565 (1,962) 2,501 15,974
8B - AMOUNTS DUE TO CUSTOMERS
31.12.2016 31.12.2015. Regulated savings deposit accounts 161,630 146,491
- Demand 113,159 102,093
- Term 48,471 44,398
. Accrued interest on savings accounts 278 87
Subtotal 161,908 146,578. Demand accounts 131,387 113,520
. Term accounts and borrowings 62,411 65,068
. Repos 1,575 2,539
. Accrued interest 693 878
. Insurance and reinsurance liabilities 221 224
Subtotal 196,287 182,229
Total 358,195 328,807
31.12.2016 31.12.2015.Securities 12,849 14,797
- Government securities 921 1,222
- Bonds and other fixed-income securities 11,928 13,575
. Listed 8,798 10,415
. Unlisted 3,130 3,160
. Accrued interest 15 21
Total – gross 12,864 14,818
o/w impaired assets 27 26
Impairment (16) (16)
Total – net 12,848 14,802
31.12.2015 Charges Write-backs Other 31.12.2016Loans and receivables - Credit institutions 0 0 0 0 0
Loans and advances to customers (10,316) (1,934) 2,074 (223) (10,399)
Fixed-income available-for-sale securities (69) (2) 3 20 (48)
Variable-income available-for-sale securities (1,752) (47) 169 (28) (1,658)
Held-to-maturity securities (16) 0 0 0 (16)
Total (12,153) (1,983) 2,246 (231) (12,121)
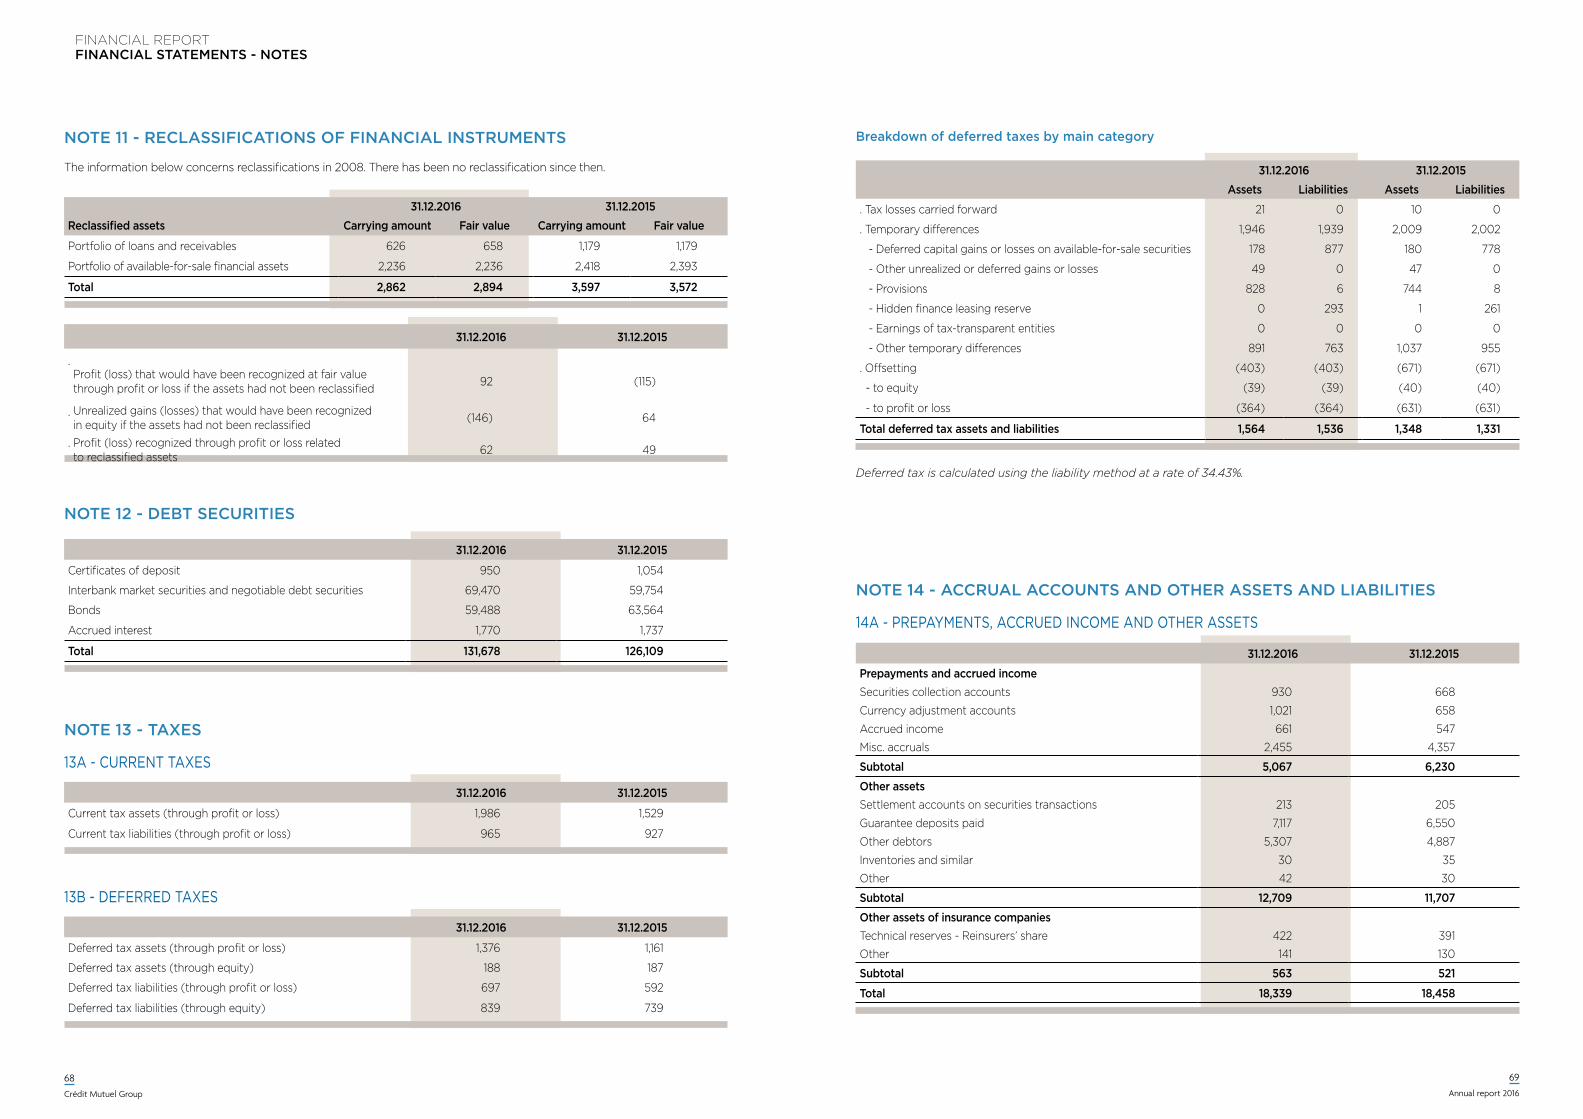
FINANCIAL REPORTFINANCIAL STATEMENTS - NOTES
68
Crédit Mutuel Group
69
Annual report 2016
NOTE 11 - RECLASSIFICATIONS OF FINANCIAL INSTRUMENTS
The information below concerns reclassifications in 2008. There has been no reclassification since then.
31.12.2016 31.12.2015Reclassified assets Carrying amount Fair value Carrying amount Fair value
Portfolio of loans and receivables 626 658 1,179 1,179
Portfolio of available-for-sale financial assets 2,236 2,236 2,418 2,393
Total 2,862 2,894 3,597 3,572
31.12.2016 31.12.2015
. Profit (loss) that would have been recognized at fair value through profit or loss if the assets had not been reclassified 92 (115)
. Unrealized gains (losses) that would have been recognized in equity if the assets had not been reclassified (146) 64
. Profit (loss) recognized through profit or loss related to reclassified assets 62 49
NOTE 12 - DEBT SECURITIES
31.12.2016 31.12.2015
Certificates of deposit 950 1,054
Interbank market securities and negotiable debt securities 69,470 59,754
Bonds 59,488 63,564
Accrued interest 1,770 1,737
Total 131,678 126,109
NOTE 13 - TAxES
31.12.2016 31.12.2015
Current tax assets (through profit or loss) 1,986 1,529
Current tax liabilities (through profit or loss) 965 927
13A - CURRENT TAxES
NOTE 14 - ACCRUAL ACCOUNTS AND OTHER ASSETS AND LIABILITIES
14A - PREPAYMENTS, ACCRUED INCOME AND OThER ASSETS
31.12.2016 31.12.2015
Deferred tax assets (through profit or loss) 1,376 1,161
Deferred tax assets (through equity) 188 187
Deferred tax liabilities (through profit or loss) 697 592
Deferred tax liabilities (through equity) 839 739
13B - DEFERRED TAxES
Breakdown of deferred taxes by main category
31.12.2016 31.12.2015Assets Liabilities Assets Liabilities
. Tax losses carried forward 21 0 10 0
. Temporary differences 1,946 1,939 2,009 2,002
- Deferred capital gains or losses on available-for-sale securities 178 877 180 778
- Other unrealized or deferred gains or losses 49 0 47 0
- Provisions 828 6 744 8
- Hidden finance leasing reserve 0 293 1 261
- Earnings of tax-transparent entities 0 0 0 0
- Other temporary differences 891 763 1,037 955
. Offsetting (403) (403) (671) (671)
- to equity (39) (39) (40) (40)
- to profit or loss (364) (364) (631) (631)
Total deferred tax assets and liabilities 1,564 1,536 1,348 1,331
Deferred tax is calculated using the liability method at a rate of 34.43%.
31.12.2016 31.12.2015
Prepayments and accrued income Securities collection accounts 930 668
Currency adjustment accounts 1,021 658
Accrued income 661 547
Misc. accruals 2,455 4,357
Subtotal 5,067 6,230
Other assets Settlement accounts on securities transactions 213 205
Guarantee deposits paid 7,117 6,550
Other debtors 5,307 4,887
Inventories and similar 30 35
Other 42 30
Subtotal 12,709 11,707
Other assets of insurance companies Technical reserves - Reinsurers’ share 422 391
Other 141 130
Subtotal 563 521
Total 18,339 18,458
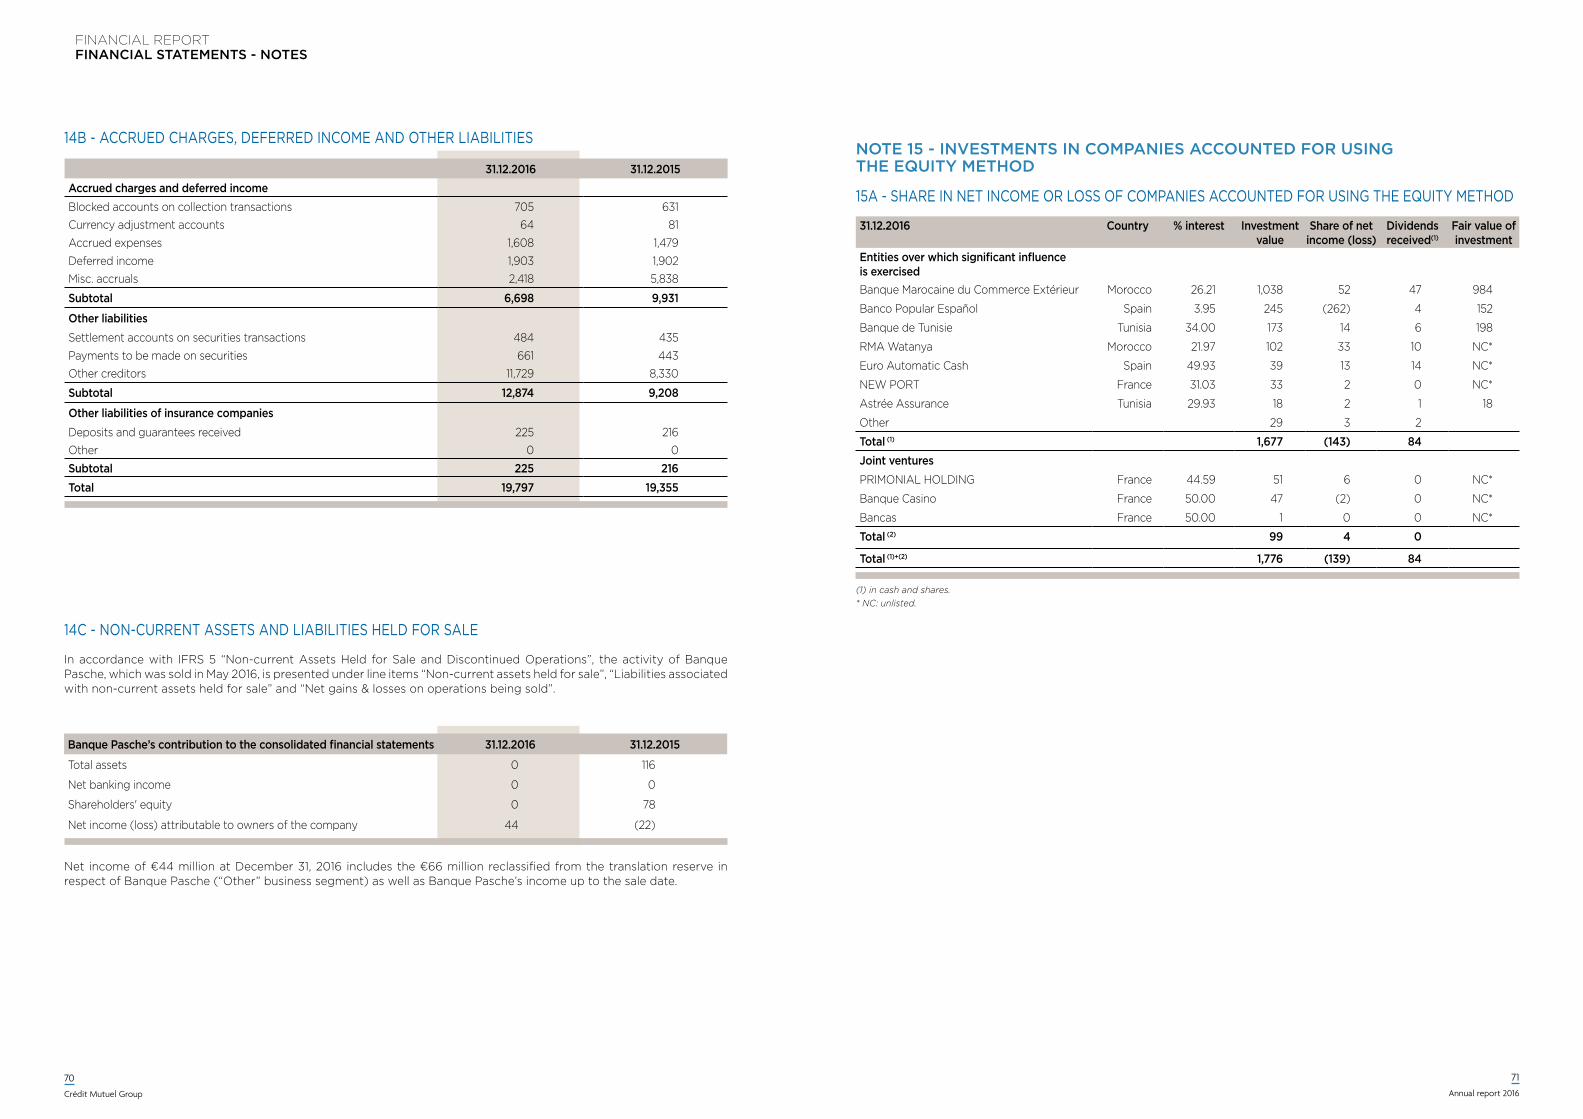
FINANCIAL REPORTFINANCIAL STATEMENTS - NOTES
70
Crédit Mutuel Group
71
Annual report 2016
14B - ACCRUED ChARGES, DEFERRED INCOME AND OThER LIABILITIES
31.12.2016 31.12.2015Accrued charges and deferred income Blocked accounts on collection transactions 705 631Currency adjustment accounts 64 81Accrued expenses 1,608 1,479Deferred income 1,903 1,902Misc. accruals 2,418 5,838
Subtotal 6,698 9,931
Other liabilities Settlement accounts on securities transactions 484 435Payments to be made on securities 661 443Other creditors 11,729 8,330
Subtotal 12,874 9,208
Other liabilities of insurance companies Deposits and guarantees received 225 216Other 0 0
Subtotal 225 216Total 19,797 19,355
14C - NON-CURRENT ASSETS AND LIABILITIES hELD FOR SALE
In accordance with IFRS 5 “Non-current Assets Held for Sale and Discontinued Operations”, the activity of Banque Pasche, which was sold in May 2016, is presented under line items “Non-current assets held for sale”, “Liabilities associated with non-current assets held for sale” and “Net gains & losses on operations being sold”.
NOTE 15 - INvESTMENTS IN COMPANIES ACCOUNTED FOR USING THE EqUITy METHOD
15A - ShARE IN NET INCOME OR LOSS OF COMPANIES ACCOUNTED FOR USING ThE EQUITY METhOD
Banque Pasche’s contribution to the consolidated financial statements 31.12.2016 31.12.2015
Total assets 0 116
Net banking income 0 0
Shareholders' equity 0 78
Net income (loss) attributable to owners of the company 44 (22)
Net income of €44 million at December 31, 2016 includes the €66 million reclassified from the translation reserve in respect of Banque Pasche (“Other” business segment) as well as Banque Pasche’s income up to the sale date.
31.12.2016 Country % interest Investment value
Share of net income (loss)
Dividends received(1)
Fair value of investment
Entities over which significant influence is exercised
Banque Marocaine du Commerce Extérieur Morocco 26.21 1,038 52 47 984
Banco Popular Español Spain 3.95 245 (262) 4 152
Banque de Tunisie Tunisia 34.00 173 14 6 198
RMA Watanya Morocco 21.97 102 33 10 NC*
Euro Automatic Cash Spain 49.93 39 13 14 NC*
NEW PORT France 31.03 33 2 0 NC*
Astrée Assurance Tunisia 29.93 18 2 1 18
Other 29 3 2
Total (1) 1,677 (143) 84Joint ventures
PRIMONIAL HOLDING France 44.59 51 6 0 NC*
Banque Casino France 50.00 47 (2) 0 NC*
Bancas France 50.00 1 0 0 NC*
Total (2) 99 4 0
Total (1)+(2) 1,776 (139) 84
(1) in cash and shares.* NC: unlisted.
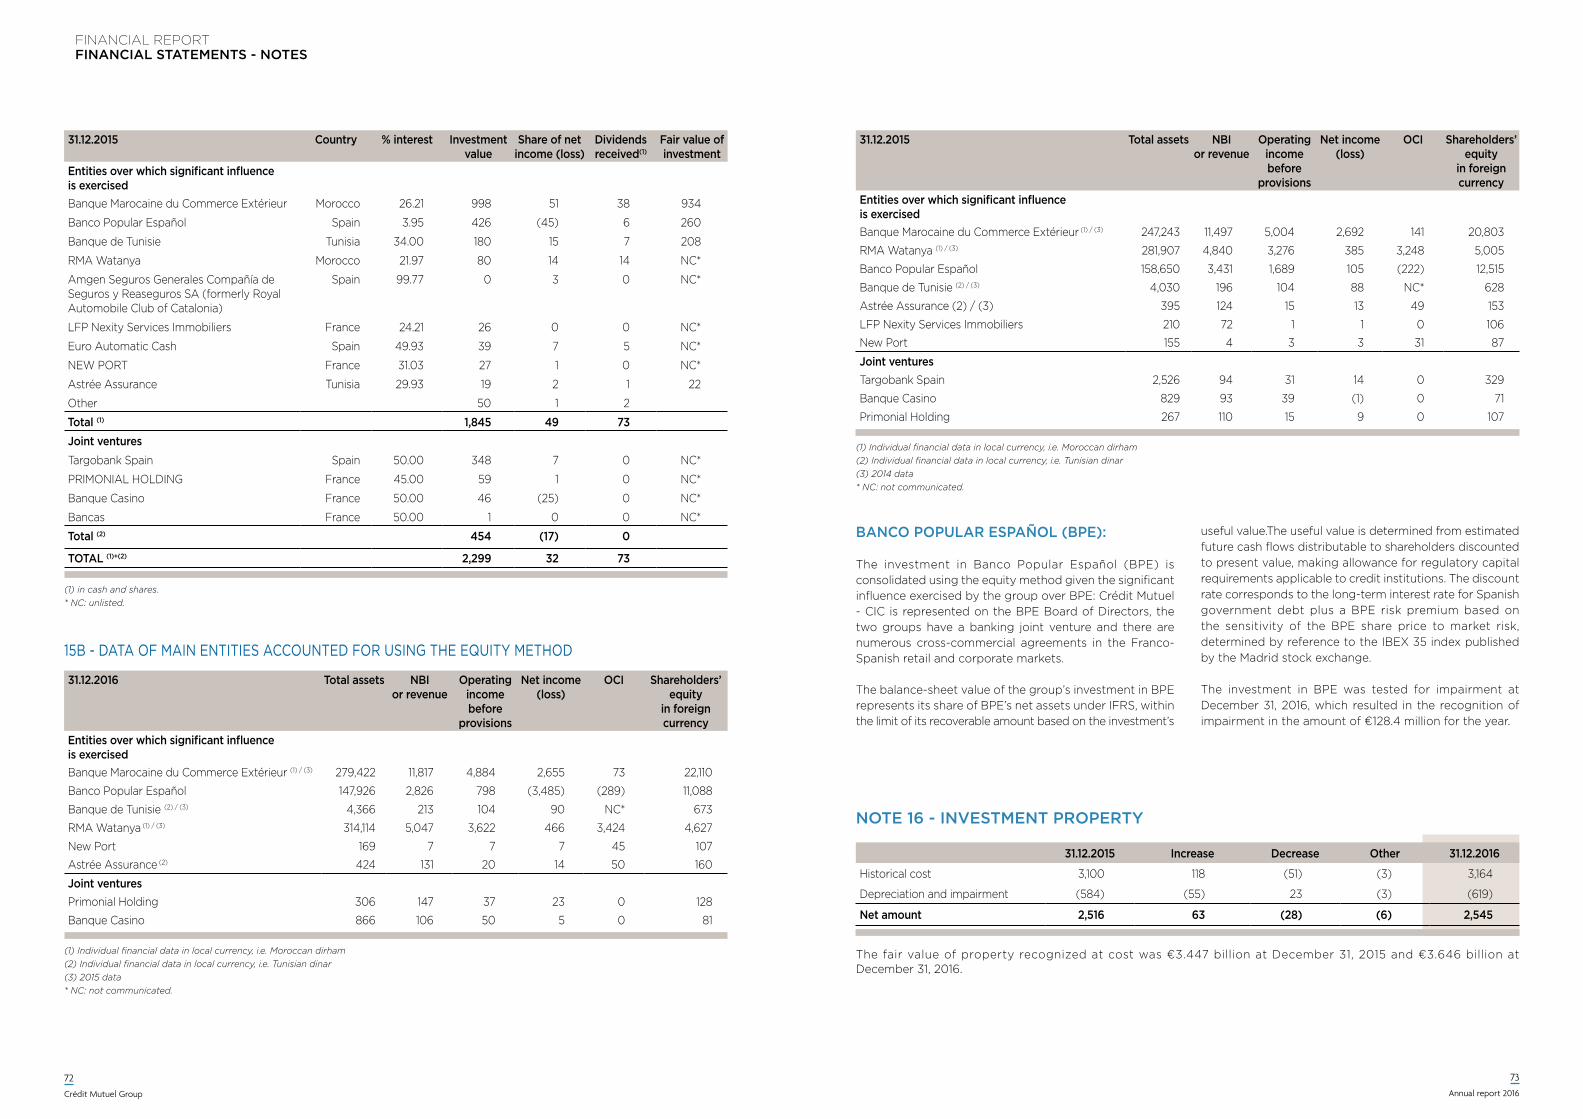
FINANCIAL REPORTFINANCIAL STATEMENTS - NOTES
72
Crédit Mutuel Group
73
Annual report 2016
15B - DATA OF MAIN ENTITIES ACCOUNTED FOR USING ThE EQUITY METhOD
31.12.2016 Total assets NBI or revenue
Operating income before
provisions
Net income (loss)
OCI Shareholders’ equity
in foreign currency
Entities over which significant influence is exercised
Banque Marocaine du Commerce Extérieur (1) / (3) 279,422 11,817 4,884 2,655 73 22,110
Banco Popular Español 147,926 2,826 798 (3,485) (289) 11,088
Banque de Tunisie (2) / (3) 4,366 213 104 90 NC* 673
RMA Watanya (1) / (3) 314,114 5,047 3,622 466 3,424 4,627
New Port 169 7 7 7 45 107
Astrée Assurance (2) 424 131 20 14 50 160
Joint ventures Primonial Holding 306 147 37 23 0 128
Banque Casino 866 106 50 5 0 81
(1) Individual financial data in local currency, i.e. Moroccan dirham(2) Individual financial data in local currency, i.e. Tunisian dinar(3) 2015 data* NC: not communicated.
BANCO POPULAR ESPAñOL (BPE):
The investment in Banco Popular Español (BPE) is consolidated using the equity method given the significant influence exercised by the group over BPE: Crédit Mutuel - CIC is represented on the BPE Board of Directors, the two groups have a banking joint venture and there are numerous cross-commercial agreements in the Franco-Spanish retail and corporate markets.
The balance-sheet value of the group’s investment in BPE represents its share of BPE’s net assets under IFRS, within the limit of its recoverable amount based on the investment’s
useful value.The useful value is determined from estimated future cash flows distributable to shareholders discounted to present value, making allowance for regulatory capital requirements applicable to credit institutions. The discount rate corresponds to the long-term interest rate for Spanish government debt plus a BPE risk premium based on the sensitivity of the BPE share price to market risk, determined by reference to the IBEX 35 index published by the Madrid stock exchange.
The investment in BPE was tested for impairment at December 31, 2016, which resulted in the recognition of impairment in the amount of €128.4 million for the year.
NOTE 16 - INvESTMENT PROPERTy
31.12.2015 Increase Decrease Other 31.12.2016
Historical cost 3,100 118 (51) (3) 3,164
Depreciation and impairment (584) (55) 23 (3) (619)
Net amount 2,516 63 (28) (6) 2,545
The fair value of property recognized at cost was €3.447 billion at December 31, 2015 and €3.646 billion at December 31, 2016.
31.12.2015 Country % interest Investment value
Share of net income (loss)
Dividends received(1)
Fair value of investment
Entities over which significant influence is exercised
Banque Marocaine du Commerce Extérieur Morocco 26.21 998 51 38 934
Banco Popular Español Spain 3.95 426 (45) 6 260
Banque de Tunisie Tunisia 34.00 180 15 7 208
RMA Watanya Morocco 21.97 80 14 14 NC*
Amgen Seguros Generales Compañía de Seguros y Reaseguros SA (formerly Royal Automobile Club of Catalonia)
Spain 99.77 0 3 0 NC*
LFP Nexity Services Immobiliers France 24.21 26 0 0 NC*
Euro Automatic Cash Spain 49.93 39 7 5 NC*
NEW PORT France 31.03 27 1 0 NC*
Astrée Assurance Tunisia 29.93 19 2 1 22
Other 50 1 2
Total (1) 1,845 49 73 Joint ventures
Targobank Spain Spain 50.00 348 7 0 NC*
PRIMONIAL HOLDING France 45.00 59 1 0 NC*
Banque Casino France 50.00 46 (25) 0 NC*
Bancas France 50.00 1 0 0 NC*
Total (2) 454 (17) 0 TOTAL (1)+(2) 2,299 32 73
(1) in cash and shares.* NC: unlisted.
31.12.2015 Total assets NBI or revenue
Operating income before
provisions
Net income (loss)
OCI Shareholders’ equity
in foreign currency
Entities over which significant influence is exercised
Banque Marocaine du Commerce Extérieur (1) / (3) 247,243 11,497 5,004 2,692 141 20,803
RMA Watanya (1) / (3) 281,907 4,840 3,276 385 3,248 5,005
Banco Popular Español 158,650 3,431 1,689 105 (222) 12,515
Banque de Tunisie (2) / (3) 4,030 196 104 88 NC* 628
Astrée Assurance (2) / (3) 395 124 15 13 49 153
LFP Nexity Services Immobiliers 210 72 1 1 0 106
New Port 155 4 3 3 31 87
Joint ventures Targobank Spain 2,526 94 31 14 0 329
Banque Casino 829 93 39 (1) 0 71
Primonial Holding 267 110 15 9 0 107
(1) Individual financial data in local currency, i.e. Moroccan dirham(2) Individual financial data in local currency, i.e. Tunisian dinar(3) 2014 data* NC: not communicated.
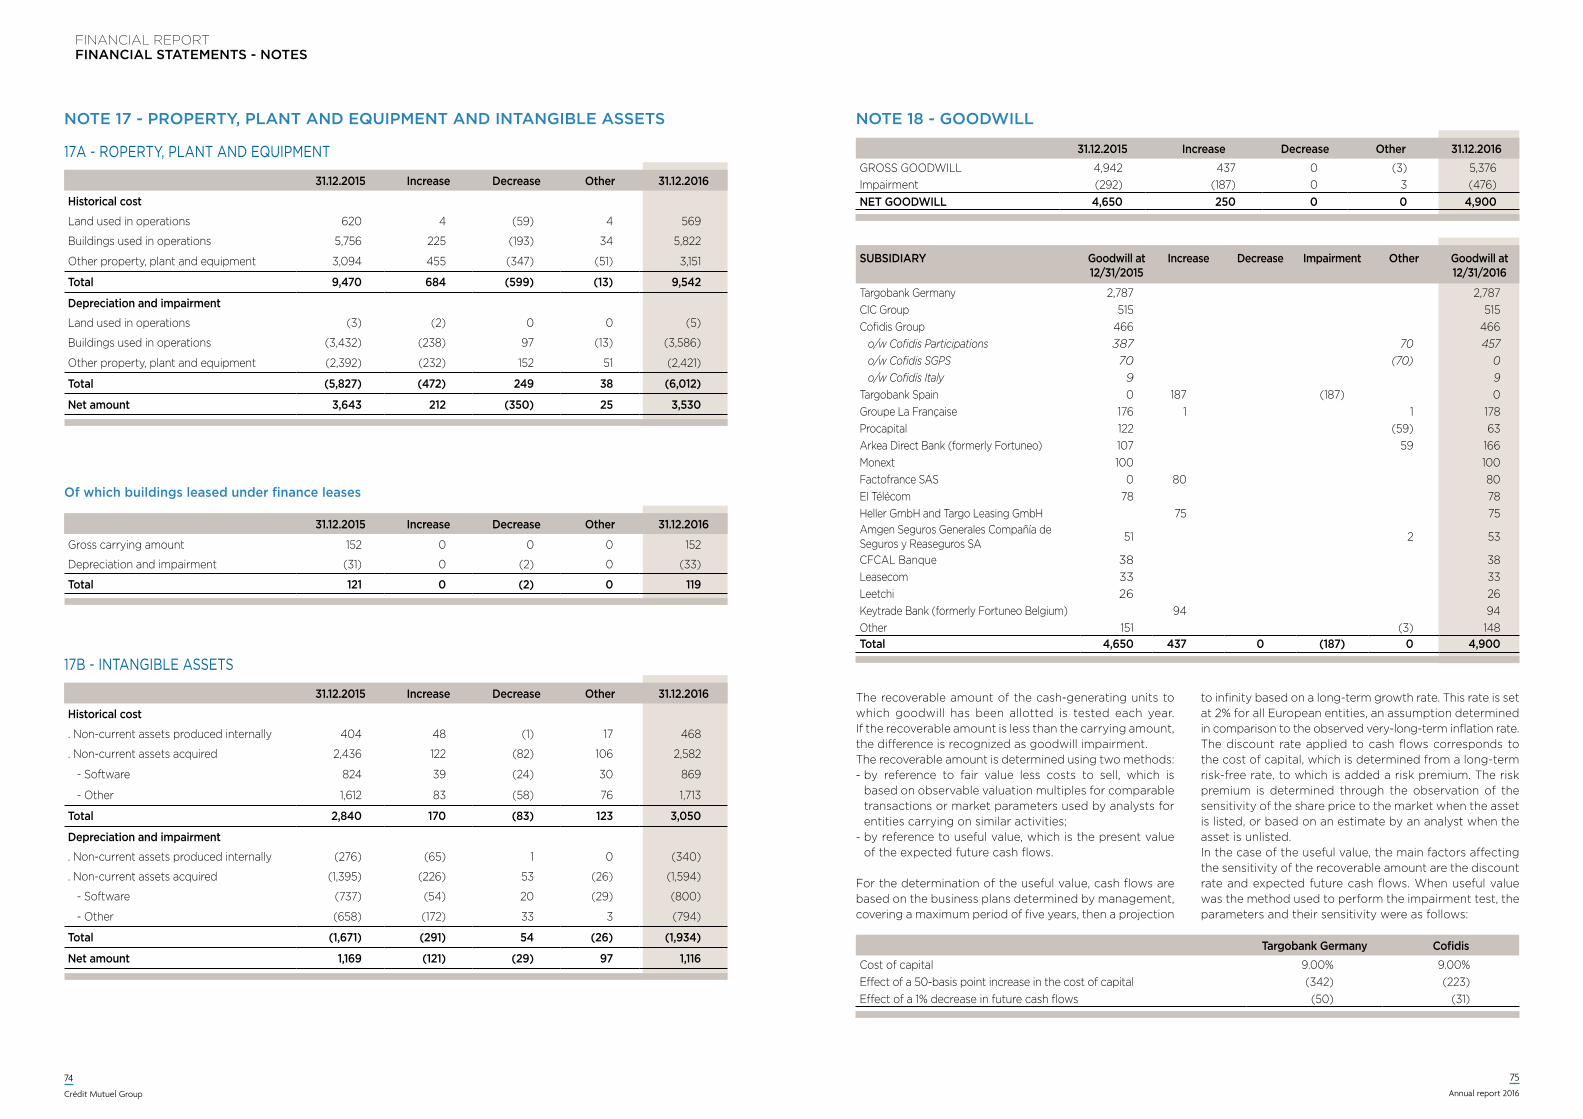
FINANCIAL REPORTFINANCIAL STATEMENTS - NOTES
74
Crédit Mutuel Group
75
Annual report 2016
17B - INTANGIBLE ASSETS
31.12.2015 Increase Decrease Other 31.12.2016
Historical cost
. Non-current assets produced internally 404 48 (1) 17 468
. Non-current assets acquired 2,436 122 (82) 106 2,582
- Software 824 39 (24) 30 869
- Other 1,612 83 (58) 76 1,713
Total 2,840 170 (83) 123 3,050
Depreciation and impairment
. Non-current assets produced internally (276) (65) 1 0 (340)
. Non-current assets acquired (1,395) (226) 53 (26) (1,594)
- Software (737) (54) 20 (29) (800)
- Other (658) (172) 33 3 (794)
Total (1,671) (291) 54 (26) (1,934)
Net amount 1,169 (121) (29) 97 1,116
31.12.2015 Increase Decrease Other 31.12.2016
Gross carrying amount 152 0 0 0 152
Depreciation and impairment (31) 0 (2) 0 (33)
Total 121 0 (2) 0 119
Of which buildings leased under finance leases
NOTE 17 - PROPERTy, PLANT AND EqUIPMENT AND INTANGIBLE ASSETS
17A - ROPERTY, PLANT AND EQUIPMENT
31.12.2015 Increase Decrease Other 31.12.2016
Historical cost
Land used in operations 620 4 (59) 4 569
Buildings used in operations 5,756 225 (193) 34 5,822
Other property, plant and equipment 3,094 455 (347) (51) 3,151
Total 9,470 684 (599) (13) 9,542
Depreciation and impairment
Land used in operations (3) (2) 0 0 (5)
Buildings used in operations (3,432) (238) 97 (13) (3,586)
Other property, plant and equipment (2,392) (232) 152 51 (2,421)
Total (5,827) (472) 249 38 (6,012)
Net amount 3,643 212 (350) 25 3,530
NOTE 18 - GOODwILL
31.12.2015 Increase Decrease Other 31.12.2016Gross Goodwill 4,942 437 0 (3) 5,376impairment (292) (187) 0 3 (476)Net gOODwIll 4,650 250 0 0 4,900
SubSidiary Goodwill at 12/31/2015
increase decrease impairment Other Goodwill at 12/31/2016
Targobank Germany 2,787 2,787CIC Group 515 515Cofidis Group 466 466 o/w Cofidis Participations 387 70 457 o/w Cofidis SGPS 70 (70) 0 o/w Cofidis Italy 9 9Targobank Spain 0 187 (187) 0Groupe La Française 176 1 1 178Procapital 122 (59) 63Arkea Direct Bank (formerly Fortuneo) 107 59 166Monext 100 100Factofrance SAS 0 80 80EI Télécom 78 78Heller GmbH and Targo Leasing GmbH 75 75Amgen Seguros Generales Compañía de Seguros y Reaseguros SA 51 2 53
CFCAL Banque 38 38Leasecom 33 33Leetchi 26 26Keytrade Bank (formerly Fortuneo Belgium) 94 94Other 151 (3) 148Total 4,650 437 0 (187) 0 4,900
Targobank Germany CofidisCost of capital 9.00% 9.00%Effect of a 50-basis point increase in the cost of capital (342) (223)Effect of a 1% decrease in future cash flows (50) (31)
The recoverable amount of the cash-generating units to which goodwill has been allotted is tested each year. If the recoverable amount is less than the carrying amount, the difference is recognized as goodwill impairment.The recoverable amount is determined using two methods:- by reference to fair value less costs to sell, which is
based on observable valuation multiples for comparable transactions or market parameters used by analysts for entities carrying on similar activities;
- by reference to useful value, which is the present value of the expected future cash flows.
For the determination of the useful value, cash flows are based on the business plans determined by management, covering a maximum period of five years, then a projection
to infinity based on a long-term growth rate. This rate is set at 2% for all European entities, an assumption determined in comparison to the observed very-long-term inflation rate.The discount rate applied to cash flows corresponds to the cost of capital, which is determined from a long-term risk-free rate, to which is added a risk premium. The risk premium is determined through the observation of the sensitivity of the share price to the market when the asset is listed, or based on an estimate by an analyst when the asset is unlisted.In the case of the useful value, the main factors affecting the sensitivity of the recoverable amount are the discount rate and expected future cash flows. When useful value was the method used to perform the impairment test, the parameters and their sensitivity were as follows:
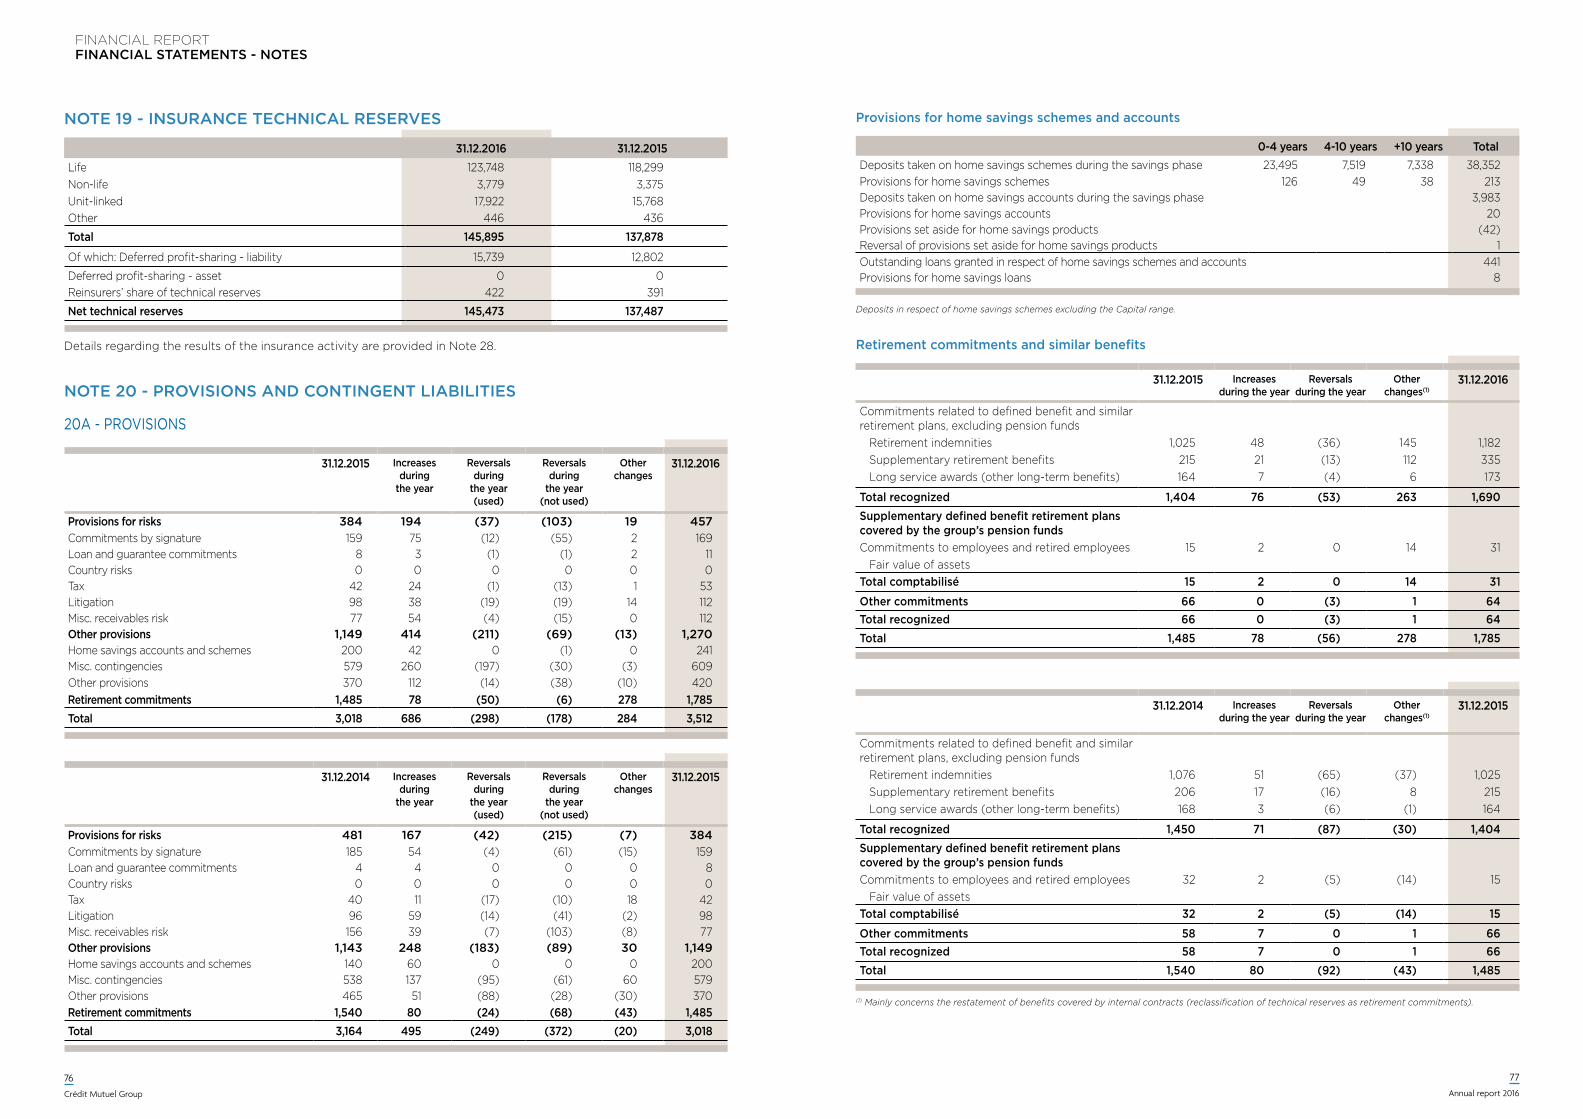
FINANCIAL REPORTFINANCIAL STATEMENTS - NOTES
76
Crédit Mutuel Group
77
Annual report 2016
NOTE 19 - INSURANCE TECHNICAL RESERvES
31.12.2016 31.12.2015Life 123,748 118,299Non-life 3,779 3,375Unit-linked 17,922 15,768Other 446 436
Total 145,895 137,878
Of which: Deferred profit-sharing - liability 15,739 12,802
Deferred profit-sharing - asset 0 0Reinsurers’ share of technical reserves 422 391
Net technical reserves 145,473 137,487
Details regarding the results of the insurance activity are provided in Note 28.
NOTE 20 - PROvISIONS AND CONTINGENT LIABILITIES
20A - PROVISIONS
31.12.2015 Increases during
the year
Reversals during
the year (used)
Reversals during
the year (not used)
Other changes
31.12.2016
Provisions for risks 384 194 (37) (103) 19 457Commitments by signature 159 75 (12) (55) 2 169Loan and guarantee commitments 8 3 (1) (1) 2 11Country risks 0 0 0 0 0 0Tax 42 24 (1) (13) 1 53Litigation 98 38 (19) (19) 14 112Misc. receivables risk 77 54 (4) (15) 0 112Other provisions 1,149 414 (211) (69) (13) 1,270Home savings accounts and schemes 200 42 0 (1) 0 241Misc. contingencies 579 260 (197) (30) (3) 609Other provisions 370 112 (14) (38) (10) 420Retirement commitments 1,485 78 (50) (6) 278 1,785Total 3,018 686 (298) (178) 284 3,512
31.12.2014 Increases during
the year
Reversals during
the year (used)
Reversals during
the year (not used)
Other changes
31.12.2015
Provisions for risks 481 167 (42) (215) (7) 384Commitments by signature 185 54 (4) (61) (15) 159Loan and guarantee commitments 4 4 0 0 0 8Country risks 0 0 0 0 0 0Tax 40 11 (17) (10) 18 42Litigation 96 59 (14) (41) (2) 98Misc. receivables risk 156 39 (7) (103) (8) 77Other provisions 1,143 248 (183) (89) 30 1,149Home savings accounts and schemes 140 60 0 0 0 200Misc. contingencies 538 137 (95) (61) 60 579Other provisions 465 51 (88) (28) (30) 370Retirement commitments 1,540 80 (24) (68) (43) 1,485Total 3,164 495 (249) (372) (20) 3,018
Provisions for home savings schemes and accounts
0-4 years 4-10 years +10 years TotalDeposits taken on home savings schemes during the savings phase 23,495 7,519 7,338 38,352Provisions for home savings schemes 126 49 38 213Deposits taken on home savings accounts during the savings phase 3,983Provisions for home savings accounts 20Provisions set aside for home savings products (42)Reversal of provisions set aside for home savings products 1Outstanding loans granted in respect of home savings schemes and accounts 441Provisions for home savings loans 8
Retirement commitments and similar benefits
31.12.2015 Increases during the year
Reversals during the year
Other changes(1)
31.12.2016
Commitments related to defined benefit and similar retirement plans, excluding pension funds Retirement indemnities 1,025 48 (36) 145 1,182 Supplementary retirement benefits 215 21 (13) 112 335 Long service awards (other long-term benefits) 164 7 (4) 6 173
Total recognized 1,404 76 (53) 263 1,690Supplementary defined benefit retirement plans covered by the group’s pension fundsCommitments to employees and retired employees 15 2 0 14 31 Fair value of assetsTotal comptabilisé 15 2 0 14 31
Other commitments 66 0 (3) 1 64Total recognized 66 0 (3) 1 64Total 1,485 78 (56) 278 1,785
31.12.2014 Increases during the year
Reversals during the year
Other changes(1)
31.12.2015
Commitments related to defined benefit and similar retirement plans, excluding pension funds Retirement indemnities 1,076 51 (65) (37) 1,025 Supplementary retirement benefits 206 17 (16) 8 215 Long service awards (other long-term benefits) 168 3 (6) (1) 164
Total recognized 1,450 71 (87) (30) 1,404Supplementary defined benefit retirement plans covered by the group’s pension fundsCommitments to employees and retired employees 32 2 (5) (14) 15 Fair value of assetsTotal comptabilisé 32 2 (5) (14) 15
Other commitments 58 7 0 1 66Total recognized 58 7 0 1 66Total 1,540 80 (92) (43) 1,485
(1) Mainly concerns the restatement of benefits covered by internal contracts (reclassification of technical reserves as retirement commitments).
Deposits in respect of home savings schemes excluding the Capital range.
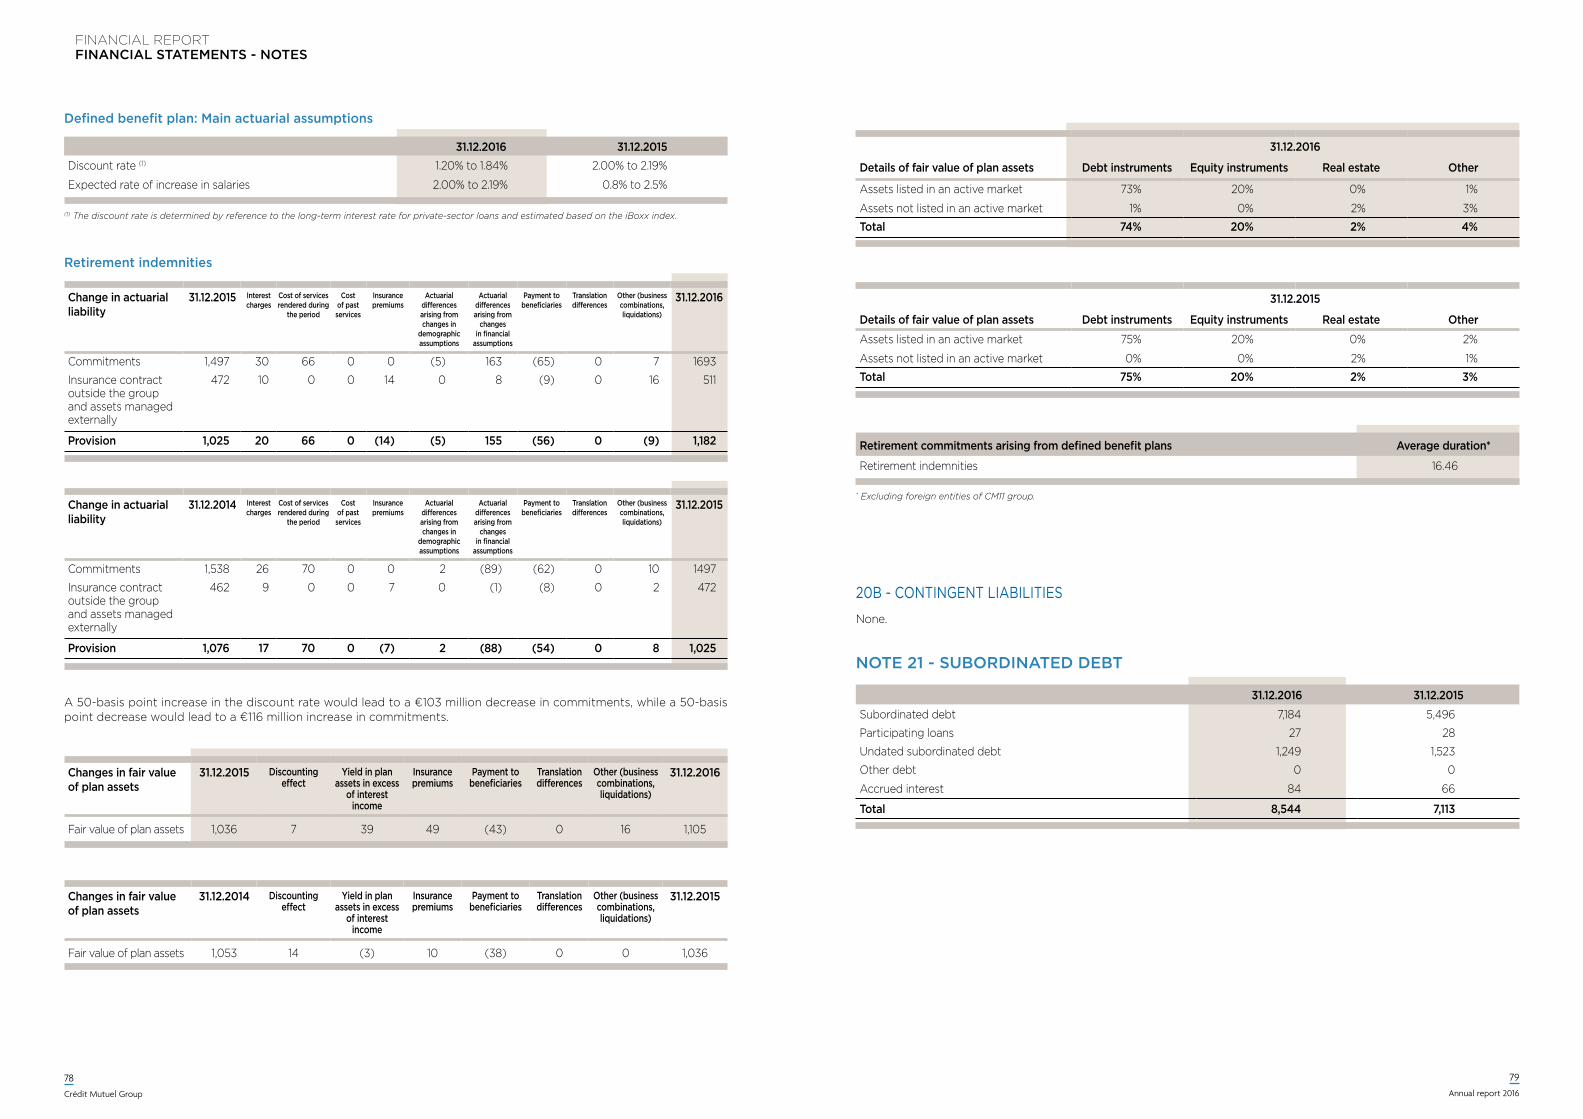
FINANCIAL REPORTFINANCIAL STATEMENTS - NOTES
78
Crédit Mutuel Group
79
Annual report 2016
Defined benefit plan: Main actuarial assumptions
31.12.2016 31.12.2015Discount rate (1) 1.20% to 1.84% 2.00% to 2.19%
Expected rate of increase in salaries 2.00% to 2.19% 0.8% to 2.5%
(1) The discount rate is determined by reference to the long-term interest rate for private-sector loans and estimated based on the iBoxx index.
Retirement indemnities
Change in actuarial liability
31.12.2015 Interest charges
Cost of services rendered during
the period
Cost of past services
Insurance premiums
Actuarial differences arising from changes in
demographic assumptions
Actuarial differences arising from
changes in financial
assumptions
Payment to beneficiaries
Translation differences
Other (business combinations, liquidations)
31.12.2016
Commitments 1,497 30 66 0 0 (5) 163 (65) 0 7 1693
Insurance contract outside the group and assets managed externally
472 10 0 0 14 0 8 (9) 0 16 511
Provision 1,025 20 66 0 (14) (5) 155 (56) 0 (9) 1,182
Change in actuarial liability
31.12.2014 Interest charges
Cost of services rendered during
the period
Cost of past services
Insurance premiums
Actuarial differences arising from changes in
demographic assumptions
Actuarial differences arising from
changes in financial
assumptions
Payment to beneficiaries
Translation differences
Other (business combinations, liquidations)
31.12.2015
Commitments 1,538 26 70 0 0 2 (89) (62) 0 10 1497
Insurance contract outside the group and assets managed externally
462 9 0 0 7 0 (1) (8) 0 2 472
Provision 1,076 17 70 0 (7) 2 (88) (54) 0 8 1,025
A 50-basis point increase in the discount rate would lead to a €103 million decrease in commitments, while a 50-basis point decrease would lead to a €116 million increase in commitments.
Changes in fair value of plan assets
31.12.2015 Discounting effect
Yield in plan assets in excess
of interest income
Insurance premiums
Payment to beneficiaries
Translation differences
Other (business combinations, liquidations)
31.12.2016
Fair value of plan assets 1,036 7 39 49 (43) 0 16 1,105
Changes in fair value of plan assets
31.12.2014 Discounting effect
Yield in plan assets in excess
of interest income
Insurance premiums
Payment to beneficiaries
Translation differences
Other (business combinations, liquidations)
31.12.2015
Fair value of plan assets 1,053 14 (3) 10 (38) 0 0 1,036
31.12.2016
Details of fair value of plan assets Debt instruments Equity instruments Real estate Other
Assets listed in an active market 73% 20% 0% 1%
Assets not listed in an active market 1% 0% 2% 3%
Total 74% 20% 2% 4%
31.12.2015
Details of fair value of plan assets Debt instruments Equity instruments Real estate Other
Assets listed in an active market 75% 20% 0% 2%
Assets not listed in an active market 0% 0% 2% 1%
Total 75% 20% 2% 3%
Retirement commitments arising from defined benefit plans Average duration*
Retirement indemnities 16.46
* Excluding foreign entities of CM11 group.
20B - CONTINGENT LIABILITIES
None.
NOTE 21 - SUBORDINATED DEBT
31.12.2016 31.12.2015Subordinated debt 7,184 5,496
Participating loans 27 28
Undated subordinated debt 1,249 1,523
Other debt 0 0
Accrued interest 84 66
Total 8,544 7,113
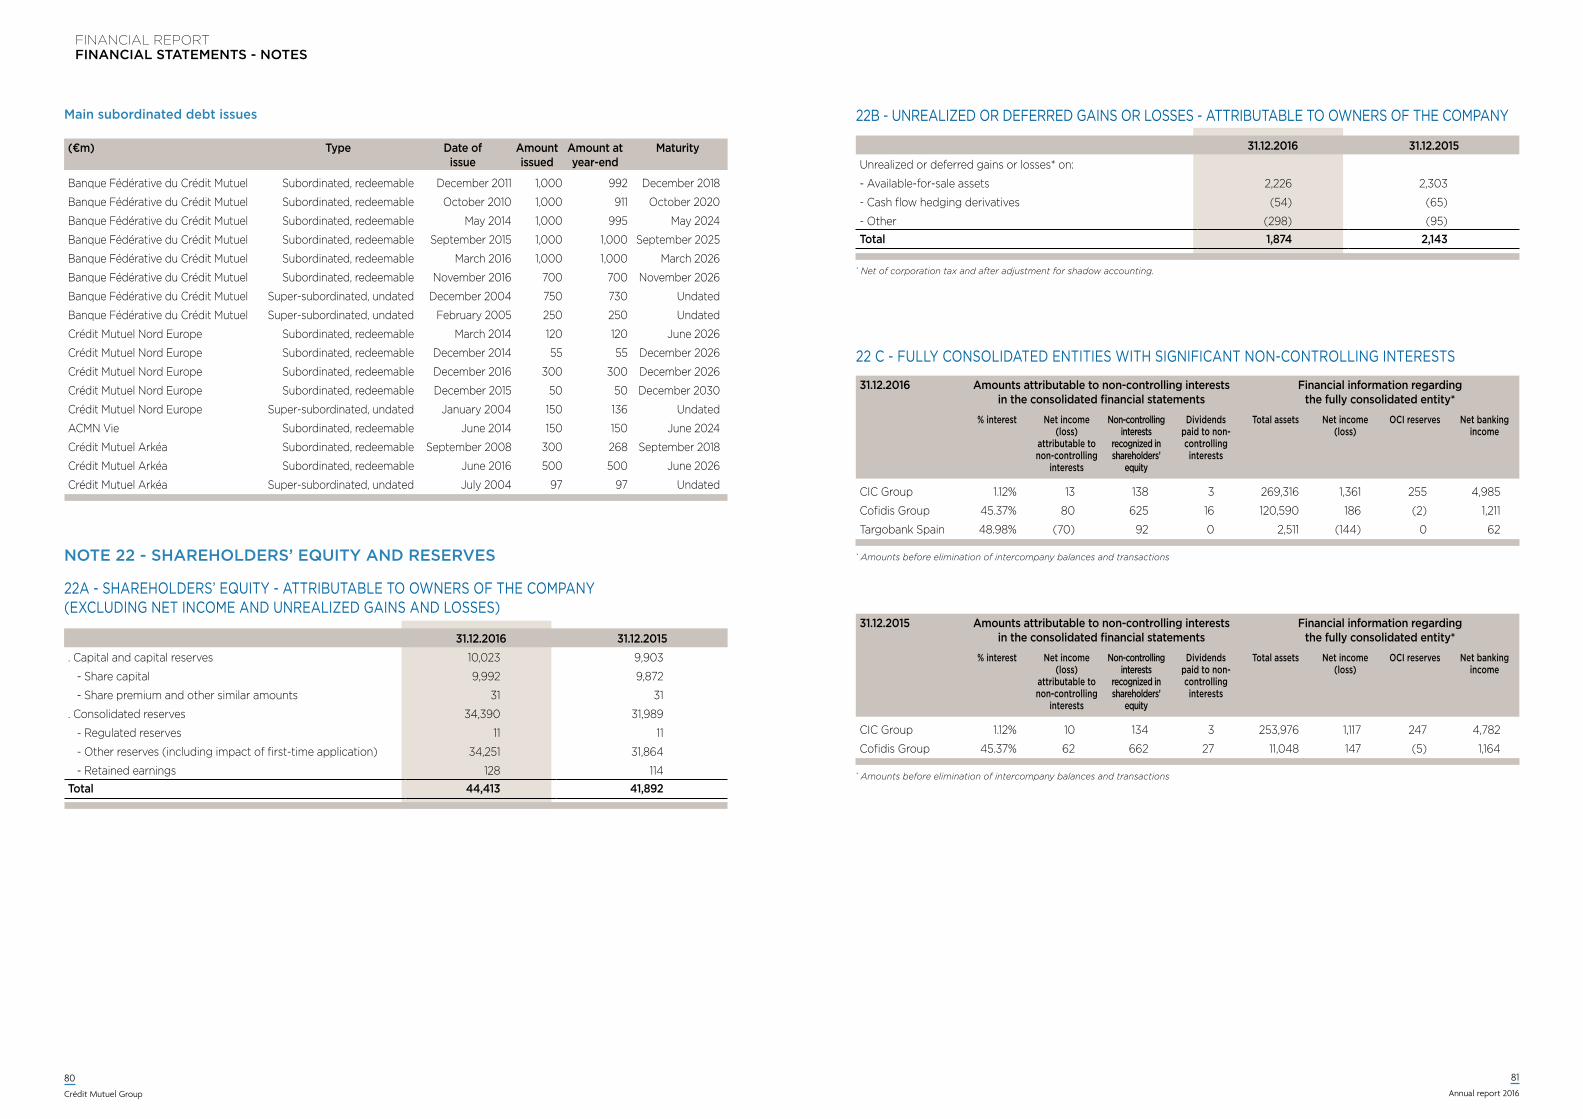
FINANCIAL REPORTFINANCIAL STATEMENTS - NOTES
80
Crédit Mutuel Group
81
Annual report 2016
Main subordinated debt issues
(€m) Type Date of issue
Amount issued
Amount at year-end
Maturity
Banque Fédérative du Crédit Mutuel Subordinated, redeemable December 2011 1,000 992 December 2018
Banque Fédérative du Crédit Mutuel Subordinated, redeemable October 2010 1,000 911 October 2020
Banque Fédérative du Crédit Mutuel Subordinated, redeemable May 2014 1,000 995 May 2024
Banque Fédérative du Crédit Mutuel Subordinated, redeemable September 2015 1,000 1,000 September 2025
Banque Fédérative du Crédit Mutuel Subordinated, redeemable March 2016 1,000 1,000 March 2026
Banque Fédérative du Crédit Mutuel Subordinated, redeemable November 2016 700 700 November 2026
Banque Fédérative du Crédit Mutuel Super-subordinated, undated December 2004 750 730 Undated
Banque Fédérative du Crédit Mutuel Super-subordinated, undated February 2005 250 250 Undated
Crédit Mutuel Nord Europe Subordinated, redeemable March 2014 120 120 June 2026
Crédit Mutuel Nord Europe Subordinated, redeemable December 2014 55 55 December 2026
Crédit Mutuel Nord Europe Subordinated, redeemable December 2016 300 300 December 2026
Crédit Mutuel Nord Europe Subordinated, redeemable December 2015 50 50 December 2030
Crédit Mutuel Nord Europe Super-subordinated, undated January 2004 150 136 Undated
ACMN Vie Subordinated, redeemable June 2014 150 150 June 2024
Crédit Mutuel Arkéa Subordinated, redeemable September 2008 300 268 September 2018
Crédit Mutuel Arkéa Subordinated, redeemable June 2016 500 500 June 2026
Crédit Mutuel Arkéa Super-subordinated, undated July 2004 97 97 Undated
NOTE 22 - SHAREHOLDERS’ EqUITy AND RESERvES
22A - ShAREhOLDERS’ EQUITY - ATTRIBUTABLE TO OwNERS OF ThE COMPANY (ExCLUDING NET INCOME AND UNREALIzED GAINS AND LOSSES)
31.12.2016 31.12.2015. Capital and capital reserves 10,023 9,903
- Share capital 9,992 9,872
- Share premium and other similar amounts 31 31
. Consolidated reserves 34,390 31,989
- Regulated reserves 11 11
- Other reserves (including impact of first-time application) 34,251 31,864
- Retained earnings 128 114Total 44,413 41,892
22B - UNREALIzED OR DEFERRED GAINS OR LOSSES - ATTRIBUTABLE TO OwNERS OF ThE COMPANY
31.12.2016 31.12.2015Unrealized or deferred gains or losses* on:
- Available-for-sale assets 2,226 2,303
- Cash flow hedging derivatives (54) (65)
- Other (298) (95)Total 1,874 2,143
* Net of corporation tax and after adjustment for shadow accounting.
31.12.2015 Amounts attributable to non-controlling interests in the consolidated financial statements
Financial information regarding the fully consolidated entity*
% interest Net income (loss)
attributable to non-controlling
interests
Non-controlling interests
recognized in shareholders’
equity
Dividends paid to non-controlling interests
Total assets Net income (loss)
OCI reserves Net banking income
CIC Group 1.12% 10 134 3 253,976 1,117 247 4,782
Cofidis Group 45.37% 62 662 27 11,048 147 (5) 1,164
* Amounts before elimination of intercompany balances and transactions
31.12.2016 Amounts attributable to non-controlling interests in the consolidated financial statements
Financial information regarding the fully consolidated entity*
% interest Net income (loss)
attributable to non-controlling
interests
Non-controlling interests
recognized in shareholders’
equity
Dividends paid to non-controlling interests
Total assets Net income (loss)
OCI reserves Net banking income
CIC Group 1.12% 13 138 3 269,316 1,361 255 4,985
Cofidis Group 45.37% 80 625 16 120,590 186 (2) 1,211
Targobank Spain 48.98% (70) 92 0 2,511 (144) 0 62
* Amounts before elimination of intercompany balances and transactions
22 C - FULLY CONSOLIDATED ENTITIES wITh SIGNIFICANT NON-CONTROLLING INTERESTS
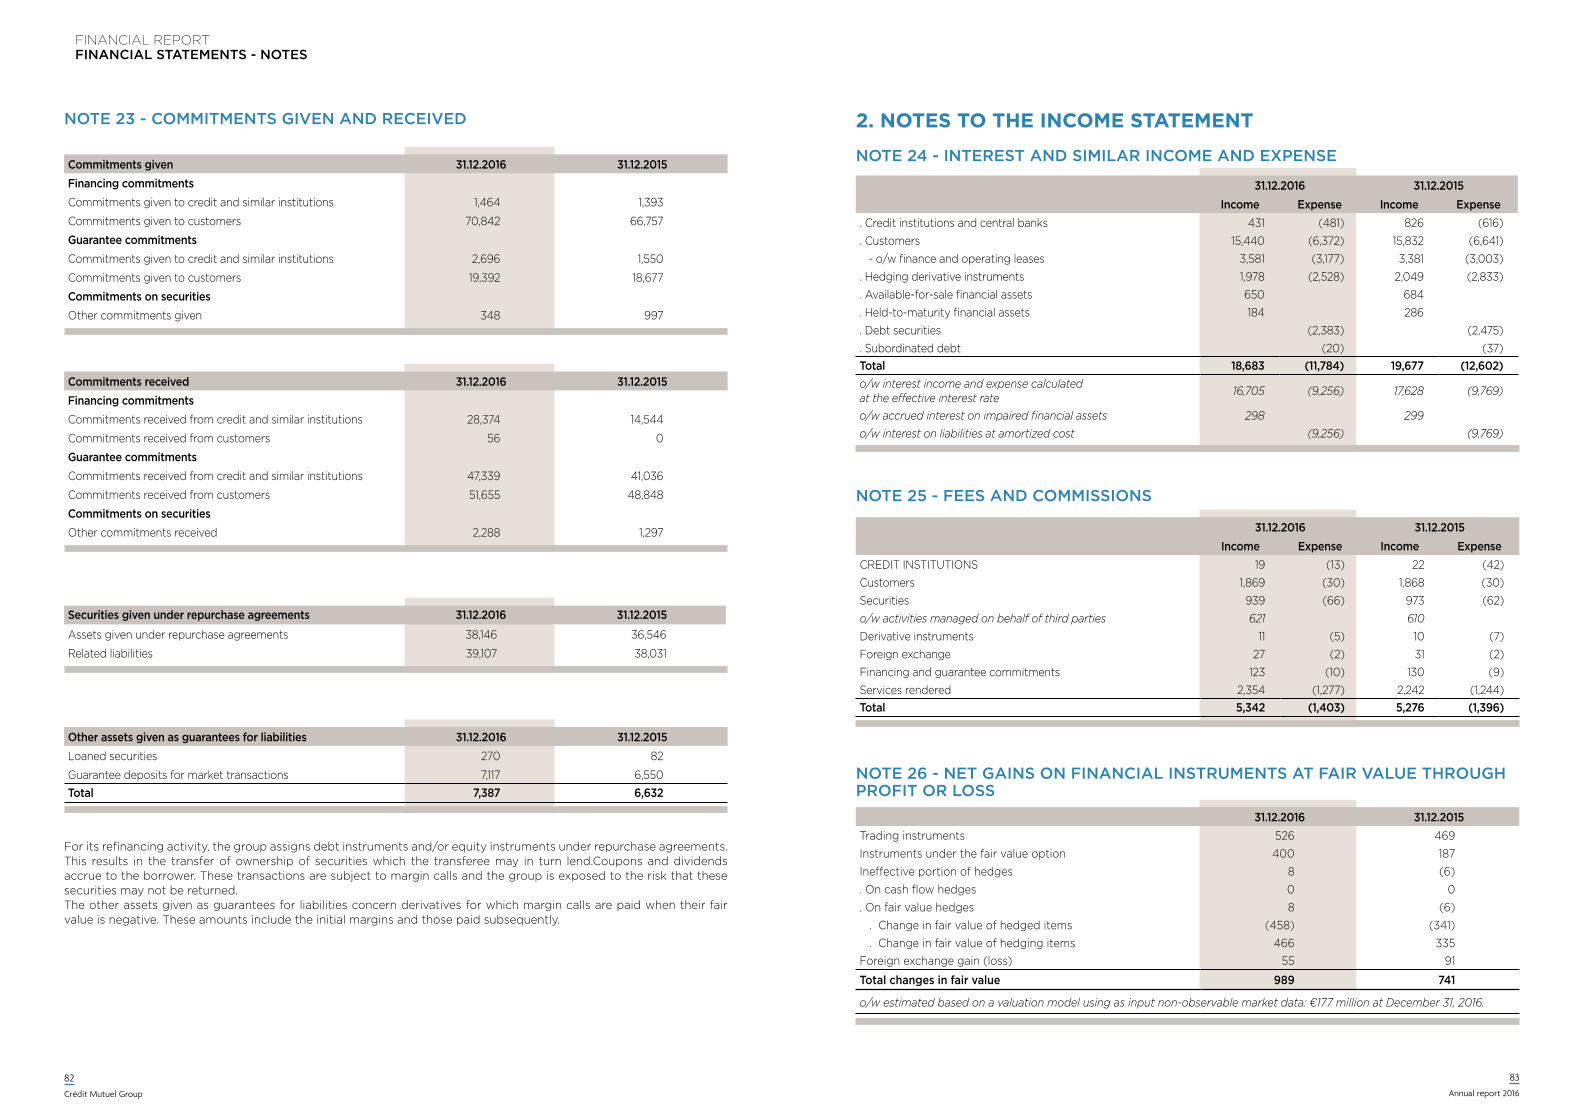
FINANCIAL REPORTFINANCIAL STATEMENTS - NOTES
82
Crédit Mutuel Group
83
Annual report 2016
NOTE 23 - COMMITMENTS GIvEN AND RECEIvED
Commitments received 31.12.2016 31.12.2015Financing commitments Commitments received from credit and similar institutions 28,374 14,544
Commitments received from customers 56 0
Guarantee commitments Commitments received from credit and similar institutions 47,339 41,036
Commitments received from customers 51,655 48,848
Commitments on securities Other commitments received 2,288 1,297
Commitments given 31.12.2016 31.12.2015Financing commitments Commitments given to credit and similar institutions 1,464 1,393
Commitments given to customers 70,842 66,757
Guarantee commitments Commitments given to credit and similar institutions 2,696 1,550
Commitments given to customers 19,392 18,677
Commitments on securities Other commitments given 348 997
Securities given under repurchase agreements 31.12.2016 31.12.2015
Assets given under repurchase agreements 38,146 36,546
Related liabilities 39,107 38,031
Other assets given as guarantees for liabilities 31.12.2016 31.12.2015Loaned securities 270 82
Guarantee deposits for market transactions 7,117 6,550Total 7,387 6,632
For its refinancing activity, the group assigns debt instruments and/or equity instruments under repurchase agreements.This results in the transfer of ownership of securities which the transferee may in turn lend.Coupons and dividends accrue to the borrower. These transactions are subject to margin calls and the group is exposed to the risk that these securities may not be returned.The other assets given as guarantees for liabilities concern derivatives for which margin calls are paid when their fair value is negative. These amounts include the initial margins and those paid subsequently.
2. noteS to tHe InCome StAtement
NOTE 24 - INTEREST AND SIMILAR INCOME AND ExPENSE
NOTE 25 - FEES AND COMMISSIONS
31.12.2016 31.12.2015Income Expense Income Expense
Credit institutions 19 (13) 22 (42)Customers 1,869 (30) 1,868 (30)securities 939 (66) 973 (62)o/w activities managed on behalf of third parties 621 610derivative instruments 11 (5) 10 (7)Foreign exchange 27 (2) 31 (2)Financing and guarantee commitments 123 (10) 130 (9)services rendered 2,354 (1,277) 2,242 (1,244)Total 5,342 (1,403) 5,276 (1,396)
NOTE 26 - NET GAINS ON FINANCIAL INSTRUMENTS AT FAIR vALUE THROUGH PROFIT OR LOSS
31.12.2016 31.12.2015Trading instruments 526 469Instruments under the fair value option 400 187Ineffective portion of hedges 8 (6). On cash flow hedges 0 0. On fair value hedges 8 (6) . Change in fair value of hedged items (458) (341) . Change in fair value of hedging items 466 335Foreign exchange gain (loss) 55 91
Total changes in fair value 989 741
o/w estimated based on a valuation model using as input non-observable market data: €177 million at December 31, 2016.
31.12.2016 31.12.2015Income Expense Income Expense
. Credit institutions and central banks 431 (481) 826 (616)
. Customers 15,440 (6,372) 15,832 (6,641) - o/w finance and operating leases 3,581 (3,177) 3,381 (3,003). Hedging derivative instruments 1,978 (2,528) 2,049 (2,833). Available-for-sale financial assets 650 684. Held-to-maturity financial assets 184 286. Debt securities (2,383) (2,475). Subordinated debt (20) (37)Total 18,683 (11,784) 19,677 (12,602)o/w interest income and expense calculated at the effective interest rate 16,705 (9,256) 17,628 (9,769)
o/w accrued interest on impaired financial assets 298 299o/w interest on liabilities at amortized cost (9,256) (9,769)
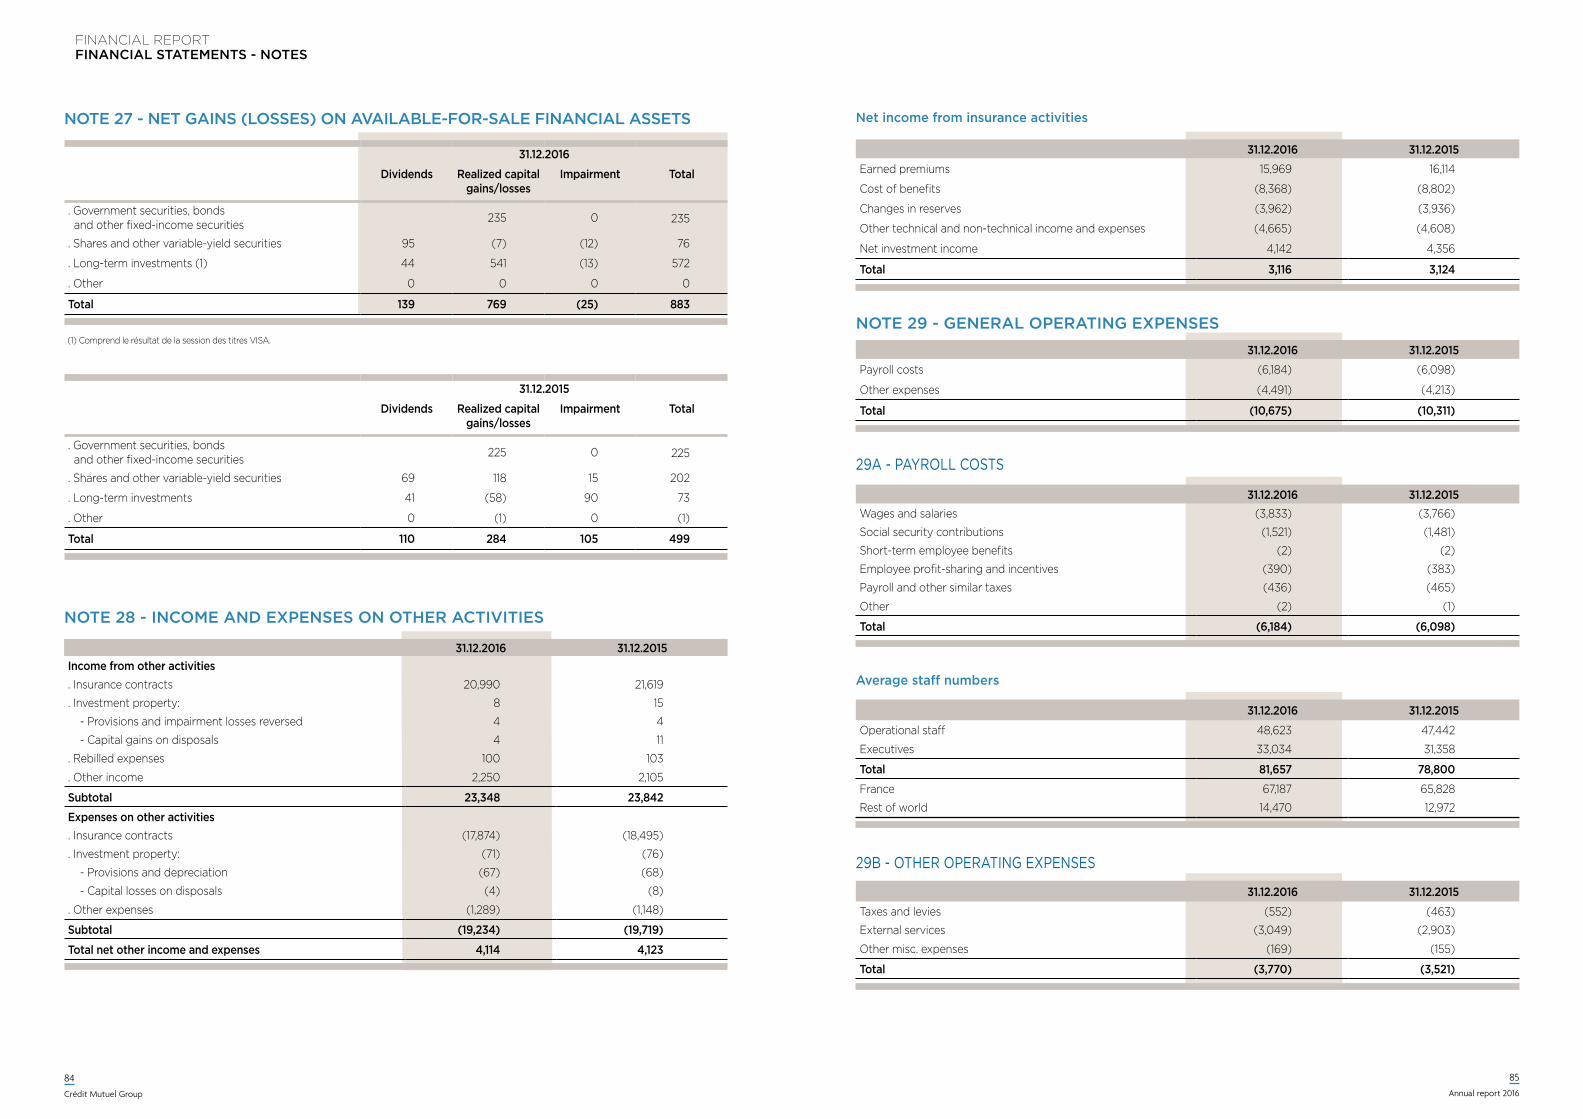
FINANCIAL REPORTFINANCIAL STATEMENTS - NOTES
84
Crédit Mutuel Group
85
Annual report 2016
NOTE 27 - NET GAINS (LOSSES) ON AvAILABLE-FOR-SALE FINANCIAL ASSETS
NOTE 28 - INCOME AND ExPENSES ON OTHER ACTIvITIES
31.12.2016
Dividends Realized capital gains/losses
Impairment Total
. Government securities, bonds and other fixed-income securities 235 0 235
. Shares and other variable-yield securities 95 (7) (12) 76
. Long-term investments (1) 44 541 (13) 572
. Other 0 0 0 0
Total 139 769 (25) 883
31.12.2015
Dividends Realized capital gains/losses
Impairment Total
. Government securities, bonds and other fixed-income securities 225 0 225
. Shares and other variable-yield securities 69 118 15 202
. Long-term investments 41 (58) 90 73
. Other 0 (1) 0 (1)
Total 110 284 105 499
31.12.2016 31.12.2015Income from other activities . Insurance contracts 20,990 21,619
. Investment property: 8 15
- Provisions and impairment losses reversed 4 4
- Capital gains on disposals 4 11
. Rebilled expenses 100 103
. Other income 2,250 2,105
Subtotal 23,348 23,842
Expenses on other activities . Insurance contracts (17,874) (18,495)
. Investment property: (71) (76)
- Provisions and depreciation (67) (68)
- Capital losses on disposals (4) (8)
. Other expenses (1,289) (1,148)
Subtotal (19,234) (19,719)
Total net other income and expenses 4,114 4,123
Net income from insurance activities
Average staff numbers
NOTE 29 - GENERAL OPERATING ExPENSES
29A - PAYROLL COSTS
29B - OThER OPERATING ExPENSES
31.12.2016 31.12.2015
Earned premiums 15,969 16,114
Cost of benefits (8,368) (8,802)
Changes in reserves (3,962) (3,936)
Other technical and non-technical income and expenses (4,665) (4,608)
Net investment income 4,142 4,356
Total 3,116 3,124
31.12.2016 31.12.2015
Operational staff 48,623 47,442
Executives 33,034 31,358
Total 81,657 78,800
France 67,187 65,828
Rest of world 14,470 12,972
31.12.2016 31.12.2015
Payroll costs (6,184) (6,098)
Other expenses (4,491) (4,213)
Total (10,675) (10,311)
31.12.2016 31.12.2015Wages and salaries (3,833) (3,766)
Social security contributions (1,521) (1,481)
Short-term employee benefits (2) (2)
Employee profit-sharing and incentives (390) (383)
Payroll and other similar taxes (436) (465)
Other (2) (1)
Total (6,184) (6,098)
31.12.2016 31.12.2015
Taxes and levies (552) (463)
External services (3,049) (2,903)
Other misc. expenses (169) (155)
Total (3,770) (3,521)
(1) Comprend le résultat de la session des titres VISA.
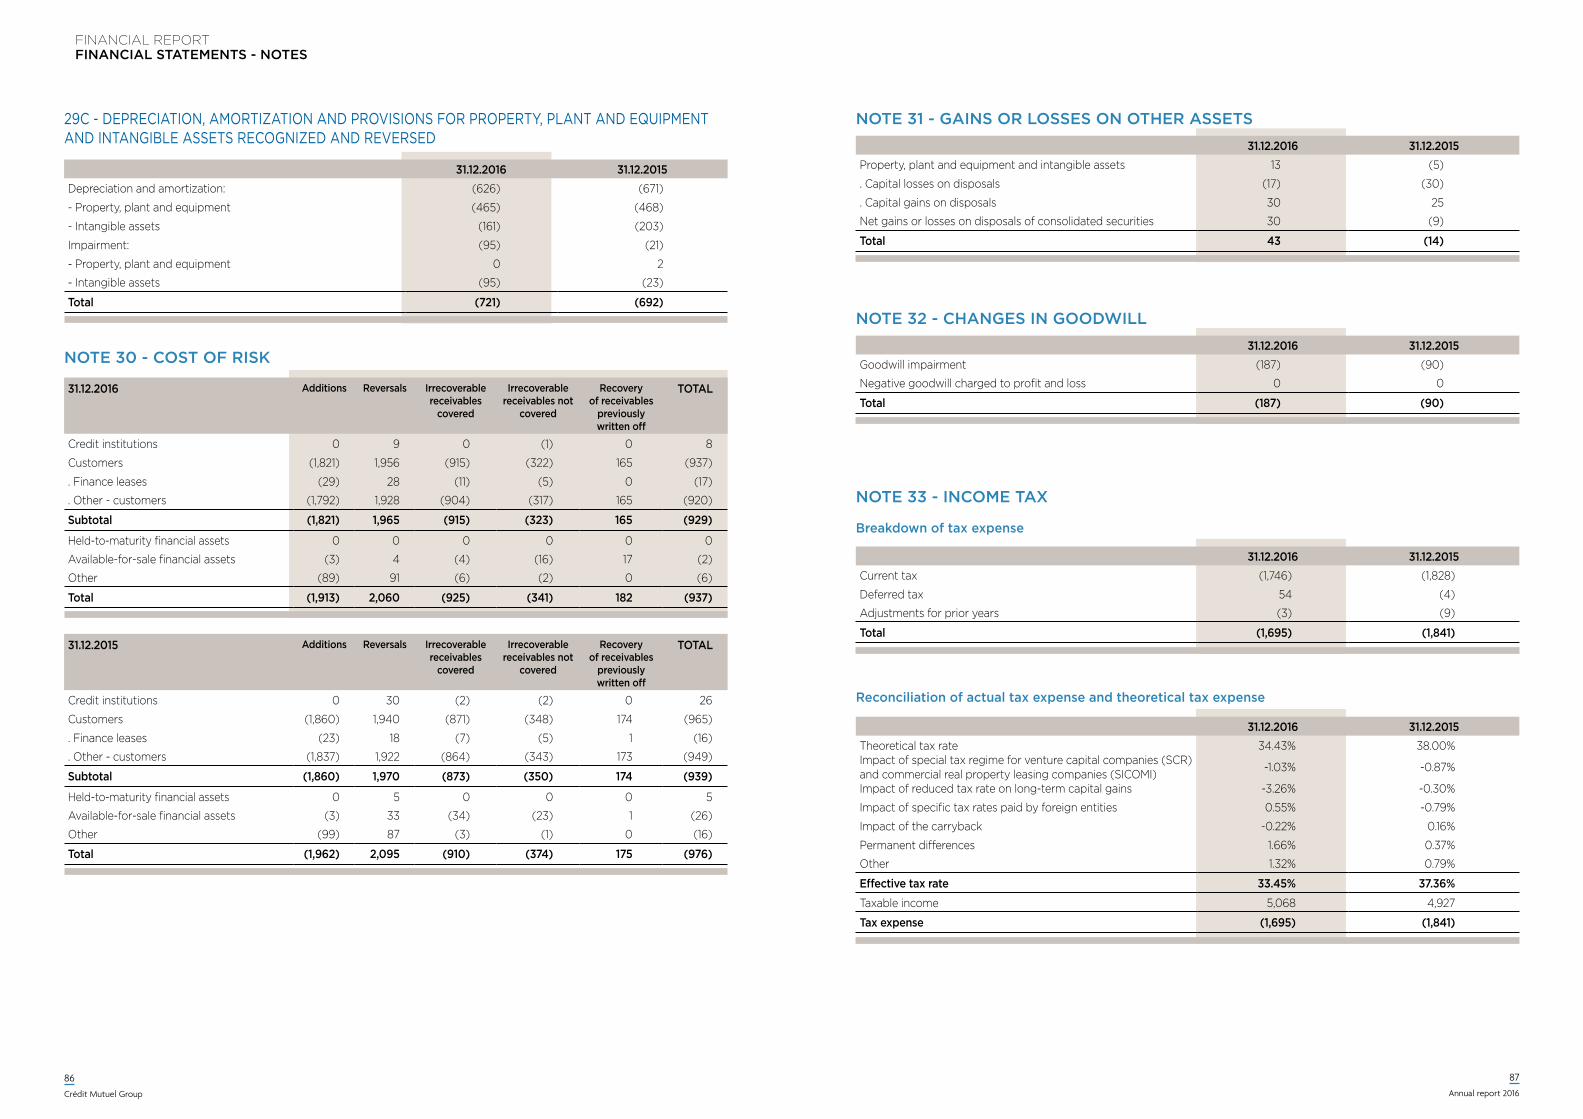
FINANCIAL REPORTFINANCIAL STATEMENTS - NOTES
86
Crédit Mutuel Group
87
Annual report 2016
29C - DEPRECIATION, AMORTIzATION AND PROVISIONS FOR PROPERTY, PLANT AND EQUIPMENT AND INTANGIBLE ASSETS RECOGNIzED AND REVERSED
31.12.2016 31.12.2015Depreciation and amortization: (626) (671)
- Property, plant and equipment (465) (468)
- Intangible assets (161) (203)
Impairment: (95) (21)
- Property, plant and equipment 0 2
- Intangible assets (95) (23)
Total (721) (692)
NOTE 30 - COST OF RISk
31.12.2016 Additions Reversals Irrecoverable receivables
covered
Irrecoverable receivables not
covered
Recovery of receivables
previously written off
TOTAL
Credit institutions 0 9 0 (1) 0 8
Customers (1,821) 1,956 (915) (322) 165 (937)
. Finance leases (29) 28 (11) (5) 0 (17)
. Other - customers (1,792) 1,928 (904) (317) 165 (920)
Subtotal (1,821) 1,965 (915) (323) 165 (929)
Held-to-maturity financial assets 0 0 0 0 0 0
Available-for-sale financial assets (3) 4 (4) (16) 17 (2)
Other (89) 91 (6) (2) 0 (6)
Total (1,913) 2,060 (925) (341) 182 (937)
31.12.2015 Additions Reversals Irrecoverable receivables
covered
Irrecoverable receivables not
covered
Recovery of receivables
previously written off
TOTAL
Credit institutions 0 30 (2) (2) 0 26
Customers (1,860) 1,940 (871) (348) 174 (965)
. Finance leases (23) 18 (7) (5) 1 (16)
. Other - customers (1,837) 1,922 (864) (343) 173 (949)
Subtotal (1,860) 1,970 (873) (350) 174 (939)
Held-to-maturity financial assets 0 5 0 0 0 5
Available-for-sale financial assets (3) 33 (34) (23) 1 (26)
Other (99) 87 (3) (1) 0 (16)
Total (1,962) 2,095 (910) (374) 175 (976)
NOTE 32 - CHANGES IN GOODwILL
NOTE 31 - GAINS OR LOSSES ON OTHER ASSETS
NOTE 33 - INCOME TAx
Breakdown of tax expense
31.12.2016 31.12.2015Goodwill impairment (187) (90)
Negative goodwill charged to profit and loss 0 0
Total (187) (90)
31.12.2016 31.12.2015Property, plant and equipment and intangible assets 13 (5)
. Capital losses on disposals (17) (30)
. Capital gains on disposals 30 25
Net gains or losses on disposals of consolidated securities 30 (9)
Total 43 (14)
31.12.2016 31.12.2015Current tax (1,746) (1,828)
Deferred tax 54 (4)
Adjustments for prior years (3) (9)
Total (1,695) (1,841)
31.12.2016 31.12.2015Theoretical tax rate 34.43% 38.00%Impact of special tax regime for venture capital companies (SCR) and commercial real property leasing companies (SICOMI) -1.03% -0.87%
Impact of reduced tax rate on long-term capital gains -3.26% -0.30%
Impact of specific tax rates paid by foreign entities 0.55% -0.79%
Impact of the carryback -0.22% 0.16%
Permanent differences 1.66% 0.37%
Other 1.32% 0.79%
Effective tax rate 33.45% 37.36%
Taxable income 5,068 4,927
Tax expense (1,695) (1,841)
Reconciliation of actual tax expense and theoretical tax expense
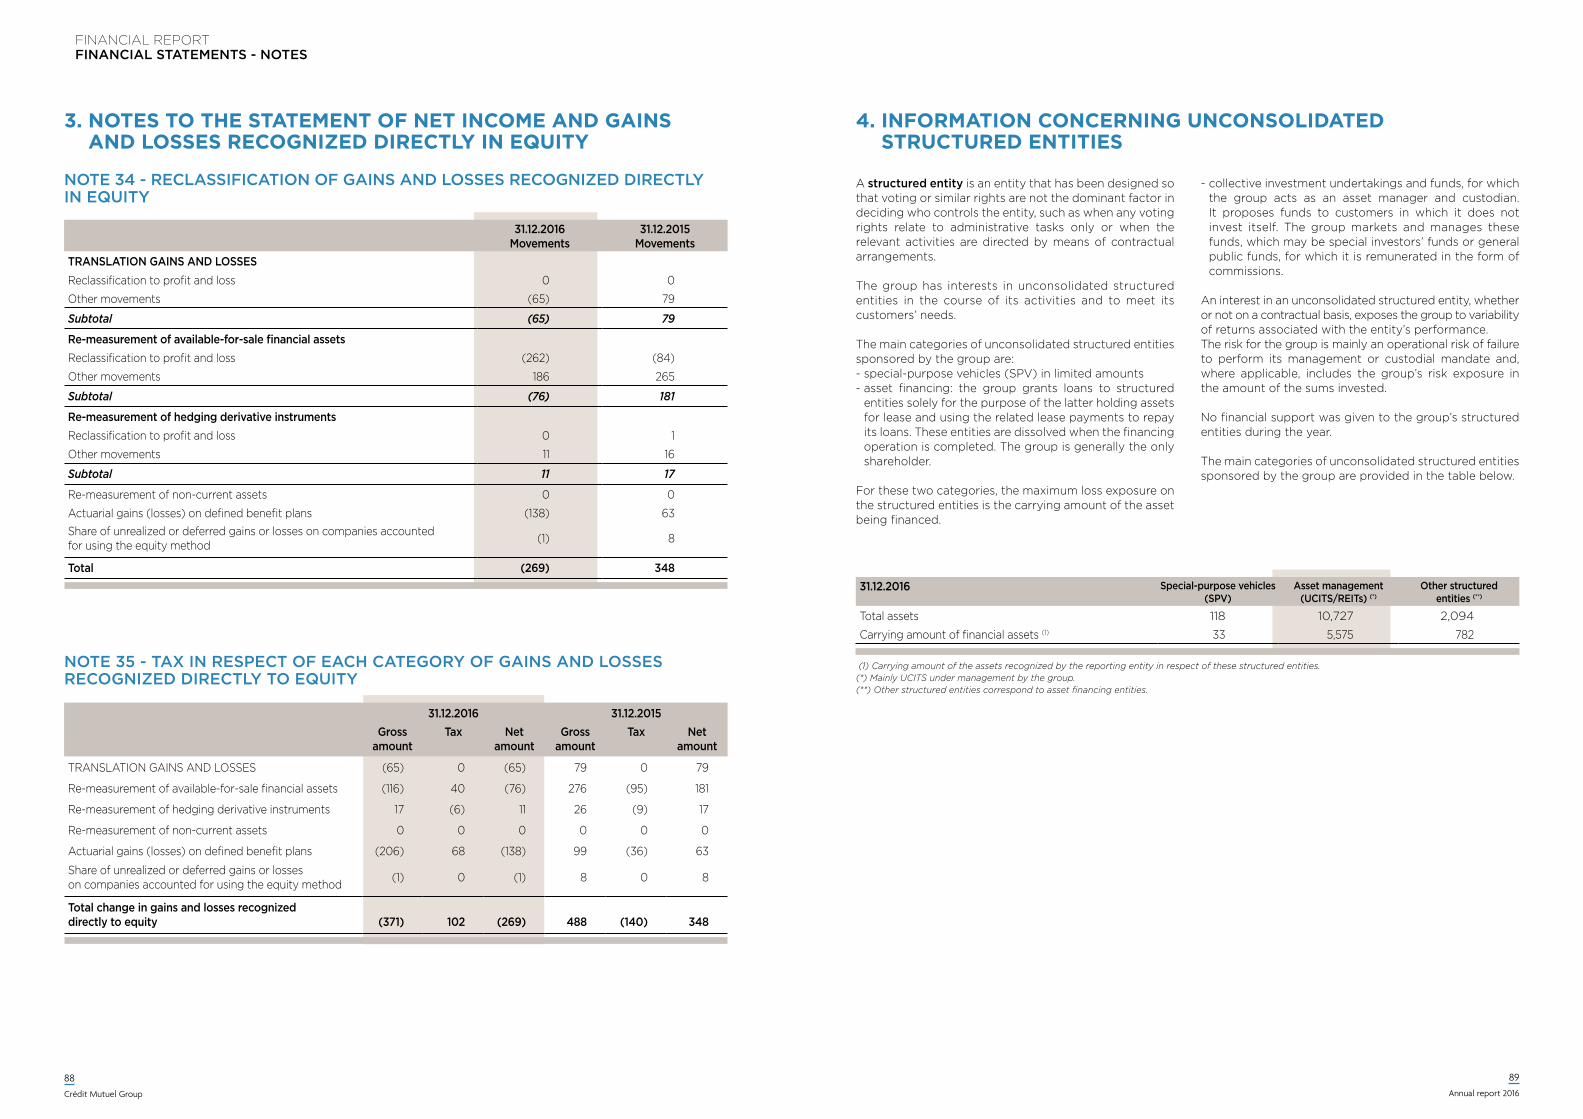
FINANCIAL REPORTFINANCIAL STATEMENTS - NOTES
88
Crédit Mutuel Group
89
Annual report 2016
3. noteS to tHe StAtement oF net InCome AnD GAInS AnD LoSSeS ReCoGnIzeD DIReCtLY In eQUItY
NOTE 34 - RECLASSIFICATION OF GAINS AND LOSSES RECOGNIzED DIRECTLy IN EqUITy
31.12.2016 Movements
31.12.2015 Movements
TranslaTion gains and losses
Reclassification to profit and loss 0 0
Other movements (65) 79
Subtotal (65) 79
re-measurement of available-for-sale financial assets
Reclassification to profit and loss (262) (84)
Other movements 186 265
Subtotal (76) 181
re-measurement of hedging derivative instruments
Reclassification to profit and loss 0 1
Other movements 11 16
Subtotal 11 17
Re-measurement of non-current assets 0 0
Actuarial gains (losses) on defined benefit plans (138) 63Share of unrealized or deferred gains or losses on companies accounted for using the equity method (1) 8
Total (269) 348
NOTE 35 - TAx IN RESPECT OF EACH CATEGORy OF GAINS AND LOSSES RECOGNIzED DIRECTLy TO EqUITy
31.12.2016 31.12.2015Gross
amountTax Net
amountGross
amountTax Net
amount
TranslaTion gains and losses (65) 0 (65) 79 0 79
re-measurement of available-for-sale financial assets (116) 40 (76) 276 (95) 181
re-measurement of hedging derivative instruments 17 (6) 11 26 (9) 17
re-measurement of non-current assets 0 0 0 0 0 0
actuarial gains (losses) on defined benefit plans (206) 68 (138) 99 (36) 63
share of unrealized or deferred gains or losses on companies accounted for using the equity method (1) 0 (1) 8 0 8
Total change in gains and losses recognized directly to equity (371) 102 (269) 488 (140) 348
4. InFoRmAtIon ConCeRnInG UnConSoLIDAteD StRUCtUReD entItIeS
A structured entity is an entity that has been designed so that voting or similar rights are not the dominant factor in deciding who controls the entity, such as when any voting rights relate to administrative tasks only or when the relevant activities are directed by means of contractual arrangements.
The group has interests in unconsolidated structured entities in the course of its activities and to meet its customers’ needs.
The main categories of unconsolidated structured entities sponsored by the group are:- special-purpose vehicles (SPV) in limited amounts- asset financing: the group grants loans to structured
entities solely for the purpose of the latter holding assets for lease and using the related lease payments to repay its loans. These entities are dissolved when the financing operation is completed. The group is generally the only shareholder.
For these two categories, the maximum loss exposure on the structured entities is the carrying amount of the asset being financed.
- collective investment undertakings and funds, for which the group acts as an asset manager and custodian. It proposes funds to customers in which it does not invest itself. The group markets and manages these funds, which may be special investors’ funds or general public funds, for which it is remunerated in the form of commissions.
An interest in an unconsolidated structured entity, whether or not on a contractual basis, exposes the group to variability of returns associated with the entity’s performance.The risk for the group is mainly an operational risk of failure to perform its management or custodial mandate and, where applicable, includes the group’s risk exposure in the amount of the sums invested.
No financial support was given to the group’s structured entities during the year.
The main categories of unconsolidated structured entities sponsored by the group are provided in the table below.
31.12.2016 Special-purpose vehicles (SPV)
Asset management (UCITS/REITs) (*)
Other structured entities (**)
Total assets 118 10,727 2,094
Carrying amount of financial assets (1) 33 5,575 782
(1) Carrying amount of the assets recognized by the reporting entity in respect of these structured entities.(*) Mainly UCITS under management by the group.(**) Other structured entities correspond to asset financing entities.
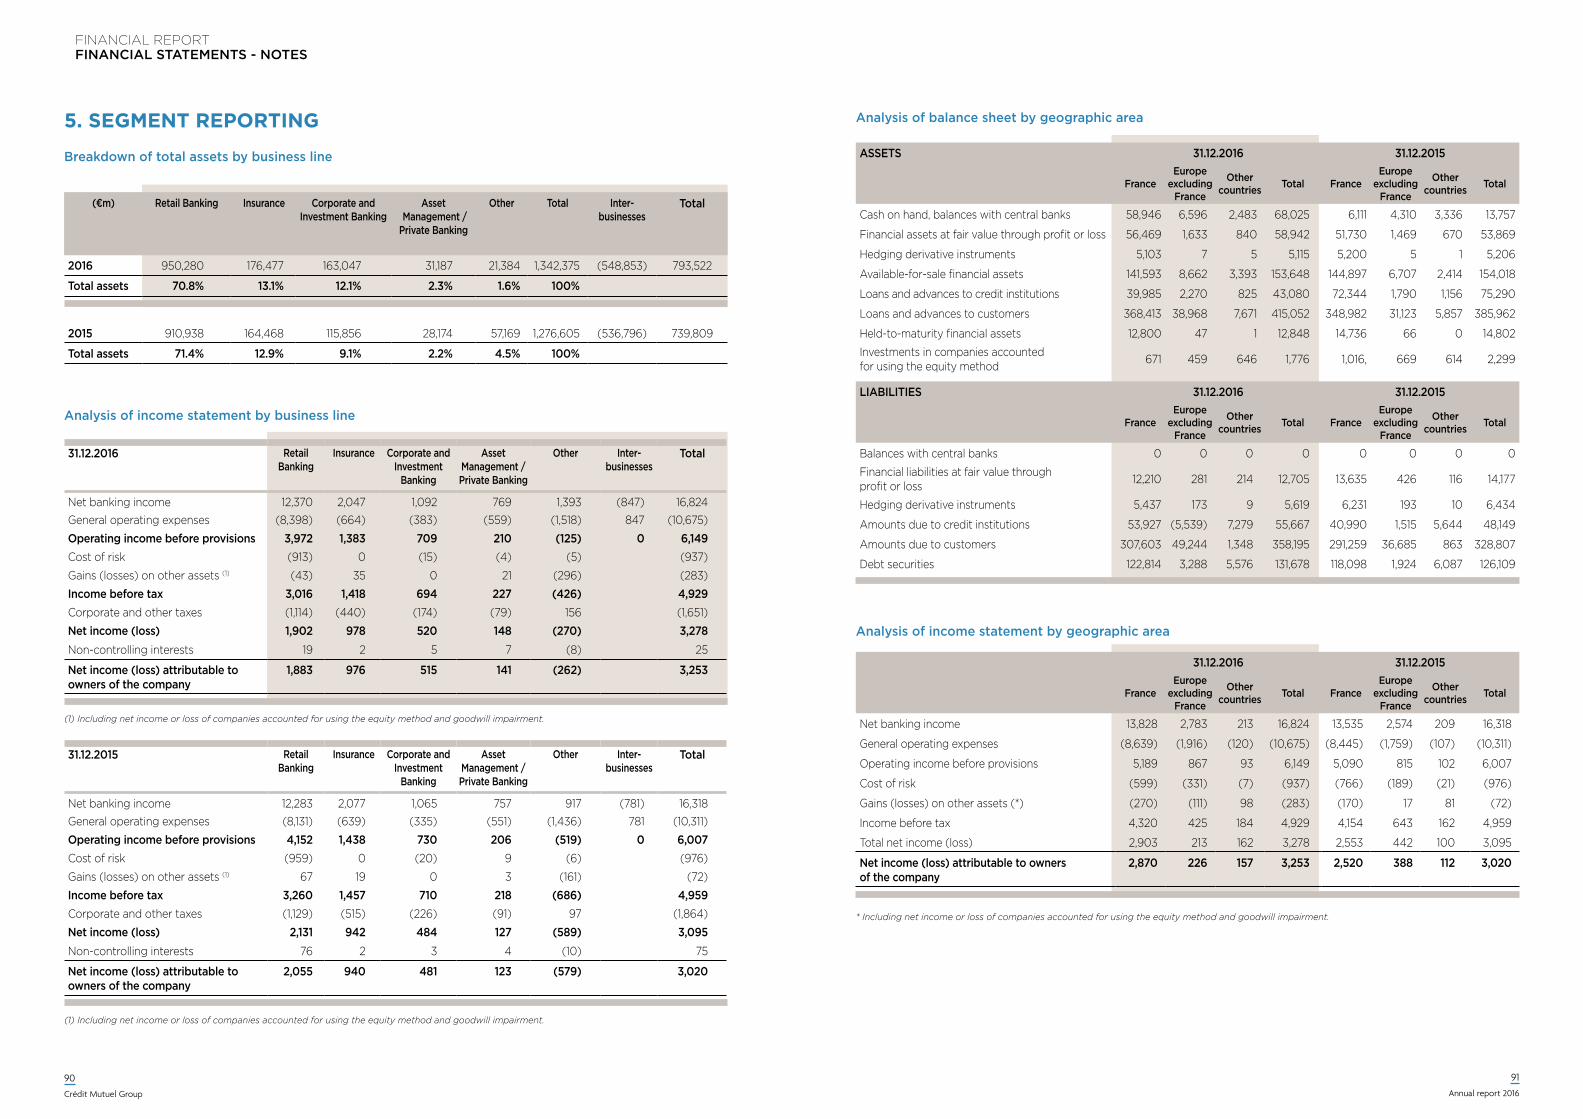
FINANCIAL REPORTFINANCIAL STATEMENTS - NOTES
90
Crédit Mutuel Group
91
Annual report 2016
5. SeGment RePoRtInG
Breakdown of total assets by business line
Analysis of income statement by business line
(€m) Retail Banking Insurance Corporate and Investment Banking
Asset Management / Private Banking
Other Total Inter- businesses
Total
2016 950,280 176,477 163,047 31,187 21,384 1,342,375 (548,853) 793,522
Total assets 70.8% 13.1% 12.1% 2.3% 1.6% 100%
2015 910,938 164,468 115,856 28,174 57,169 1,276,605 (536,796) 739,809
Total assets 71.4% 12.9% 9.1% 2.2% 4.5% 100%
31.12.2016 Retail Banking
Insurance Corporate and Investment
Banking
Asset Management / Private Banking
Other Inter- businesses
Total
Net banking income 12,370 2,047 1,092 769 1,393 (847) 16,824General operating expenses (8,398) (664) (383) (559) (1,518) 847 (10,675)
Operating income before provisions 3,972 1,383 709 210 (125) 0 6,149Cost of risk (913) 0 (15) (4) (5) (937)
Gains (losses) on other assets (1) (43) 35 0 21 (296) (283)
Income before tax 3,016 1,418 694 227 (426) 4,929Corporate and other taxes (1,114) (440) (174) (79) 156 (1,651)
Net income (loss) 1,902 978 520 148 (270) 3,278Non-controlling interests 19 2 5 7 (8) 25
Net income (loss) attributable to owners of the company
1,883 976 515 141 (262) 3,253
(1) Including net income or loss of companies accounted for using the equity method and goodwill impairment.
31.12.2015 Retail Banking
Insurance Corporate and Investment
Banking
Asset Management / Private Banking
Other Inter- businesses
Total
Net banking income 12,283 2,077 1,065 757 917 (781) 16,318General operating expenses (8,131) (639) (335) (551) (1,436) 781 (10,311)
Operating income before provisions 4,152 1,438 730 206 (519) 0 6,007Cost of risk (959) 0 (20) 9 (6) (976)
Gains (losses) on other assets (1) 67 19 0 3 (161) (72)
Income before tax 3,260 1,457 710 218 (686) 4,959Corporate and other taxes (1,129) (515) (226) (91) 97 (1,864)
Net income (loss) 2,131 942 484 127 (589) 3,095Non-controlling interests 76 2 3 4 (10) 75
Net income (loss) attributable to owners of the company
2,055 940 481 123 (579) 3,020
(1) Including net income or loss of companies accounted for using the equity method and goodwill impairment.
Analysis of balance sheet by geographic area
Analysis of income statement by geographic area
Assets 31.12.2016 31.12.2015
Franceeurope
excluding France
Other countries total France
europeexcluding
France
Other countries total
Cash on hand, balances with central banks 58,946 6,596 2,483 68,025 6,111 4,310 3,336 13,757
Financial assets at fair value through profit or loss 56,469 1,633 840 58,942 51,730 1,469 670 53,869
Hedging derivative instruments 5,103 7 5 5,115 5,200 5 1 5,206
Available-for-sale financial assets 141,593 8,662 3,393 153,648 144,897 6,707 2,414 154,018
Loans and advances to credit institutions 39,985 2,270 825 43,080 72,344 1,790 1,156 75,290
Loans and advances to customers 368,413 38,968 7,671 415,052 348,982 31,123 5,857 385,962
Held-to-maturity financial assets 12,800 47 1 12,848 14,736 66 0 14,802
Investments in companies accounted for using the equity method 671 459 646 1,776 1,016, 669 614 2,299
31.12.2016 31.12.2015
FranceEurope
excluding France
Other countries Total France
Europeexcluding
France
Other countries Total
Net banking income 13,828 2,783 213 16,824 13,535 2,574 209 16,318
General operating expenses (8,639) (1,916) (120) (10,675) (8,445) (1,759) (107) (10,311)
Operating income before provisions 5,189 867 93 6,149 5,090 815 102 6,007
Cost of risk (599) (331) (7) (937) (766) (189) (21) (976)
Gains (losses) on other assets (*) (270) (111) 98 (283) (170) 17 81 (72)
Income before tax 4,320 425 184 4,929 4,154 643 162 4,959
Total net income (loss) 2,903 213 162 3,278 2,553 442 100 3,095
Net income (loss) attributable to owners of the company
2,870 226 157 3,253 2,520 388 112 3,020
* Including net income or loss of companies accounted for using the equity method and goodwill impairment.
LiabiLities 31.12.2016 31.12.2015
Franceeurope
excluding France
Other countries total France
europeexcluding
France
Other countries total
Balances with central banks 0 0 0 0 0 0 0 0
Financial liabilities at fair value through profit or loss 12,210 281 214 12,705 13,635 426 116 14,177
Hedging derivative instruments 5,437 173 9 5,619 6,231 193 10 6,434
Amounts due to credit institutions 53,927 (5,539) 7,279 55,667 40,990 1,515 5,644 48,149
Amounts due to customers 307,603 49,244 1,348 358,195 291,259 36,685 863 328,807
Debt securities 122,814 3,288 5,576 131,678 118,098 1,924 6,087 126,109
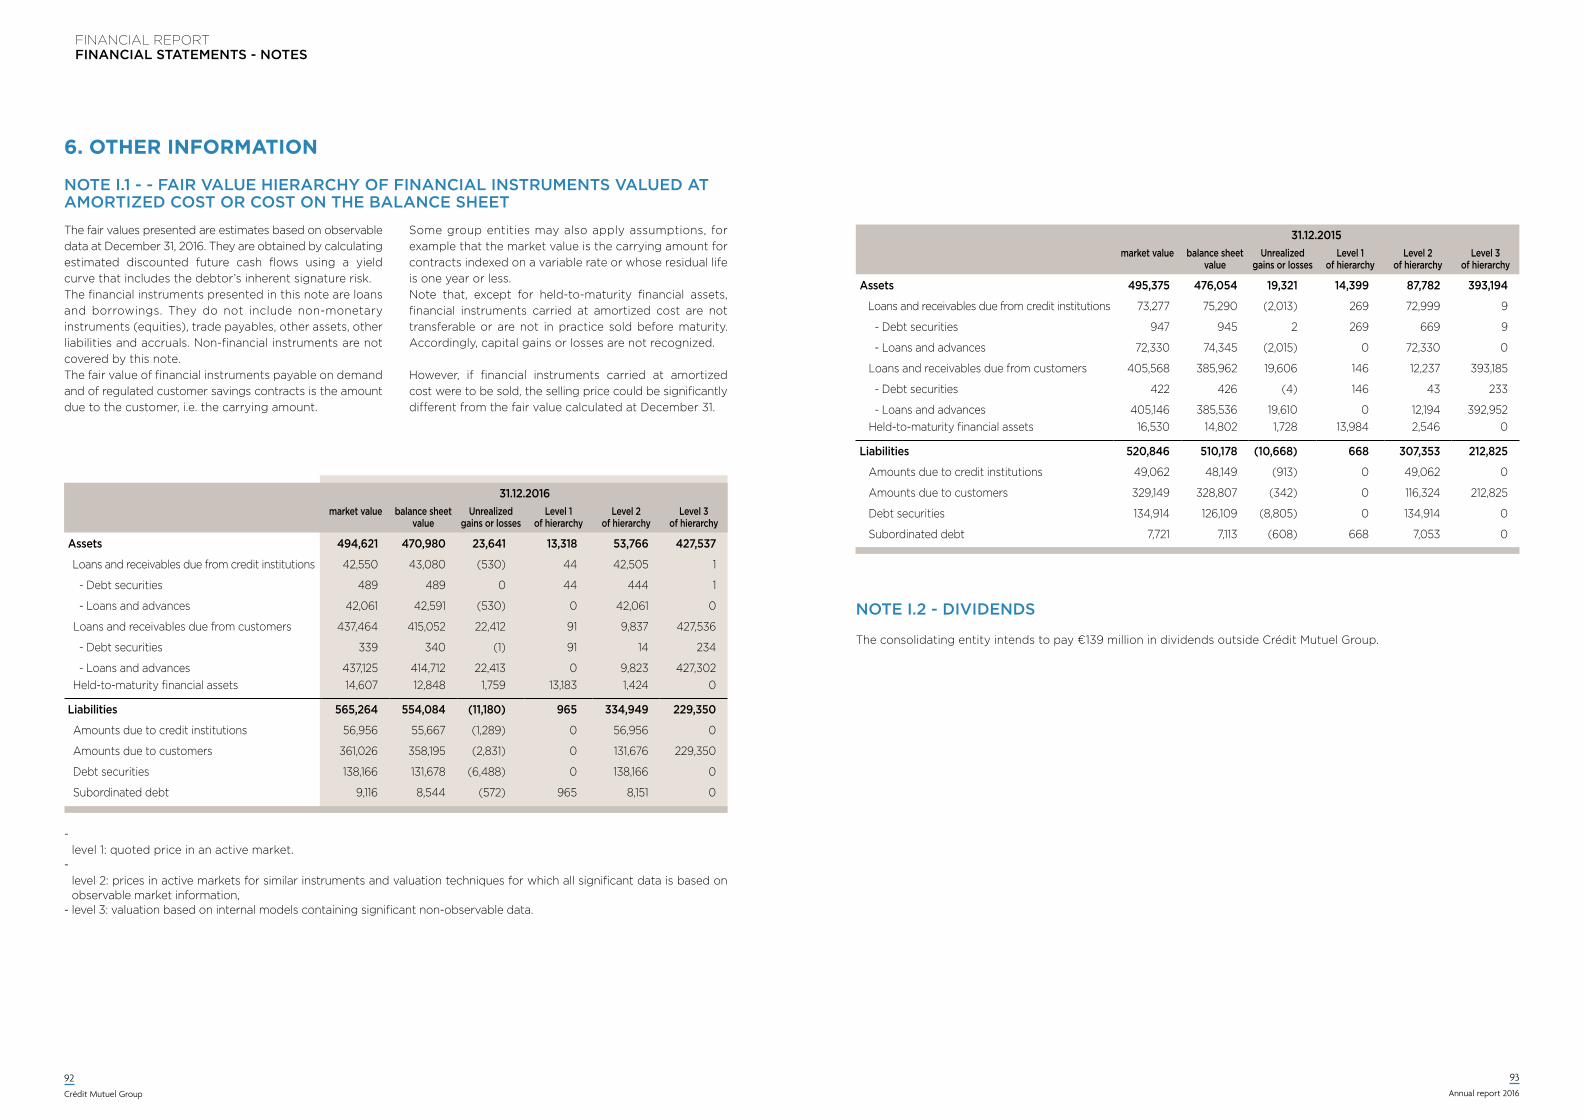
FINANCIAL REPORTFINANCIAL STATEMENTS - NOTES
92
Crédit Mutuel Group
93
Annual report 2016
6. otHeR InFoRmAtIon
NOTE I.1 - - FAIR vALUE HIERARCHy OF FINANCIAL INSTRUMENTS vALUED AT AMORTIzED COST OR COST ON THE BALANCE SHEET
The fair values presented are estimates based on observable data at December 31, 2016. They are obtained by calculating estimated discounted future cash flows using a yield curve that includes the debtor’s inherent signature risk.The financial instruments presented in this note are loans and borrowings. They do not include non-monetary instruments (equities), trade payables, other assets, other liabilities and accruals. Non-financial instruments are not covered by this note.The fair value of financial instruments payable on demand and of regulated customer savings contracts is the amount due to the customer, i.e. the carrying amount.
Some group entities may also apply assumptions, for example that the market value is the carrying amount for contracts indexed on a variable rate or whose residual life is one year or less. Note that, except for held-to-maturity financial assets, financial instruments carried at amortized cost are not transferable or are not in practice sold before maturity. Accordingly, capital gains or losses are not recognized.
However, if financial instruments carried at amortized cost were to be sold, the selling price could be significantly different from the fair value calculated at December 31.
31.12.2016market value balance sheet
valueUnrealized
gains or lossesLevel 1
of hierarchyLevel 2
of hierarchyLevel 3
of hierarchy
Assets 494,621 470,980 23,641 13,318 53,766 427,537
Loans and receivables due from credit institutions 42,550 43,080 (530) 44 42,505 1
- Debt securities 489 489 0 44 444 1
- Loans and advances 42,061 42,591 (530) 0 42,061 0
Loans and receivables due from customers 437,464 415,052 22,412 91 9,837 427,536
- Debt securities 339 340 (1) 91 14 234
- Loans and advances 437,125 414,712 22,413 0 9,823 427,302 Held-to-maturity financial assets 14,607 12,848 1,759 13,183 1,424 0
Liabilities 565,264 554,084 (11,180) 965 334,949 229,350
Amounts due to credit institutions 56,956 55,667 (1,289) 0 56,956 0
Amounts due to customers 361,026 358,195 (2,831) 0 131,676 229,350
Debt securities 138,166 131,678 (6,488) 0 138,166 0
Subordinated debt 9,116 8,544 (572) 965 8,151 0
- level 1: quoted price in an active market.
- level 2: prices in active markets for similar instruments and valuation techniques for which all significant data is based on observable market information,
- level 3: valuation based on internal models containing significant non-observable data.
31.12.2015market value balance sheet
valueUnrealized
gains or lossesLevel 1
of hierarchyLevel 2
of hierarchyLevel 3
of hierarchy
Assets 495,375 476,054 19,321 14,399 87,782 393,194
Loans and receivables due from credit institutions 73,277 75,290 (2,013) 269 72,999 9
- Debt securities 947 945 2 269 669 9
- Loans and advances 72,330 74,345 (2,015) 0 72,330 0
Loans and receivables due from customers 405,568 385,962 19,606 146 12,237 393,185
- Debt securities 422 426 (4) 146 43 233
- Loans and advances 405,146 385,536 19,610 0 12,194 392,952 Held-to-maturity financial assets 16,530 14,802 1,728 13,984 2,546 0
Liabilities 520,846 510,178 (10,668) 668 307,353 212,825
Amounts due to credit institutions 49,062 48,149 (913) 0 49,062 0
Amounts due to customers 329,149 328,807 (342) 0 116,324 212,825
Debt securities 134,914 126,109 (8,805) 0 134,914 0
Subordinated debt 7,721 7,113 (608) 668 7,053 0
NOTE I.2 - DIvIDENDS
The consolidating entity intends to pay €139 million in dividends outside Crédit Mutuel Group.
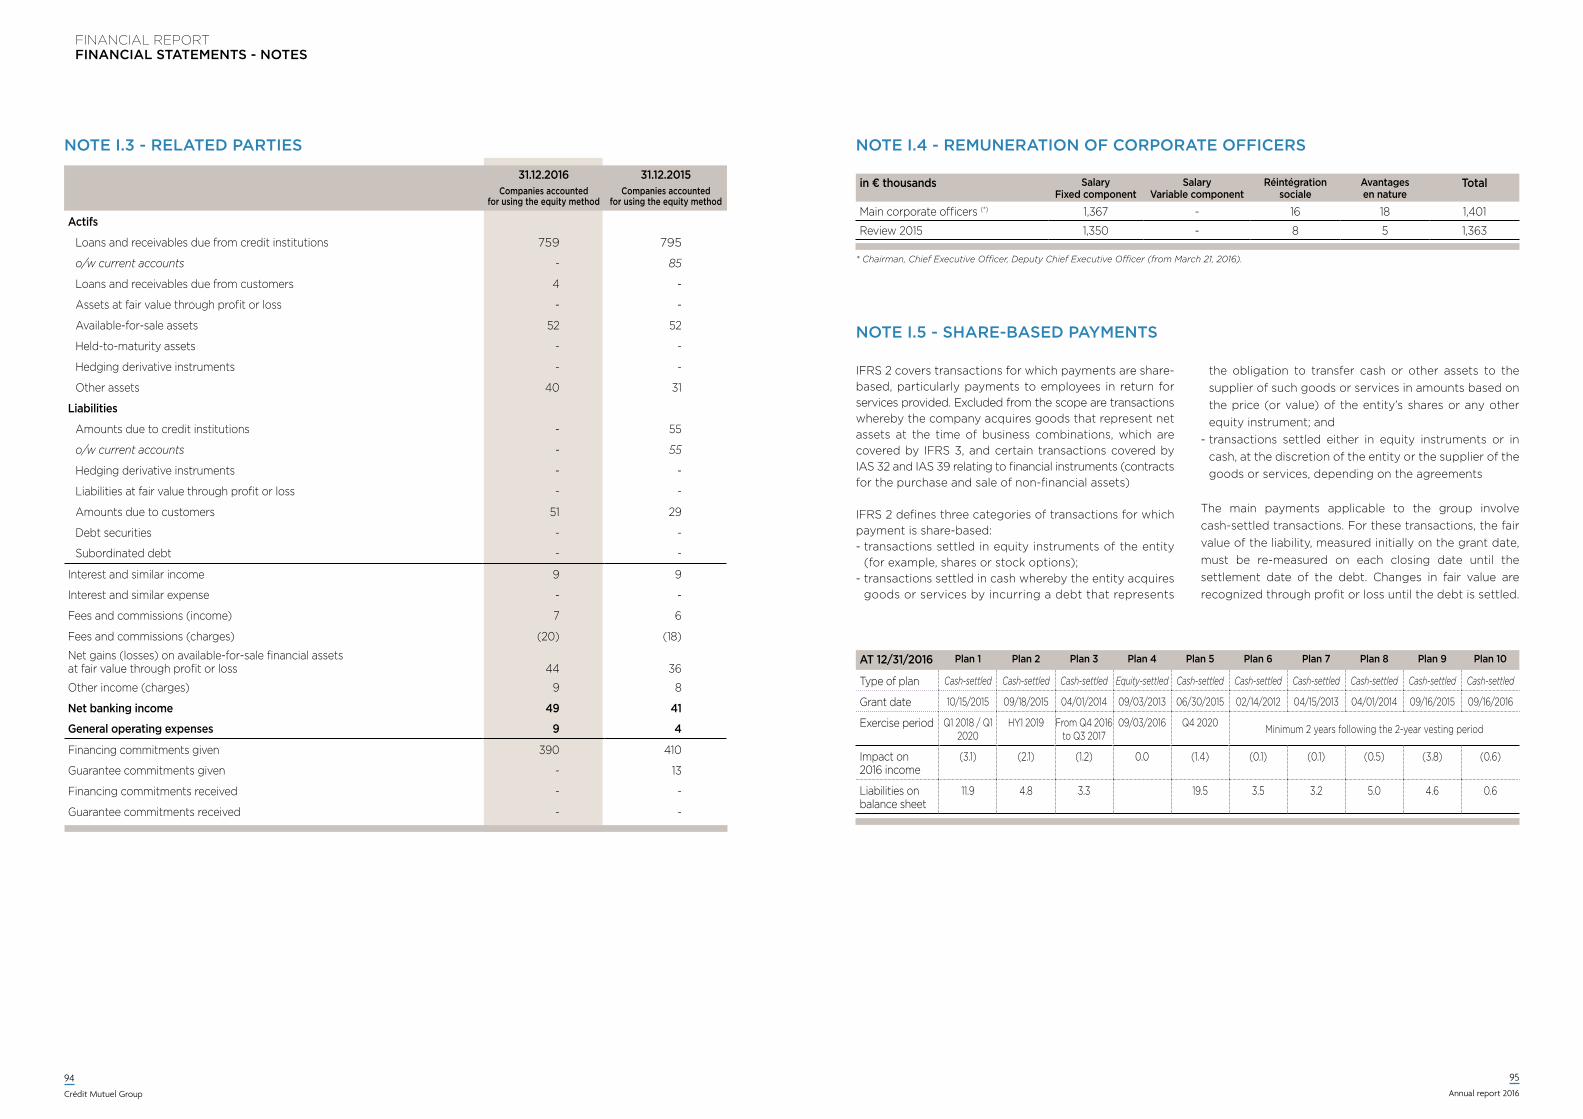
FINANCIAL REPORTFINANCIAL STATEMENTS - NOTES
94
Crédit Mutuel Group
95
Annual report 2016
in € thousands Salary Fixed component
Salary Variable component
Réintégration sociale
Avantages en nature
Total
Main corporate officers (*) 1,367 - 16 18 1,401
Review 2015 1,350 - 8 5 1,363
* Chairman, Chief Executive Officer, Deputy Chief Executive Officer (from March 21, 2016).
NOTE I.4 - REMUNERATION OF CORPORATE OFFICERS
NOTE I.5 - SHARE-BASED PAyMENTS
IFRS 2 covers transactions for which payments are share-based, particularly payments to employees in return for services provided. Excluded from the scope are transactions whereby the company acquires goods that represent net assets at the time of business combinations, which are covered by IFRS 3, and certain transactions covered by IAS 32 and IAS 39 relating to financial instruments (contracts for the purchase and sale of non-financial assets) IFRS 2 defines three categories of transactions for which payment is share-based:- transactions settled in equity instruments of the entity
(for example, shares or stock options);- transactions settled in cash whereby the entity acquires
goods or services by incurring a debt that represents
the obligation to transfer cash or other assets to the supplier of such goods or services in amounts based on the price (or value) of the entity’s shares or any other equity instrument; and
- transactions settled either in equity instruments or in cash, at the discretion of the entity or the supplier of the goods or services, depending on the agreements
The main payments applicable to the group involve cash-settled transactions. For these transactions, the fair value of the liability, measured initially on the grant date, must be re-measured on each closing date until the settlement date of the debt. Changes in fair value are recognized through profit or loss until the debt is settled.
At 12/31/2016 Plan 1 Plan 2 Plan 3 Plan 4 Plan 5 Plan 6 Plan 7 Plan 8 Plan 9 Plan 10
Type of plan Cash-settled Cash-settled Cash-settled Equity-settled Cash-settled Cash-settled Cash-settled Cash-settled Cash-settled Cash-settled
Grant date 10/15/2015 09/18/2015 04/01/2014 09/03/2013 06/30/2015 02/14/2012 04/15/2013 04/01/2014 09/16/2015 09/16/2016
Exercise period Q1 2018 / Q1 2020
HY1 2019 From Q4 2016 to Q3 2017
09/03/2016 Q4 2020 Minimum 2 years following the 2-year vesting period
Impact on 2016 income
(3.1) (2.1) (1.2) 0.0 (1.4) (0.1) (0.1) (0.5) (3.8) (0.6)
Liabilities on balance sheet
11.9 4.8 3.3 19.5 3.5 3.2 5.0 4.6 0.6
NOTE I.3 - RELATED PARTIES
31.12.2016 31.12.2015Companies accounted
for using the equity methodCompanies accounted
for using the equity method
Actifs
Loans and receivables due from credit institutions 759 795
o/w current accounts - 85
Loans and receivables due from customers 4 -
Assets at fair value through profit or loss - -
Available-for-sale assets 52 52
Held-to-maturity assets - -
Hedging derivative instruments - -
Other assets 40 31
Liabilities
Amounts due to credit institutions - 55
o/w current accounts - 55
Hedging derivative instruments - -
Liabilities at fair value through profit or loss - -
Amounts due to customers 51 29
Debt securities - -
Subordinated debt - -
Interest and similar income 9 9
Interest and similar expense - -
Fees and commissions (income) 7 6
Fees and commissions (charges) (20) (18)
Net gains (losses) on available-for-sale financial assets at fair value through profit or loss 44 36
Other income (charges) 9 8
Net banking income 49 41
General operating expenses 9 4
Financing commitments given 390 410
Guarantee commitments given - 13
Financing commitments received - -
Guarantee commitments received - -
FINANCIAL STATEMENTS
96
Crédit Mutuel Group
97
Annual report 2016
REPORT OF ThE STATUTORY AUDITORS ON ThE CONSOLIDATED
FINANCIAL STATEMENTSCRéDIT MUTUEL GROUP
Year ended December 31, 2016
MAzARSTour Exaltis
61, rue henri Regnault - 92400 CourbevoieLimited company with capital of € 8 320 000
Statutory AuditorsMember of the Versailles regional institute
of accountants
ERNST & yOUNG ET AUTRES1/2, place des Saisons
92400 Courbevoie – Paris – La Défense 1Simplified joint-stock company with variable capital
Statutory AuditorsMember of the Versailles regional institute
of accountants
Courbevoie and Paris-La Défense, May 9, 2017
The Statutory Auditors
MAzARS ERNST & yOUNG ET AUTRES Pierre Masieri Olivier Durand
To the Shareholders,
In fulfillment of the assignment entrusted to us by your
General Meetings, we present to you our report for the
financial year ended December 31, 2016, on:
• the audit of the consolidated financial statements of the
Crédit Mutuel Group, as appended to this report;
• the justification of our assessments;
• the specific verification required by law.
The consolidated financial statements have been approved
by the Board of Directors. Our role is to express an opinion
on these financial statements based on our audit.
I. Opinion on the consolidated financial statements
We conducted our audit in accordance with the professional
standards applicable in France; those standards require that
we plan and perform the audit to obtain reasonable assurance
about whether the consolidated financial statements are free
of material misstatement. An audit involves performing
procedures, using sampling techniques or other methods of
selection, to obtain audit evidence about the amounts and
disclosures in the consolidated financial statements. An audit
also includes evaluating the appropriateness of accounting
policies used and the reasonableness of accounting estimates
made, as well as the overall presentation of the financial
statements.
We believe that the audit evidence we have obtained is
sufficient and appropriate to provide a basis for our audit
opinion.
In our opinion, the consolidated financial statements give a
true and fair view of the assets and liabilities and of the
financial position of the Group as at December 31, 2015 and
of the results of its operations for the year then ended in
accordance with International Financial Reporting Standards
as adopted by the European Union.
II. Justification of our assessments
In accordance with the provisions of Article L. 823-9 of the
French Commercial Code relating to the justification of our
assessments, we draw your attention to the following points:
• The group uses internal models and methods for valuing
certain financial instruments that are not traded on an
active market and for determining certain provisions, as
described in Note I-3 “Accounting policies and methods” to
the consolidated financial statements. We examined the
control systems applied to these models and methods, the
parameters used and the identification of the financial
instruments to which they apply.
• As explained in Note I-3 to the consolidated financial
statements describing the accounting policies and methods
and in Note II-5a, impairment losses in respect of available-
for-sale assets are recognised when there is objective
evidence of a prolonged or significant diminution in an
asset’s value. We examined the control systems applicable
to the identification of loss of value indices, the valuation of
the most significant items, and the estimates which led, if
applicable, to the recognition of impairment provisions to
cover losses in value.
• As explained in Note I-3 to the consolidated financial
statements describing the accounting policies and methods
and in Notes II-1a, II-8a, II-9, II-10, II-20a and II-30, impairment
losses and provisions are recognised to cover credit and
counterparty risks inherent to the group’s activities. We
examined the control systems applicable to the monitoring
of credit and counterparty risk, the impairment
methodologies and the coverage of losses in value by
individual and collective impairment provisions.
• As explained in Note I-2 to the consolidated financial
statements describing the accounting policies and methods
and in Notes II-15a, II-18 and II-32, impairment tests were
performed in respect of goodwill and investments and,
when applicable, impairment losses were recognised in the
year under review. We examined the methods used to
implement these tests, the main assumptions and
parameters used and the resulting estimates that led, where
applicable, to impairment losses.
• As explained in Note I-3 to the consolidated financial
statements describing the accounting policies and methods
and in Note II-20a, provisions are recognised in respect of
employee benefits. We examined the method used to
assess these obligations, as well as the main assumptions
and calculation methods used.
These assessments were made as part of our audit of the
consolidated financial statements taken as a whole, and
therefore contributed to the opinion we formed which is
expressed in the first part of this report.
III. Specific verification
As required by law, we have also verified in accordance with
professional standards applicable in France the information
presented in the group’s management report.
We have no matters to report as to the fair presentation of
this information and its consistency with the consolidated
financial statements.

Confédération Nationale du Crédit Mutuel
88- 90, rue Cardinet - 75847 Paris Cedex 17
Tél. : 01 53 48 87 94
www.creditmutuel.com
Communication institutionnelle
Photos : Crédit Mutuel - Getty Images