Embed Size (px)
Citation preview
Credit Model Calibration –
Post-Basel II – Maximising
Data & Model Accuracy
RiskMinds - December 11, 2014
Amsterdam, Netherlands
Dr Scott D. Aguais, Managing Director
Aguais & Associates Ltd.
2Scott D. Aguais Aguais & Associates Ltd.
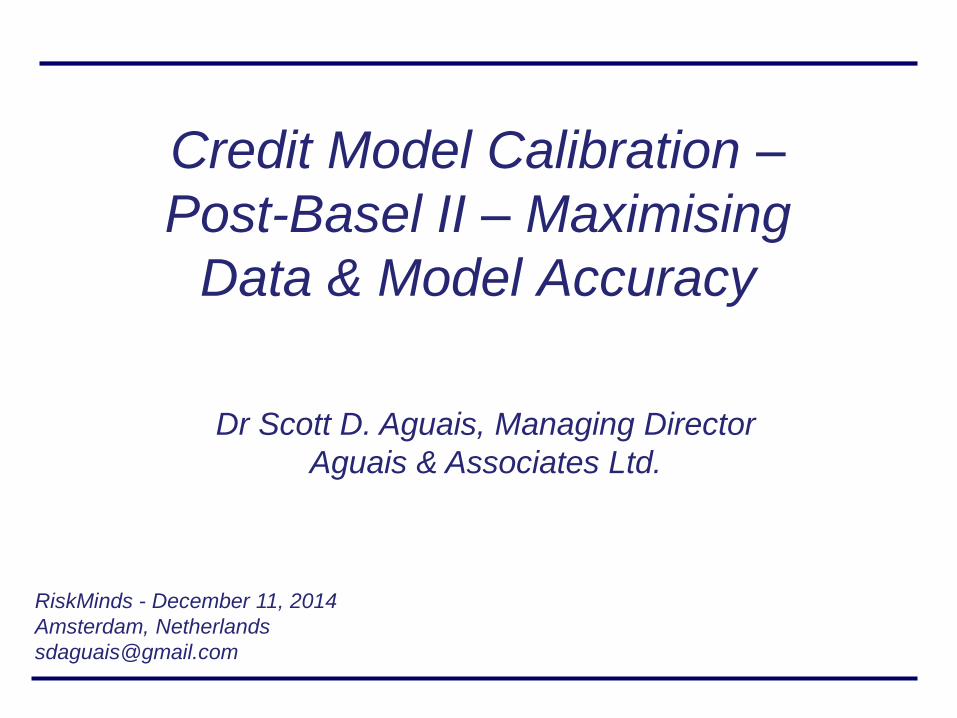
Presentation Overview
Key Presentation Points
1. Aggregate credit & default data to develop/calibrate wholesale credit models & support regulatory capital management remains problematic
2. Industry & regulators moving toward aggregate benchmarking given data limitations – AIRB vs ‘AERB’
3. PD models & benchmarks have tended to exhibit over-prediction or ‘conservatism’ in recent years
4. PDs & defaults also exhibit substantial, systematic variation across time –20% of this is predictable motivating Dual Ratings – PIT vs TTC
5. Model development objectives should always focus on developing the most accurate, unbiased predictions relative to observed realisations to support advanced risk management
6. Dual Ratings – support multiple objectives – required for IFRS9 & Stress Testing
3
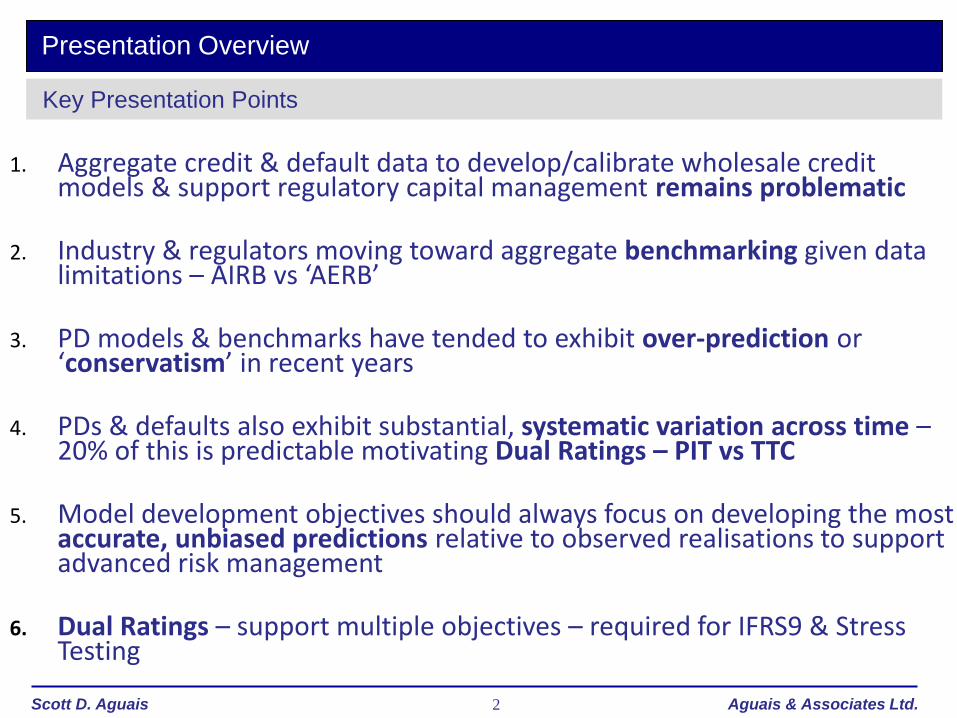
Primary Regulatory & Market Drivers
Dual Ratings & Formal Credit Benchmarking – Represent Evolving Paradigms

4Scott D. Aguais Aguais & Associates Ltd.
Last 25 Years - Credit Risk Data Initiatives & Sources
Use External Agency
Ratings & Default to
Develop Corp PD Models
‘AgencyReplication’
1990s
Credit Benchmark:Initiative to
collect & distribute Bank’s
AIRB PDs
2000s
Market-Based PD ModelsMKMV EDFs
2010 2015 +
PECDCLoan Loss Data Collection ‘By
Banks for Banks’Supports LGDBenchmarking
Credit Derivative MarketsPricing
Risk Neutral PD
AIRB Regulatory
BenchmarkingFSA HPEEBA/FRB
Etc
Basel IISubstantial
focus on collecting &
using Internal Credit Data for ‘Internal’ Model
Calibration
AERB
Dual Ratings & Formal Credit Benchmarking – Represent Evolving Paradigms
5Scott D. Aguais Aguais & Associates Ltd.
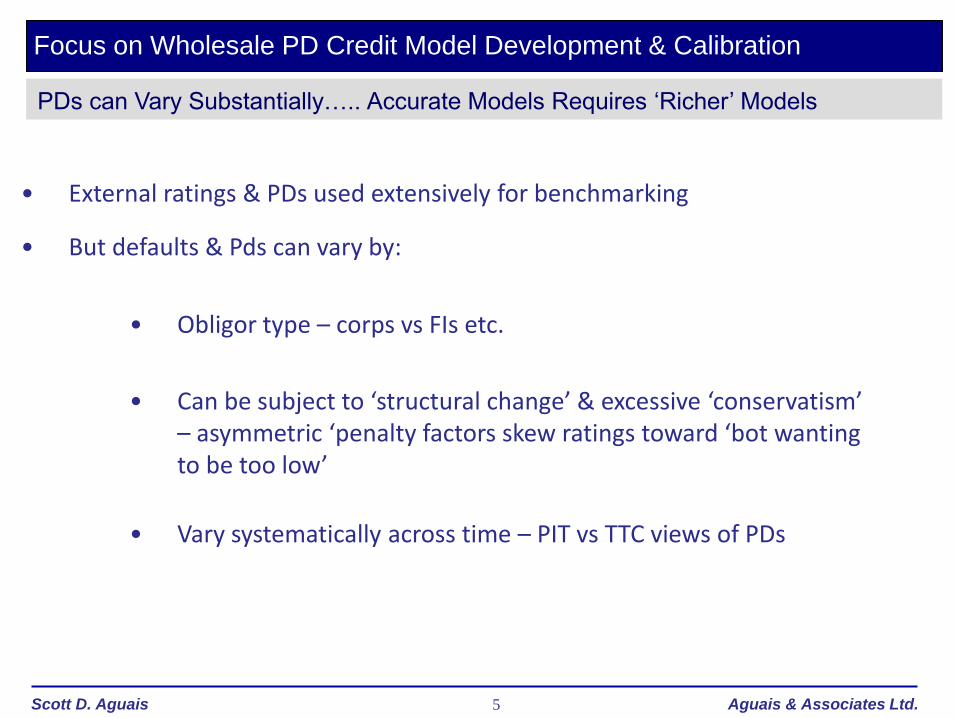
Focus on Wholesale PD Credit Model Development & Calibration
PDs can Vary Substantially….. Accurate Models Requires ‘Richer’ Models
• External ratings & PDs used extensively for benchmarking
• But defaults & Pds can vary by:
• Obligor type – corps vs FIs etc.
• Can be subject to ‘structural change’ & excessive ‘conservatism’ – asymmetric ‘penalty factors skew ratings toward ‘bot wanting to be too low’
• Vary systematically across time – PIT vs TTC views of PDs

6Scott D. Aguais Aguais & Associates Ltd.
Post Basel II Implementation – The ‘Risk-Weight Conundrum’
AIRB Model Calibration – Internal, Limited Model Calibration Data Falls Short
Risk Weight %1
75th Percentile
50th Percentile
25th Percentile
• Regulators are applying model constraints to create comparable risk measures
• Outlying banks need accurate benchmarking to reach the ‘level playing field’ & ‘manage’ regulatory compliance
Bank A
Bank B
Bank C
Bank D
1 Risk Weight is a function of the Client PD & transaction LGD and Maturity
✓
✗✗
✗
CFO requires lower risk weights
Regulator requires higher risk weights
RWs Vary Widely – Under ‘AERB’ - Some Banks Gain, Some Lose

7Scott D. Aguais Aguais & Associates Ltd.
Agency Default Rates Vary by Obligor Type – Use of Different Underlying Curves
An ‘A’ is not an ‘A’ is not an ‘A’…..
• Models can replicate alphabet ratings by calibrating to agency default rates –which are different for different obligor types !
• ‘Regulatory friendly’ given 20 year time series = ‘long run’
• But most banks calibrate PD models to a single global curve
Implied1yr PD
100%
AAA AA+ AA AA- A+ A A- BBB+ BBB BBB- BB+ BB BB- B+ B B- CCC+ CCC CCC- CC+ CC CC- D
Non Bank FIsBanks Corporates
Sovereigns
Observed Defaults Vary Across Obligor Types
8
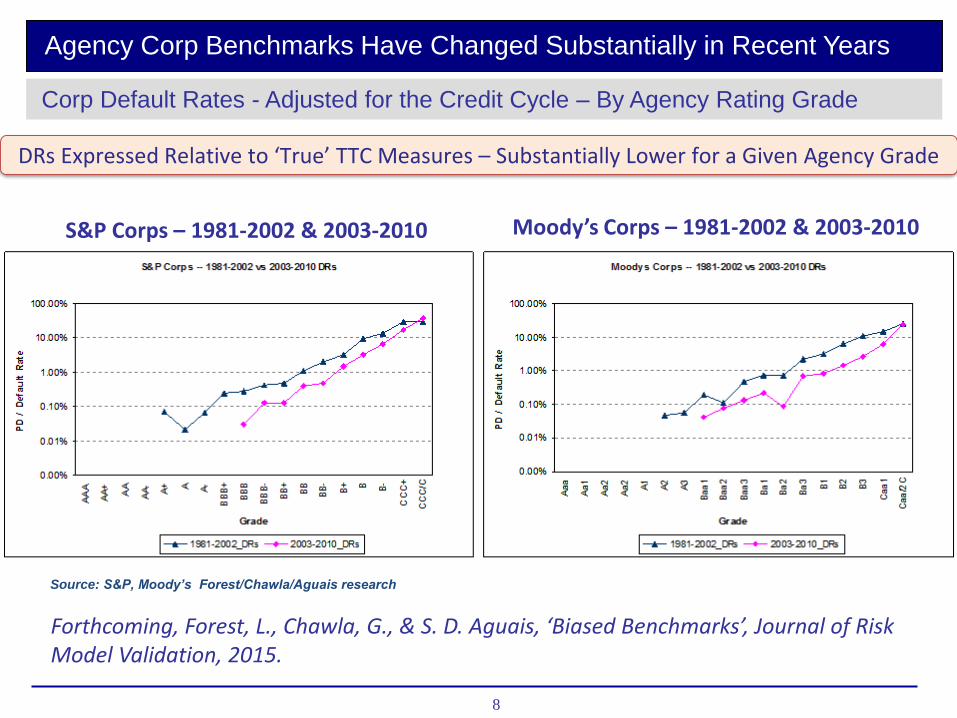
Agency Corp Benchmarks Have Changed Substantially in Recent Years
DRs Expressed Relative to ‘True’ TTC Measures – Substantially Lower for a Given Agency Grade
S&P Corps – 1981-2002 & 2003-2010
Corp Default Rates - Adjusted for the Credit Cycle – By Agency Rating Grade
Moody’s Corps – 1981-2002 & 2003-2010
Forthcoming, Forest, L., Chawla, G., & S. D. Aguais, ‘Biased Benchmarks’, Journal of Risk Model Validation, 2015.
Source: S&P, Moody’s Forest/Chawla/Aguais research
9Scott D. Aguais Aguais & Associates Ltd.
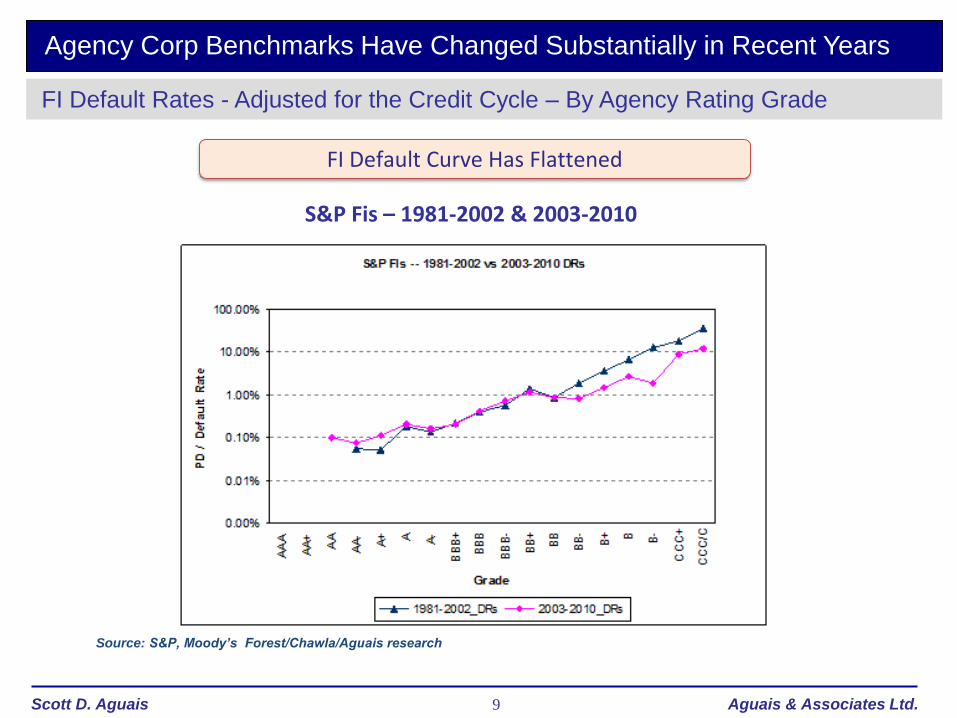
S&P Fis – 1981-2002 & 2003-2010
Agency Corp Benchmarks Have Changed Substantially in Recent Years
FI Default Rates - Adjusted for the Credit Cycle – By Agency Rating Grade
FI Default Curve Has Flattened
Source: S&P, Moody’s Forest/Chawla/Aguais research
10Scott D. Aguais Aguais & Associates Ltd.
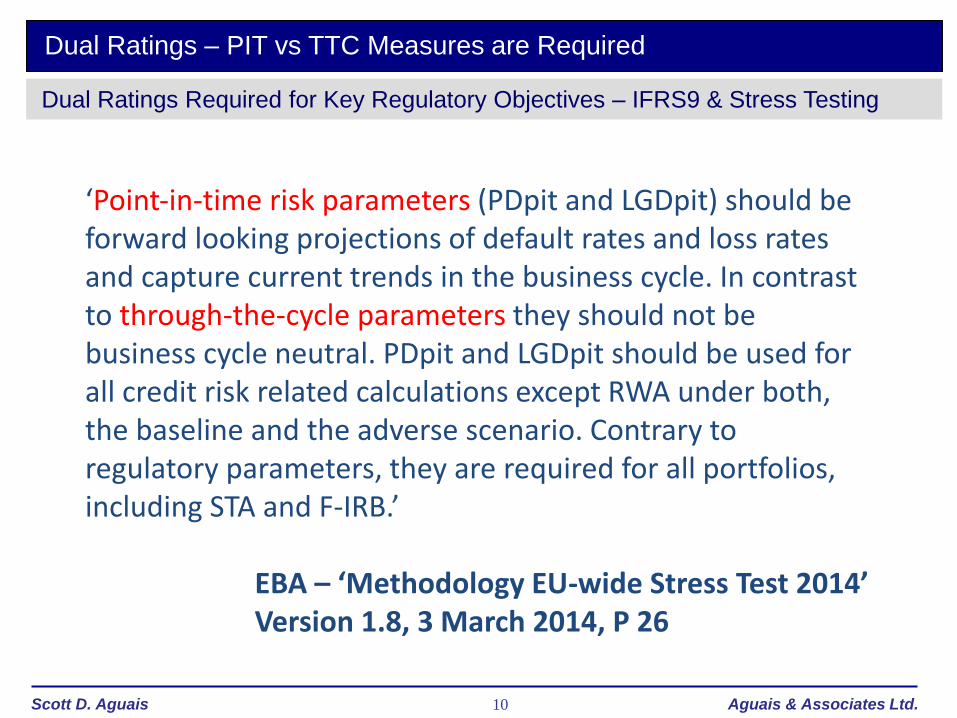
Dual Ratings Required for Key Regulatory Objectives – IFRS9 & Stress Testing
‘Point‐in‐time risk parameters (PDpit and LGDpit) should be forward looking projections of default rates and loss rates and capture current trends in the business cycle. In contrast to through‐the‐cycle parameters they should not be business cycle neutral. PDpit and LGDpit should be used for all credit risk related calculations except RWA under both, the baseline and the adverse scenario. Contrary to regulatory parameters, they are required for all portfolios, including STA and F‐IRB.’
EBA – ‘Methodology EU-wide Stress Test 2014’Version 1.8, 3 March 2014, P 26
Dual Ratings – PIT vs TTC Measures are Required

11
Dual Ratings – PIT vs TTC Measures are Required
-3.0
-2.0
-1.0
0.0
1.0
2.0
3.0
Z-G
ap
NA Corp Z Credit
Index
Legacy Credit
Models
Predicted by Credit-
Cycle Model
Legacy Credit
Models
Predicted by Credit-
Cycle model
Legacy Credit
Models
1990 20091998 1999 2001 2002 2007 2011-3.0
-2.0
-1.0
0.0
1.0
2.0
3.0
Z-G
ap
NA Corp Z Credit
Index
Legacy Credit
Models
Predicted by Credit-
Cycle Model
Legacy Credit
Models
Predicted by Credit-
Cycle model
Legacy Credit
Models
Predicted by Credit-
Cycle model
Legacy Credit
Models
1990 20091998 1999 2001 2002 2007 20111990 20091998 1999 2001 2002 2007 2011
Source: Moody’s KMV,
Current Credit Models Are Blind to Credit Cycles – 20% Prediction is Therefore Powerful
A Systematic Component of Credit Cycles is Predicable – By Industry & Region
12
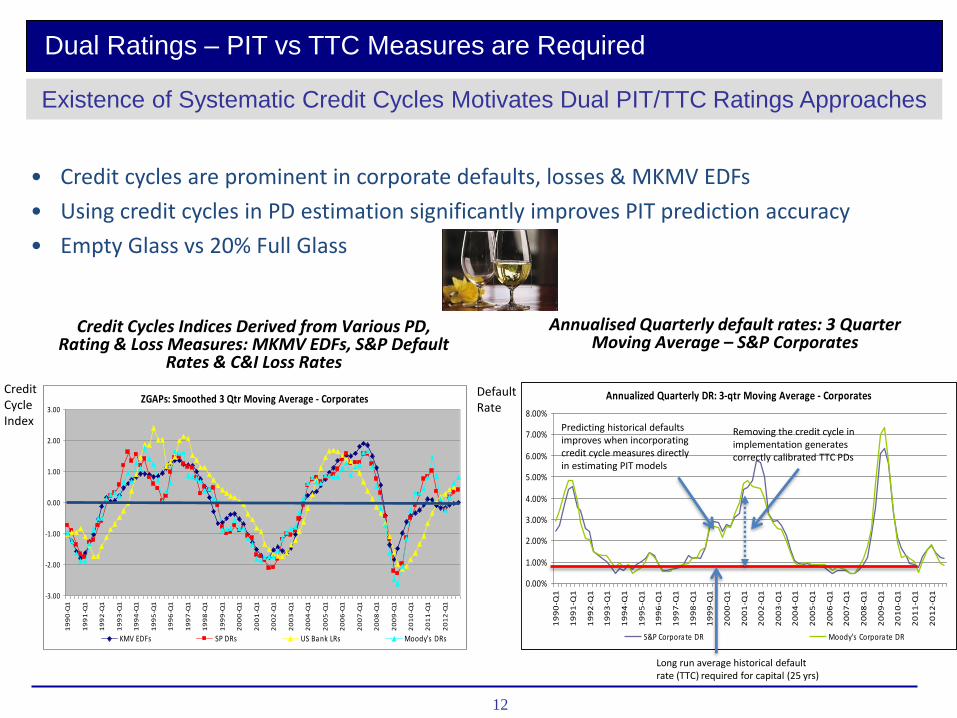
Existence of Systematic Credit Cycles Motivates Dual PIT/TTC Ratings Approaches
• Credit cycles are prominent in corporate defaults, losses & MKMV EDFs
• Using credit cycles in PD estimation significantly improves PIT prediction accuracy
• Empty Glass vs 20% Full Glass
ZGAPs: Smoothed 3 Qtr Moving Average - Corporates
-3.00
-2.00
-1.00
0.00
1.00
2.00
3.00
19
90
-Q1
19
91
-Q1
19
92
-Q1
19
93
-Q1
19
94
-Q1
19
95
-Q1
19
96
-Q1
19
97
-Q1
19
98
-Q1
19
99
-Q1
20
00
-Q1
20
01
-Q1
20
02
-Q1
20
03
-Q1
20
04
-Q1
20
05
-Q1
20
06
-Q1
20
07
-Q1
20
08
-Q1
20
09
-Q1
20
10
-Q1
20
11
-Q1
20
12
-Q1
KMV EDFs SP DRs US Bank LRs Moody's DRs
Credit Cycles Indices Derived from Various PD, Rating & Loss Measures: MKMV EDFs, S&P Default
Rates & C&I Loss Rates
Annualised Quarterly default rates: 3 Quarter Moving Average – S&P Corporates
Annualized Quarterly DR: 3-qtr Moving Average - Corporates
0.00%
1.00%
2.00%
3.00%
4.00%
5.00%
6.00%
7.00%
8.00%
19
90
-Q1
19
91
-Q1
19
92
-Q1
19
93
-Q1
19
94
-Q1
19
95
-Q1
19
96
-Q1
19
97
-Q1
19
98
-Q1
19
99
-Q1
20
00
-Q1
20
01
-Q1
20
02
-Q1
20
03
-Q1
20
04
-Q1
20
05
-Q1
20
06
-Q1
20
07
-Q1
20
08
-Q1
20
09
-Q1
20
10
-Q1
20
11
-Q1
20
12
-Q1
S&P Corporate DR Moody's Corporate DR
Default Rate
Predicting historical defaults improves when incorporating credit cycle measures directly in estimating PIT models
Removing the credit cycle in implementation generates correctly calibrated TTC PDs
Long run average historical default rate (TTC) required for capital (25 yrs)
CreditCycleIndex
Dual Ratings – PIT vs TTC Measures are Required
13Scott D. Aguais Aguais & Associates Ltd.
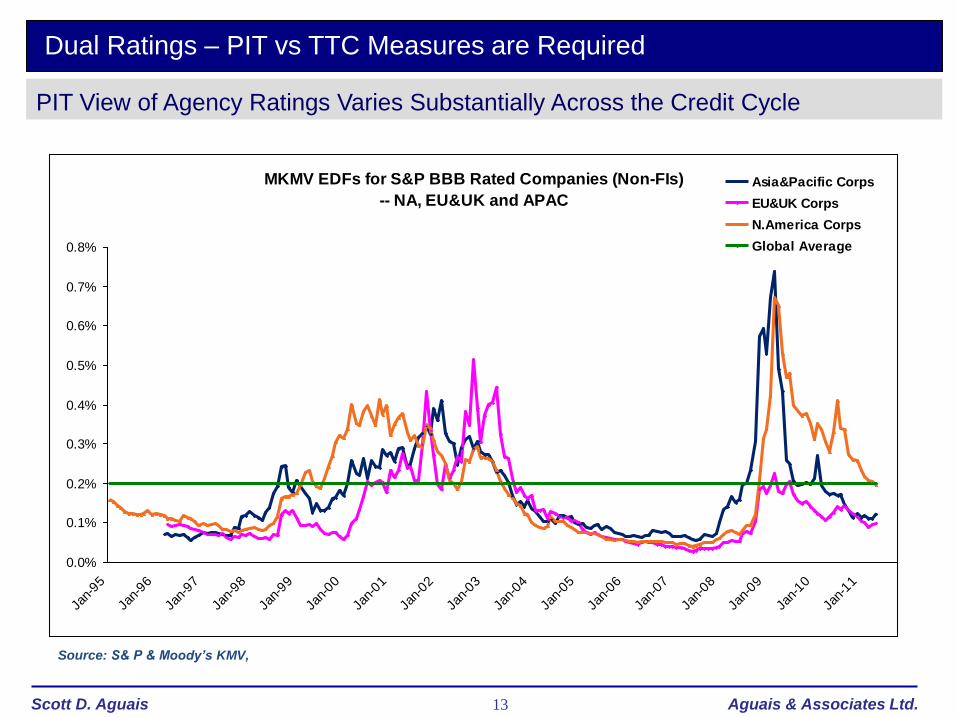
PIT View of Agency Ratings Varies Substantially Across the Credit Cycle
MKMV EDFs for S&P BBB Rated Companies (Non-FIs)
-- NA, EU&UK and APAC
0.0%
0.1%
0.2%
0.3%
0.4%
0.5%
0.6%
0.7%
0.8%
Jan-
95
Jan-
96
Jan-
97
Jan-
98
Jan-
99
Jan-
00
Jan-
01
Jan-
02
Jan-
03
Jan-
04
Jan-
05
Jan-
06
Jan-
07
Jan-
08
Jan-
09
Jan-
10
Jan-
11
Asia&Pacific Corps
EU&UK Corps
N.America Corps
Global Average
Dual Ratings – PIT vs TTC Measures are Required
Source: S& P & Moody’s KMV,
14
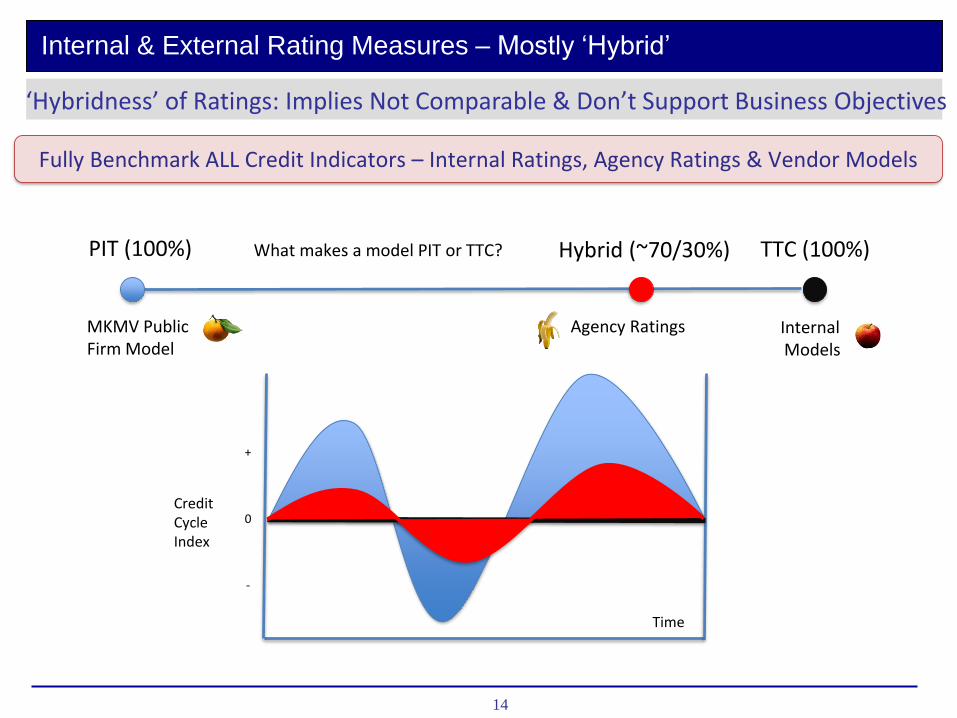
Internal & External Rating Measures – Mostly ‘Hybrid’
‘Hybridness’ of Ratings: Implies Not Comparable & Don’t Support Business Objectives
Time
CreditCycleIndex
0
+
-
PIT (100%)
Internal Models
TTC (100%)Hybrid (~70/30%)
Agency RatingsMKMV Public Firm Model
What makes a model PIT or TTC?
Fully Benchmark ALL Credit Indicators – Internal Ratings, Agency Ratings & Vendor Models
15
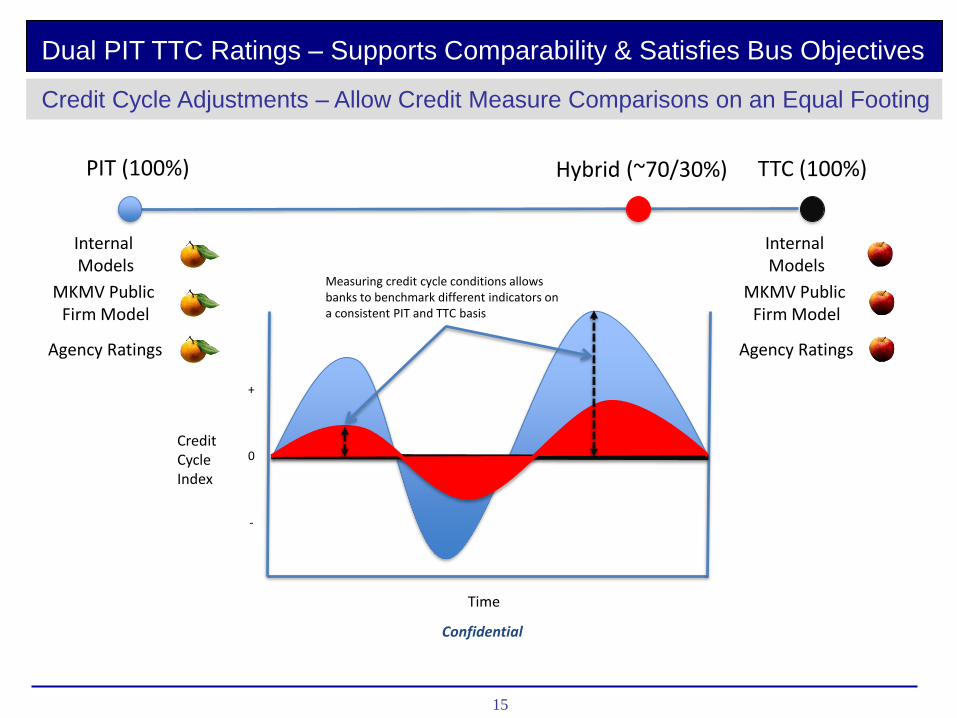
Dual PIT TTC Ratings – Supports Comparability & Satisfies Bus Objectives
Credit Cycle Adjustments – Allow Credit Measure Comparisons on an Equal Footing
Time
CreditCycleIndex
PIT (100%)
Internal Models
Agency Ratings
MKMV Public Firm Model
TTC (100%)Hybrid (~70/30%)
Measuring credit cycle conditions allows banks to benchmark different indicators on a consistent PIT and TTC basis
0
+
-
Internal Models
Agency Ratings
MKMV Public Firm Model
Confidential
16
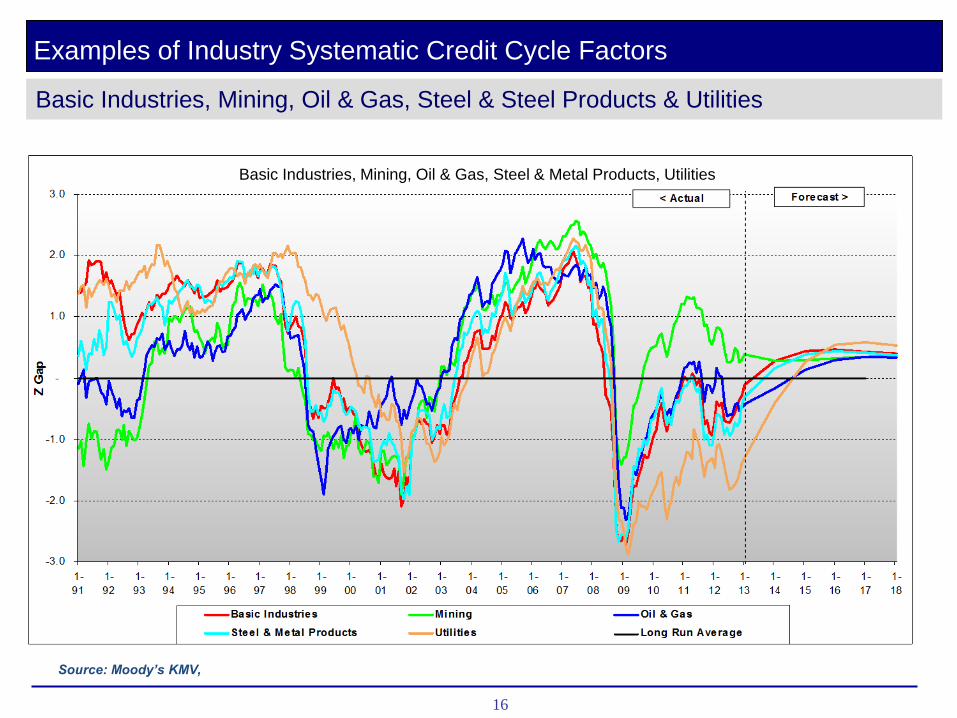
Examples of Industry Systematic Credit Cycle Factors
Basic Industries, Mining, Oil & Gas, Steel & Steel Products & Utilities
Basic Industries, Mining, Oil & Gas, Steel & Metal Products, Utilities
Source: Moody’s KMV,
17
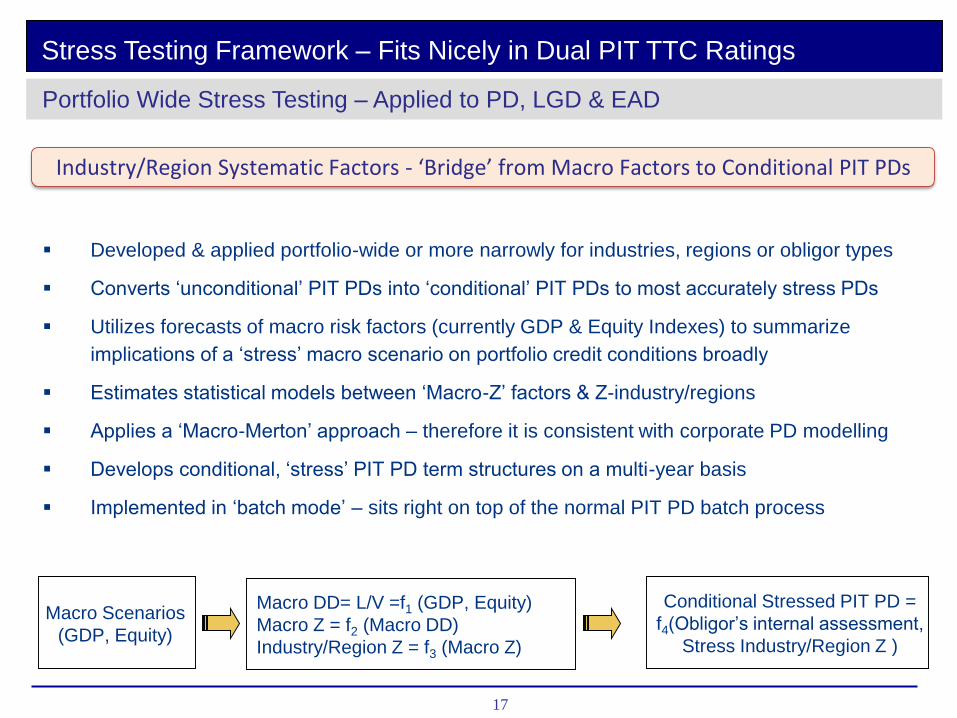
Portfolio Wide Stress Testing – Applied to PD, LGD & EAD
Stress Testing Framework – Fits Nicely in Dual PIT TTC Ratings
Conditional Stressed PIT PD =
f4(Obligor’s internal assessment,
Stress Industry/Region Z )
Macro DD= L/V =f1 (GDP, Equity)
Macro Z = f2 (Macro DD)
Industry/Region Z = f3 (Macro Z)
Macro Scenarios
(GDP, Equity)
Industry/Region Systematic Factors - ‘Bridge’ from Macro Factors to Conditional PIT PDs
Developed & applied portfolio-wide or more narrowly for industries, regions or obligor types
Converts ‘unconditional’ PIT PDs into ‘conditional’ PIT PDs to most accurately stress PDs
Utilizes forecasts of macro risk factors (currently GDP & Equity Indexes) to summarize
implications of a ‘stress’ macro scenario on portfolio credit conditions broadly
Estimates statistical models between ‘Macro-Z’ factors & Z-industry/regions
Applies a ‘Macro-Merton’ approach – therefore it is consistent with corporate PD modelling
Develops conditional, ‘stress’ PIT PD term structures on a multi-year basis
Implemented in ‘batch mode’ – sits right on top of the normal PIT PD batch process

18Scott D. Aguais Aguais & Associates Ltd.
History & Stress Simulation for UK Macro ‘Z’ – Two Different Stress Scenarios
Stress Testing Framework – Fits Nicely in Dual PIT TTC Ratings
Portfolio Stress Tests – Conditional ‘Stress’ PIT Measures – Macro/Industry/Regions/Obligors
19Scott D. Aguais Aguais & Associates Ltd.
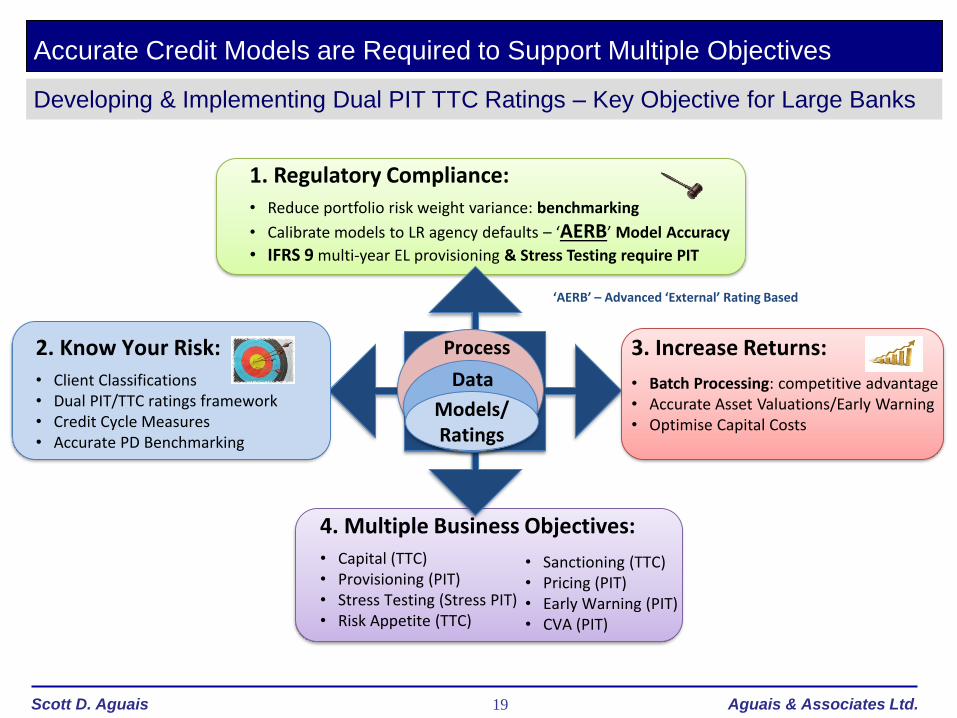
Accurate Credit Models are Required to Support Multiple Objectives
Developing & Implementing Dual PIT TTC Ratings – Key Objective for Large Banks
4. Multiple Business Objectives:
• Capital (TTC)• Provisioning (PIT)• Stress Testing (Stress PIT)• Risk Appetite (TTC)
• Sanctioning (TTC)• Pricing (PIT)• Early Warning (PIT)• CVA (PIT)
Models/Ratings
Data
Process
1. Regulatory Compliance:
• Reduce portfolio risk weight variance: benchmarking
• Calibrate models to LR agency defaults – ‘AERB’ Model Accuracy
• IFRS 9 multi-year EL provisioning & Stress Testing require PIT
3. Increase Returns:
• Batch Processing: competitive advantage• Accurate Asset Valuations/Early Warning• Optimise Capital Costs
2. Know Your Risk:
• Client Classifications• Dual PIT/TTC ratings framework• Credit Cycle Measures• Accurate PD Benchmarking
‘AERB’ – Advanced ‘External’ Rating Based
20Scott D. Aguais Aguais & Associates Ltd.
Presentation Summary
Revisiting Key Presentation Points
1. Aggregate credit & default data to develop/calibrate wholesale credit models & support regulatory capital management remains problematic
2. Industry & regulators moving toward aggregate benchmarking given data limitations – AIRB vs ‘AERB’
3. PD models & benchmarks have tended to exhibit over-prediction or ‘conservatism’ in recent years
4. PDs & defaults also exhibit substantial, systematic variation across time –20% of this is predictable motivating Dual Ratings – PIT vs TTC
5. Model development objectives should always focus on developing the most accurate, unbiased predictions relative to observed realisations to support advanced risk management
6. Dual Ratings – support multiple objectives – required for IFRS9 & Stress Testing