Embed Size (px)
Citation preview

Credit investorpresentationAugust 2017

© Metso© Metso2
IMPORTANT: You must read the following before continuing. The following applies to this document, the oral presentation of the information in this document by Metso Corporation (the “Company”) or any person on behalf of the Company, and
any question-and-answer session that follows the oral presentation (collectively, the “Information”). In accessing the Information, you agree to be bound by the following terms and conditions.
The Information may not be reproduced, redistributed, published or passed on to any other person, directly or indirectly, in whole or in part, for any purpose. If this document has been received in error, it must be returned immediately to the
Company. The Information is not directed to, or intended for distribution to or use by, any person or entity that is a citizen or resident of, or located in, any locality, state, country or other jurisdiction where such distribution or use would be
contrary to law or regulation or which would require any registration or licensing within such jurisdiction. The Information is not for publication, release or distribution in the United States, the United Kingdom, Japan or in any other jurisdiction in
which offers or sales would be prohibited by applicable law.
This document and its contents may not be viewed by persons within the United States or “U.S. Persons” (as defined in Regulation S under the Securities Act of 1933, as amended (the “Securities Act”)). The offer and sale of the securities
referred to herein (the “Securities”) has not been registered under the Securities Act and the Securities may not be offered or sold in the United States or to U.S. persons unless so registered, or an exemption from the registration requirements
of the Securities Act is available. The Company does not intend to register any portion of the offering of the Securities in the United States or to conduct a public offering of the Securities in the United States. By accessing the Information, you
represent that you are a non-U.S. person that is outside the United States.
The Information is directed solely at: (i) persons outside the United Kingdom, (ii) investment professionals specified in Article 19(5) of the Financial Services and Markets Act 2000 (Financial Promotion) Order 2005 as amended (the “Order”), (iii)
high net worth entities, and other persons to whom it may lawfully be communicated, falling within Article 49(2)(a) to (d) of the Order and (iv) persons to whom an invitation or inducement to engage in investment activity (within the meaning of
section 21 of the Financial Services and Markets Act 2000) in connection with the issue or sale of any securities of the Company or any member of its group may otherwise lawfully be communicated or caused to be communicated (all such
persons together being referred to as “Relevant Persons”). Any investment activity to which the Information relates will only be available to and will only be engaged in with Relevant Persons. Any person who is not a Relevant Person should
not act or rely on the Information. By accessing the Information, you represent that you are a Relevant Person.
The Information and the offering of the Securities are only addressed to and directed at persons in member states of the European Economic Area (the “EEA”), who are “Qualified Investors” within the meaning of Article 2(1)(e) of the Prospectus
Directive. The Securities are only available to, and any invitation, offer or agreement to subscribe, purchase or otherwise acquire the Securities will be engaged in only with Qualified Investors. The Information should not be acted upon or relied
upon in any member state of the EEA by persons who are not Qualified Investors. For the purposes of this provision the expression “Prospectus Directive” means Directive 2003/71/EC (and amendments thereto, including the 2010 PD
Amending Directive, to the extent implemented in the Relevant Member State), and includes any relevant implementing measure in the Relevant Member State and the expression “2010 PD Amending Directive” means Directive 2010/73/EU.
The Securities have not been and will not be registered under the Financial Instruments and Exchange Act of Japan (Act No. 25 of 1948), as amended (the “FIEA”). Accordingly, the Information may not be distributed and the Securities may not
be offered or sold, directly or indirectly, in Japan or to, or for the benefit of, a resident of Japan (which term as used herein means any person resident in Japan, including any corporation or other entity organized under the laws of Japan) or to
others for re-offering or resale, directly or indirectly, in Japan or to, or for the benefit of, any resident in Japan, except pursuant to an exemption from the registration requirements of, and otherwise in compliance with, FIEA and other relevant
laws and regulations of Japan.
The Information does not constitute or form part of, and should not be construed as an offer or the solicitation of an offer to subscribe for or purchase any securities of the Company, and nothing contained therein shall form the basis of or be
relied on in connection with any contract or commitment whatsoever, nor does it constitute a recommendation regarding any securities of the Company. Prospective investors are required to make their own independent investigations and
appraisals of the business and financial condition of the Company and the nature of the Securities before taking any investment decision with respect to the Securities.
The Information has been prepared by the Company. Nordea Bank AB (publ), Citigroup Global Markets Limited, Danske Bank A/S and OP Corporate Bank plc (together, the “Co-Dealer Managers”, and together with the Dealer Managers, the
“Dealer Managers”) acting in connection with the offering of the Securities are acting exclusively for the Company and no one else, and will not be responsible for providing advice in connection with the Information to any other party. Subject to
applicable law, none of the Dealer Managers accepts any responsibility whatsoever and makes no representation or warranty, express or implied, for the contents of the Information, including its accuracy, completeness or verification or for any
other statement made or purported to be made in connection with the Company and nothing in this document or at this presentation shall be relied upon as a promise or representation in this respect, whether as to the past or the future. The
Dealer Managers accordingly disclaim all and any liability whatsoever, whether arising in tort, contract or otherwise (save as referred above) which any of them might otherwise have in respect of the Information or any such statement.
The Information contains forward-looking statements. All statements other than statements of historical fact included in the Information are forward-looking statements. Forward-looking statements give the Company’s current expectations and
projections relating to its financial condition, results of operations, plans, objectives, future performance and business. These statements may include, without limitation, any statements preceded by, followed by or including words such as
“target,” “believe,” “expect,” “aim,” “intend,” “may,” “anticipate,” “estimate,” “plan,” “project,” “will,” “can have,” “likely,” “should,” “would,” “could” and other words and terms of similar meaning or the negative thereof. Such forward-looking
statements involve known and unknown risks, uncertainties and other important factors beyond the Company’s control that could cause the Company’s actual results, performance or achievements to be materially different from the expected
results, performance or achievements expressed or implied by such forward-looking statements. Such forward-looking statements are based on numerous assumptions regarding the Company’s present and future business strategies and the
environment in which it will operate in the future.
No representation, warranty or undertaking, express or implied, is made as to, and no reliance should be placed on, the fairness, accuracy, completeness or correctness of the Information or the opinions contained therein. The Information has
not been independently verified and will not be updated. The Information, including but not limited to forward-looking statements, applies only as of the date of this document and is not intended to give any assurances as to future results. The
Company expressly disclaims any obligation or undertaking to disseminate any updates or revisions to the Information, including any financial data or forward-looking statements, and will not publicly release any revisions it may make to the
Information that may result from any change in the Company’s expectations, any change in events, conditions or circumstances on which these forward-looking statements are based, or other events or circumstances arising after the date of
this document. Market data used in the Information not attributed to a specific source are estimates of the Company and has not been independently verified.
Disclaimer
© Metso© Metso
1. Metso in brief & operating environment
2. Business review
3. Financial review
4. Credit rating & financing
Contents
3
© Metso© Metso
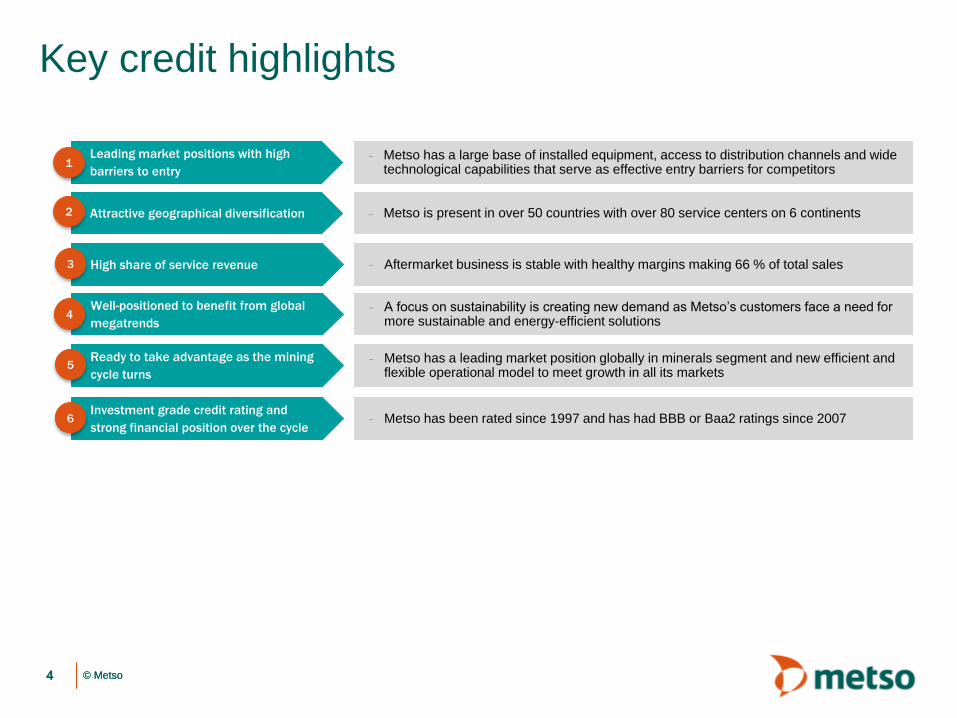
Key credit highlights
4
1
2
Attractive geographical diversification – Metso is present in over 50 countries with over 80 service centers on 6 continents
Well-positioned to benefit from global
megatrends
– A focus on sustainability is creating new demand as Metso’s customers face a need formore sustainable and energy-efficient solutions
– Metso has a large base of installed equipment, access to distribution channels and widetechnological capabilities that serve as effective entry barriers for competitors
Leading market positions with high
barriers to entry
– Metso has been rated since 1997 and has had BBB or Baa2 ratings since 2007Investment grade credit rating and
strong financial position over the cycle
1
6
2
4
Ready to take advantage as the mining
cycle turns
– Metso has a leading market position globally in minerals segment and new efficient andflexible operational model to meet growth in all its markets
5
High share of service revenue – Aftermarket business is stable with healthy margins making 66 % of total sales3
© Metso© Metso
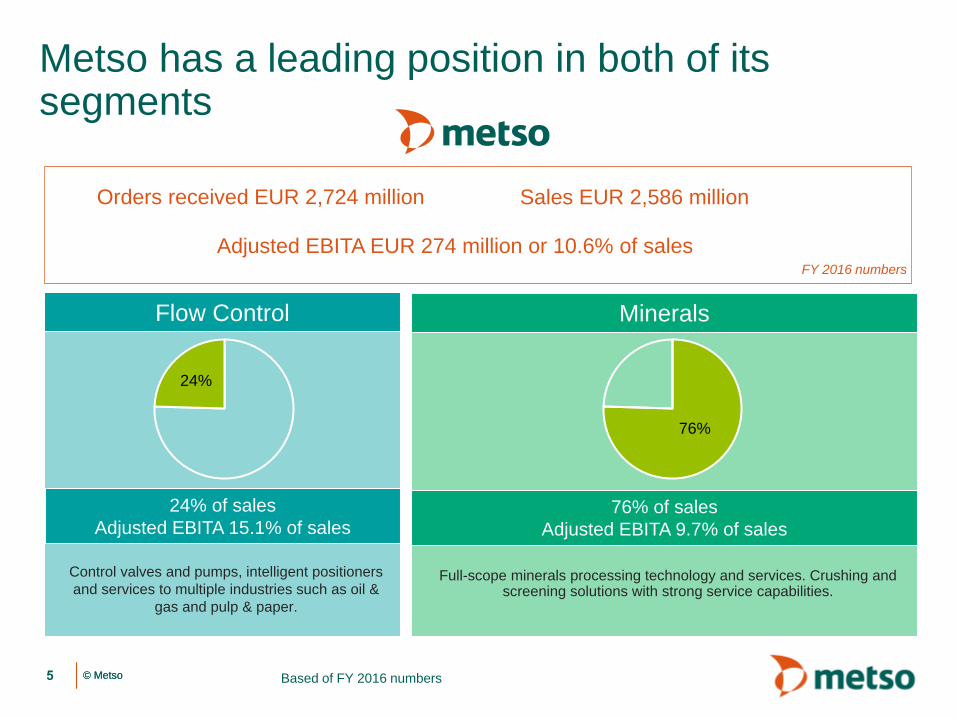
Full-scope minerals processing technology and services. Crushing and screening solutions with strong service capabilities.
Control valves and pumps, intelligent positioners
and services to multiple industries such as oil &
gas and pulp & paper.
Metso has a leading position in both of its segments
Sales EUR 2,586 millionOrders received EUR 2,724 million
Adjusted EBITA EUR 274 million or 10.6% of sales
Based of FY 2016 numbers5
24%
Flow Control Minerals
24% of sales
Adjusted EBITA 15.1% of sales76% of sales
Adjusted EBITA 9.7% of sales
FY 2016 numbers
76%

© Metso© Metso
We are well-positioned in all our customerindustriesOur offering covers services, products and systems for our customer industries
6
Services
Segment Share of orders received Share of order backlog Business drivers
• Declining ore grades require more ore to be
processed
• Increasing demand for sustainable and
energy-efficient solutions
• Increasing demand for digital solutions and
new technologies
• Demand for energy and changes in energy
mix
• Modernization investments
• Drive for more cost-efficient solutions
• New production technologies
• Demand for process safety and uptime
• Increasing focus on sustainability
78%
Minerals
Source: Metso Financial Statements 2016
22%
Flow Control
82%
18%
• Construction industry investments
• Need for total cost-per-ton solutions
© Metso© Metso Source: Metso Financial Statements 20167
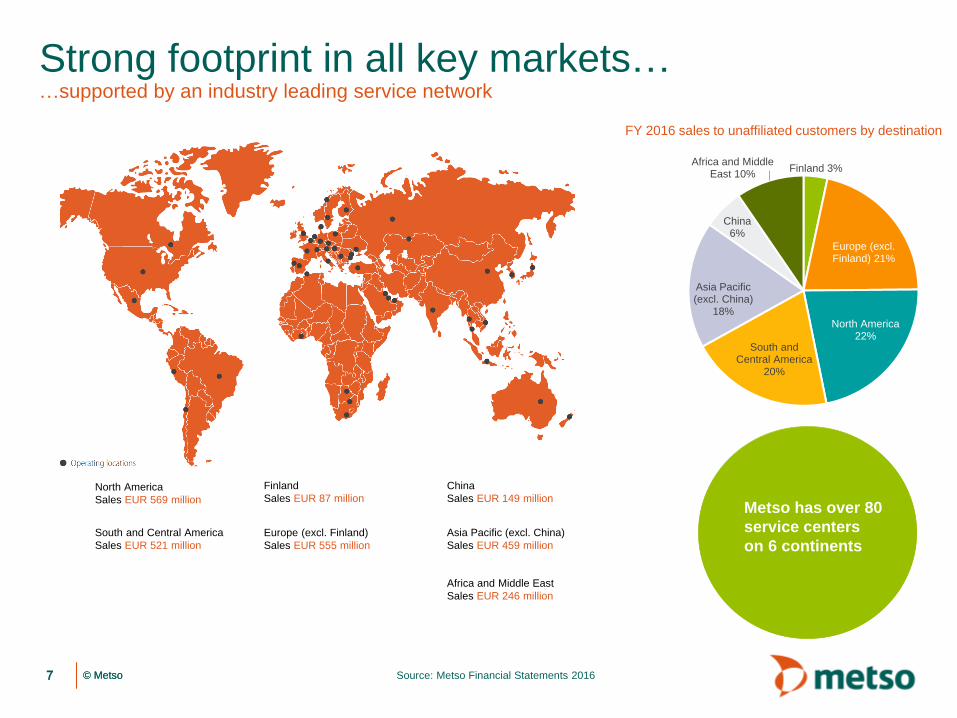
North America
Sales EUR 569 million
Europe (excl. Finland)
Sales EUR 555 million
South and Central America
Sales EUR 521 million
China
Sales EUR 149 million
Africa and Middle East
Sales EUR 246 million
Asia Pacific (excl. China)
Sales EUR 459 million
Strong footprint in all key markets……supported by an industry leading service network
Metso has over 80
service centers
on 6 continents
Finland
Sales EUR 87 million
Finland 3%
Europe (excl. Finland) 21%
North America22%
South and Central America
20%
Asia Pacific (excl. China)
18%
China6%
Africa and Middle East 10%
FY 2016 sales to unaffiliated customers by destination
© Metso© Metso
1. Metso in brief & operating environment
2. Business review
3. Financial review
4. Credit rating & financing
Contents
8
© Metso© Metso
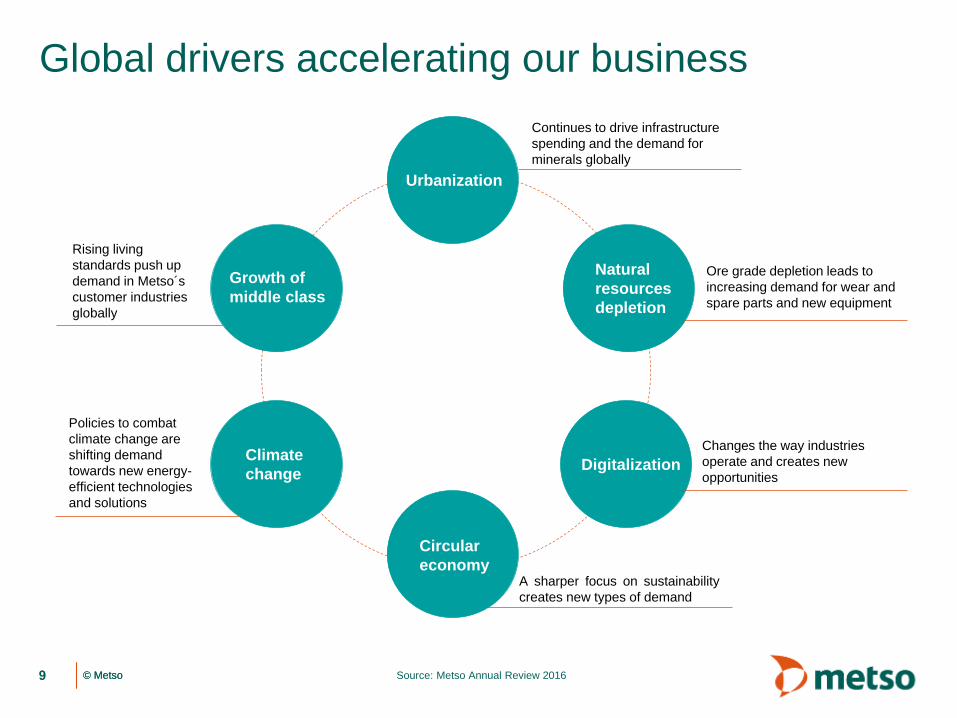
Global drivers accelerating our business
Source: Metso Annual Review 20169
Urbanization
Growth of
middle class
Natural
resources
depletion
Climate
change
Circular
economy
Digitalization
Continues to drive infrastructure
spending and the demand for
minerals globally
Ore grade depletion leads to
increasing demand for wear and
spare parts and new equipment
Changes the way industries
operate and creates new
opportunities
A sharper focus on sustainability
creates new types of demand
Policies to combat
climate change are
shifting demand
towards new energy-
efficient technologies
and solutions
Rising living
standards push up
demand in Metso´s
customer industries
globally
© Metso© Metso
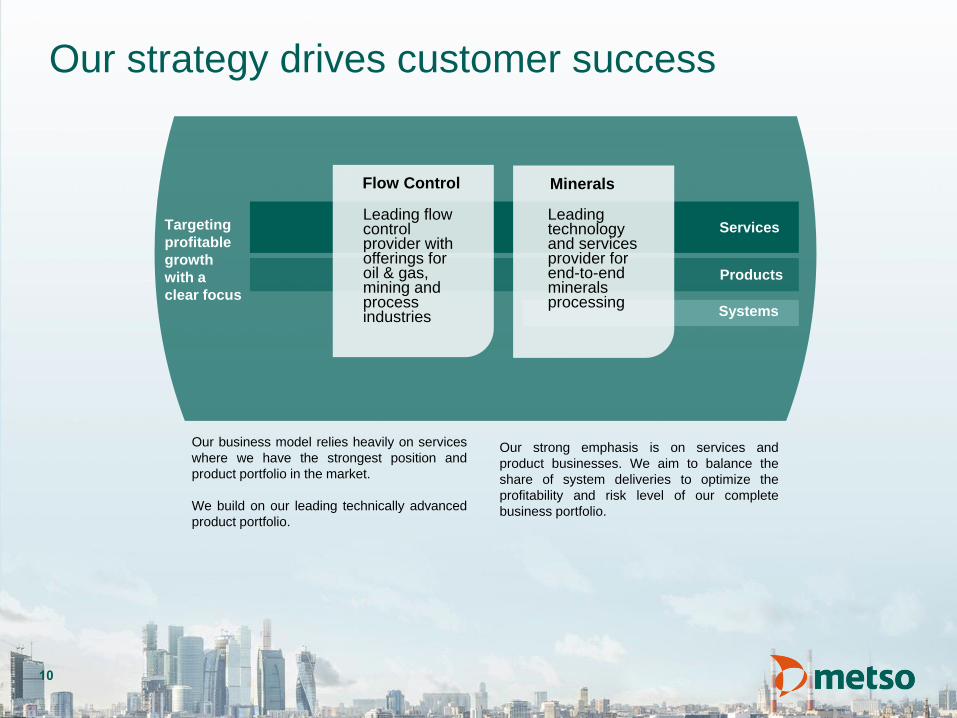
Our strategy drives customer success
10
Systems
Products
Services
MineralsFlow Control
Targeting
profitable
growth
with a
clear focus
Leading flow control provider with offerings for oil & gas, mining and process industries
Leading technology and services provider for end-to-end minerals processing
Our business model relies heavily on services
where we have the strongest position and
product portfolio in the market.
We build on our leading technically advanced
product portfolio.
Our strong emphasis is on services and product businesses. We aim to balance the share of system deliveries to optimize the profitability and risk level of our complete business portfolio.
© Metso© Metso
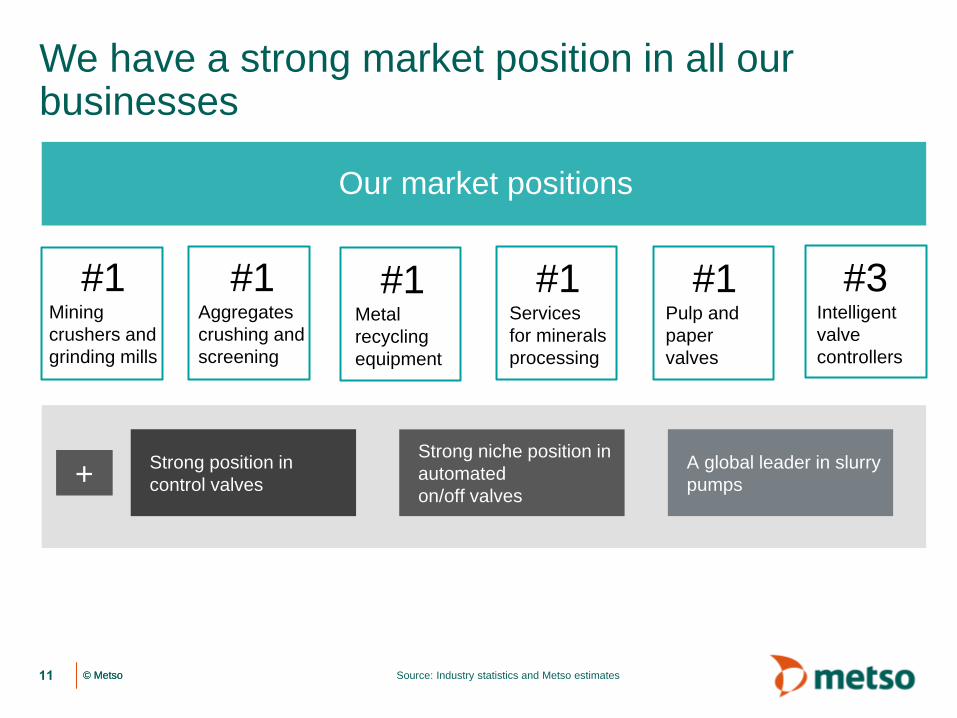
We have a strong market position in all ourbusinesses
Source: Industry statistics and Metso estimates11
Strong niche position in
automated
on/off valves
A global leader in slurry
pumps
Strong position in
control valves+
#1Mining
crushers and
grinding mills
#1Aggregates
crushing and
screening
#1Metal
recycling
equipment
#1Services
for minerals
processing
#3Intelligent
valve
controllers
#1Pulp and
paper
valves
Our market positions
© Metso© Metso
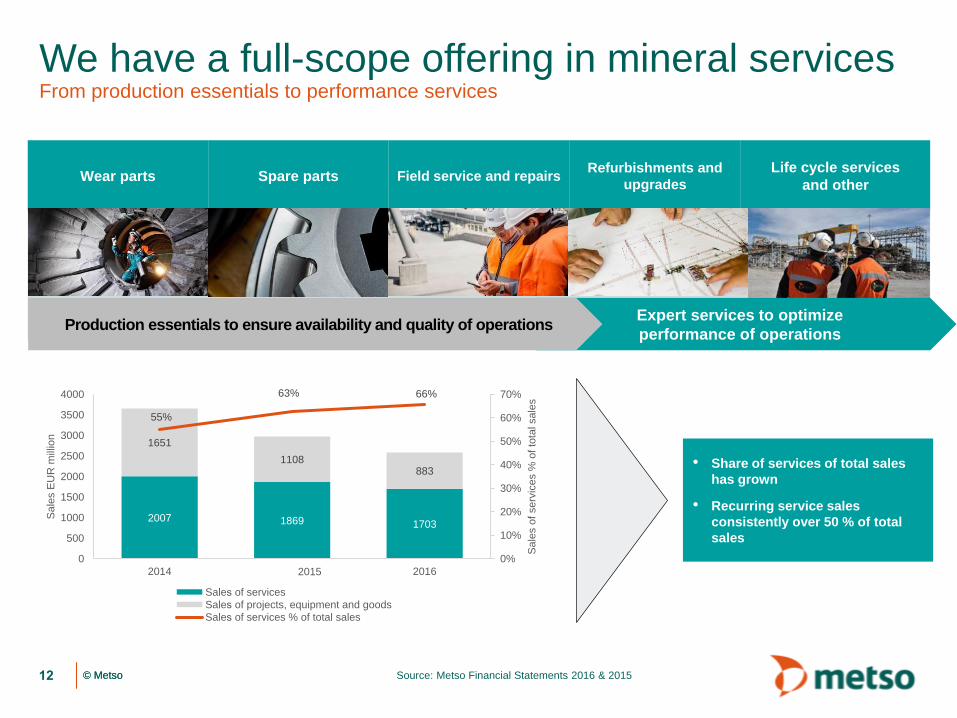
We have a full-scope offering in mineral servicesFrom production essentials to performance services
Source: Metso Financial Statements 2016 & 2015
Wear parts Spare parts Field service and repairsRefurbishments and
upgrades
Life cycle services
and other
Image of field service
guys
Expert services to optimize
performance of operationsProduction essentials to ensure availability and quality of operations
12
2007 1869 1703
1651
1108883
55%
63% 66%
0%
10%
20%
30%
40%
50%
60%
70%
0
500
1000
1500
2000
2500
3000
3500
4000
2014 2016
Sale
s o
f serv
ices %
of to
tal sale
s
Sale
s E
UR
mill
ion
2015
Sales of services
Sales of projects, equipment and goods Sales of services % of total sales
• Share of services of total sales
has grown
• Recurring service sales
consistently over 50 % of total
sales
© Metso13
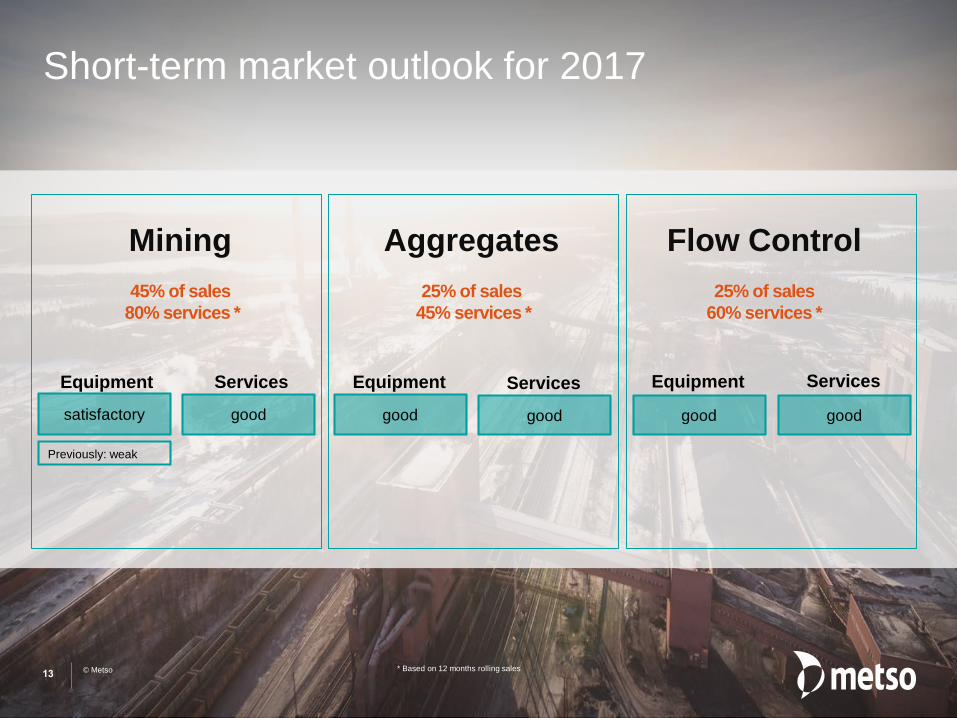
Short-term market outlook for 2017
Mining
45% of sales
80% services *
Aggregates
25% of sales
45% services *
Flow Control
25% of sales
60% services *
satisfactory good good good good
Equipment Equipment Equipment ServicesServicesServices
Previously: weak
* Based on 12 months rolling sales
good
© Metso© Metso
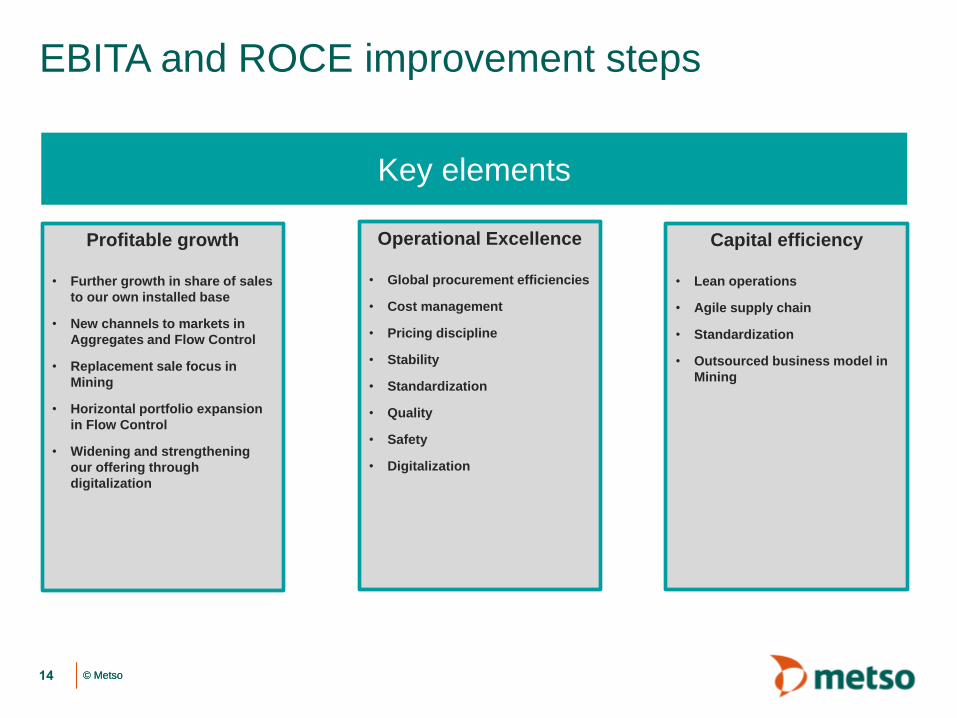
EBITA and ROCE improvement steps
14
Key elements
Operational Excellence
• Global procurement efficiencies
• Cost management
• Pricing discipline
• Stability
• Standardization
• Quality
• Safety
• Digitalization
Capital efficiency
• Lean operations
• Agile supply chain
• Standardization
• Outsourced business model in
Mining
Profitable growth
• Further growth in share of sales
to our own installed base
• New channels to markets in
Aggregates and Flow Control
• Replacement sale focus in
Mining
• Horizontal portfolio expansion
in Flow Control
• Widening and strengthening
our offering through
digitalization
© Metso© Metso
1. Metso in brief & operating environment
2. Business review
3. Financial review
4. Credit rating & financing
Contents
15
© Metso© Metso
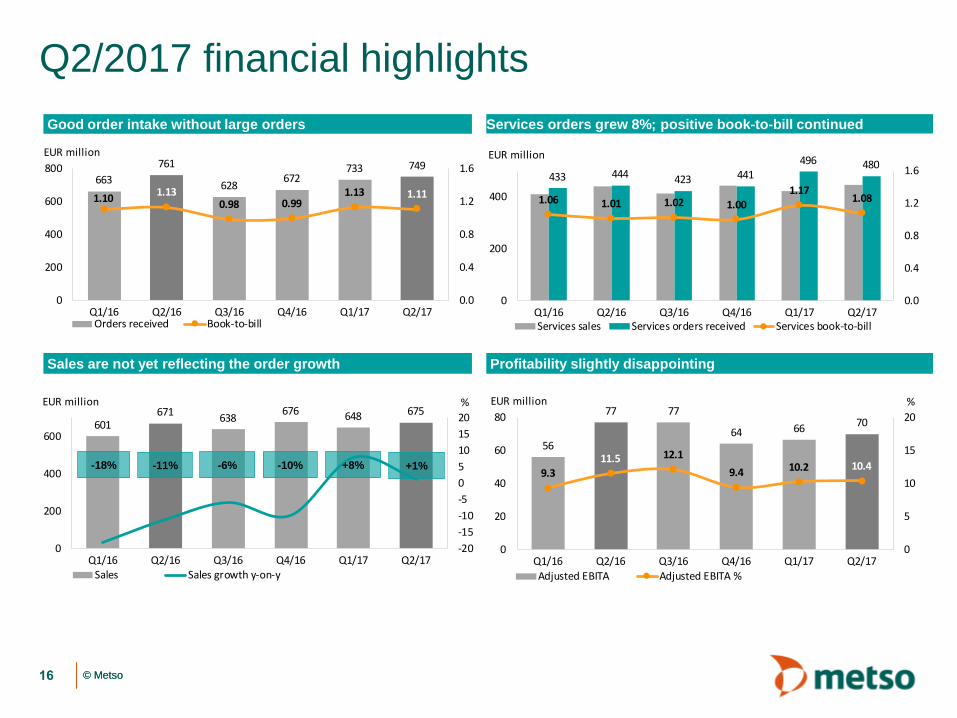
56
77 77
64 66 70
9.311.5 12.1
9.4 10.2 10.4
0
5
10
15
20
0
20
40
60
80
Q1/16 Q2/16 Q3/16 Q4/16 Q1/17 Q2/17
EUR million
Adjusted EBITA Adjusted EBITA %
%
433 444 423 441496 480
1.06 1.01 1.02 1.001.17
1.08
0.0
0.4
0.8
1.2
1.6
0
200
400
Q1/16 Q2/16 Q3/16 Q4/16 Q1/17 Q2/17
EUR million
Services sales Services orders received Services book-to-bill
663761
628 672733 749
1.10 1.130.98 0.99
1.13 1.11
0.0
0.4
0.8
1.2
1.6
0
200
400
600
800
Q1/16 Q2/16 Q3/16 Q4/16 Q1/17 Q2/17
EUR million
Orders received Book-to-bill
601671 638 676 648 675
-20-15-10-505101520
0
200
400
600
Q1/16 Q2/16 Q3/16 Q4/16 Q1/17 Q2/17
EUR million
Sales Sales growth y-on-y
%
Q2/2017 financial highlights
Profitability slightly disappointing
Services orders grew 8%; positive book-to-bill continuedGood order intake without large orders
Sales are not yet reflecting the order growth
-11%-18% -10%-6% +8%
16
+1%
© Metso© Metso
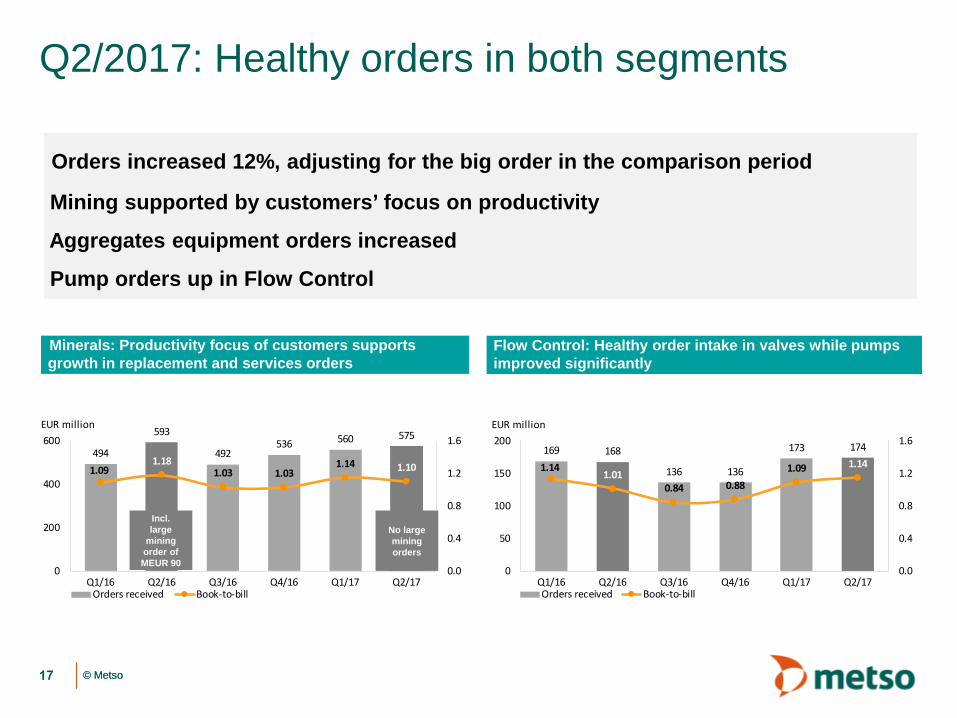
Q2/2017: Healthy orders in both segments
Orders increased 12%, adjusting for the big order in the comparison period
Mining supported by customers’ focus on productivity
Aggregates equipment orders increased
Pump orders up in Flow Control
Minerals: Productivity focus of customers supports
growth in replacement and services orders
Flow Control: Healthy order intake in valves while pumps
improved significantly
17
494
593
492536 560 575
1.091.18
1.03 1.031.14 1.10
0.0
0.4
0.8
1.2
1.6
0
200
400
600
Q1/16 Q2/16 Q3/16 Q4/16 Q1/17 Q2/17
EUR million
Orders received Book-to-bill
169 168
136 136
173 174
1.141.01
0.84 0.881.09 1.14
0.0
0.4
0.8
1.2
1.6
0
50
100
150
200
Q1/16 Q2/16 Q3/16 Q4/16 Q1/17 Q2/17
EUR million
Orders received Book-to-bill
Incl.
large
mining
order of
MEUR 90
No large
mining
orders

© Metso© Metso
37
54 5247
43
55
8.210.8 10.8
9.1 8.910.5
0
5
10
15
20
0
20
40
60
Q1/16 Q2/16 Q3/16 Q4/16 Q1/17 Q2/17
EUR million
Adjusted EBITA Adjusted EBITA %
%
453504 477
522 489523
-20-15-10-505101520
0
200
400
600
Q1/16 Q2/16 Q3/16 Q4/16 Q1/17 Q2/17
EUR million
Minerals Services sales Minerals Equipment salesSales growth y-on-y
%
Minerals Q2: Aggregates’ improvement offset by mining
Sales driven by double-digit growth in aggregates equipment; other businesses flat
Mining services margins affected by higher raw material prices and sales mix
-10%-20% -9%-5% +8%
EUR million Q2/2017 Q2/2016 Change % H1/2017 H1/2016 Change % 2016Orders received 575 593 -3 1,135 1,087 4 2,115
Services orders 370 337 10 756 672 13 1,348Sales 523 504 4 1,012 957 6 1,956
Services sales 347 340 2 673 663 2 1,325Adjusted EBITA 54.9 54.3 1 98.3 91.2 8 190.3
% of sales 10.5 10.8 9.7 9.5 9.7Return on operative capital employed
(ROCE), annualized, % 16.3 14.7 13.4
Personnel at the end of the period 8,567 8,701 -2 8,370
18
+4%

© Metso© Metso
1922
2826 25
1612.8 13.2
17.5 16.6 15.6
10.8
0
5
10
15
20
25
0
10
20
30
Q1/16 Q2/16 Q3/16 Q4/16 Q1/17 Q2/17
EUR million
Adjusted EBITA Adjusted EBITA %
%
148167 161 155 159 152
-20-15-10-505101520
0
50
100
150
200
Q1/16 Q2/16 Q3/16 Q4/16 Q1/17 Q2/17
EUR million
Flow Control Services sales Flow Control Equipment salesSales growth y-on-y
%
Flow Control Q2: First half performance flatwith positive book-to-bill
Sales reflecting H2/16 order intake
Low sales and related under-absorption as well as sales mix impacted profitability
-14%-13% -14%-10% +7%
EUR million Q2/2017 Q2/2016 Change % H1/2017 H1/2016 Change % 2016Orders received 174 168 4 347 337 3 609
Services orders 110 107 3 220 205 7 393Sales 152 167 -9 311 315 -1 631
Services sales 98 99 -1 195 185 5 378Adjusted EBITA 16.4 22.1 -26 41.2 41.1 0 95.0
% of sales 10.8 13.2 13.2 13.0 15.1Return on operative capital employed
(ROCE), annualized, % 25.1 24.9 28.5
Personnel at the end of the period 2,685 2,878 -7 2,663
19
-9%
© Metso© Metso
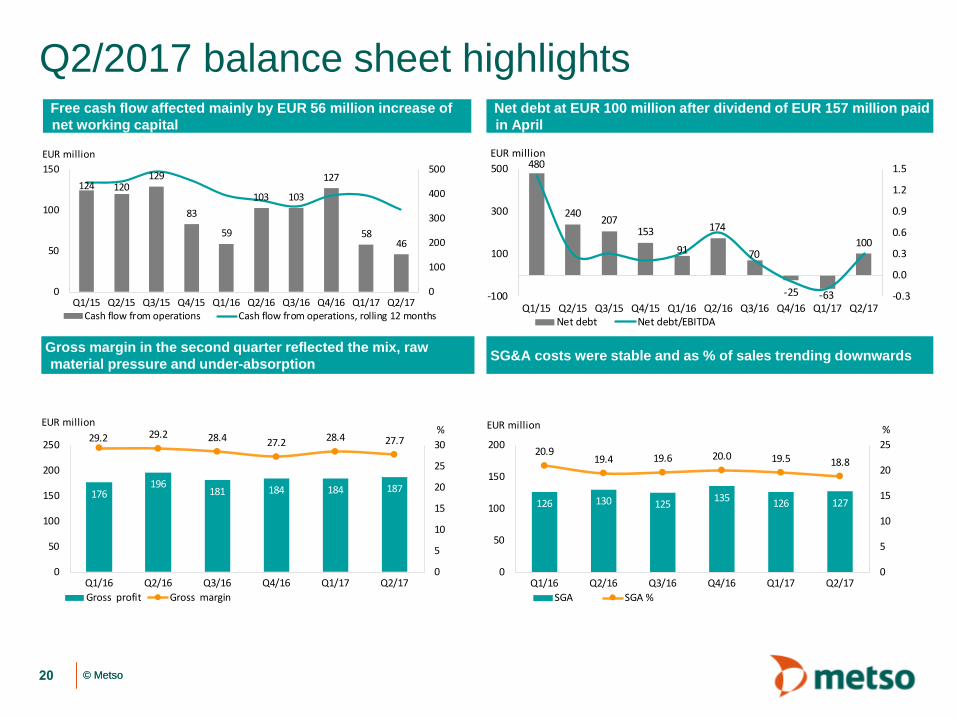
126 130 125 135 126 127
20.919.4 19.6 20.0 19.5 18.8
0
5
10
15
20
25
0
50
100
150
200
Q1/16 Q2/16 Q3/16 Q4/16 Q1/17 Q2/17
EUR million
SGA SGA %
%
176196
181 184 184 187
29.2 29.2 28.4 27.2 28.4 27.7
0
5
10
15
20
25
30
0
50
100
150
200
250
Q1/16 Q2/16 Q3/16 Q4/16 Q1/17 Q2/17
EUR million
Gross profit Gross margin
%
480
240 207153
91
174
70
-25 -63
100
-0.3
0.0
0.3
0.6
0.9
1.2
1.5
-100
100
300
500
Q1/15 Q2/15 Q3/15 Q4/15 Q1/16 Q2/16 Q3/16 Q4/16 Q1/17 Q2/17
EUR million
Net debt Net debt/EBITDA
124 120129
83
59
103 103
127
5846
0
100
200
300
400
500
0
50
100
150
Q1/15 Q2/15 Q3/15 Q4/15 Q1/16 Q2/16 Q3/16 Q4/16 Q1/17 Q2/17
EUR million
Cash flow from operations Cash flow from operations, rolling 12 months
Q2/2017 balance sheet highlights
SG&A costs were stable and as % of sales trending downwards
Net debt at EUR 100 million after dividend of EUR 157 million paid
in April
Free cash flow affected mainly by EUR 56 million increase of
net working capital
Gross margin in the second quarter reflected the mix, raw
material pressure and under-absorption
20
© Metso© Metso
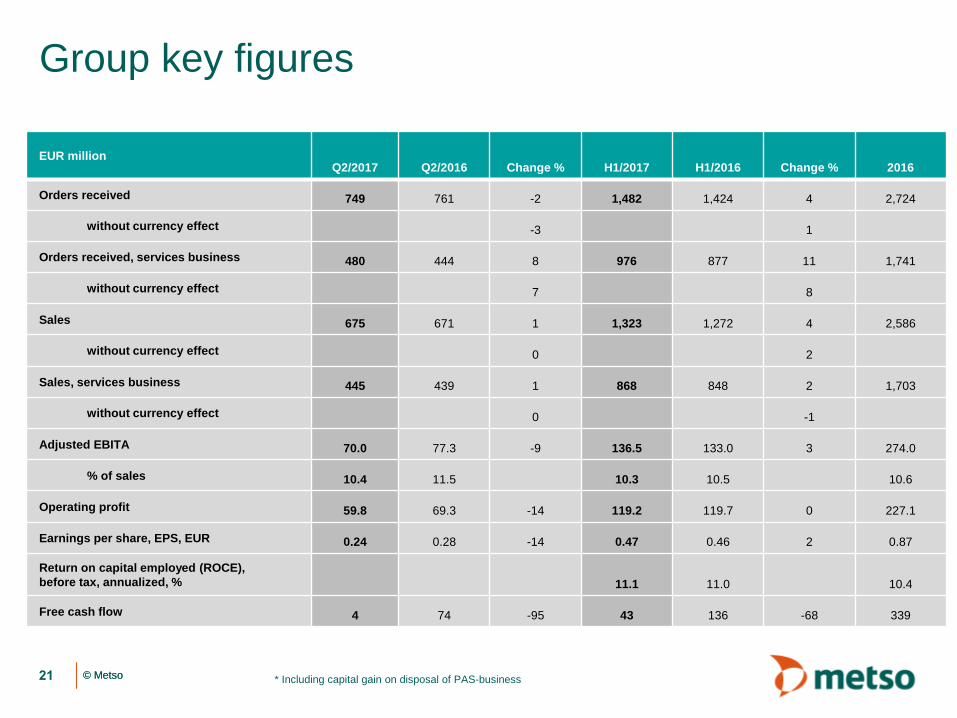
Group key figures
* Including capital gain on disposal of PAS-business21
EUR millionQ2/2017 Q2/2016 Change % H1/2017 H1/2016 Change % 2016
Orders received 749 761 -2 1,482 1,424 4 2,724
without currency effect -3 1
Orders received, services business 480 444 8 976 877 11 1,741
without currency effect 7 8
Sales 675 671 1 1,323 1,272 4 2,586
without currency effect 0 2
Sales, services business 445 439 1 868 848 2 1,703
without currency effect 0 -1
Adjusted EBITA 70.0 77.3 -9 136.5 133.0 3 274.0
% of sales 10.4 11.5 10.3 10.5 10.6
Operating profit 59.8 69.3 -14 119.2 119.7 0 227.1
Earnings per share, EPS, EUR 0.24 0.28 -14 0.47 0.46 2 0.87
Return on capital employed (ROCE),
before tax, annualized, % 11.1 11.0 10.4
Free cash flow 4 74 -95 43 136 -68 339
© Metso© Metso
1. Metso in brief & operating environment
2. Business review
3. Financial review
4. Credit rating & financing
Contents
22
© Metso
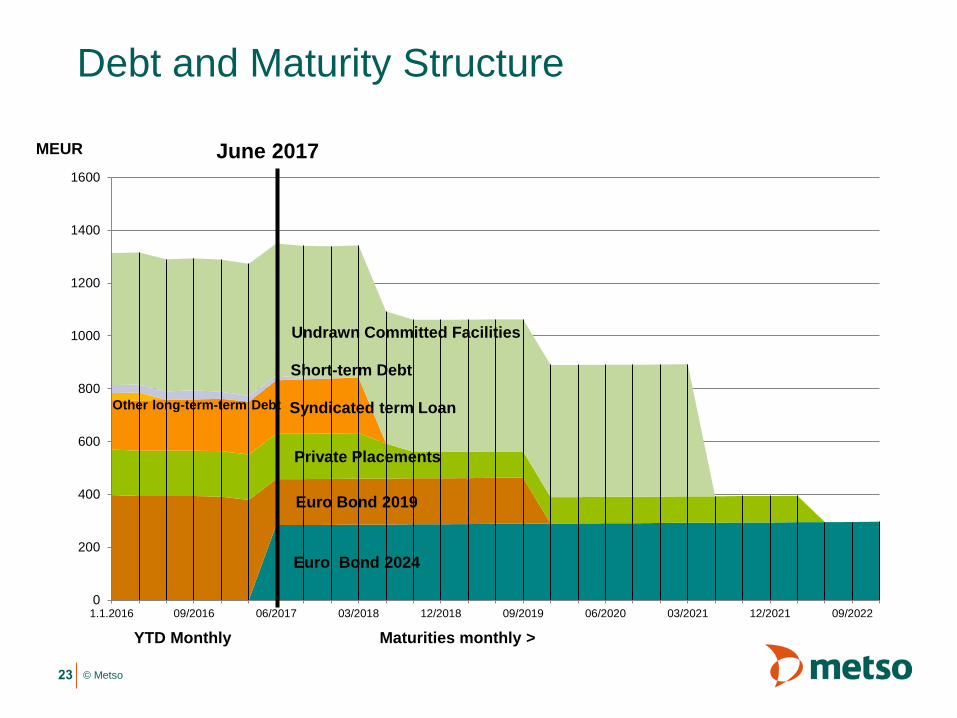
Debt and Maturity Structure
0
200
400
600
800
1000
1200
1400
1600
1.1.2016 09/2016 06/2017 03/2018 12/2018 09/2019 06/2020 03/2021 12/2021 09/2022
23
YTD Monthly Maturities monthly >
June 2017MEUR
Euro Bond 2024
Private Placements
Short-term Debt
Undrawn Committed Facilities
Syndicated term LoanOther long-term-term Debt
Euro Bond 2019
© Metso© Metso
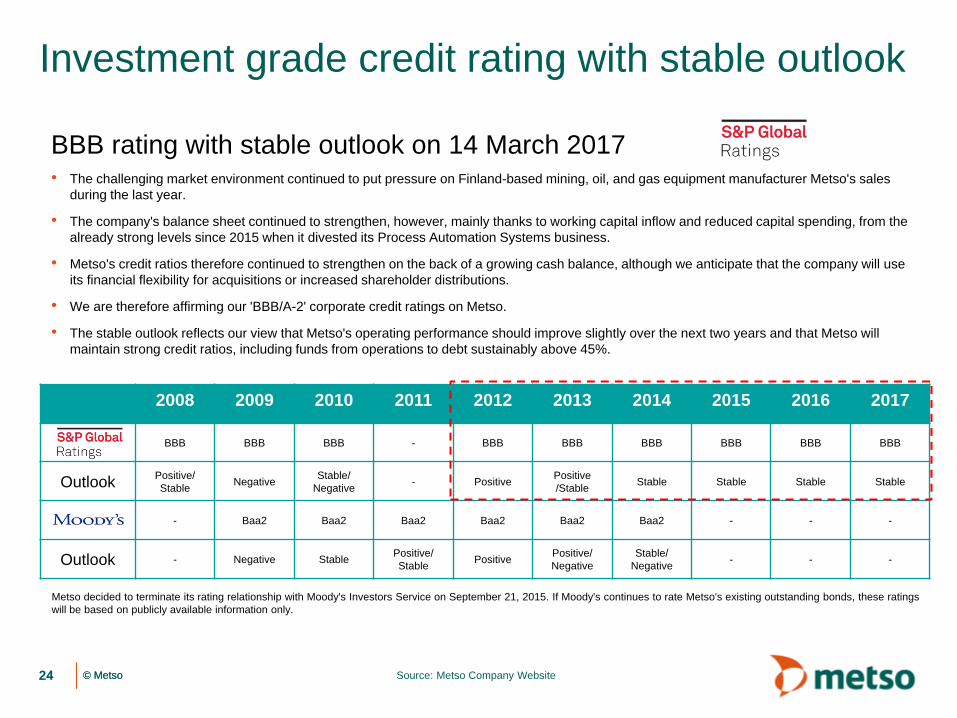
Investment grade credit rating with stable outlook
24 Source: Metso Company Website
BBB rating with stable outlook on 14 March 2017• The challenging market environment continued to put pressure on Finland-based mining, oil, and gas equipment manufacturer Metso's sales
during the last year.
• The company's balance sheet continued to strengthen, however, mainly thanks to working capital inflow and reduced capital spending, from the
already strong levels since 2015 when it divested its Process Automation Systems business.
• Metso's credit ratios therefore continued to strengthen on the back of a growing cash balance, although we anticipate that the company will use
its financial flexibility for acquisitions or increased shareholder distributions.
• We are therefore affirming our 'BBB/A-2' corporate credit ratings on Metso.
• The stable outlook reflects our view that Metso's operating performance should improve slightly over the next two years and that Metso will
maintain strong credit ratios, including funds from operations to debt sustainably above 45%.
2008 2009 2010 2011 2012 2013 2014 2015 2016 2017
BBB BBB BBB - BBB BBB BBB BBB BBB BBB
OutlookPositive/
StableNegative
Stable/
Negative- Positive
Positive
/StableStable Stable Stable Stable
- Baa2 Baa2 Baa2 Baa2 Baa2 Baa2 - - -
Outlook - Negative StablePositive/
StablePositive
Positive/
Negative
Stable/
Negative- - -
Metso decided to terminate its rating relationship with Moody's Investors Service on September 21, 2015. If Moody's continues to rate Metso's existing outstanding bonds, these ratings
will be based on publicly available information only.

© Metso© Metso
Appendix
25
© Metso© Metso
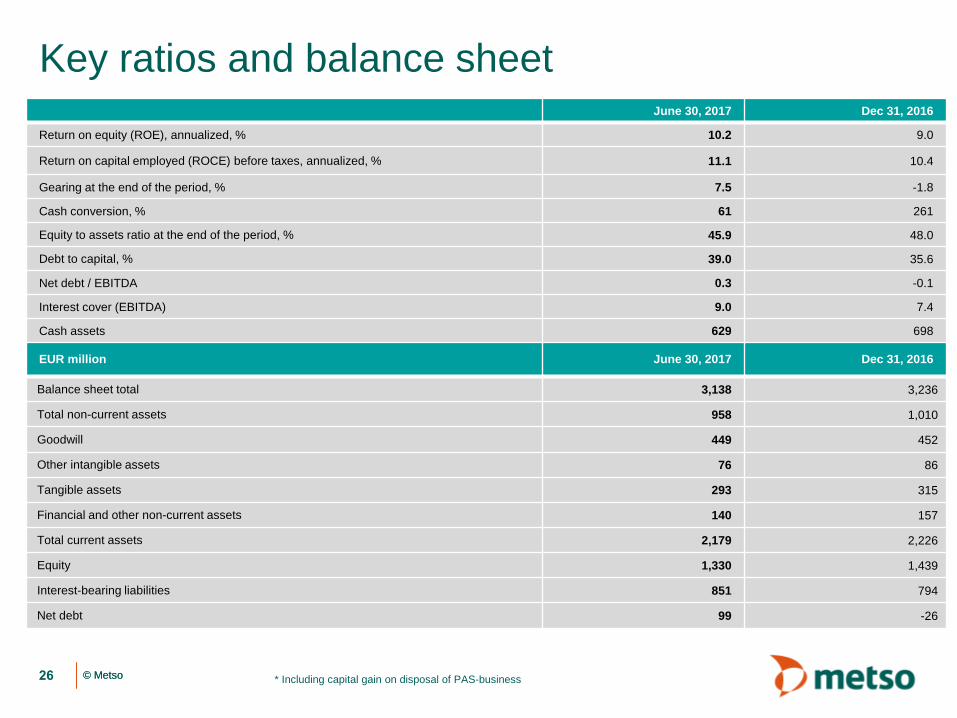
Key ratios and balance sheet
* Including capital gain on disposal of PAS-business
EUR million June 30, 2017 Dec 31, 2016
Balance sheet total 3,138 3,236
Total non-current assets 958 1,010
Goodwill 449 452
Other intangible assets 76 86
Tangible assets 293 315
Financial and other non-current assets 140 157
Total current assets 2,179 2,226
Equity 1,330 1,439
Interest-bearing liabilities 851 794
Net debt 99 -26
26
June 30, 2017 Dec 31, 2016
Return on equity (ROE), annualized, % 10.2 9.0
Return on capital employed (ROCE) before taxes, annualized, % 11.1 10.4
Gearing at the end of the period, % 7.5 -1.8
Cash conversion, % 61 261
Equity to assets ratio at the end of the period, % 45.9 48.0
Debt to capital, % 39.0 35.6
Net debt / EBITDA 0.3 -0.1
Interest cover (EBITDA) 9.0 7.4
Cash assets 629 698
company/metso metsogroup metsoworldmetsoworld metsogroup
www.metso.com