Embed Size (px)
Citation preview
Journal of Banking & Finance 48 (2014) 261–275
Contents lists available at ScienceDirect
Journal of Banking & Finance
journal homepage: www.elsevier .com/locate / jbf
Credit constraints and spillovers from foreign firms in China
http://dx.doi.org/10.1016/j.jbankfin.2014.01.0360378-4266/� 2014 Elsevier B.V. All rights reserved.
⇑ Corresponding author at: University of Nottingham, GEP, CFCM, UnitedKingdom. Tel.: +44 (0) 1159 515 466; fax: +44 (0) 1159 514 159.
E-mail addresses: [email protected] (N. Agarwal), [email protected] (C. Milner), [email protected] (A. Riaño).
1 http://www.chinadaily.com.cn/business/2012-12/03/content_16054002.htm.
2 The surveys by Görg and Greenaway (2004) and Keller (2004) discuss in dproblems associated with the empirical identification of spillovers from foreiinvestment; for the specific case of China, see Hale and Long (2011).
Natasha Agarwal a, Chris Milner b,c, Alejandro Riaño b,c,⇑a Centre for Advanced Financial Research and Learning, Reserve Bank of India, Indiab University of Nottingham, GEP, CFCM, United Kingdomc CESifo, Germany
a r t i c l e i n f o
Article history:Received 23 June 2013Accepted 29 January 2014Available online 12 February 2014
JEL classification:F23G31O1O33
Keywords:Foreign direct investmentKnowledge spilloversCredit constraintsChina
a b s t r a c t
This paper examines whether credit constraints affect Chinese firms’ absorption of productivity spilloversoriginating from the activity of foreign-owned firms. Using firm-level data for 2001–2005, we find evi-dence of positive spillovers originating from foreign-owned firms from countries other than Hong Kong,Macau and Taiwan for non-state owned Chinese firms operating in the same industry and province. Usingan index of external finance dependence to measure credit constraints, we find that only non-state-owned firms operating in industries with external finance dependence below the index median exhibitsignificantly positive spillovers from the activity of foreign firms.
� 2014 Elsevier B.V. All rights reserved.
1. Introduction
In August 2012, Lenovo, the largest PC manufacturer in China,poached more than 40 laid-off employees from rival Motorolashortly after the latter announced its plan to cut 4000 jobs globally.The main objective behind this move, according to Chen Wenhui,Lenovo’s general manager of phone R&D, was to take advantageof the former Motorola employees’ vast experience in overseasmarkets. Similarly, Google’s announcement that it was shuttingdown its search service Google.cn in 2010, resulted in a rush fromits Chinese competitors to hire the company’s best staff.1 While alarge number of Chinese companies have enjoyed the opportunityof tapping into a pool of workers trained in cutting-edge globalcorporations as well as adapting these multinationals’ technologyand management practices, a large number of firms, particularly
privately-owned firms, are unable to take advantage of these typeof positive external effects associated with the operation of for-eign-owned firms, which we refer to from here on as spillovers fromforeign activity.
In this paper we ask whether credit constraints hinder the abil-ity of Chinese firms’ to benefit from productivity spillovers arisingfrom the operation of foreign-owned firms. To address this re-search question, however, we first need to establish whetherdomestically-owned Chinese firms in our sample actually enjoybenefits or positive spillovers from a greater level of activity of for-eign-owned firms.2 Our first set of results provides evidence in sup-port of spillovers from foreign activity to Chinese-owned firmsoperating in the same industry and province. Further inspection re-veals that this positive average effect hides significant heterogeneityin the response of domestic producers to foreign firm activity, whichdepend both on the origin of capital sources for foreign firms and theownership status of domestic firms. In particular, we find that: (i)only the activities of foreign firms that do not originate in HongKong, Macau or Taiwan (HMT) have a significantly positive effecton the value-added of Chinese firms and (ii) only non-state-owned
etail thegn direct
4 The link between foreign direct investment and foreign firm activity on hostcountry outcomes such as productivity, employment and industrial structure issummarised by Navaretti and Venables (2006) and Levine (2005) reviews theextensive body of work studying the link between finance and growth.
5
262 N. Agarwal et al. / Journal of Banking & Finance 48 (2014) 261–275
firms, i.e. privately and collectively-owned enterprises, enjoy spill-overs from foreign activity.3 These results conform with the receivedwisdom that a substantial number of HMT-based firms are estab-lished by Chinese entrepreneurs primarily to take advantage of fiscalincentives available to foreign-invested enterprises and also thatstate-owned enterprises facing ‘soft budget constraints’ and pursu-ing multiple economic and social objectives are less likely to adoptproductivity-enhancing techniques diffusing from multinationalfirms (Abraham et al., 2010; Prasad and Wei, 2007; Bajona andChu, 2010; Xu, 2011).
Our main result shows that credit constraints present a signifi-cant obstacle to the absorption of productivity spillovers originat-ing from foreign firms by Chinese firms. Using a sectoral index ofcredit constraints proposed by Rajan and Zingales (1998), we findthat non-state-owned Chinese firms operating in industries withexternal finance dependence below the median of this index exhi-bit an elasticity of output with respect to foreign activity in thesame industry and province of 0.047. On the other hand, credit-constrained firms, i.e. firms with external finance dependenceabove the median, do not benefit at all from the operation of near-by multinational firms in their own industry. This result has impor-tant policy implications. Governments in developing countries arekeen on attracting foreign direct investment in technologically-intensive sectors. However, since these industries exhibit relativelyhigh dependence on external finance, they might not provide thegreatest benefits for local producers, unless financial markets aresufficiently developed to ensure the widespread absorption of pro-ductivity gains arising from the activities of foreign firms. Thus,this paper sheds light on the conditions that enable local firms tobenefit from greater financial globalisation.
Our results are robust to alternative measures of credit con-straints and firm-level performance measures, the use of laggedmeasures of inputs and foreign activity and various arrangementsof clustering of standard errors. We also find that the negative rela-tionship we establish between external finance dependence andspillovers from foreign activity is not capturing a relationship be-tween the activity of foreign firms with sectoral characteristicsother than credit constraints such as capital intensity or tradability.
Over the past two decades China has been one of the world’smost important recipients of foreign direct investment (FDI), partlybecause of the size and growth of its internal market and its abun-dance of unskilled labour, but also because foreign firms have beenattracted by a wide range of policies and incentives laid out by theChinese government, e.g. generous fiscal schemes favouringforeign-invested enterprises and the establishment of specialeconomic zones. The existence of positive spillovers arising as aby-product of the activities of multinational firms has frequentlybeen used to justify the use of these policies. In this paper, how-ever, we show that the presence and encouragement of foreignfirms is not sufficient for domestic firms to benefit from the activ-ities of foreign-owned firms.
Our finding that productivity gains from spillovers only accrueto local firms not facing credit constraints is of particular impor-tance for China. The 2003 Investment Climate Survey carried outby the World Bank shows that privately-owned Chinese firms en-joy much less access to formal finance than firms in any other EastAsian country. Several authors have pointed to the high level ofstate ownership characterising China’s banking system as the mainculprit behind this phenomenon, as a large share of credit is chan-neled towards state-owned enterprises to pursue political and so-cial objectives (Brandt and Li, 2003; Cull and Xu, 2003; Allen et al.,2005). Consequently, as shown by Ayyagari et al. (2010), private
3 The elasticity of real value-added with respect to foreign activity is statisticallysignificant and of similar magnitude to what previous studies have found (seeJordaan, 2005; Haskel et al., 2007; Abraham et al., 2010).
Chinese firms are often forced to rely on small-scale, shorter-termsources of informal finance, which results in them experiencingslower growth than firms with access to bank credit. Our resultsshow that lack of access to sources of external finance also ham-pers potential productivity gains for privately-owned firms arisingfrom the operation of nearby foreign firms in the same industry.
Although this paper lies at the intersection of two well-estab-lished strands of literature, one exploring the impact of foreign di-rect investment in host economies and a second, investigating howfinancial development affects performance measures at the aggre-gate and microeconomic level, there are still relatively few papersfocusing on the connections between these two research areas.4
Our focus on firm-level implications of credit constraints comple-ments the cross-country studies of Rajan and Zingales (1998) andAlfaro et al. (2004), which find that more developed financialmarkets act as a catalyst for the growth of industries that rely moreon external finance and also boost the effect that foreign directinvestment has on economic growth.
At a more disaggregated level, this paper is similar to Javorcikand Spatareanu (2009) and Du and Girma (2007), who find evi-dence that local firms’ financial health affects their response to for-eign activity across a wide range of outcomes. Javorcik andSpatareanu (2009) show that Czech firms that are less affectedby liquidity constraints are more likely to self-select into becomingmultinationals’ suppliers. Du and Girma (2007) find that export-oriented FDI increases the likelihood of exporting for privately-owned Chinese firms, particularly those with access to bank credit,whereas domestic market-oriented FDI has a negative effect on theprobability that these firms start to export. The paper most closelyrelated to ours is Villegas-Sanchez (2009), which finds that largefirms located in more financially developed regions in Mexico en-joy greater productivity spillovers from FDI. In contrast to her re-sults, we do not find evidence that the way in which creditconstraints affect domestic firms’ ability to appropriate spilloversfrom foreign activity differs across the size distribution of firms.
Unlike the papers described above, all of which rely on firm-le-vel financial indicators, we use the industry-level index of externalfinance dependence developed by Rajan and Zingales (1998) toidentify credit constraints. The use of a ‘frontier technology’ mea-sure, which reflects the outcome of efficient market conditions,has the attraction of being exogenously determined (i.e. unaffectedby local decisions) which helps us in overcoming the endogeneityproblem that might arise at the moment of identifying firms facingcredit constraints.
The rest of the paper is organised as follows: Section 2 summa-rises the theoretical underpinnings for the existence of spilloversarising from the activity of foreign firms; Sections 3 and 4 describeour data and empirical methodology respectively; Our main resultsand robustness checks are presented in Section 5; Section 6concludes.
2. Spillovers from foreign firms
Two central features that characterise ideas, defined in a verybroad sense, are their non-rival nature and the fact that they areonly imperfectly excludable.5 These two characteristics imply thatsome of the benefits arising from the development of new ideas
This broad definition of ideas includes, but is not limited to, blueprints of newgoods, innovations to production processes that reduce production costs, industry-specific ‘trade secrets’ such as lists of suppliers and clients, prices and terms ofdelivery and intangible managerial practices, e.g. the use of performance reviews andincentive schemes to motivate employees.
N. Agarwal et al. / Journal of Banking & Finance 48 (2014) 261–275 263
can accrue to parties other than their creator. Therefore, third partiesmight enjoy ‘spillover’ benefits from using an idea without acquiringit in a market transaction. From a theoretical standpoint, knowledgespillovers have been shown to be a crucial force driving sustainedeconomic growth (Grossman and Helpman, 1991; Aghion andHowitt, 1992; Jones, 2005), as well as shaping market structure atthe industry level and individual firms’ productivity (Dasgupta andStiglitz, 1980; Spence, 1984; Vives, 2008).
Because the vast majority of innovation activity takes place inonly a handful of developed countries (see Eaton and Kortum,1999), governments across the world have, especially over the lastthree decades, actively sought to attract foreign direct investment(FDI) not only because of its direct contribution to capital formationbut also with the expectation that the operation of multinationalfirms would facilitate the diffusion of foreign technology and ideastowards domestic producers.6 Typical examples of policies aimed atattracting foreign multinationals include tax holidays, lenient labourand environmental regulations, streamlined enterprise registrationprocedures, among other advantages. China has relied intensivelyon these instruments, especially through the establishment of specialeconomic zones as noted by Naughton (1996) and Defever and Riaño(2012), but it also has employed more ‘direct’ methods to elicit thediffusion of knowledge such as preconditioning access to its domesticmarket to foreign firms in exchange for direct handovers of technol-ogy, as documented by Holmes et al. (2013).
Findlay (1978) provides the first theoretical account in whichFDI generates positive spillovers in host countries. His model fea-tures two key elements that have remained central for the subse-quent literature: (i) foreign capital embodies more advancedtechnology, management techniques and know-how which areunavailable to firms in the relatively ‘backward’ host country and(ii) domestic producers, however, can improve their efficiencythrough their exposure to FDI. The first assumption is founded onthe observation that the technological advantage of multinationalfirms is a necessary condition to successfully operate in unfamiliarforeign markets while at the same time incurring the higher organ-isational costs associated with international production. The ratio-nale for a potential positive effect of foreign firms’ activity on localproducers follows from the work of Polanyi (1958) and Arrow(1969), who argue that an important component of knowledge isnot codifiable (either because the problem-solver cannot fully de-fine what he or she is doing, or because it is prohibitively costlyto do so). This in turn implies that the diffusion of knowledge occursmore effectively through personal contact and demonstration facil-itated by operating in close proximity to the innovator. Findlay(1978) shows in his model that the growth rate of technology inthe host country is positively affected by foreign capital inflowsand that this positive spillover effect from FDI is stronger the great-er the technology gap is between the two countries.
Although the non-rival nature of knowledge assumed byFindlay (1978) suggests that ideas can be easily and costlesslytransferred across countries,7 Cohen et al. (1990) argue that localfirms’ ability to assimilate new ideas and apply them to commercialmeans depend on their ‘absorptive capacity’, which is dependent ona firm’s stock of knowledge capital.8 However, since the latter is not
6 See Keller (2004) for an extensive review about the process of internationaltechnology diffusion and the channels through which it takes place.
7 Mansfield and Romeo (1980) provide one of the earliest accounts documentingthe extent and speed with which U.S. multinational firms transfer their technology totheir foreign subsidiaries; more recently, Bloom and Van Reenen (2007), using cross-country data, find that multinational firms often transplant their managementtechniques to their subsidiaries overseas.
8 Keller (1996) incorporates the notion of absorptive capacity into an endogenousgrowth model. He shows that in order for the gains from greater trade openness (dueto the acquisition of new technologies from abroad) to be sustained a country needsto accumulate skills at a higher rate than before the regime change.
directly observable, it is common to use a country or a firm’s skilledemployment or R&D intensity to proxy it (Girma, 2005).
One can, however, take a broader view of absorptive capacityand include factors other than human capital and R&D activity inshaping a firm’s ability to adapt new ideas and techniques fromforeign firms. Our argument is that the extent of credit constraintscan be considered an important feature of a firm’s absorptivecapacity. Easier access to external finance allows firms to investin long-term projects which in turn help them accumulate bothphysical and knowledge capital (see Ayyagari et al., 2011).
3. Data
The data used in this study is drawn from the annual accountingreports in the Oriana database compiled by Bureau Van Dijk. It cov-ers over 20,000 manufacturing firms for the period 2001–2005. Thesample consists of relatively few small firms with annual salesabove Yuan 1 million, and a majority of large firms with annualturnover above Yuan 5 million. The firms in our sample accountfor approximately 35% of total manufacturing value-added and18% of manufacturing employment in China.
The dataset contains information on value-added, employment,input costs, geographic location, industry of operation and foreignownership status, distinguishing whether the source of foreigninvestment originates from Hong Kong, Macau and Taiwan or else-where. Thus, we consider a firm to be foreign-owned if foreign cap-ital participation in it exceeds 25%.9 After cleaning the data, oursample comprises 78,509 firm-year observations, of which 40%approximately are foreign-owned enterprises.10 Table 1 presentsthe definition of all variables used in the paper and Table 2 providessummary statistics for our sample.
In order to identify credit-constrained firms in our sample, werely on the industry-level (ISIC-3 digit) index of external financedependence (EFD) proposed by Rajan and Zingales (1998) andmade available by Braun (2003). This index is constructed as theshare of capital expenditures not financed with cash flow fromoperation for the median publicly-listed firm in each 3-digit indus-try in the United States averaged over the 1980s.11 Because the U.S.has one of the most sophisticated financial systems in the world andthe EFD index is constructed using data for publicly-listed firms, itshould closely reflect firms’ optimal choice for external finance inan unconstrained environment. This index has been widely used asa proxy for the extent of financial constraints (Kroszner et al.,2007; Beck et al., 2008; Manova, 2013).
The theoretical underpinning of the EFD index is that key fac-tors determining a firm’s demand for external funds, such as pro-ject scale, gestation and cash harvest periods, and therequirement for continuing investment are intrinsic to the produc-tion technology available in the firm’s industry. Thus, firms operat-ing in sectors characterised by larger minimum scale requirements,longer gestation periods, higher R&D intensity or working capitalneeds are more likely to face credit constraints. Based on the EFDindex, industries identified to be heavily reliant on external financeinclude plastic products, machinery and professional equipment
9 The National Bureau of Statistics of China considers an enterprise to be foreign-funded if at least 25% of the company’s registered capital is of foreign origin in thecase of limited liability corporations and Chinese-foreign equity joint ventures.Exceptions include cooperative joint ventures in which the proportion of capital to becontributed by each of the parties to the venture is stipulated by contract and thewholly-foreign owned enterprises where the entire capital comes from foreigninvestors.
10 Following Chen and Guariglia (2011), we drop observations with negative sales,negative total assets minus total fixed assets, negative total assets minus liquidassets; and negative accumulated depreciation minus current depreciation.
11 Cash flow from operations is defined as the sum of cash flow from operations plusdecreases in inventories, decreases in receivables, and increases in payables.
Table 1Variable description and sources.
Variable Description and sources
Firm levelOutput (Yijpt) Real value added. Oriana database, Bureau Van DijkCapital (Kijpt) Real value of tangible fixed assets. Oriana database, Bureau Van DijkLabour (Lijpt) Number of employees. Oriana database, Bureau Van Dijk
Industry-province levelForeign activity (Foreignjpt) Total value-added by foreign-owned firms within an industry-province cell in a given year. Value added of foreign firms
from the Oriana database, Bureau Van DijkForeign activity, Hong Kong, Macau and
Taiwan (ForeignHMTjpt )
Total value added from foreign firms originating from Hong Kong, Macau and Taiwan in an industry-province cell in agiven year. Oriana database, Bureau Van Dijk
Foreign activity, other countries
(Foreignotherjpt )
Total value added from foreign firms originating from countries other than Hong Kong, Macau and Taiwan in an industry-province cell in a given year. Oriana database, Bureau Van Dijk
Industry levelExternal finance dependence (EFDj) Share of capital expenditures not financed with internal funds for the median publicly-listed U.S. firm in each 3-digit
industry for the 1980s. The index is developed by Rajan and Zingales (1998) and was made available by Braun (2003)External finance dependence, 1970
(EFD1970j )
Same as above but calculated using data for the 1970s. From Braun (2003)
External finance dependence, Canada
(EFD1980j;CAN)
Same as above but calculated using data for Canadian firms for the period 1982–1990. From Rajan and Zingales (1998)
Tangibility index An index calculated as the median level of the ratio of net property, plant and equipment to the book value of assets of allU.S. based companies in a given industry, based on Compustat’s annual industrial files for the period 1986–1995. FromBraun (2003)
Capital intensity index An index calculated as the median level of the ratio of fixed assets to number of employees in a given industry for U.S.Firms in Compustat for the period 1980–1999. From Kroszner et al. (2007)
Liquidity index An index calculated as the median level of the ratio of inventories to sales for all active U.S.-based companies inCompustat’s annual industrial files for the period 1980–1999. From Kroszner et al. (2007)
Durability index An index which takes the value one if a 3-digit industry manufactures predominantly durable goods, and zero otherwise.From Kroszner et al. (2007)
Investment goods producer index An index calculated as the ratio investment/(investment + consumption) using data from the 1998 BEA Input–Outputtable at the 3-digit industry level. This measure captures whether an industry is specialised in the production ofinvestment goods relative to consumption goods. From Braun and Larrain (2005)
Tradability index An index calculated as the ratio trade/(trade + domestic use), where trade is defined as exports plus imports, anddomestic use is defined as consumption plus investment, either private or public at the 3-digit industry level based ondata from the BEA use tables. A higher value means that the industry specialises in the production of tradable goods. FromBraun and Larrain (2005)
Province levelDeflators Both the GDP and capital goods deflators are taken from the China Statistical Yearbook (various issues), published by the
National Bureau of Statistics of China
The subscripts i, j, p, and t index firms, 3-digit industries, provinces and years respectively.
12 Firm-level value-added and our measure of foreign-firm activity are both deflatedusing province-level GDP deflators, while capital is deflated using a province-leveldeflator for fixed capital formation.
264 N. Agarwal et al. / Journal of Banking & Finance 48 (2014) 261–275
whereas sectors like tobacco, footwear, and clothing are in the low-er end of the ranking.
Because the underlying determinants of the demand for exter-nal finance vary substantially across industries while remainingrelatively stable across countries and over time within the sameindustry, we can use the U.S.-based index to identify sectors in Chi-na that are more likely to face credit constraints. The raw correla-tion between the EFD index based on U.S. data for the 1980s and itscounterpart for Canada during the same period stands at 0.59,while the correlation between the U.S. index in the 1970s and1980s is 0.63 (see Table A.1); rank correlations among the threeindices are all above 0.43. Reassuringly, Rajan and Zingales(1998) and Braun (2003) also note that the EFD index varies sub-stantially more between sectors than among firms within the sameindustry.
The characteristics of firms in our sample conform with theownership and access to finance premia evidence available forother countries (Antràs and Yeaple, 2013; Campello et al., 2010).Table 3 shows that foreign-owned firms are on an average largerin terms of value-added and sales (although they are smaller interms of employment) and more productive than their Chinese-owned counterparts. Similarly, domestically-owned firms produc-ing in sectors with low external finance dependence outperformfirms that are more likely to face credit constraints. This prelimin-ary evidence is consistent with the findings of Chen and Guariglia(2011) who, using different measures, show that credit constraints
also have detrimental effects on the performance of Chinese firmsin terms of asset growth and productivity.
4. Baseline specifications and estimation methodology
The first step in our empirical analysis involves establishing theexistence of spillovers arising from the activity of foreign firms ontheir domestically-owned counterparts in the same industry andprovince. To do so, we follow Aitken and Harrison (1999) andJavorcik (2004) by estimating a Cobb-Douglas production functionaugmented to account for spillovers from the presence of foreignfirms. Therefore our first estimating equation is:
ln Yijpt ¼ aþ bK ln Kijpt þ bL ln Lijpt þ c ln Foreignjpt þ /i þ /t þ eijpt;
ð1Þ
where the subscripts i; j;p and t index firms, industries, provincesand years respectively. Yijpt denotes real value-added and Kijpt andLijpt are capital and labour inputs respectively.12 Our measure ofspillovers arising from foreign activity, Foreignjpt , is defined as totalreal value-added accounted for foreign-owned firms in the sameindustry and province as firm i in a given year; /i and /t are firm
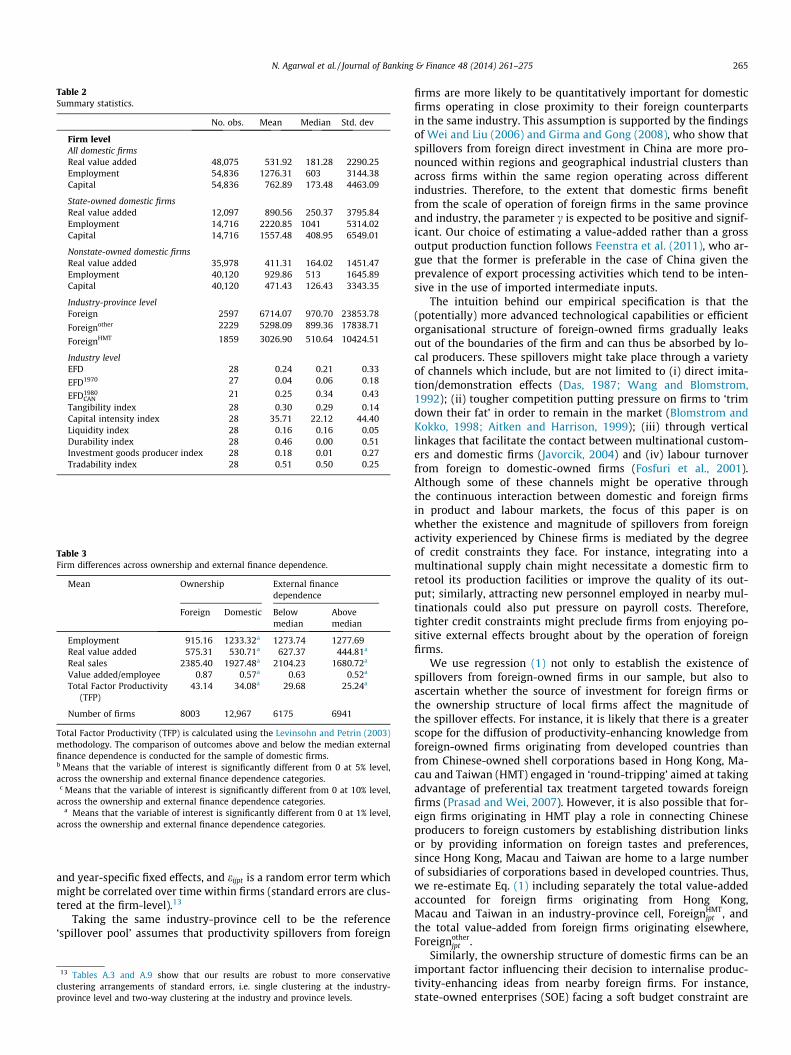
Table 2Summary statistics.
No. obs. Mean Median Std. dev
Firm levelAll domestic firmsReal value added 48,075 531.92 181.28 2290.25Employment 54,836 1276.31 603 3144.38Capital 54,836 762.89 173.48 4463.09
State-owned domestic firmsReal value added 12,097 890.56 250.37 3795.84Employment 14,716 2220.85 1041 5314.02Capital 14,716 1557.48 408.95 6549.01
Nonstate-owned domestic firmsReal value added 35,978 411.31 164.02 1451.47Employment 40,120 929.86 513 1645.89Capital 40,120 471.43 126.43 3343.35
Industry-province levelForeign 2597 6714.07 970.70 23853.78
Foreignother 2229 5298.09 899.36 17838.71
ForeignHMT 1859 3026.90 510.64 10424.51
Industry levelEFD 28 0.24 0.21 0.33
EFD1970 27 0.04 0.06 0.18
EFD1980CAN
21 0.25 0.34 0.43
Tangibility index 28 0.30 0.29 0.14Capital intensity index 28 35.71 22.12 44.40Liquidity index 28 0.16 0.16 0.05Durability index 28 0.46 0.00 0.51Investment goods producer index 28 0.18 0.01 0.27Tradability index 28 0.51 0.50 0.25
Table 3Firm differences across ownership and external finance dependence.
Mean Ownership External financedependence
Foreign Domestic Belowmedian
Abovemedian
Employment 915.16 1233.32a 1273.74 1277.69Real value added 575.31 530.71a 627.37 444.81a
Real sales 2385.40 1927.48a 2104.23 1680.72a
Value added/employee 0.87 0.57a 0.63 0.52a
Total Factor Productivity(TFP)
43.14 34.08a 29.68 25.24a
Number of firms 8003 12,967 6175 6941
Total Factor Productivity (TFP) is calculated using the Levinsohn and Petrin (2003)methodology. The comparison of outcomes above and below the median externalfinance dependence is conducted for the sample of domestic firms.b Means that the variable of interest is significantly different from 0 at 5% level,across the ownership and external finance dependence categories.c Means that the variable of interest is significantly different from 0 at 10% level,
across the ownership and external finance dependence categories.a Means that the variable of interest is significantly different from 0 at 1% level,
across the ownership and external finance dependence categories.
N. Agarwal et al. / Journal of Banking & Finance 48 (2014) 261–275 265
and year-specific fixed effects, and eijpt is a random error term whichmight be correlated over time within firms (standard errors are clus-tered at the firm-level).13
Taking the same industry-province cell to be the reference‘spillover pool’ assumes that productivity spillovers from foreign
13 Tables A.3 and A.9 show that our results are robust to more conservativeclustering arrangements of standard errors, i.e. single clustering at the industry-province level and two-way clustering at the industry and province levels.
firms are more likely to be quantitatively important for domesticfirms operating in close proximity to their foreign counterpartsin the same industry. This assumption is supported by the findingsof Wei and Liu (2006) and Girma and Gong (2008), who show thatspillovers from foreign direct investment in China are more pro-nounced within regions and geographical industrial clusters thanacross firms within the same region operating across differentindustries. Therefore, to the extent that domestic firms benefitfrom the scale of operation of foreign firms in the same provinceand industry, the parameter c is expected to be positive and signif-icant. Our choice of estimating a value-added rather than a grossoutput production function follows Feenstra et al. (2011), who ar-gue that the former is preferable in the case of China given theprevalence of export processing activities which tend to be inten-sive in the use of imported intermediate inputs.
The intuition behind our empirical specification is that the(potentially) more advanced technological capabilities or efficientorganisational structure of foreign-owned firms gradually leaksout of the boundaries of the firm and can thus be absorbed by lo-cal producers. These spillovers might take place through a varietyof channels which include, but are not limited to (i) direct imita-tion/demonstration effects (Das, 1987; Wang and Blomstrom,1992); (ii) tougher competition putting pressure on firms to ‘trimdown their fat’ in order to remain in the market (Blomstrom andKokko, 1998; Aitken and Harrison, 1999); (iii) through verticallinkages that facilitate the contact between multinational custom-ers and domestic firms (Javorcik, 2004) and (iv) labour turnoverfrom foreign to domestic-owned firms (Fosfuri et al., 2001).Although some of these channels might be operative throughthe continuous interaction between domestic and foreign firmsin product and labour markets, the focus of this paper is onwhether the existence and magnitude of spillovers from foreignactivity experienced by Chinese firms is mediated by the degreeof credit constraints they face. For instance, integrating into amultinational supply chain might necessitate a domestic firm toretool its production facilities or improve the quality of its out-put; similarly, attracting new personnel employed in nearby mul-tinationals could also put pressure on payroll costs. Therefore,tighter credit constraints might preclude firms from enjoying po-sitive external effects brought about by the operation of foreignfirms.
We use regression (1) not only to establish the existence ofspillovers from foreign-owned firms in our sample, but also toascertain whether the source of investment for foreign firms orthe ownership structure of local firms affect the magnitude ofthe spillover effects. For instance, it is likely that there is a greaterscope for the diffusion of productivity-enhancing knowledge fromforeign-owned firms originating from developed countries thanfrom Chinese-owned shell corporations based in Hong Kong, Ma-cau and Taiwan (HMT) engaged in ‘round-tripping’ aimed at takingadvantage of preferential tax treatment targeted towards foreignfirms (Prasad and Wei, 2007). However, it is also possible that for-eign firms originating in HMT play a role in connecting Chineseproducers to foreign customers by establishing distribution linksor by providing information on foreign tastes and preferences,since Hong Kong, Macau and Taiwan are home to a large numberof subsidiaries of corporations based in developed countries. Thus,we re-estimate Eq. (1) including separately the total value-addedaccounted for foreign firms originating from Hong Kong,Macau and Taiwan in an industry-province cell, ForeignHMT
jpt , andthe total value-added from foreign firms originating elsewhere,Foreignother
jpt .Similarly, the ownership structure of domestic firms can be an
important factor influencing their decision to internalise produc-tivity-enhancing ideas from nearby foreign firms. For instance,state-owned enterprises (SOE) facing a soft budget constraint are
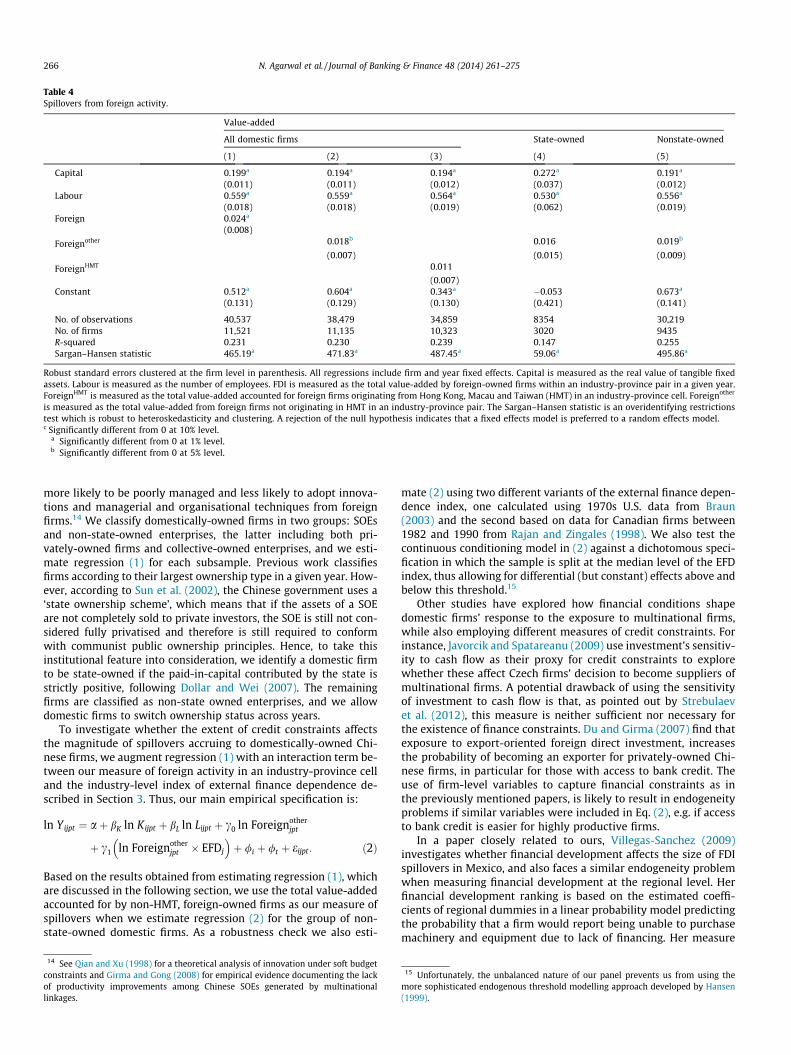
Table 4Spillovers from foreign activity.
Value-added
All domestic firms State-owned Nonstate-owned
(1) (2) (3) (4) (5)
Capital 0.199a 0.194a 0.194a 0.272a 0.191a
(0.011) (0.011) (0.012) (0.037) (0.012)Labour 0.559a 0.559a 0.564a 0.530a 0.556a
(0.018) (0.018) (0.019) (0.062) (0.019)Foreign 0.024a
(0.008)
Foreignother 0.018b 0.016 0.019b
(0.007) (0.015) (0.009)
ForeignHMT 0.011
(0.007)Constant 0.512a 0.604a 0.343a �0.053 0.673a
(0.131) (0.129) (0.130) (0.421) (0.141)
No. of observations 40,537 38,479 34,859 8354 30,219No. of firms 11,521 11,135 10,323 3020 9435R-squared 0.231 0.230 0.239 0.147 0.255Sargan–Hansen statistic 465.19a 471.83a 487.45a 59.06a 495.86a
Robust standard errors clustered at the firm level in parenthesis. All regressions include firm and year fixed effects. Capital is measured as the real value of tangible fixedassets. Labour is measured as the number of employees. FDI is measured as the total value-added by foreign-owned firms within an industry-province pair in a given year.ForeignHMT is measured as the total value-added accounted for foreign firms originating from Hong Kong, Macau and Taiwan (HMT) in an industry-province cell. Foreignother
is measured as the total value-added from foreign firms not originating in HMT in an industry-province pair. The Sargan–Hansen statistic is an overidentifying restrictionstest which is robust to heteroskedasticity and clustering. A rejection of the null hypothesis indicates that a fixed effects model is preferred to a random effects model.c Significantly different from 0 at 10% level.
a Significantly different from 0 at 1% level.b Significantly different from 0 at 5% level.
266 N. Agarwal et al. / Journal of Banking & Finance 48 (2014) 261–275
more likely to be poorly managed and less likely to adopt innova-tions and managerial and organisational techniques from foreignfirms.14 We classify domestically-owned firms in two groups: SOEsand non-state-owned enterprises, the latter including both pri-vately-owned firms and collective-owned enterprises, and we esti-mate regression (1) for each subsample. Previous work classifiesfirms according to their largest ownership type in a given year. How-ever, according to Sun et al. (2002), the Chinese government uses a‘state ownership scheme’, which means that if the assets of a SOEare not completely sold to private investors, the SOE is still not con-sidered fully privatised and therefore is still required to conformwith communist public ownership principles. Hence, to take thisinstitutional feature into consideration, we identify a domestic firmto be state-owned if the paid-in-capital contributed by the state isstrictly positive, following Dollar and Wei (2007). The remainingfirms are classified as non-state owned enterprises, and we allowdomestic firms to switch ownership status across years.
To investigate whether the extent of credit constraints affectsthe magnitude of spillovers accruing to domestically-owned Chi-nese firms, we augment regression (1) with an interaction term be-tween our measure of foreign activity in an industry-province celland the industry-level index of external finance dependence de-scribed in Section 3. Thus, our main empirical specification is:
ln Yijpt ¼ aþ bK ln Kijpt þ bL ln Lijpt þ c0 ln Foreignotherjpt
þ c1 ln Foreignotherjpt � EFDj
� �þ /i þ /t þ eijpt: ð2Þ
Based on the results obtained from estimating regression (1), whichare discussed in the following section, we use the total value-addedaccounted for by non-HMT, foreign-owned firms as our measure ofspillovers when we estimate regression (2) for the group of non-state-owned domestic firms. As a robustness check we also esti-
14 See Qian and Xu (1998) for a theoretical analysis of innovation under soft budgetconstraints and Girma and Gong (2008) for empirical evidence documenting the lackof productivity improvements among Chinese SOEs generated by multinationallinkages.
mate (2) using two different variants of the external finance depen-dence index, one calculated using 1970s U.S. data from Braun(2003) and the second based on data for Canadian firms between1982 and 1990 from Rajan and Zingales (1998). We also test thecontinuous conditioning model in (2) against a dichotomous speci-fication in which the sample is split at the median level of the EFDindex, thus allowing for differential (but constant) effects above andbelow this threshold.15
Other studies have explored how financial conditions shapedomestic firms’ response to the exposure to multinational firms,while also employing different measures of credit constraints. Forinstance, Javorcik and Spatareanu (2009) use investment’s sensitiv-ity to cash flow as their proxy for credit constraints to explorewhether these affect Czech firms’ decision to become suppliers ofmultinational firms. A potential drawback of using the sensitivityof investment to cash flow is that, as pointed out by Strebulaevet al. (2012), this measure is neither sufficient nor necessary forthe existence of finance constraints. Du and Girma (2007) find thatexposure to export-oriented foreign direct investment, increasesthe probability of becoming an exporter for privately-owned Chi-nese firms, in particular for those with access to bank credit. Theuse of firm-level variables to capture financial constraints as inthe previously mentioned papers, is likely to result in endogeneityproblems if similar variables were included in Eq. (2), e.g. if accessto bank credit is easier for highly productive firms.
In a paper closely related to ours, Villegas-Sanchez (2009)investigates whether financial development affects the size of FDIspillovers in Mexico, and also faces a similar endogeneity problemwhen measuring financial development at the regional level. Herfinancial development ranking is based on the estimated coeffi-cients of regional dummies in a linear probability model predictingthe probability that a firm would report being unable to purchasemachinery and equipment due to lack of financing. Her measure
15 Unfortunately, the unbalanced nature of our panel prevents us from using themore sophisticated endogenous threshold modelling approach developed by Hansen(1999).
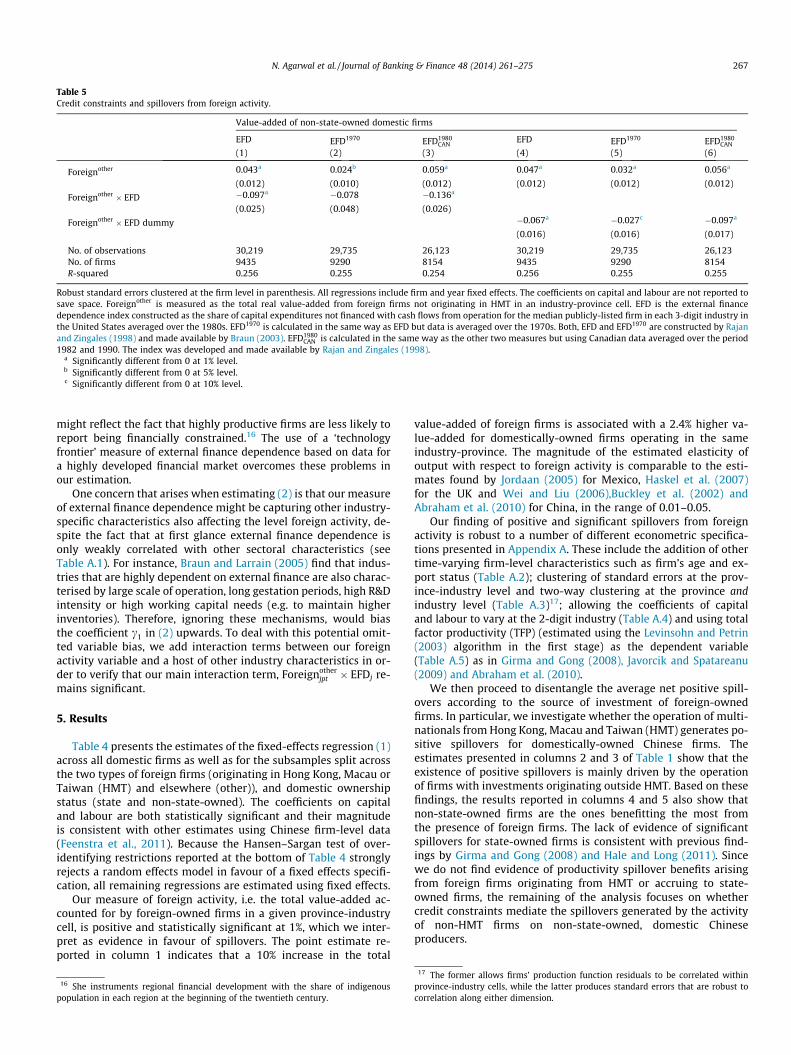
Table 5Credit constraints and spillovers from foreign activity.
Value-added of non-state-owned domestic firms
EFD EFD1970 EFD1980CAN
EFD EFD1970 EFD1980CAN
(1) (2) (3) (4) (5) (6)
Foreignother 0.043a 0.024b 0.059a 0.047a 0.032a 0.056a
(0.012) (0.010) (0.012) (0.012) (0.012) (0.012)
Foreignother � EFD �0.097a �0.078 �0.136a
(0.025) (0.048) (0.026)
Foreignother � EFD dummy �0.067a �0.027c �0.097a
(0.016) (0.016) (0.017)
No. of observations 30,219 29,735 26,123 30,219 29,735 26,123No. of firms 9435 9290 8154 9435 9290 8154R-squared 0.256 0.255 0.254 0.256 0.255 0.255
Robust standard errors clustered at the firm level in parenthesis. All regressions include firm and year fixed effects. The coefficients on capital and labour are not reported tosave space. Foreignother is measured as the total real value-added from foreign firms not originating in HMT in an industry-province cell. EFD is the external financedependence index constructed as the share of capital expenditures not financed with cash flows from operation for the median publicly-listed firm in each 3-digit industry inthe United States averaged over the 1980s. EFD1970 is calculated in the same way as EFD but data is averaged over the 1970s. Both, EFD and EFD1970 are constructed by Rajanand Zingales (1998) and made available by Braun (2003). EFD1980
CAN is calculated in the same way as the other two measures but using Canadian data averaged over the period1982 and 1990. The index was developed and made available by Rajan and Zingales (1998).
a Significantly different from 0 at 1% level.b Significantly different from 0 at 5% level.c Significantly different from 0 at 10% level.
N. Agarwal et al. / Journal of Banking & Finance 48 (2014) 261–275 267
might reflect the fact that highly productive firms are less likely toreport being financially constrained.16 The use of a ‘technologyfrontier’ measure of external finance dependence based on data fora highly developed financial market overcomes these problems inour estimation.
One concern that arises when estimating (2) is that our measureof external finance dependence might be capturing other industry-specific characteristics also affecting the level foreign activity, de-spite the fact that at first glance external finance dependence isonly weakly correlated with other sectoral characteristics (seeTable A.1). For instance, Braun and Larrain (2005) find that indus-tries that are highly dependent on external finance are also charac-terised by large scale of operation, long gestation periods, high R&Dintensity or high working capital needs (e.g. to maintain higherinventories). Therefore, ignoring these mechanisms, would biasthe coefficient c1 in (2) upwards. To deal with this potential omit-ted variable bias, we add interaction terms between our foreignactivity variable and a host of other industry characteristics in or-der to verify that our main interaction term, Foreignother
jpt � EFDj re-mains significant.
5. Results
Table 4 presents the estimates of the fixed-effects regression (1)across all domestic firms as well as for the subsamples split acrossthe two types of foreign firms (originating in Hong Kong, Macau orTaiwan (HMT) and elsewhere (other)), and domestic ownershipstatus (state and non-state-owned). The coefficients on capitaland labour are both statistically significant and their magnitudeis consistent with other estimates using Chinese firm-level data(Feenstra et al., 2011). Because the Hansen–Sargan test of over-identifying restrictions reported at the bottom of Table 4 stronglyrejects a random effects model in favour of a fixed effects specifi-cation, all remaining regressions are estimated using fixed effects.
Our measure of foreign activity, i.e. the total value-added ac-counted for by foreign-owned firms in a given province-industrycell, is positive and statistically significant at 1%, which we inter-pret as evidence in favour of spillovers. The point estimate re-ported in column 1 indicates that a 10% increase in the total
16 She instruments regional financial development with the share of indigenouspopulation in each region at the beginning of the twentieth century.
value-added of foreign firms is associated with a 2.4% higher va-lue-added for domestically-owned firms operating in the sameindustry-province. The magnitude of the estimated elasticity ofoutput with respect to foreign activity is comparable to the esti-mates found by Jordaan (2005) for Mexico, Haskel et al. (2007)for the UK and Wei and Liu (2006),Buckley et al. (2002) andAbraham et al. (2010) for China, in the range of 0.01–0.05.
Our finding of positive and significant spillovers from foreignactivity is robust to a number of different econometric specifica-tions presented in Appendix A. These include the addition of othertime-varying firm-level characteristics such as firm’s age and ex-port status (Table A.2); clustering of standard errors at the prov-ince-industry level and two-way clustering at the province andindustry level (Table A.3)17; allowing the coefficients of capitaland labour to vary at the 2-digit industry (Table A.4) and using totalfactor productivity (TFP) (estimated using the Levinsohn and Petrin(2003) algorithm in the first stage) as the dependent variable(Table A.5) as in Girma and Gong (2008), Javorcik and Spatareanu(2009) and Abraham et al. (2010).
We then proceed to disentangle the average net positive spill-overs according to the source of investment of foreign-ownedfirms. In particular, we investigate whether the operation of multi-nationals from Hong Kong, Macau and Taiwan (HMT) generates po-sitive spillovers for domestically-owned Chinese firms. Theestimates presented in columns 2 and 3 of Table 1 show that theexistence of positive spillovers is mainly driven by the operationof firms with investments originating outside HMT. Based on thesefindings, the results reported in columns 4 and 5 also show thatnon-state-owned firms are the ones benefitting the most fromthe presence of foreign firms. The lack of evidence of significantspillovers for state-owned firms is consistent with previous find-ings by Girma and Gong (2008) and Hale and Long (2011). Sincewe do not find evidence of productivity spillover benefits arisingfrom foreign firms originating from HMT or accruing to state-owned firms, the remaining of the analysis focuses on whethercredit constraints mediate the spillovers generated by the activityof non-HMT firms on non-state-owned, domestic Chineseproducers.
17 The former allows firms’ production function residuals to be correlated withinprovince-industry cells, while the latter produces standard errors that are robust tocorrelation along either dimension.
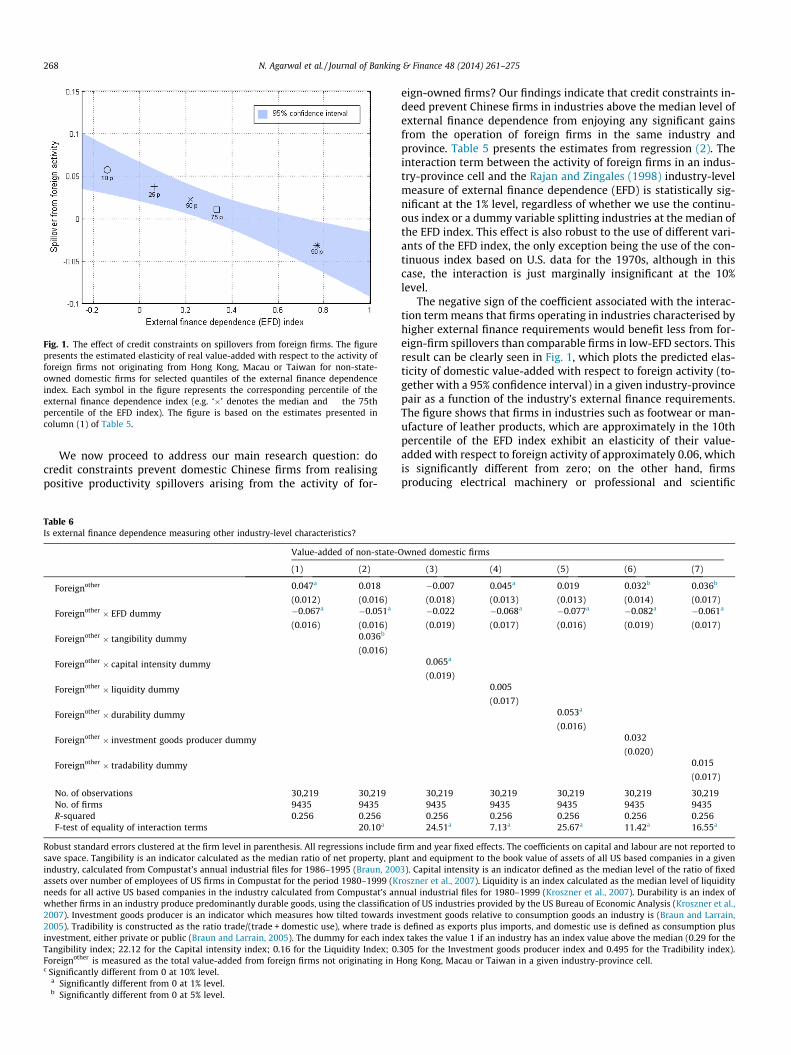
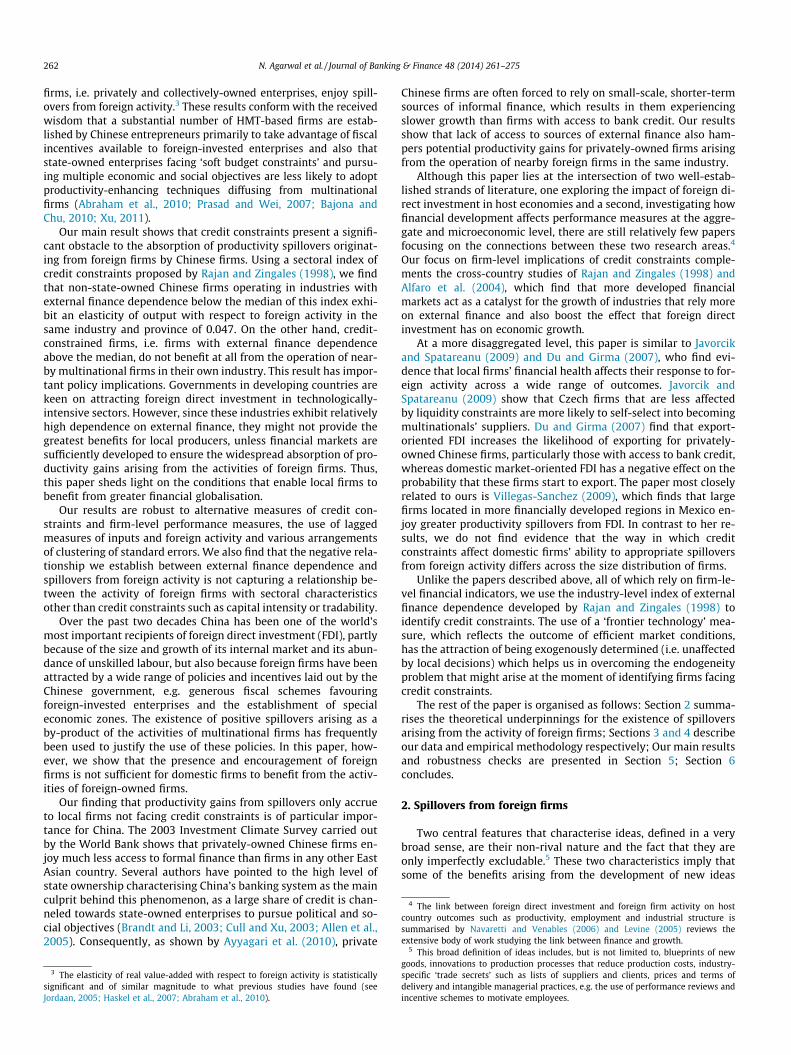
Fig. 1. The effect of credit constraints on spillovers from foreign firms. The figurepresents the estimated elasticity of real value-added with respect to the activity offoreign firms not originating from Hong Kong, Macau or Taiwan for non-state-owned domestic firms for selected quantiles of the external finance dependenceindex. Each symbol in the figure represents the corresponding percentile of theexternal finance dependence index (e.g. ‘�’ denotes the median and � the 75thpercentile of the EFD index). The figure is based on the estimates presented incolumn (1) of Table 5.
268 N. Agarwal et al. / Journal of Banking & Finance 48 (2014) 261–275
We now proceed to address our main research question: docredit constraints prevent domestic Chinese firms from realisingpositive productivity spillovers arising from the activity of for-
Table 6Is external finance dependence measuring other industry-level characteristics?
Value-added of non-state-
(1) (2)
Foreignother 0.047a 0.018
(0.012) (0.016)
Foreignother � EFD dummy �0.067a �0.051a
(0.016) (0.016)
Foreignother � tangibility dummy 0.036b
(0.016)
Foreignother � capital intensity dummy
Foreignother � liquidity dummy
Foreignother � durability dummy
Foreignother � investment goods producer dummy
Foreignother � tradability dummy
No. of observations 30,219 30,219No. of firms 9435 9435R-squared 0.256 0.256F-test of equality of interaction terms 20.10a
Robust standard errors clustered at the firm level in parenthesis. All regressions include fisave space. Tangibility is an indicator calculated as the median ratio of net property, plaindustry, calculated from Compustat’s annual industrial files for 1986–1995 (Braun, 200assets over number of employees of US firms in Compustat for the period 1980–1999 (Kneeds for all active US based companies in the industry calculated from Compustat’s anwhether firms in an industry produce predominantly durable goods, using the classificati2007). Investment goods producer is an indicator which measures how tilted towards i2005). Tradibility is constructed as the ratio trade/(trade + domestic use), where trade isinvestment, either private or public (Braun and Larrain, 2005). The dummy for each indeTangibility index; 22.12 for the Capital intensity index; 0.16 for the Liquidity Index; 0.Foreignother is measured as the total value-added from foreign firms not originating in Hc Significantly different from 0 at 10% level.
a Significantly different from 0 at 1% level.b Significantly different from 0 at 5% level.
eign-owned firms? Our findings indicate that credit constraints in-deed prevent Chinese firms in industries above the median level ofexternal finance dependence from enjoying any significant gainsfrom the operation of foreign firms in the same industry andprovince. Table 5 presents the estimates from regression (2). Theinteraction term between the activity of foreign firms in an indus-try-province cell and the Rajan and Zingales (1998) industry-levelmeasure of external finance dependence (EFD) is statistically sig-nificant at the 1% level, regardless of whether we use the continu-ous index or a dummy variable splitting industries at the median ofthe EFD index. This effect is also robust to the use of different vari-ants of the EFD index, the only exception being the use of the con-tinuous index based on U.S. data for the 1970s, although in thiscase, the interaction is just marginally insignificant at the 10%level.
The negative sign of the coefficient associated with the interac-tion term means that firms operating in industries characterised byhigher external finance requirements would benefit less from for-eign-firm spillovers than comparable firms in low-EFD sectors. Thisresult can be clearly seen in Fig. 1, which plots the predicted elas-ticity of domestic value-added with respect to foreign activity (to-gether with a 95% confidence interval) in a given industry-provincepair as a function of the industry’s external finance requirements.The figure shows that firms in industries such as footwear or man-ufacture of leather products, which are approximately in the 10thpercentile of the EFD index exhibit an elasticity of their value-added with respect to foreign activity of approximately 0.06, whichis significantly different from zero; on the other hand, firmsproducing electrical machinery or professional and scientific
Owned domestic firms
(3) (4) (5) (6) (7)
�0.007 0.045a 0.019 0.032b 0.036b
(0.018) (0.013) (0.013) (0.014) (0.017)�0.022 �0.068a �0.077a �0.082a �0.061a
(0.019) (0.017) (0.016) (0.019) (0.017)
0.065a
(0.019)0.005
(0.017)0.053a
(0.016)0.032
(0.020)0.015
(0.017)
30,219 30,219 30,219 30,219 30,2199435 9435 9435 9435 94350.256 0.256 0.256 0.256 0.25624.51a 7.13a 25.67a 11.42a 16.55a
rm and year fixed effects. The coefficients on capital and labour are not reported tont and equipment to the book value of assets of all US based companies in a given3). Capital intensity is an indicator defined as the median level of the ratio of fixedroszner et al., 2007). Liquidity is an index calculated as the median level of liquiditynual industrial files for 1980–1999 (Kroszner et al., 2007). Durability is an index ofon of US industries provided by the US Bureau of Economic Analysis (Kroszner et al.,nvestment goods relative to consumption goods an industry is (Braun and Larrain,defined as exports plus imports, and domestic use is defined as consumption plus
x takes the value 1 if an industry has an index value above the median (0.29 for the305 for the Investment goods producer index and 0.495 for the Tradibility index).ong Kong, Macau or Taiwan in a given industry-province cell.
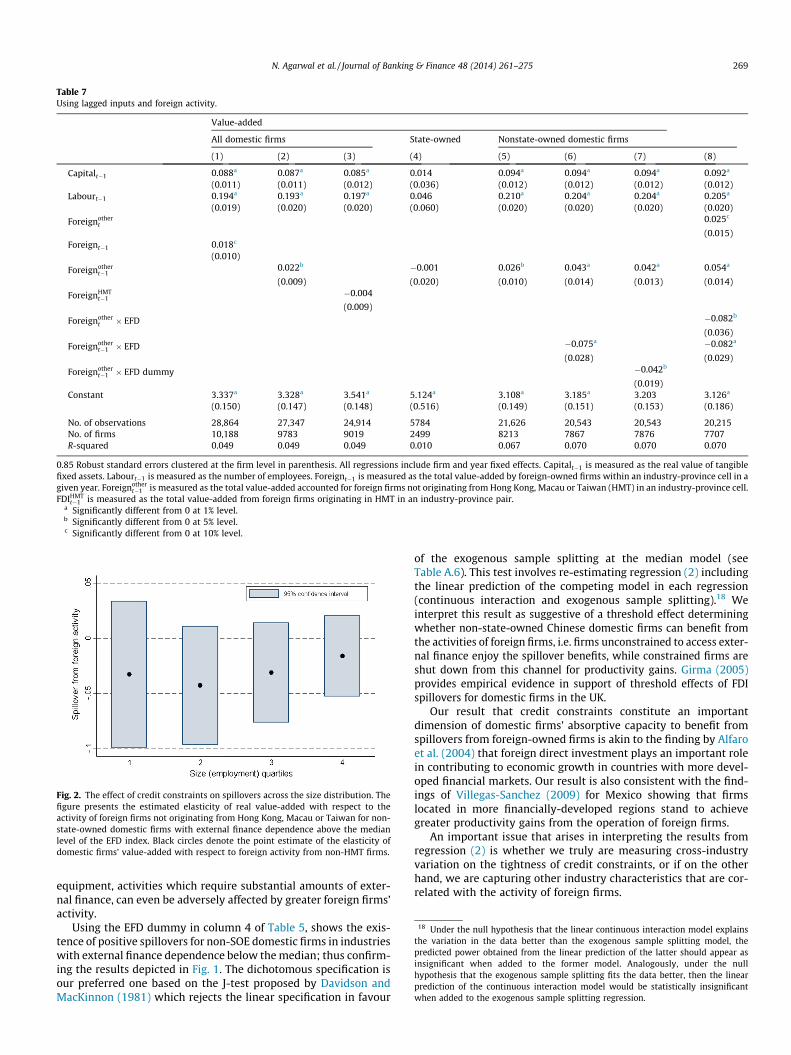
Table 7Using lagged inputs and foreign activity.
Value-added
All domestic firms State-owned Nonstate-owned domestic firms
(1) (2) (3) (4) (5) (6) (7) (8)
Capitalt�1 0.088a 0.087a 0.085a 0.014 0.094a 0.094a 0.094a 0.092a
(0.011) (0.011) (0.012) (0.036) (0.012) (0.012) (0.012) (0.012)Labourt�1 0.194a 0.193a 0.197a 0.046 0.210a 0.204a 0.204a 0.205a
(0.019) (0.020) (0.020) (0.060) (0.020) (0.020) (0.020) (0.020)
Foreignothert
0.025c
(0.015)Foreignt�1 0.018c
(0.010)
Foreignothert�1
0.022b �0.001 0.026b 0.043a 0.042a 0.054a
(0.009) (0.020) (0.010) (0.014) (0.013) (0.014)
ForeignHMTt�1
�0.004
(0.009)
Foreignothert � EFD �0.082b
(0.036)
Foreignothert�1 � EFD �0.075a �0.082a
(0.028) (0.029)
Foreignothert�1 � EFD dummy �0.042b
(0.019)Constant 3.337a 3.328a 3.541a 5.124a 3.108a 3.185a 3.203 3.126a
(0.150) (0.147) (0.148) (0.516) (0.149) (0.151) (0.153) (0.186)
No. of observations 28,864 27,347 24,914 5784 21,626 20,543 20,543 20,215No. of firms 10,188 9783 9019 2499 8213 7867 7876 7707R-squared 0.049 0.049 0.049 0.010 0.067 0.070 0.070 0.070
0.85 Robust standard errors clustered at the firm level in parenthesis. All regressions include firm and year fixed effects. Capitalt�1 is measured as the real value of tangiblefixed assets. Labourt�1 is measured as the number of employees. Foreignt�1 is measured as the total value-added by foreign-owned firms within an industry-province cell in agiven year. Foreignother
t�1 is measured as the total value-added accounted for foreign firms not originating from Hong Kong, Macau or Taiwan (HMT) in an industry-province cell.FDIHMT
t�1 is measured as the total value-added from foreign firms originating in HMT in an industry-province pair.a Significantly different from 0 at 1% level.b Significantly different from 0 at 5% level.c Significantly different from 0 at 10% level.
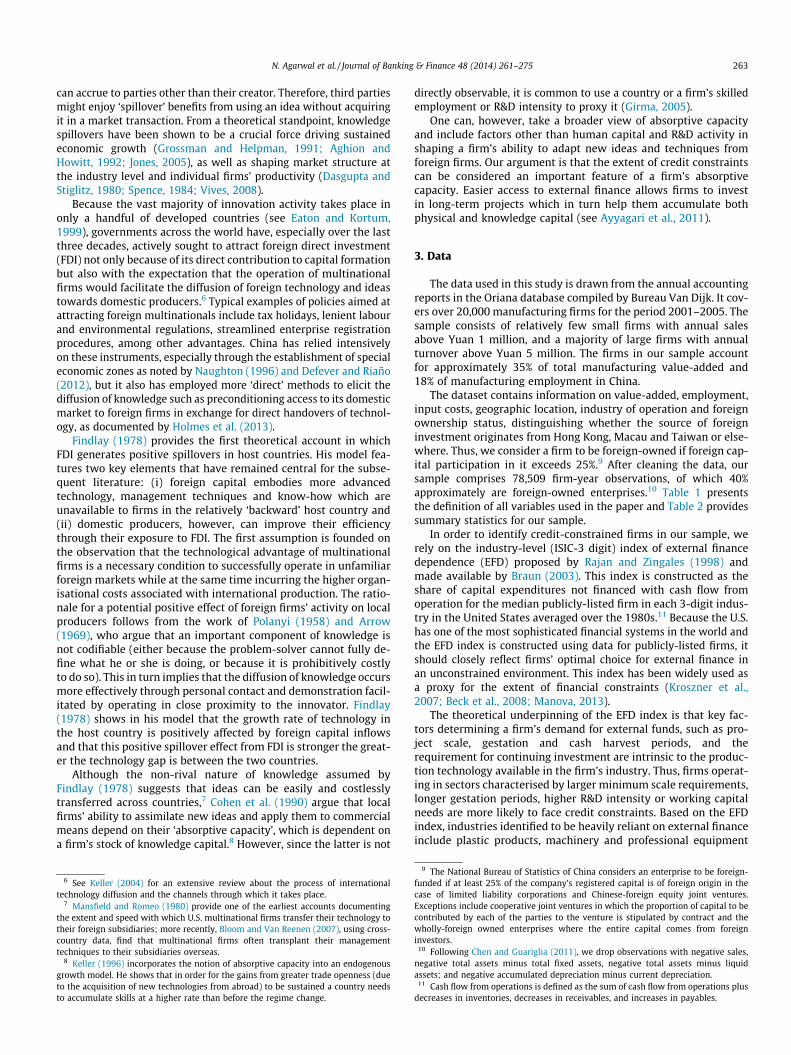
Fig. 2. The effect of credit constraints on spillovers across the size distribution. Thefigure presents the estimated elasticity of real value-added with respect to theactivity of foreign firms not originating from Hong Kong, Macau or Taiwan for non-state-owned domestic firms with external finance dependence above the medianlevel of the EFD index. Black circles denote the point estimate of the elasticity ofdomestic firms’ value-added with respect to foreign activity from non-HMT firms.
18 Under the null hypothesis that the linear continuous interaction model explainsthe variation in the data better than the exogenous sample splitting model, thepredicted power obtained from the linear prediction of the latter should appear asinsignificant when added to the former model. Analogously, under the nullhypothesis that the exogenous sample splitting fits the data better, then the linearprediction of the continuous interaction model would be statistically insignificantwhen added to the exogenous sample splitting regression.
N. Agarwal et al. / Journal of Banking & Finance 48 (2014) 261–275 269
equipment, activities which require substantial amounts of exter-nal finance, can even be adversely affected by greater foreign firms’activity.
Using the EFD dummy in column 4 of Table 5, shows the exis-tence of positive spillovers for non-SOE domestic firms in industrieswith external finance dependence below the median; thus confirm-ing the results depicted in Fig. 1. The dichotomous specification isour preferred one based on the J-test proposed by Davidson andMacKinnon (1981) which rejects the linear specification in favour
of the exogenous sample splitting at the median model (seeTable A.6). This test involves re-estimating regression (2) includingthe linear prediction of the competing model in each regression(continuous interaction and exogenous sample splitting).18 Weinterpret this result as suggestive of a threshold effect determiningwhether non-state-owned Chinese domestic firms can benefit fromthe activities of foreign firms, i.e. firms unconstrained to access exter-nal finance enjoy the spillover benefits, while constrained firms areshut down from this channel for productivity gains. Girma (2005)provides empirical evidence in support of threshold effects of FDIspillovers for domestic firms in the UK.
Our result that credit constraints constitute an importantdimension of domestic firms’ absorptive capacity to benefit fromspillovers from foreign-owned firms is akin to the finding by Alfaroet al. (2004) that foreign direct investment plays an important rolein contributing to economic growth in countries with more devel-oped financial markets. Our result is also consistent with the find-ings of Villegas-Sanchez (2009) for Mexico showing that firmslocated in more financially-developed regions stand to achievegreater productivity gains from the operation of foreign firms.
An important issue that arises in interpreting the results fromregression (2) is whether we truly are measuring cross-industryvariation on the tightness of credit constraints, or if on the otherhand, we are capturing other industry characteristics that are cor-related with the activity of foreign firms.
Table A.1Correlation matrix for industry-level characteristics.
EFD EFD1970 EFD1980CAN
Tangibilityindex
Capital intensityindex
Liquidityindex
Durabilityindex
Investment priceindex
Tradabilityindex
EFD 1
EFD1970 0.628 1
EFD1980CAN
0.588 0.495 1
Tangibility index 0.009 0.199 �0.239 1Capital intensity index �0.091 �0.026 �0.219 0.674 1Liquidity index �0.167 �0.048 �0.050 �0.644 �0.485 1Durability index 0.244 0.466 0.416 �0.151 �0.218 0.192 1Investment price index 0.379 0.681 0.362 �0.187 �0.222 0.164 0.654 1Tradability index 0.142 0.069 �0.182 0.092 �0.099 0.104 0.315 0.034 1
Table A.2Adding time-varying firm characteristics.
Value-added of domestic firms
(1) (2) (3) (4)
Capital 0.199a 0.198a 0.200a 0.198a
(0.011) (0.011) (0.011) (0.011)Labour 0.559a 0.552a 0.559a 0.551a
(0.018) (0.018) (0.018) (0.018)Foreign 0.024a 0.024a 0.024a 0.024a
(0.008) (0.008) (0.008) (0.008)Export dummy 0.100a 0.100a
(0.016) (0.016)Age 0.046 0.046
(0.039) (0.039)Constant 0.512a 0.524a 0.508a 0.520a
(0.131) (0.130) (0.131) (0.131)
No. of observations 40,537 40,537 40,513 40,513No. of firms 11,521 11,521 11,519 11,519R-squared 0.231 0.232 0.230 0.232
0.65 Robust standard errors clustered at the firm level in parenthesis. All regres-sions include firm and year fixed effects. Capital is measured as the real value oftangible fixed assets. Labour is measured as the number of employees. Foreign ismeasured as the total value-added by foreign-owned firms within an industry-province pair in a given year.b Significantly different from 0 at 5% level.c Significantly different from 0 at 10% level.
a Significantly different from 0 at 1% level.
Table A.3Clustering of standard errors at different levels of aggregation.
Value-added of domestic firms
One-way Two-way
Standard errors clusteredat:
Firm Industry-province
Industry andprovince
(1) (2) (3)
Capital 0.199a 0.199a 0.199a
(0.011) (0.011) (0.015)Labour 0.559a 0.559a 0.559a
(0.018) (0.021) (0.035)Foreign 0.024a 0.024c 0.024a
(0.008) (0.013) (0.008)Constant 0.512a 0.512a 0.000
(0.131) (0.175) (0.000)
No. of observations 40,537 40,537 40,537No. of clusters 11,521 466 –R-squared 0.231 0.231 0.231
All regressions include firm and year fixed effects. Two-way clustering at theindustry and province level results (column 3) are estimated using the cgmreg
command in Stata. Capital is measured as the real value of tangible fixed assets.Labour is measured as the number of employees. FDI is measured as the total value-added by foreign-owned firms within an industry-province pair in a given year.b Significantly different from 0 at 5% level.
a Significantly different from 0 at 1% level.c Significantly different from 0 at 10% level.
Table A.4Two-digit sector-specific production function parameters.
Value-added of domestic firms
(1) (2)
Capital 0.199a 0.504(0.011) (0.326)
Labour 0.559a 0.516c
(0.018) (0.277)Foreign 0.024a 0.022a
(0.008) (0.008)Constant 0.512a 0.509a
(0.131) (0.129)
No. of observations 40,537 40,537No. of firms 11,521 11,521R-squared 0.231 0.235
Robust standard errors clustered at the firm level in parenthesis. The regression incolumn (2) includes 2-digit industry � capital, and 2-digit industry � labourinteractions as well as firm and year fixed effects. Capital is measured as the realvalue of tangible fixed assets. Labour is measured as the number of employees.Foreign is measured as the total value-added by foreign-owned firms within anindustry-province cell in a given year.b Significantly different from 0 at 5% level.
a Significantly different from 0 at 1% level.c Significantly different from 0 at 10% level.
Table A.5Using Total Factor Productivity (TFP) as dependent variable.
Domestic firms
Value-added TFP(1) (2)
Capital 0.199a
(0.011)Labour 0.559a
(0.018)Foreign 0.024a 0.026a
(0.008) (0.008)Constant 0.512a 2.719a
(0.131) (0.075)
No. of observations 40,537 40,537No. of firms 11,521 11,521R-squared 0.231 0.042
Robust standard errors clustered at the firm level in parenthesis. All regressionsinclude firm and year fixed effects. Capital is measured as the real value of tangiblefixed assets. Labour is measured as the number of employees. Foreign is measuredas the total value-added by foreign-owned firms within an industry-province pairin a given year. Total Factor Productivity (TFP) is calculated using the Levinsohn andPetrin (2003) algorithm.b Significantly different from 0 at 5% level.c Significantly different from 0 at 10% level.
a Significantly different from 0 at 1% level.
270 N. Agarwal et al. / Journal of Banking & Finance 48 (2014) 261–275
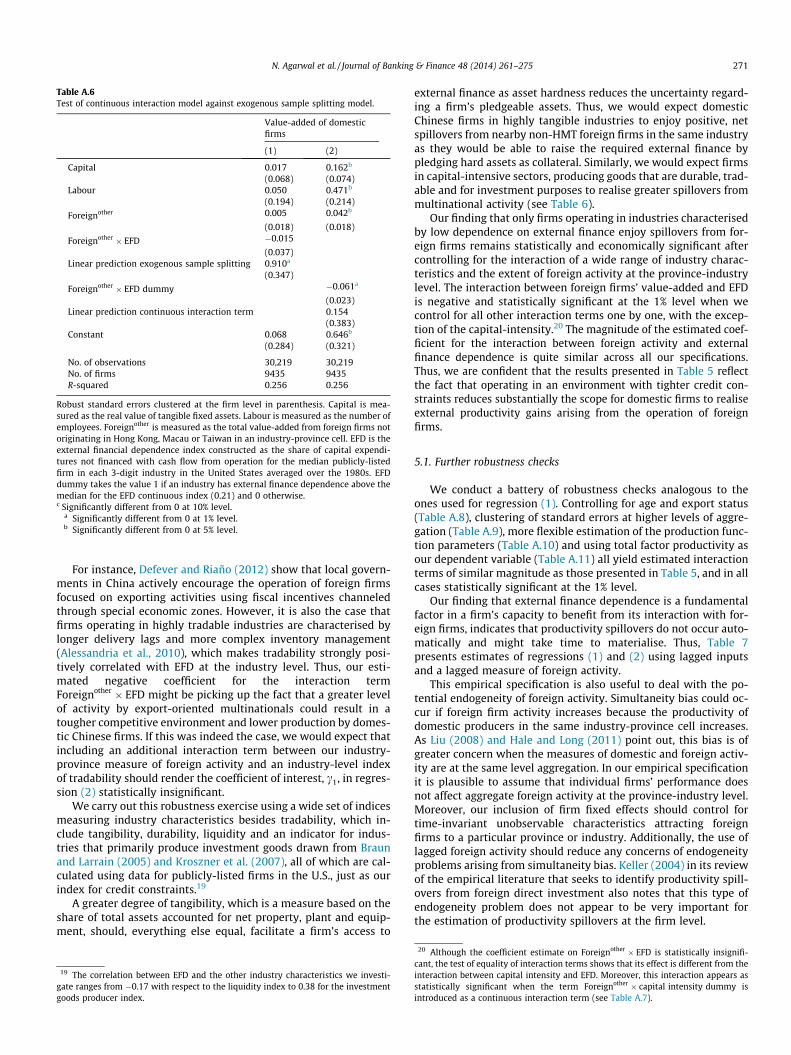
Table A.6Test of continuous interaction model against exogenous sample splitting model.
Value-added of domesticfirms
(1) (2)
Capital 0.017 0.162b
(0.068) (0.074)Labour 0.050 0.471b
(0.194) (0.214)
Foreignother 0.005 0.042b
(0.018) (0.018)
Foreignother � EFD �0.015
(0.037)Linear prediction exogenous sample splitting 0.910a
(0.347)
Foreignother � EFD dummy �0.061a
(0.023)Linear prediction continuous interaction term 0.154
(0.383)Constant 0.068 0.646b
(0.284) (0.321)
No. of observations 30,219 30,219No. of firms 9435 9435R-squared 0.256 0.256
Robust standard errors clustered at the firm level in parenthesis. Capital is mea-sured as the real value of tangible fixed assets. Labour is measured as the number ofemployees. Foreignother is measured as the total value-added from foreign firms notoriginating in Hong Kong, Macau or Taiwan in an industry-province cell. EFD is theexternal financial dependence index constructed as the share of capital expendi-tures not financed with cash flow from operation for the median publicly-listedfirm in each 3-digit industry in the United States averaged over the 1980s. EFDdummy takes the value 1 if an industry has external finance dependence above themedian for the EFD continuous index (0.21) and 0 otherwise.c Significantly different from 0 at 10% level.
a Significantly different from 0 at 1% level.b Significantly different from 0 at 5% level.
N. Agarwal et al. / Journal of Banking & Finance 48 (2014) 261–275 271
For instance, Defever and Riaño (2012) show that local govern-ments in China actively encourage the operation of foreign firmsfocused on exporting activities using fiscal incentives channeledthrough special economic zones. However, it is also the case thatfirms operating in highly tradable industries are characterised bylonger delivery lags and more complex inventory management(Alessandria et al., 2010), which makes tradability strongly posi-tively correlated with EFD at the industry level. Thus, our esti-mated negative coefficient for the interaction termForeignother � EFD might be picking up the fact that a greater levelof activity by export-oriented multinationals could result in atougher competitive environment and lower production by domes-tic Chinese firms. If this was indeed the case, we would expect thatincluding an additional interaction term between our industry-province measure of foreign activity and an industry-level indexof tradability should render the coefficient of interest, c1, in regres-sion (2) statistically insignificant.
We carry out this robustness exercise using a wide set of indicesmeasuring industry characteristics besides tradability, which in-clude tangibility, durability, liquidity and an indicator for indus-tries that primarily produce investment goods drawn from Braunand Larrain (2005) and Kroszner et al. (2007), all of which are cal-culated using data for publicly-listed firms in the U.S., just as ourindex for credit constraints.19
A greater degree of tangibility, which is a measure based on theshare of total assets accounted for net property, plant and equip-ment, should, everything else equal, facilitate a firm’s access to
19 The correlation between EFD and the other industry characteristics we investi-gate ranges from �0.17 with respect to the liquidity index to 0.38 for the investmentgoods producer index.
external finance as asset hardness reduces the uncertainty regard-ing a firm’s pledgeable assets. Thus, we would expect domesticChinese firms in highly tangible industries to enjoy positive, netspillovers from nearby non-HMT foreign firms in the same industryas they would be able to raise the required external finance bypledging hard assets as collateral. Similarly, we would expect firmsin capital-intensive sectors, producing goods that are durable, trad-able and for investment purposes to realise greater spillovers frommultinational activity (see Table 6).
Our finding that only firms operating in industries characterisedby low dependence on external finance enjoy spillovers from for-eign firms remains statistically and economically significant aftercontrolling for the interaction of a wide range of industry charac-teristics and the extent of foreign activity at the province-industrylevel. The interaction between foreign firms’ value-added and EFDis negative and statistically significant at the 1% level when wecontrol for all other interaction terms one by one, with the excep-tion of the capital-intensity.20 The magnitude of the estimated coef-ficient for the interaction between foreign activity and externalfinance dependence is quite similar across all our specifications.Thus, we are confident that the results presented in Table 5 reflectthe fact that operating in an environment with tighter credit con-straints reduces substantially the scope for domestic firms to realiseexternal productivity gains arising from the operation of foreignfirms.
5.1. Further robustness checks
We conduct a battery of robustness checks analogous to theones used for regression (1). Controlling for age and export status(Table A.8), clustering of standard errors at higher levels of aggre-gation (Table A.9), more flexible estimation of the production func-tion parameters (Table A.10) and using total factor productivity asour dependent variable (Table A.11) all yield estimated interactionterms of similar magnitude as those presented in Table 5, and in allcases statistically significant at the 1% level.
Our finding that external finance dependence is a fundamentalfactor in a firm’s capacity to benefit from its interaction with for-eign firms, indicates that productivity spillovers do not occur auto-matically and might take time to materialise. Thus, Table 7presents estimates of regressions (1) and (2) using lagged inputsand a lagged measure of foreign activity.
This empirical specification is also useful to deal with the po-tential endogeneity of foreign activity. Simultaneity bias could oc-cur if foreign firm activity increases because the productivity ofdomestic producers in the same industry-province cell increases.As Liu (2008) and Hale and Long (2011) point out, this bias is ofgreater concern when the measures of domestic and foreign activ-ity are at the same level aggregation. In our empirical specificationit is plausible to assume that individual firms’ performance doesnot affect aggregate foreign activity at the province-industry level.Moreover, our inclusion of firm fixed effects should control fortime-invariant unobservable characteristics attracting foreignfirms to a particular province or industry. Additionally, the use oflagged foreign activity should reduce any concerns of endogeneityproblems arising from simultaneity bias. Keller (2004) in its reviewof the empirical literature that seeks to identify productivity spill-overs from foreign direct investment also notes that this type ofendogeneity problem does not appear to be very important forthe estimation of productivity spillovers at the firm level.
20 Although the coefficient estimate on Foreignother � EFD is statistically insignifi-cant, the test of equality of interaction terms shows that its effect is different from theinteraction between capital intensity and EFD. Moreover, this interaction appears asstatistically significant when the term Foreignother � capital intensity dummy isintroduced as a continuous interaction term (see Table A.7).
Table A.7Is external finance dependence measuring other industry-level characteristics? Using continuous interaction terms.
Value-added of non-state-owned domestic firms
(1) (2) (3) (4) (5) (6) (7)
Foreignother 0.043a �0.048b �0.013 0.111a 0.019 0.043a �0.019
(0.012) (0.023) (0.018) (0.037) (0.013) (0.012) (0.024)
Foreignother � EFD �0.097a �0.071a �0.071a �0.090a �0.104a �0.097a �0.082a
(0.025) (0.025) (0.025) (0.026) (0.026) (0.029) (0.025)
Foreignother � tangibility index 0.256a
(0.062)
Foreignother � capital intensity index 0.001a
(0.000)
Foreignother � liquidity index �0.435c
(0.228)
Foreignother � durability index 0.044a
(0.016)
Foreignother � investment goods producer index �0.0001
(0.029)
Foreignother � tradability index 0.095a
(0.035)Constant 0.723a 0.778a 0.787a 0.741a 0.763a 0.723a 0.765a
(0.141) (0.140) (0.141) (0.141) (0.141) (0.141) (0.140)
No. of observations 30,219 30,219 30,219 30,219 30,219 30,219 30,219No. of firms 9435 9435 9435 9435 9435 9435 9435R-squared 0.256 0.256 0.256 0.256 0.256 0.256 0.256F-test of equality of interaction terms 25.72a 8.47a 2.19 19.98a 3.74c 19.52a
Robust standard errors clustered at the firm level in parenthesis. All regressions include firm and year fixed effects. The coefficients on capital and labour are not reported tosave space. Tangibility is an indicator calculated as the median ratio of net property, plant and equipment to the book value of assets of all US based companies in a givenindustry, calculated from Compustat’s annual industrial files for 1986–1995 (Braun, 2003). Capital intensity is an indicator defined as the median level of the ratio of fixedassets over number of employees of US firms in Compustat for the period 1980–1999 (Kroszner et al., 2007). Liquidity is an index calculated as the median level of liquidityneeds for all active US based companies in the industry calculated from Compustat’s annual industrial files for 1980–1999 (Kroszner et al., 2007). Durability is an index ofwhether firms in an industry produce predominantly durable goods, using the classification of US industries provided by the US Bureau of Economic Analysis (Kroszner et al.,2007). Investment goods producer is an indicator which measures how tilted towards investment goods relative to consumption goods an industry is (Braun and Larrain,2005). Tradibility is constructed as the ratio trade/(trade + domestic use), where trade is defined as exports plus imports, and domestic use is defined as consumption plusinvestment, either private or public (Braun and Larrain, 2005). Foreignother is measured as the total value-added from foreign firms not originating in Hong Kong, Macau orTaiwan in a given industry-province cell.
a Significantly different from 0 at 1% level.b Significantly different from 0 at 5% level.c Significantly different from 0 at 10% level.
Table A.8Adding time-varying firm characteristics – interaction regression.
Value-added of non-state-owned domestic firms Only
(1) (2) (3) (4) (5) (6) (7) (8)
Capital 0.191a 0.190a 0.191a 0.190a 0.191a 0.190a 0.191a 0.190a
(0.012) (0.012) (0.012) (0.012) (0.012) (0.012) (0.012) (0.012)Labour 0.556a 0.552a 0.556a 0.552a 0.556a 0.552a 0.556a 0.552a
(0.019) (0.019) (0.019) (0.019) (0.019) (0.019) (0.019) (0.019)
Foreignother 0.043a 0.044a 0.044a 0.044a 0.047a 0.048a 0.048a 0.048a
(0.012) (0.012) (0.012) (0.012) (0.012) (0.012) (0.012) (0.012)
Foreignother � EFD �0.097a �0.099a �0.098a �0.100a
(0.025) (0.025) (0.025) (0.025)
Foreignother � EFD dummy �0.067a �0.068a �0.068a �0.069a
(0.016) (0.016) (0.016) (0.016)Export dummy 0.067a 0.067a 0.068a 0.068a
(0.018) (0.018) (0.018) (0.018)Age �0.002 �0.005 �0.000 �0.003
(0.068) (0.068) (0.069) (0.069)Constant 0.723a 0.725a 0.720a 0.722a 0.756a 0.759a 0.754a 0.756a
(0.141) (0.140) (0.141) (0.140) (0.141) (0.141) (0.141) (0.141)
Number of observations 30,219 30,219 30,201 30,201 30,219 30,219 30,201 30,201Number of firms 9435 9435 9434 9434 9435 9435 9434 9434R-squared 0.26 0.26 0.26 0.26 0.256 0.257 0.256 0.257
Robust standard errors clustered at the firm level in parenthesis. Capital is measured as the real value of tangible fixed assets. Labour is measured as the number ofemployees. Foreignother is measured as the total value-added from foreign firms originating elsewhere in an industry-province cell. EFD is the external financial dependenceindex constructed as the share of capital expenditures not financed with cash flows from operation for the median publicly-listed firm in each 3-digit industry in the UnitedStates averaged over the 1980s. EFD dummy takes the value 1 if an industry has external finance dependence above the index median (0.21) and 0 otherwise.b Significantly different from 0 at 5% level.c Significantly different from 0 at 10% level.
a Significantly different from 0 at 1% level.
272 N. Agarwal et al. / Journal of Banking & Finance 48 (2014) 261–275
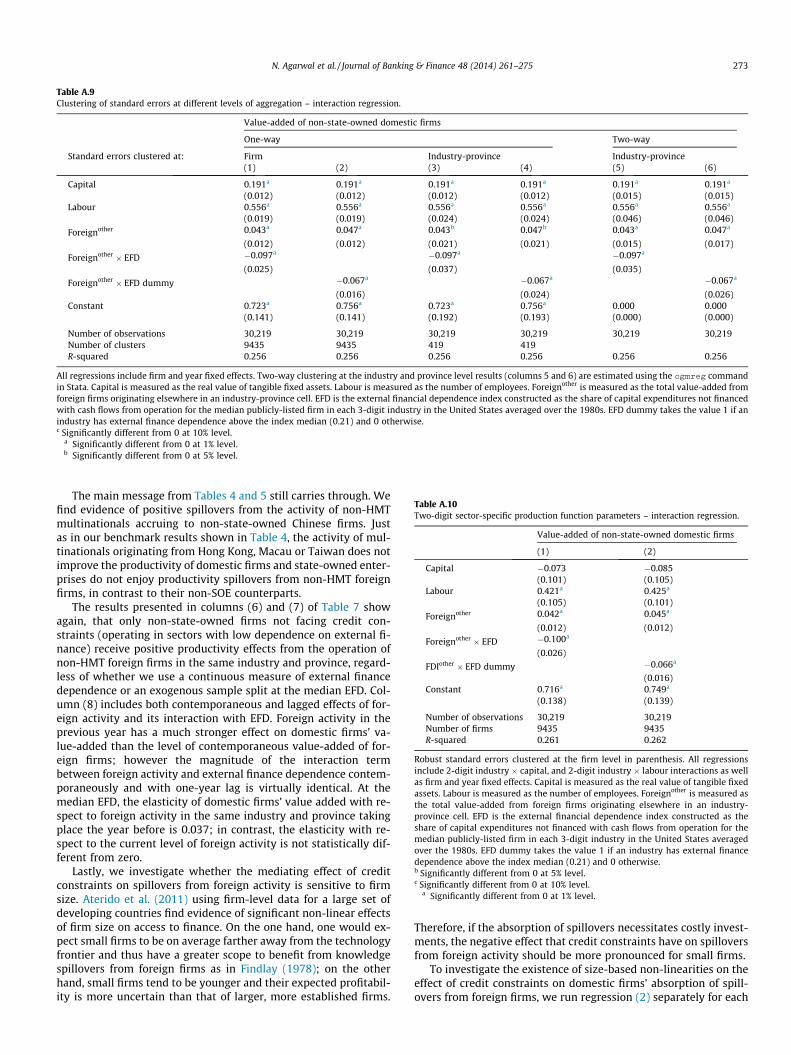
Table A.9Clustering of standard errors at different levels of aggregation – interaction regression.
Value-added of non-state-owned domestic firms
One-way Two-way
Standard errors clustered at: Firm Industry-province Industry-province(1) (2) (3) (4) (5) (6)
Capital 0.191a 0.191a 0.191a 0.191a 0.191a 0.191a
(0.012) (0.012) (0.012) (0.012) (0.015) (0.015)Labour 0.556a 0.556a 0.556a 0.556a 0.556a 0.556a
(0.019) (0.019) (0.024) (0.024) (0.046) (0.046)
Foreignother 0.043a 0.047a 0.043b 0.047b 0.043a 0.047a
(0.012) (0.012) (0.021) (0.021) (0.015) (0.017)
Foreignother � EFD �0.097a �0.097a �0.097a
(0.025) (0.037) (0.035)
Foreignother � EFD dummy �0.067a �0.067a �0.067a
(0.016) (0.024) (0.026)Constant 0.723a 0.756a 0.723a 0.756a 0.000 0.000
(0.141) (0.141) (0.192) (0.193) (0.000) (0.000)
Number of observations 30,219 30,219 30,219 30,219 30,219 30,219Number of clusters 9435 9435 419 419R-squared 0.256 0.256 0.256 0.256 0.256 0.256
All regressions include firm and year fixed effects. Two-way clustering at the industry and province level results (columns 5 and 6) are estimated using the cgmreg commandin Stata. Capital is measured as the real value of tangible fixed assets. Labour is measured as the number of employees. Foreignother is measured as the total value-added fromforeign firms originating elsewhere in an industry-province cell. EFD is the external financial dependence index constructed as the share of capital expenditures not financedwith cash flows from operation for the median publicly-listed firm in each 3-digit industry in the United States averaged over the 1980s. EFD dummy takes the value 1 if anindustry has external finance dependence above the index median (0.21) and 0 otherwise.c Significantly different from 0 at 10% level.
a Significantly different from 0 at 1% level.b Significantly different from 0 at 5% level.
Table A.10Two-digit sector-specific production function parameters – interaction regression.
Value-added of non-state-owned domestic firms
(1) (2)
Capital �0.073 �0.085(0.101) (0.105)
Labour 0.421a 0.425a
(0.105) (0.101)
Foreignother 0.042a 0.045a
(0.012) (0.012)
Foreignother � EFD �0.100a
(0.026)
FDIother � EFD dummy �0.066a
(0.016)Constant 0.716a 0.749a
(0.138) (0.139)
Number of observations 30,219 30,219Number of firms 9435 9435R-squared 0.261 0.262
Robust standard errors clustered at the firm level in parenthesis. All regressionsinclude 2-digit industry � capital, and 2-digit industry � labour interactions as wellas firm and year fixed effects. Capital is measured as the real value of tangible fixedassets. Labour is measured as the number of employees. Foreignother is measured asthe total value-added from foreign firms originating elsewhere in an industry-province cell. EFD is the external financial dependence index constructed as theshare of capital expenditures not financed with cash flows from operation for themedian publicly-listed firm in each 3-digit industry in the United States averagedover the 1980s. EFD dummy takes the value 1 if an industry has external financedependence above the index median (0.21) and 0 otherwise.b Significantly different from 0 at 5% level.c Significantly different from 0 at 10% level.
a Significantly different from 0 at 1% level.
N. Agarwal et al. / Journal of Banking & Finance 48 (2014) 261–275 273
The main message from Tables 4 and 5 still carries through. Wefind evidence of positive spillovers from the activity of non-HMTmultinationals accruing to non-state-owned Chinese firms. Justas in our benchmark results shown in Table 4, the activity of mul-tinationals originating from Hong Kong, Macau or Taiwan does notimprove the productivity of domestic firms and state-owned enter-prises do not enjoy productivity spillovers from non-HMT foreignfirms, in contrast to their non-SOE counterparts.
The results presented in columns (6) and (7) of Table 7 showagain, that only non-state-owned firms not facing credit con-straints (operating in sectors with low dependence on external fi-nance) receive positive productivity effects from the operation ofnon-HMT foreign firms in the same industry and province, regard-less of whether we use a continuous measure of external financedependence or an exogenous sample split at the median EFD. Col-umn (8) includes both contemporaneous and lagged effects of for-eign activity and its interaction with EFD. Foreign activity in theprevious year has a much stronger effect on domestic firms’ va-lue-added than the level of contemporaneous value-added of for-eign firms; however the magnitude of the interaction termbetween foreign activity and external finance dependence contem-poraneously and with one-year lag is virtually identical. At themedian EFD, the elasticity of domestic firms’ value added with re-spect to foreign activity in the same industry and province takingplace the year before is 0.037; in contrast, the elasticity with re-spect to the current level of foreign activity is not statistically dif-ferent from zero.
Lastly, we investigate whether the mediating effect of creditconstraints on spillovers from foreign activity is sensitive to firmsize. Aterido et al. (2011) using firm-level data for a large set ofdeveloping countries find evidence of significant non-linear effectsof firm size on access to finance. On the one hand, one would ex-pect small firms to be on average farther away from the technologyfrontier and thus have a greater scope to benefit from knowledgespillovers from foreign firms as in Findlay (1978); on the otherhand, small firms tend to be younger and their expected profitabil-ity is more uncertain than that of larger, more established firms.
Therefore, if the absorption of spillovers necessitates costly invest-ments, the negative effect that credit constraints have on spilloversfrom foreign activity should be more pronounced for small firms.
To investigate the existence of size-based non-linearities on theeffect of credit constraints on domestic firms’ absorption of spill-overs from foreign firms, we run regression (2) separately for each
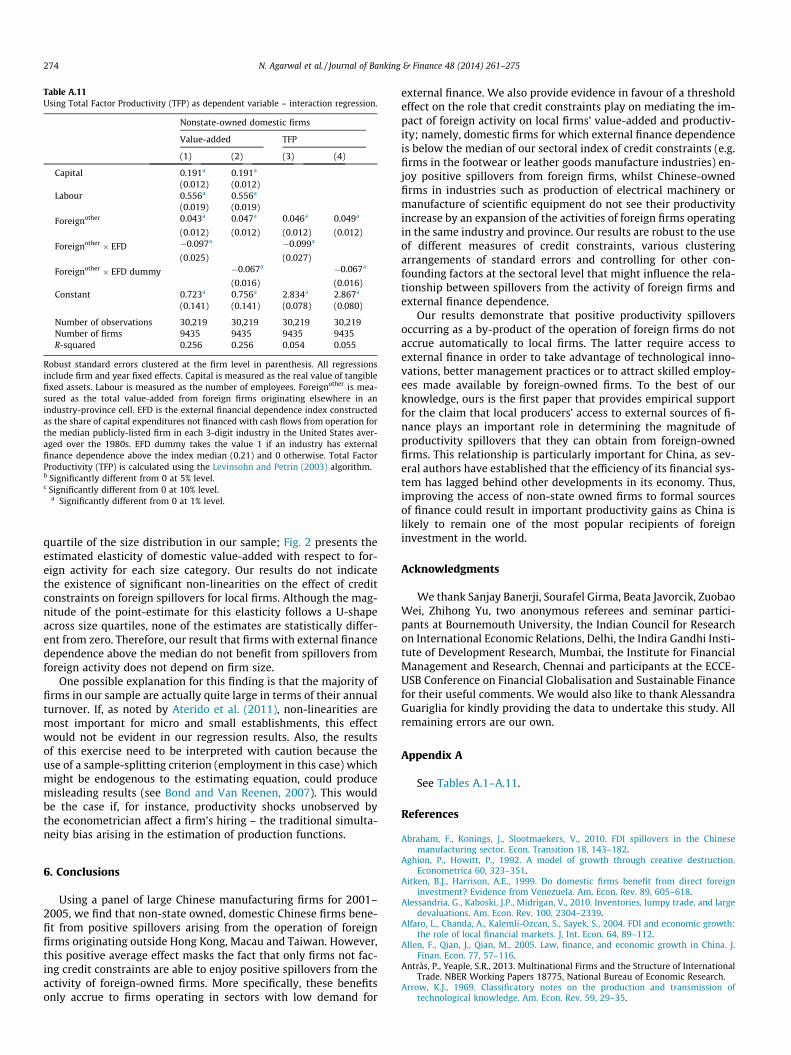
Table A.11Using Total Factor Productivity (TFP) as dependent variable – interaction regression.
Nonstate-owned domestic firms
Value-added TFP
(1) (2) (3) (4)
Capital 0.191a 0.191a
(0.012) (0.012)Labour 0.556a 0.556a
(0.019) (0.019)
Foreignother 0.043a 0.047a 0.046a 0.049a
(0.012) (0.012) (0.012) (0.012)
Foreignother � EFD �0.097a �0.099a
(0.025) (0.027)
Foreignother � EFD dummy �0.067a �0.067a
(0.016) (0.016)Constant 0.723a 0.756a 2.834a 2.867a
(0.141) (0.141) (0.078) (0.080)
Number of observations 30,219 30,219 30,219 30,219Number of firms 9435 9435 9435 9435R-squared 0.256 0.256 0.054 0.055
Robust standard errors clustered at the firm level in parenthesis. All regressionsinclude firm and year fixed effects. Capital is measured as the real value of tangiblefixed assets. Labour is measured as the number of employees. Foreignother is mea-sured as the total value-added from foreign firms originating elsewhere in anindustry-province cell. EFD is the external financial dependence index constructedas the share of capital expenditures not financed with cash flows from operation forthe median publicly-listed firm in each 3-digit industry in the United States aver-aged over the 1980s. EFD dummy takes the value 1 if an industry has externalfinance dependence above the index median (0.21) and 0 otherwise. Total FactorProductivity (TFP) is calculated using the Levinsohn and Petrin (2003) algorithm.b Significantly different from 0 at 5% level.c Significantly different from 0 at 10% level.
a Significantly different from 0 at 1% level.
274 N. Agarwal et al. / Journal of Banking & Finance 48 (2014) 261–275
quartile of the size distribution in our sample; Fig. 2 presents theestimated elasticity of domestic value-added with respect to for-eign activity for each size category. Our results do not indicatethe existence of significant non-linearities on the effect of creditconstraints on foreign spillovers for local firms. Although the mag-nitude of the point-estimate for this elasticity follows a U-shapeacross size quartiles, none of the estimates are statistically differ-ent from zero. Therefore, our result that firms with external financedependence above the median do not benefit from spillovers fromforeign activity does not depend on firm size.
One possible explanation for this finding is that the majority offirms in our sample are actually quite large in terms of their annualturnover. If, as noted by Aterido et al. (2011), non-linearities aremost important for micro and small establishments, this effectwould not be evident in our regression results. Also, the resultsof this exercise need to be interpreted with caution because theuse of a sample-splitting criterion (employment in this case) whichmight be endogenous to the estimating equation, could producemisleading results (see Bond and Van Reenen, 2007). This wouldbe the case if, for instance, productivity shocks unobserved bythe econometrician affect a firm’s hiring – the traditional simulta-neity bias arising in the estimation of production functions.
6. Conclusions
Using a panel of large Chinese manufacturing firms for 2001–2005, we find that non-state owned, domestic Chinese firms bene-fit from positive spillovers arising from the operation of foreignfirms originating outside Hong Kong, Macau and Taiwan. However,this positive average effect masks the fact that only firms not fac-ing credit constraints are able to enjoy positive spillovers from theactivity of foreign-owned firms. More specifically, these benefitsonly accrue to firms operating in sectors with low demand for
external finance. We also provide evidence in favour of a thresholdeffect on the role that credit constraints play on mediating the im-pact of foreign activity on local firms’ value-added and productiv-ity; namely, domestic firms for which external finance dependenceis below the median of our sectoral index of credit constraints (e.g.firms in the footwear or leather goods manufacture industries) en-joy positive spillovers from foreign firms, whilst Chinese-ownedfirms in industries such as production of electrical machinery ormanufacture of scientific equipment do not see their productivityincrease by an expansion of the activities of foreign firms operatingin the same industry and province. Our results are robust to the useof different measures of credit constraints, various clusteringarrangements of standard errors and controlling for other con-founding factors at the sectoral level that might influence the rela-tionship between spillovers from the activity of foreign firms andexternal finance dependence.
Our results demonstrate that positive productivity spilloversoccurring as a by-product of the operation of foreign firms do notaccrue automatically to local firms. The latter require access toexternal finance in order to take advantage of technological inno-vations, better management practices or to attract skilled employ-ees made available by foreign-owned firms. To the best of ourknowledge, ours is the first paper that provides empirical supportfor the claim that local producers’ access to external sources of fi-nance plays an important role in determining the magnitude ofproductivity spillovers that they can obtain from foreign-ownedfirms. This relationship is particularly important for China, as sev-eral authors have established that the efficiency of its financial sys-tem has lagged behind other developments in its economy. Thus,improving the access of non-state owned firms to formal sourcesof finance could result in important productivity gains as China islikely to remain one of the most popular recipients of foreigninvestment in the world.
Acknowledgments
We thank Sanjay Banerji, Sourafel Girma, Beata Javorcik, ZuobaoWei, Zhihong Yu, two anonymous referees and seminar partici-pants at Bournemouth University, the Indian Council for Researchon International Economic Relations, Delhi, the Indira Gandhi Insti-tute of Development Research, Mumbai, the Institute for FinancialManagement and Research, Chennai and participants at the ECCE-USB Conference on Financial Globalisation and Sustainable Financefor their useful comments. We would also like to thank AlessandraGuariglia for kindly providing the data to undertake this study. Allremaining errors are our own.
Appendix A
See Tables A.1–A.11.
References
Abraham, F., Konings, J., Slootmaekers, V., 2010. FDI spillovers in the Chinesemanufacturing sector. Econ. Transition 18, 143–182.
Aghion, P., Howitt, P., 1992. A model of growth through creative destruction.Econometrica 60, 323–351.
Aitken, B.J., Harrison, A.E., 1999. Do domestic firms benefit from direct foreigninvestment? Evidence from Venezuela. Am. Econ. Rev. 89, 605–618.
Alessandria, G., Kaboski, J.P., Midrigan, V., 2010. Inventories, lumpy trade, and largedevaluations. Am. Econ. Rev. 100, 2304–2339.
Alfaro, L., Chanda, A., Kalemli-Ozcan, S., Sayek, S., 2004. FDI and economic growth:the role of local financial markets. J. Int. Econ. 64, 89–112.
Allen, F., Qian, J., Qian, M., 2005. Law, finance, and economic growth in China. J.Finan. Econ. 77, 57–116.
Antràs, P., Yeaple, S.R., 2013. Multinational Firms and the Structure of InternationalTrade. NBER Working Papers 18775, National Bureau of Economic Research.
Arrow, K.J., 1969. Classificatory notes on the production and transmission oftechnological knowledge. Am. Econ. Rev. 59, 29–35.
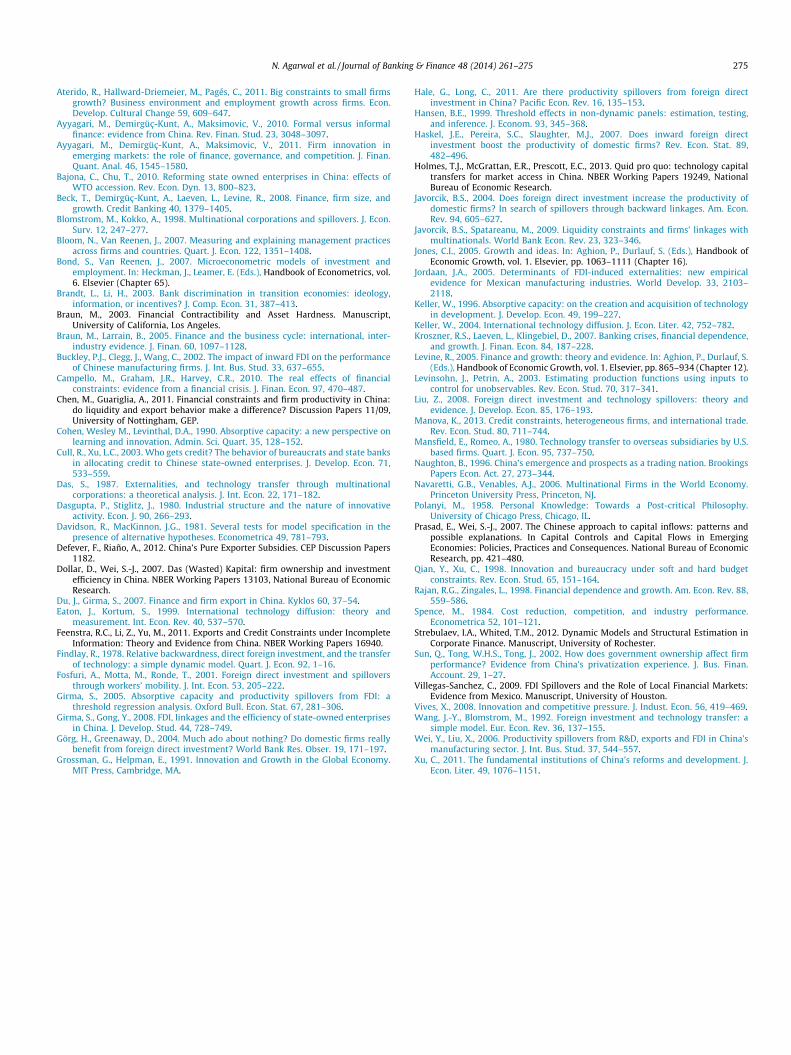
N. Agarwal et al. / Journal of Banking & Finance 48 (2014) 261–275 275
Aterido, R., Hallward-Driemeier, M., Pagés, C., 2011. Big constraints to small firmsgrowth? Business environment and employment growth across firms. Econ.Develop. Cultural Change 59, 609–647.
Ayyagari, M., Demirgüç-Kunt, A., Maksimovic, V., 2010. Formal versus informalfinance: evidence from China. Rev. Finan. Stud. 23, 3048–3097.
Ayyagari, M., Demirgüç-Kunt, A., Maksimovic, V., 2011. Firm innovation inemerging markets: the role of finance, governance, and competition. J. Finan.Quant. Anal. 46, 1545–1580.
Bajona, C., Chu, T., 2010. Reforming state owned enterprises in China: effects ofWTO accession. Rev. Econ. Dyn. 13, 800–823.
Beck, T., Demirgüç-Kunt, A., Laeven, L., Levine, R., 2008. Finance, firm size, andgrowth. Credit Banking 40, 1379–1405.
Blomstrom, M., Kokko, A., 1998. Multinational corporations and spillovers. J. Econ.Surv. 12, 247–277.
Bloom, N., Van Reenen, J., 2007. Measuring and explaining management practicesacross firms and countries. Quart. J. Econ. 122, 1351–1408.
Bond, S., Van Reenen, J., 2007. Microeconometric models of investment andemployment. In: Heckman, J., Leamer, E. (Eds.), Handbook of Econometrics, vol.6. Elsevier (Chapter 65).
Brandt, L., Li, H., 2003. Bank discrimination in transition economies: ideology,information, or incentives? J. Comp. Econ. 31, 387–413.
Braun, M., 2003. Financial Contractibility and Asset Hardness. Manuscript,University of California, Los Angeles.
Braun, M., Larrain, B., 2005. Finance and the business cycle: international, inter-industry evidence. J. Finan. 60, 1097–1128.
Buckley, P.J., Clegg, J., Wang, C., 2002. The impact of inward FDI on the performanceof Chinese manufacturing firms. J. Int. Bus. Stud. 33, 637–655.
Campello, M., Graham, J.R., Harvey, C.R., 2010. The real effects of financialconstraints: evidence from a financial crisis. J. Finan. Econ. 97, 470–487.
Chen, M., Guariglia, A., 2011. Financial constraints and firm productivity in China:do liquidity and export behavior make a difference? Discussion Papers 11/09,University of Nottingham, GEP.
Cohen, Wesley M., Levinthal, D.A., 1990. Absorptive capacity: a new perspective onlearning and innovation. Admin. Sci. Quart. 35, 128–152.
Cull, R., Xu, L.C., 2003. Who gets credit? The behavior of bureaucrats and state banksin allocating credit to Chinese state-owned enterprises. J. Develop. Econ. 71,533–559.
Das, S., 1987. Externalities, and technology transfer through multinationalcorporations: a theoretical analysis. J. Int. Econ. 22, 171–182.
Dasgupta, P., Stiglitz, J., 1980. Industrial structure and the nature of innovativeactivity. Econ. J. 90, 266–293.
Davidson, R., MacKinnon, J.G., 1981. Several tests for model specification in thepresence of alternative hypotheses. Econometrica 49, 781–793.
Defever, F., Riaño, A., 2012. China’s Pure Exporter Subsidies. CEP Discussion Papers1182.
Dollar, D., Wei, S.-J., 2007. Das (Wasted) Kapital: firm ownership and investmentefficiency in China. NBER Working Papers 13103, National Bureau of EconomicResearch.
Du, J., Girma, S., 2007. Finance and firm export in China. Kyklos 60, 37–54.Eaton, J., Kortum, S., 1999. International technology diffusion: theory and
measurement. Int. Econ. Rev. 40, 537–570.Feenstra, R.C., Li, Z., Yu, M., 2011. Exports and Credit Constraints under Incomplete
Information: Theory and Evidence from China. NBER Working Papers 16940.Findlay, R., 1978. Relative backwardness, direct foreign investment, and the transfer
of technology: a simple dynamic model. Quart. J. Econ. 92, 1–16.Fosfuri, A., Motta, M., Ronde, T., 2001. Foreign direct investment and spillovers
through workers’ mobility. J. Int. Econ. 53, 205–222.Girma, S., 2005. Absorptive capacity and productivity spillovers from FDI: a
threshold regression analysis. Oxford Bull. Econ. Stat. 67, 281–306.Girma, S., Gong, Y., 2008. FDI, linkages and the efficiency of state-owned enterprises
in China. J. Develop. Stud. 44, 728–749.Görg, H., Greenaway, D., 2004. Much ado about nothing? Do domestic firms really
benefit from foreign direct investment? World Bank Res. Obser. 19, 171–197.Grossman, G., Helpman, E., 1991. Innovation and Growth in the Global Economy.
MIT Press, Cambridge, MA.
Hale, G., Long, C., 2011. Are there productivity spillovers from foreign directinvestment in China? Pacific Econ. Rev. 16, 135–153.
Hansen, B.E., 1999. Threshold effects in non-dynamic panels: estimation, testing,and inference. J. Econom. 93, 345–368.
Haskel, J.E., Pereira, S.C., Slaughter, M.J., 2007. Does inward foreign directinvestment boost the productivity of domestic firms? Rev. Econ. Stat. 89,482–496.
Holmes, T.J., McGrattan, E.R., Prescott, E.C., 2013. Quid pro quo: technology capitaltransfers for market access in China. NBER Working Papers 19249, NationalBureau of Economic Research.
Javorcik, B.S., 2004. Does foreign direct investment increase the productivity ofdomestic firms? In search of spillovers through backward linkages. Am. Econ.Rev. 94, 605–627.
Javorcik, B.S., Spatareanu, M., 2009. Liquidity constraints and firms’ linkages withmultinationals. World Bank Econ. Rev. 23, 323–346.
Jones, C.I., 2005. Growth and ideas. In: Aghion, P., Durlauf, S. (Eds.), Handbook ofEconomic Growth, vol. 1. Elsevier, pp. 1063–1111 (Chapter 16).
Jordaan, J.A., 2005. Determinants of FDI-induced externalities: new empiricalevidence for Mexican manufacturing industries. World Develop. 33, 2103–2118.
Keller, W., 1996. Absorptive capacity: on the creation and acquisition of technologyin development. J. Develop. Econ. 49, 199–227.
Keller, W., 2004. International technology diffusion. J. Econ. Liter. 42, 752–782.Kroszner, R.S., Laeven, L., Klingebiel, D., 2007. Banking crises, financial dependence,
and growth. J. Finan. Econ. 84, 187–228.Levine, R., 2005. Finance and growth: theory and evidence. In: Aghion, P., Durlauf, S.
(Eds.), Handbook of Economic Growth, vol. 1. Elsevier, pp. 865–934 (Chapter 12).Levinsohn, J., Petrin, A., 2003. Estimating production functions using inputs to
control for unobservables. Rev. Econ. Stud. 70, 317–341.Liu, Z., 2008. Foreign direct investment and technology spillovers: theory and
evidence. J. Develop. Econ. 85, 176–193.Manova, K., 2013. Credit constraints, heterogeneous firms, and international trade.
Rev. Econ. Stud. 80, 711–744.Mansfield, E., Romeo, A., 1980. Technology transfer to overseas subsidiaries by U.S.
based firms. Quart. J. Econ. 95, 737–750.Naughton, B., 1996. China’s emergence and prospects as a trading nation. Brookings
Papers Econ. Act. 27, 273–344.Navaretti, G.B., Venables, A.J., 2006. Multinational Firms in the World Economy.
Princeton University Press, Princeton, NJ.Polanyi, M., 1958. Personal Knowledge: Towards a Post-critical Philosophy.
University of Chicago Press, Chicago, IL.Prasad, E., Wei, S.-J., 2007. The Chinese approach to capital inflows: patterns and
possible explanations. In Capital Controls and Capital Flows in EmergingEconomies: Policies, Practices and Consequences. National Bureau of EconomicResearch, pp. 421–480.
Qian, Y., Xu, C., 1998. Innovation and bureaucracy under soft and hard budgetconstraints. Rev. Econ. Stud. 65, 151–164.
Rajan, R.G., Zingales, L., 1998. Financial dependence and growth. Am. Econ. Rev. 88,559–586.
Spence, M., 1984. Cost reduction, competition, and industry performance.Econometrica 52, 101–121.
Strebulaev, I.A., Whited, T.M., 2012. Dynamic Models and Structural Estimation inCorporate Finance. Manuscript, University of Rochester.
Sun, Q., Tong, W.H.S., Tong, J., 2002. How does government ownership affect firmperformance? Evidence from China’s privatization experience. J. Bus. Finan.Account. 29, 1–27.
Villegas-Sanchez, C., 2009. FDI Spillovers and the Role of Local Financial Markets:Evidence from Mexico. Manuscript, University of Houston.
Vives, X., 2008. Innovation and competitive pressure. J. Indust. Econ. 56, 419–469.Wang, J.-Y., Blomstrom, M., 1992. Foreign investment and technology transfer: a
simple model. Eur. Econ. Rev. 36, 137–155.Wei, Y., Liu, X., 2006. Productivity spillovers from R&D, exports and FDI in China’s
manufacturing sector. J. Int. Bus. Stud. 37, 544–557.Xu, C., 2011. The fundamental institutions of China’s reforms and development. J.
Econ. Liter. 49, 1076–1151.